
Abstract
The purpose of this study was to examine the effects of MoBeGo, a mobile self-monitoring app, on the initial and sustained academic engagement and disruptive behavior of third- to eighth-grade students with challenging behavior. Student–teacher pairs (N = 57) were randomly assigned to the treatment (MoBeGo) or control (business-as-usual) condition. We conducted systematic direct observation of students’ behavior throughout prebaseline, baseline, intervention, and postintervention conditions of the study. Multivariate multilevel models revealed differential improvement for the MoBeGo group in student outcomes (less disruptive behavior; more academic engagement) from baseline to intervention, as well as successful postintervention effects for disruptive behavior. Limitations, future directions, and implications for practice are discussed.
Challenging behavior in K–12 classrooms may be displayed by a range of students, including those with typical development and those with disabilities (e.g., emotional/behavioral disorders [EBD], learning disabilities, attention-deficit/hyperactivity disorder [ADHD]). Students with challenging classroom behaviors may appear inattentive and distracted during instructional activities or disruptive to themselves and others. When these behaviors are persistent and pervasive, students’ learning is likely impeded as instruction is constantly interrupted (Gage et al., 2018). Furthermore, students who are disengaged are more at risk of academic failure and dropout, particularly in the absence of early intervention (Sprague & Walker, 2000). To this end, self-monitoring interventions have been recommended for helping students learn to regulate their behavior (Briesch et al., 2019). Self-monitoring is the act of students thinking about their behavior and then recording data about the extent to which the behavior occurred (Briesch et al., 2019). Traditionally, self-monitoring has been done using a simple piece of paper and pencil along with a cueing device (e.g., kitchen timer), but recent technological developments have allowed students to use mobile apps to prompt and record their behaviors (Bruhn & Wills, 2018). Theoretically, as students become more aware and intentional about exercising control over their own behavior, this type of self-assessment and self-recording should lead to behavioral change (Bandura, 1991).
Although self-monitoring alone may result in improved behavior (Briesch & Briesch, 2016), recent systematic reviews have shown these interventions are often multifaceted. That is, they are frequently packaged interventions, which include additional components such as prompting (Briesch et al., 2019), goal-setting (Bruhn, Gilmour, et al., 2022), graphing (Briesch et al., 2019; McDougall et al., 2017), feedback (Briesch et al., 2019; Bruhn et al., 2015; Bruhn, Gilmour, et al., 2022), and reinforcement (Briesch et al., 2019; Bruhn et al., 2015; Bruhn, Gilmour, et al., 2022; Sheffield & Waller, 2010). For example, in a review of 56 single-case design studies of self-monitoring in K–12 settings, Briesch et al. (2019) identified eight different self-monitoring configurations, with the most common ones being self-monitoring with prompting (N = 23), self-monitoring with reinforcement (N = 6), and self-monitoring with prompting and graphing (N = 5). In addition, 23 studies involved students completing procedures independently but later receiving adult feedback about their performance. In a related review of 87 single-case design studies, Bruhn, Gilmour, et al. (2022) found self-monitoring interventions with shorter interval lengths (i.e., the time between self-monitoring instances) and the inclusion of goal-setting, reinforcement, and feedback produced significantly greater effects on academic engagement (AE) than interventions with longer interval lengths or exclusion of these components. In studies of disruptive behavior (DB), self-monitoring interventions that included feedback or reinforcement resulted in significantly greater decreases in DB. Collectively, these reviews support the use of multicomponent self-monitoring interventions that include reinforcement or feedback. Both reviews, however, included only single-case designs and neither examined posttreatment effects (e.g., maintenance). Although Briesch et al. (2019) did not formally code for maintenance effects, they noted anecdotally that only a handful of studies assessed maintenance. Similarly, Bruhn, Gilmour, et al. (2022) analyzed only initial intervention effects by comparing adjacent A-B conditions; thus, it is unknown whether the observed effects sustained over time. Understanding whether and how self-monitoring interventions result in continuous improvements in behavior is important because persistent problem behaviors can lead to substantial difficulties later in life (Wakschlag et al., 2017).
Researchers have suggested increasing interval lengths, reducing the number of self-monitoring instances, increasing behavioral goals, and reducing the frequency of feedback and reinforcement to systematically fade self-monitoring interventions (Estrapala et al., 2018). Although there is not one definitive way to adapt self-monitoring interventions to promote sustained improvements once intervention is withdrawn, one study of a technology-based self-monitoring intervention examined this issue (Bruhn, Rila, et al., 2020). In this study, third- to sixth-grade teachers were trained on how to use data collected within the SCORE IT app to determine whether a student was responding positively to the intervention. Every 3 to 5 days, they visually analyzed automated graphs within the app and decided whether to make gradual changes to the goals or interval lengths. After initial significant increases in positive behaviors, adaptations resulted in only further minimal increases. But importantly, positive behaviors sustained when teachers made adaptations. Authors found raising goals incrementally based on data was marginally more effective than increasing interval lengths (Bruhn, Rila, et al., 2020). However, this study included only 13 participants—each in their own single-case experimental design.
Technology-based self-monitoring like SCORE IT is relatively new in the field of education, at least when compared with the fields of medicine and health care in which self-monitoring apps have been used to support weight loss (Turner-McGrievy et al., 2013), diabetes management (Levine et al., 2016), and physical activity (Cadmus-Bertram et al., 2015). Researchers and health care practitioners have indicated self-monitoring apps enable users to be prompted, receive real-time feedback, track progress, adhere to treatment, and achieve and adjust goals (Turner-McGrievy et al., 2013). In education, some progress has been made from early uses of technology-based self-monitoring involving palm pilots (Gulchak, 2008), cell phones with the Twitter app (Bedesem, 2012), and student response systems (Szwed & Bouck, 2013) to more recent development of mobile applications (apps) such as SCORE IT and I-Connect (Wills & Mason, 2014) designed specifically to allow students and teachers to record data in real time and have data graphed and stored for analysis. Single-case studies on the effects of self-monitoring apps have shown increases in students’ overall positive behavior (Bruhn, Rila et al., 2020) and academic engagement (Bruhn et al., 2017; Rosenbloom et al., 2019; Wills & Mason, 2014), as well as reduced problem behaviors (e.g., disruption, stereotypy; Bruhn et al., 2017; Crutchfield et al., 2015). Yet, in a recent quality indicator review of behavioral interventions using digital technology (e.g., computers, tablets, smart phones, and interactive whiteboards) to reduce problem behavior, Kirkpatrick et al. (2020) identified three single-case studies of SCORE IT and five single-case studies of I-Connect and they were tepid about recommending these apps for decreasing problem behaviors due to a lack of convincing evidence. They recommended additional methodologically rigorous research for better understanding the potential effects of self-monitoring apps on behavior.
Purpose
To address the need for a rigorous experimental evaluation of technology-based self-monitoring interventions, we conducted a multisite randomized control trial to examine the effects of a technology-based self-monitoring intervention (Monitoring Behavior on the Go [MoBeGo]) on the AE and DB of third- to eighth-grade students with challenging behavior. MoBeGo is a multicomponent self-monitoring app that has automated, data-based decision rules that gradually adjust students’ behavioral goals over time as a method for promoting prolonged improvements in behavior. Essentially, this is an “expert system” that provides guidance on intervention adaptations based on student response, thus making it different from other self-monitoring apps that collect and graph data, but do not have automated, data-driven intervention recommendations.
Our primary interest was determining whether MoBeGo resulted in improved behaviors from the baseline condition to the intervention condition above and beyond any such improvements in the control group and, if so, whether those improvements continued in the postintervention condition. The main research question was, “Is there significantly greater improvement in the treatment group (MoBeGo) relative to the control group in students’ AE and DB from baseline to intervention and from baseline to postintervention?”
Method
Two universities’ institutional review boards approved this study. Participating teachers and parents provided consent, and students provided assent. This study occurred across two school years and followed the same procedures each year.
Setting and Participants
Study procedures took place in 57 third- to eighth-grade classrooms located in 18 elementary schools and seven middle schools in three total districts (i.e., one suburban, one rural, one urban) across one Midwest and one Southern state. General and special education (e.g., resource) classrooms were included if (a) teachers were delivering core academic content (e.g., reading, math, science) and (b) teachers indicated there were students with behavior problems in the class. The classroom setting varied by teacher–student pair; teachers selected the one class period or content area during which their participating student’s behavior was the most problematic.
Following a recruitment presentation, third- to eighth-grade general and special education core teachers who were interested in participating met with a member of the research team at predetermined times to discuss the study, provide informed consent, and nominate up to three students with problem behavior for participation in the study. However, only one student per teacher within a classroom was eligible to participate. The teacher sent consent forms home to parents. If multiple parents provided consent, each student was screened for eligibility. If multiple students met eligibility criteria, the teacher selected only one for participation.
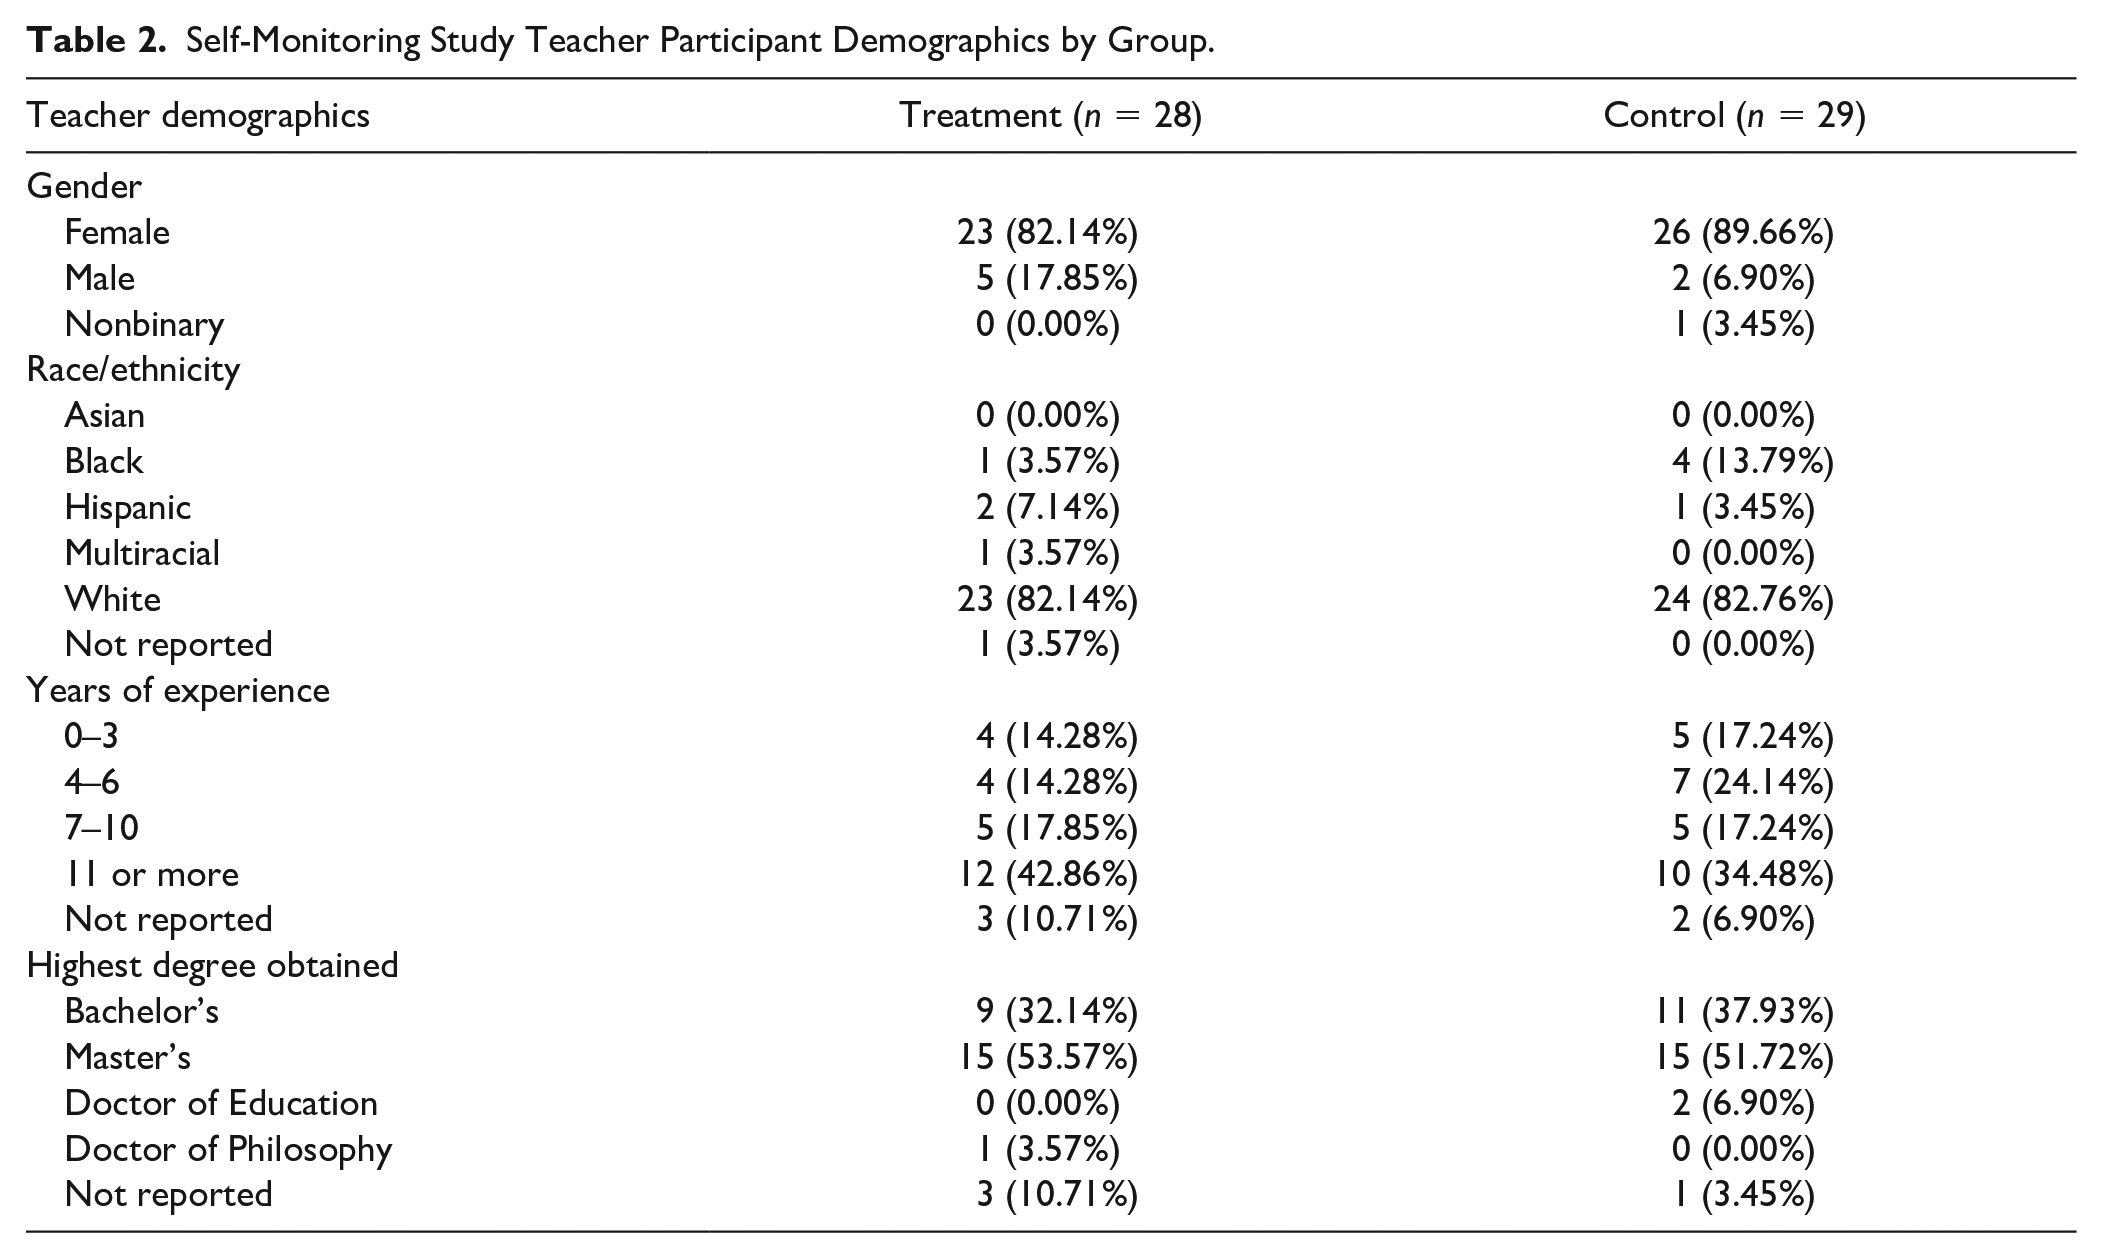
To be eligible for participation, third- to eighth-grade students had to (a) be nominated by their participating teacher due to perceived problem behavior, (b) receive parental consent to participate, (c) assent to participate, (d) score in the borderline or abnormal range on the hyperactivity/inattention (borderline = 6, abnormal = 7–10) or conduct problems (borderline = 3, abnormal = 4–10) subscales of the Strengths and Difficulties Questionnaire (SDQ; Goodman, 2001), and (e) average 65% or less academic engaged time across three systematic direct observations. A total of 57 students participated: 29 in the control group and 28 in the MoBeGo treatment group (see Tables 1 and 2 for student and teacher demographics, respectively). We observed all students in prebaseline, baseline, and intervention conditions, whereas only 27 control and 20 treatment students were observed in the postintervention condition due to COVID-19-related school closures occurring in Spring 2020.
Self-Monitoring Study Student Participant Demographics by Group.
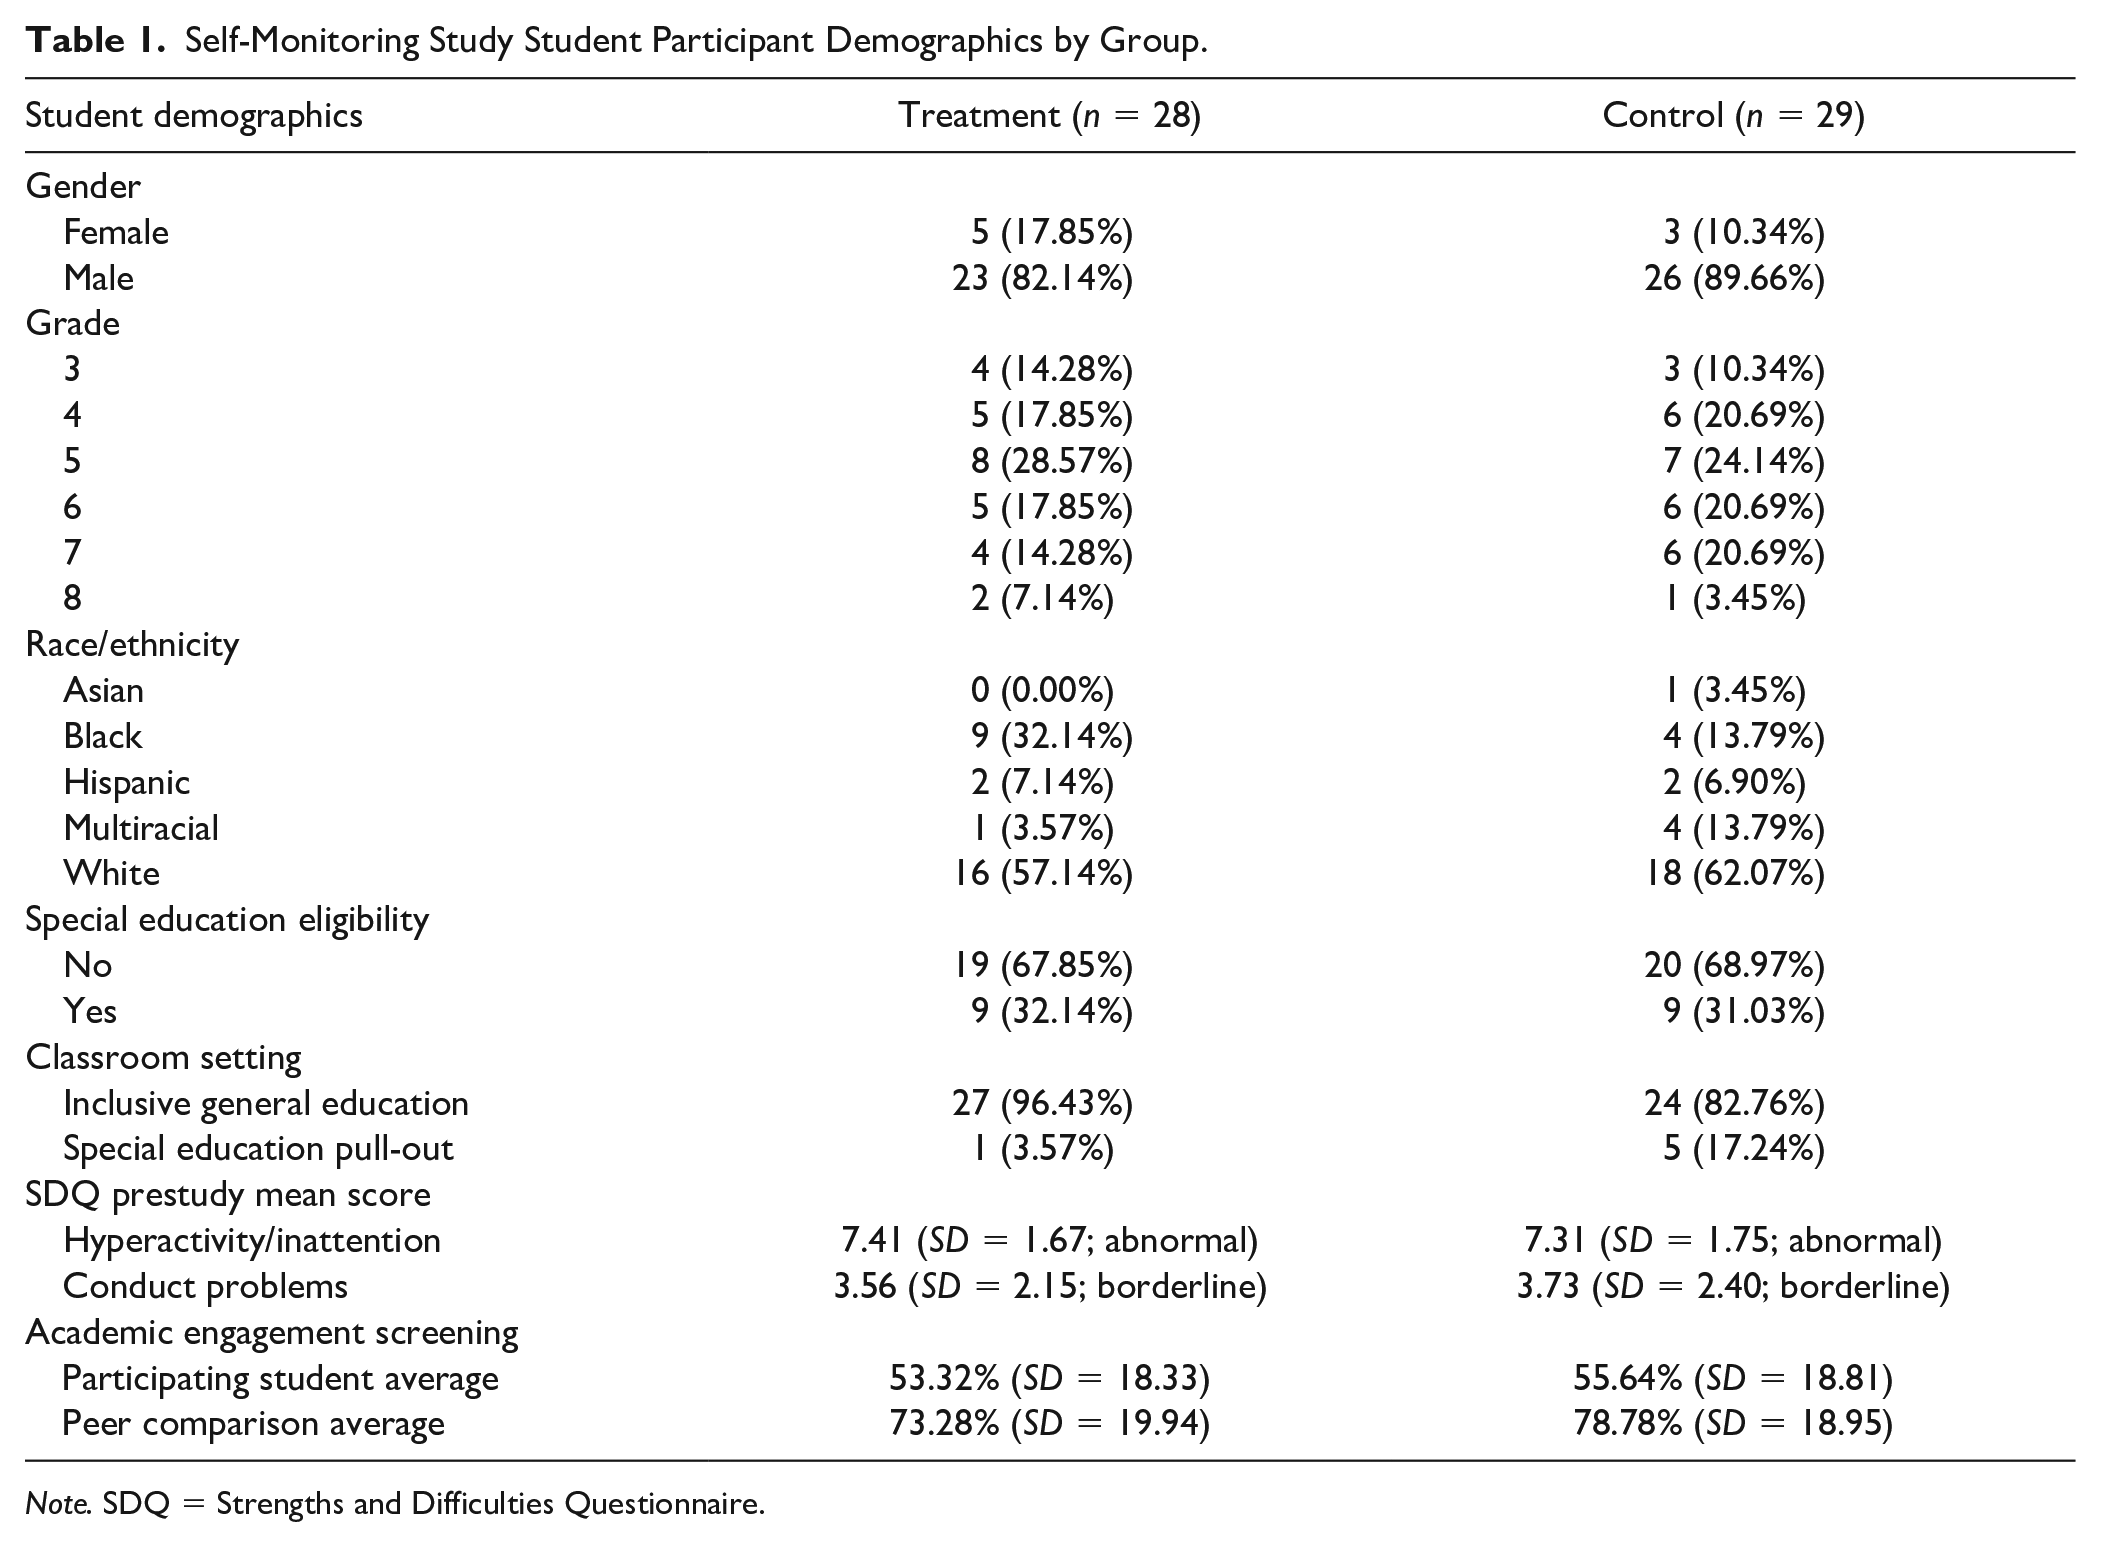
Note. SDQ = Strengths and Difficulties Questionnaire.
Self-Monitoring Study Teacher Participant Demographics by Group.
Screening Measures
The SDQ, which is validated for ages 2 to 18+ years, is a 25-item rating scale used to assess teachers’ perceptions of students’ social, emotional, and behavioral tendencies across five domains: hyperactivity/inattention, peer problems, emotional symptoms, conduct problems, and prosocial behavior. Each domain consists of five items to yield a score in the normal, borderline, or abnormal range. Item-level missing data were addressed per domain by calculating each student’s mean across their available item response and then multiplying by the number of items per domain. This was done so that the results could be reported in the traditionally used 0 to 10 sum metric instead of a 0 to 2 average metric, but any missing item responses would not cause downward bias. The SDQ has demonstrated adequate predictive validity, internal consistency, interrater reliability, and retest stability (Goodman, 2001) as well as high correlations with the Child Behavior Checklist (Achenbach, 1991). After receiving parental consent, teachers rated their nominated student on the SDQ (see Table 1).
If a student met criteria on the SDQ, we conducted three 15-min systematic direct observations of the nominated student’s and three other randomly selected students’ AE using a round-robin, 5-s momentary time sampling procedure. Every 5 s, we recorded whether the target student was academically engaged. Only one student was observed at a time and this proceeded in a round-robin fashion such that each student was observed 45 times during a 15-min observation. The reason we included three randomly selected students was to gauge how the nominated students’ behavior compared with that of other students in the classroom. See Table 1 for average engagement for the participating student and the peer comparison average.
We defined AE as the student participating in the assigned academic task. Examples included—but were not limited to—working on assignments (e.g., worksheets), reading assigned materials, having eyes focused on the speaker, or engaging with peers during group work. Nonexamples included—but were not limited to—working on unassigned work, head resting on the desk, staring (e.g., out window or at ceiling), and talking about things other than the assigned task. We trained on observation screening procedures by practicing in live classrooms until we reached 90% interobserver agreement (IOA) in two consecutive practice sessions. We collected IOA on 45% of real screening sessions and calculated IOA using the point-by-point method (i.e., number of intervals with agreement divided by total number of intervals). The IOA was 95.15% for AE screening (range = 85%–100%).
Dependent Variables
During all subsequent conditions, we collected systematic direct observational data on two primary dependent measures, AE and DB, using the software application Multiple Option Observation System for Experimental Studies (MOOSES; Tapp et al., 1995) on a Microsoft Surface Pro tablet. We observed student–teacher pairs multiple times for 15 min within each study condition, which included prebaseline, baseline, intervention, and postintervention. Our goal was to conduct three observations during prebaseline, five observations during baseline, five observations during intervention, and five observations during postintervention for all participants in treatment and control groups (see “Conditions and Randomization” section). Any time a student or teacher was absent, observations were rescheduled and completed another time. However, due to the COVID-19 pandemic resulting in school closures, we were unable to complete some intervention and postintervention observations in the last year of the study. Specifically, one control student and five treatment students had fewer than five intervention condition observations (range =1–4); eight control students and 12 treatment students had fewer than five postintervention condition observations (range =0–4). No students were removed from the analysis due to missing (i.e., not completed) observations.
The operational definition of AE was the same one used for screening. However, we switched from time sampling procedures used in screening to duration recording, which allowed us to directly assess the impact on the target students. The AE was recorded as mutually exclusive (i.e., students were either engaged or disengaged, but never at the same time) and exhaustive (i.e., students were always either engaged or disengaged) in MOOSES. The AE data are reported as the percentage of time during the 15-min observation the student was engaged (e.g., 12 min of 15 min = 80% AE).
We defined DB as any action made by the student that interfered with participation and productive classroom activity for the student or the student’s peers. Examples included—but were not limited to—blurting out, talking out of turn, making inappropriate noises, or playing with materials inappropriately. Nonexamples included—but were not limited to—speaking when called upon, speaking with appropriate volume and tone, quietly reading to self, or talking to a peer with permission. Using frequency counts, we recorded each instance of a DB. The MOOSES time stamped each recording to document when it occurred within the session. If a student engaged in continuous DB (e.g., talking to a peer during silent reading), we coded one DB at the onset, and then coded a DB every 5 s thereafter until the DB ceased or the student displayed a new, topographically different DB. The DB data are reported as frequency counts.
AE and DB training and IOA
To become reliable on MOOSES, we first reviewed a codebook with operational definitions of dependent measures. Second, we took a coding quiz and earned 100% accuracy to move to the third phase. Next, we practiced using MOOSES for data collection and analysis using video recordings of classrooms. Once we felt comfortable using the tablet and MOOSES, we independently viewed and coded two 15-min videos. To pass this stage of training, we had to achieve at least 85% IOA across all dependent measures, for three consecutive trials, for both videos. The IOA was measured against a “master” code file. Finally, we (i.e., all data collectors from both sites) met in person to practice in live classrooms. To be deemed reliable, we had to achieve 85% on all measures for two consecutive practice sessions.
For AE, MOOSES calculated IOA using second-by-second agreement: If the primary and secondary observer were within one second of each other, then it was an agreement. The number of agreements were divided by the total number of agreements plus disagreements and then multiplied by 100. For DB, MOOSES calculated IOA using a 5-s window of agreement: An agreement was counted if the secondary observer recorded a DB within 5 s of the primary observer. A disagreement was counted if the recording was outside the 5-s window or if one observer recorded a behavior and the other one did not (within the 5-s window). Across all phases, we collected IOA on 24% of observation sessions (i.e., 237 of 984). The IOA for AE was 96.79% and for DB was 92.84%.
Conditions and Randomization
The study consisted of four conditions for both the treatment and control groups: prebaseline, baseline, intervention, and postintervention. Prebaseline consisted of regular classroom practices and lasted approximately three consecutive days. The purpose of this condition was to acclimate students and teachers to RAs being in the classroom, thus potentially mitigating any reactivity that may occur due to outside observers. Baseline also consisted of regular classroom practices and lasted another 5 days, which typically occurred consecutively within 1 week, although that was not always possible and may have occurred over 2 weeks. The only change to the classroom during the baseline condition occurred in the treatment group, which involved teachers collecting baseline data using the MoBeGo app (see Treatment description). During the intervention condition, the treatment group implemented MoBeGo self-monitoring daily while the control group continued with business as usual (BAU). This condition lasted an average of four school weeks and did not include extended school breaks (e.g., spring break), with data collection observation sessions spread out across the 4 weeks. In the postintervention condition, the treatment group teachers and students discontinued all use of MoBeGo and returned to regular classroom practices similar to those in the control group. The postintervention condition lasted for 2 weeks following the last intervention day.
We used block randomization to assign teacher–student pairs to the treatment or control groups. As a teacher–student pair met eligibility criteria, they were matched to another pair at the same grade level. If a same-grade-level pair was not available, then the pair was matched to another pair that was one grade level above or below (e.g., fifth grade matched to fourth or sixth). One of the two pairs was designated as the primary pair, and then a coin was flipped. If the coin landed tails up, the primary pair was assigned to treatment and the secondary pair was assigned to control (and vice versa if the coin landed on heads). This process occurred on a rolling basis as participants entered the study at different times throughout the school year (i.e., depending on when consents were obtained and when screening procedures were completed), which sometimes resulted in same-grade-level pairs being unavailable and so mixed-grade-level pairs were matched (see above). However, each matched pair began and completed study procedures and entered different conditions at approximately the same time.
Treatment and Control Groups
Treatment: MoBeGo self-monitoring intervention app
In the treatment group, classroom practices (e.g., instruction, routines, procedures, and rules) remained the same as in the baseline condition. The only change was introduction of the MoBeGo self-monitoring intervention, used on one iPad per teacher–student pair (see Figure 1 for screenshots). MoBeGo is a multicomponent app developed iteratively by the authors through a development and innovation grant funded by the Institute of Education Sciences. It has parallel teacher and student components in which each independently rates the student’s behavior on a fixed interval schedule (e.g., every 5 min) for the duration of the session (e.g., class period and instructional activity). Up to five behaviors could be rated at a time, although all participants selected no more than three behaviors to rate (see Figure 1A). Retrospective ratings were done on a 0 to 4 scale (0 = never, 1 = a little, 2 = sometimes, 3 = a lot, 4 = always) and reflected the user’s perceptions of the student’s behavior occurring between the previous interval and the current interval (Bruhn & Wills, 2018).
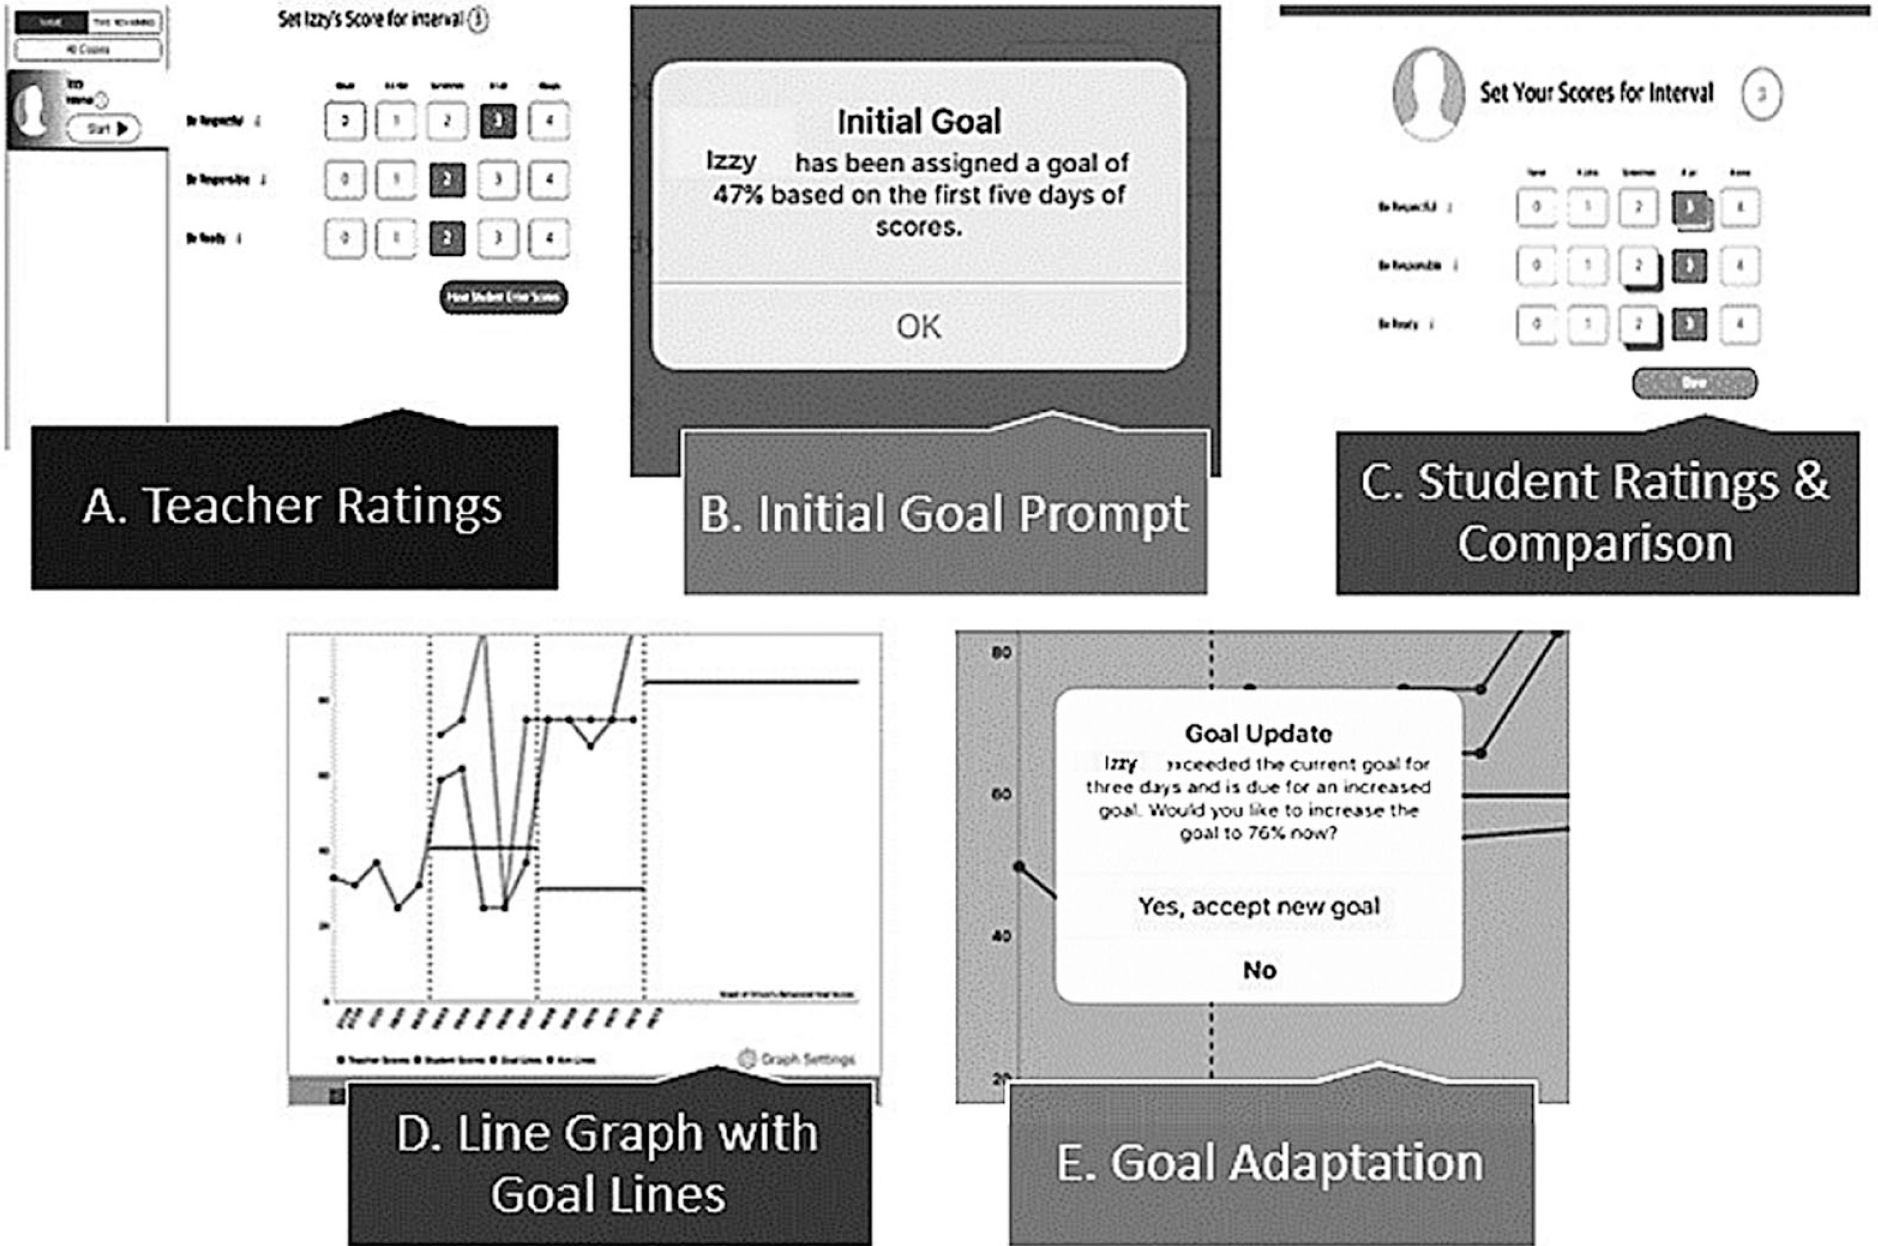
MoBeGo screenshots: (A) Teacher ratings, (B) initial goal prompt, (C) student ratings & comparison, (D) line graph with goal lines, (E) goal adaptation.
To begin using MoBeGo, the teacher first had to collect 5 days of ratings, which occurred during the baseline condition as described previously. Specifically, the teacher used MoBeGo covertly to rate the participating student’s behavior. This was done to establish a baseline level of behavior that the app used to automatically calculate an initial goal percentage (i.e., 10 percentage points above the baseline Mdn) for the student to achieve while self-monitoring during the intervention condition. In this way, each student who used MoBeGo had their own individualized intervention goal based on baseline levels of behavior. To begin a session, the teacher tapped the start button in the app to activate the preprogrammed interval timer. At the end of the interval, the iPad delivered an audio (i.e., ding) and visual (i.e., pop-up window) notification that it was time to rate the student’s behavior. The teacher rated the student’s behavior(s) by tapping on 0, 1, 2, 3, or 4 next to each listed behavior and then selected “done,” which closed the teacher screen and began the next interval (see Figure 1A). This continued until the teacher selected “end session” (generally, the end of the class period or instructional activity). At this point, the app automatically calculated and graphed an aggregate percentage of positive behavior by summing the total number of points earned for all behaviors, dividing by the total points possible, and multiplying by 100.
After the teacher rated behavior for 5 days during baseline, the app displayed an initial goal for the student to achieve once the student began self-monitoring in the intervention condition (see Figure 1B). The algorithm in the app calculated the goal based on baseline teacher ratings. Intervention sessions began and proceeded in the same way, except that prior to starting the interval, the teacher provided the student with a “precorrection” reminding students they would be self-monitoring positive behaviors and trying to reach their percentage goal (e.g., 70%). Then, the teacher started the interval and rated the student’s behavior when prompted. Unlike in the baseline condition, after the teacher pressed “done,” the app closed the teacher screen and then displayed the student self-monitoring screen. The teacher handed the iPad to the student who then completed self-monitoring procedures independently by self-reflecting on behavior during that interval and tapping on a rating for each behavior. The student then selected “see teacher scores” icon to see a side-by-side comparison of ratings for that interval (see Figure 1C). After the student compared ratings, teachers had the option to deliver brief, behavior-specific feedback to the student about behavior during that interval, and then the next interval began once “done” was pressed. This process continued through the duration of the session, after which the teacher selected the “end session” button. At this time, together the teacher and student viewed a line graph of teacher and student ratings in the app (see Figure 1D). Previous research has indicated high correlations between teachers’ and students’ ratings of students’ behavior using this app (r = .91; Bruhn et al., 2021). A horizontal red line on the graph representing the app-generated goal percentage (based on teachers’ ratings) provided a touchstone for the teacher to provide the student feedback about whether the student met the goal that day. While all teachers reviewed the graph and provided feedback at the end of the session, 15 of 28 teachers also elected to provide contingent reinforcement (e.g., ticket, note or email home to parents, extra reading time) to the student for meeting the goal (Briesch et al., 2019; Bruhn et al., 2015; Bruhn, Gilmour, et al., 2022; Sheffield & Waller, 2010). Throughout the intervention phase, the app’s data-based algorithm notified teachers and students that the student’s goal should be increased or decreased (see Figure 1E). Teachers had the option to accept the new goal percentage or to continue with the current goal until notified again. The slow and systematic automated increase in goals was used to maintain improvements in behavior, while conversely, decreases in goals were used to increase the likelihood of student success.
Training and coaching
Both project sites utilized the same procedures, protocols, and scripts to train teachers and students in the treatment group prior to them using MoBeGo in the classroom. We collected data on fidelity to training procedures in 54% of teacher training sessions and 46% of student training sessions using an 86-item and 19-item checklist, respectively. Mean fidelity to teacher training was 97.3% and to student training was 99.6%.
Teachers
We trained teachers individually to use MoBeGo before/after school or during their prep period across 1 or 2 days, totaling about 2 hr of training. Training consisted of (a) an overview of MoBeGo; (b) defining target and replacement behaviors; (c) determining the replacement behavior/s for the student to self-monitor, interval length, feedback frequency (i.e., at the end of the session, or after every interval plus the end of the session), and contingent reinforcement; (d) programming the iPad; and (e) practicing intervention procedures such as rating student behavior, providing corrective and affirmative praise, and reviewing student goals, graphs, and performance. Teachers selected the behaviors to be monitored from a list of 10 default behaviors in the app (e.g., Be On-Task, Be Respectful), or they had the option of creating a new behavior. We worked with teachers to select, name, and define behaviors for monitoring that would help students be more successful during academic instruction. Overall, teachers selected one to four student replacement behaviors (1 behavior = 3 teachers, 2 behaviors = 4 teachers, 3 behaviors = 15 teachers, 4 behaviors = 6 teachers). Teachers also selected all intervention components (i.e., interval length, feedback frequency, and contingent reinforcement). While providing precorrections, viewing the graph together, and the teacher providing feedback to the student at the end of the session were required treatment components, optional components included brief feedback after every interval and contingent reinforcement (e.g., a token for meeting the daily goal). After teachers had practiced using the app competently and had all their questions answered, the training session ended.
Students
We also trained students individually to use MoBeGo and to learn the benefits of self-monitoring. Student training lasted 30 min and took place in a quiet location (e.g., conference room). We operationally defined each behavior the student was expected to self-monitor, asked the student to repeat the definitions in their own words, role-played examples and nonexamples of each behavior, and practiced self-monitoring with MoBeGo until students were 100% proficient. The training session ended when all students’ questions were answered.
Coaching
Once the student entered the intervention condition, we (i.e., one member of the project team) provided in vivo (i.e., in the classroom during intervention) coaching to the teacher and student dyad for the first 2 days of intervention. We measured coaching fidelity in 57% of sessions using a 14-item checklist. Fidelity to coaching procedures was 99.6%. The first day consisted of modeling the teacher-delivered precorrection to the student, rating the first several intervals with the teacher and student, providing feedback to the student, and reviewing the student’s performance at the end of the intervention session with the teacher and student. Once the teacher reported feeling comfortable with the intervention procedures, she or he took over rating the student’s behavior independently.
Control: BAU
The control group consisted of “business as usual”; no additional supports or services were introduced into the classroom. Teachers proceeded with classroom instruction in core content areas (e.g., reading, math, science, and social studies) as usual. The only difference from BAU was the presence of external observers (i.e., the research project staff).
Treatment Fidelity
Across all observations, groups (treatment and control), and three conditions (baseline, intervention, and postintervention), we collected treatment fidelity data on MoBeGo intervention procedures to determine whether (a) there was any treatment contamination during any condition in the control group, despite teachers and students not having access to the intervention (i.e., iPad with MoBeGo app), (b) teachers in the treatment group were covertly rating their student’s behavior (e.g., no precorrection, no feedback, no reinforcement, and no delivery to student for rating or viewing) during the baseline condition, (c) the intervention was being implemented with fidelity in the treatment group during the intervention condition, and (d) the intervention was completely withdrawn in the treatment group in the postintervention condition.
During all observations in baseline, intervention, and postintervention conditions, we measured treatment fidelity on a six-item checklist, with mandatory items including precorrection at the beginning of the session, teacher and student rating behavior, and end-of-session feedback; optional items included interval-level feedback and reinforcement. We checked “yes” when we observed the item, “no” when we did not, and “NA” when there was no opportunity to observe the item or the item was not required (e.g., if during training and intervention design, the teacher indicated no contingent reinforcement or interval-level feedback would be delivered). All observations across each condition lasted 15 min, except for one observation of the treatment group during the intervention condition, which lasted the entire length of the intervention session. The reason we included one longer observation session was to provide an opportunity to observe and assess whether feedback and reinforcement were delivered at the end of the intervention session (i.e., full intervention sessions often went the entire class period, which was longer than a 15-min observation session). We calculated total fidelity by totaling the number of “yes” responses, dividing by the total possible, and multiplying by 100. Treatment fidelity data by item, group, and condition are reported in Table 3. Importantly during intervention, fidelity to teacher ratings was 98.00% and fidelity to student ratings was 98.63%, with lower fidelity to precorrections (60.88%) and end-of-session feedback (69.82%). We collected IOA during 20% of all observations and it was 94.16%.
Treatment Fidelity for MoBeGo Intervention Procedures
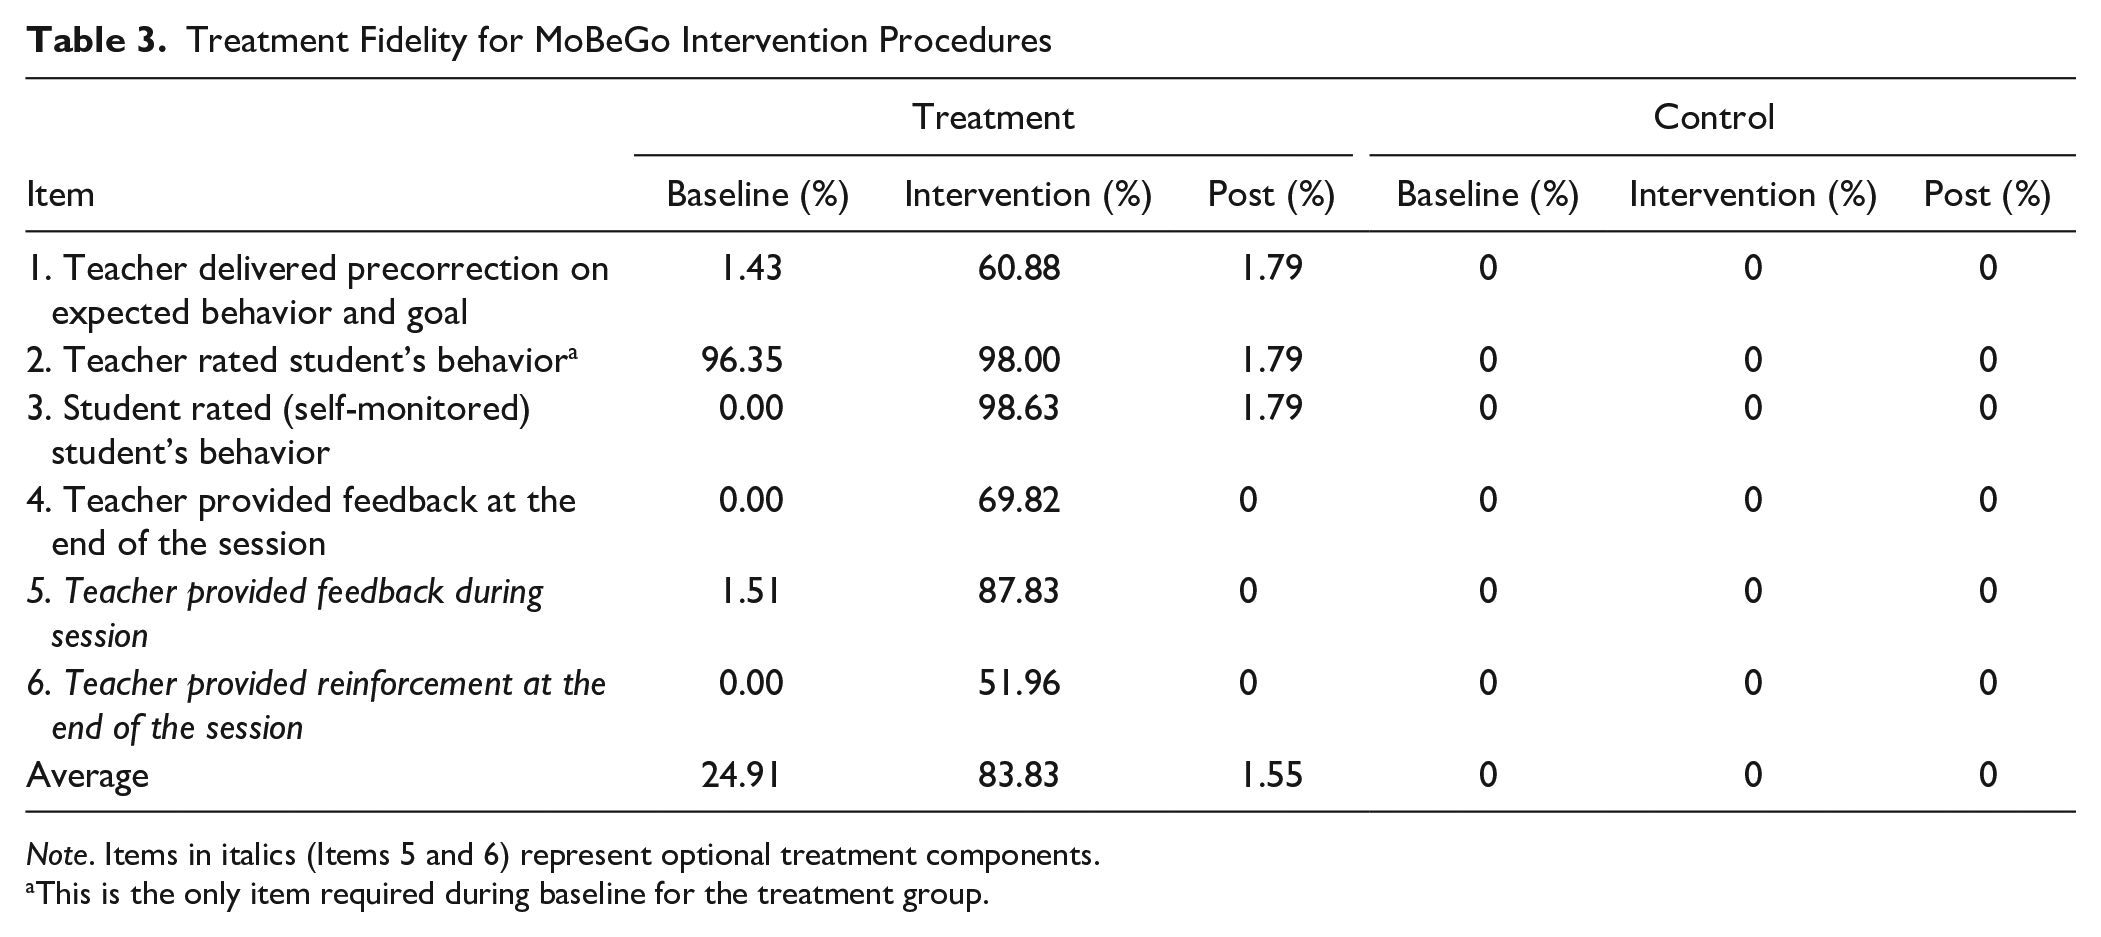
Note. Items in italics (Items 5 and 6) represent optional treatment components.
This is the only item required during baseline for the treatment group.
Social Validity
We collected formal and informal feedback on the social validity of the MoBeGo intervention from all teachers and students in the treatment group. Teachers completed Intervention Rating Profile–15 (IRP-15; Witt & Elliot, 1985b; Cronbach’s α = .98) after completing intervention training (but prior to implementation) and again during postintervention. The IRP-15 is a 15-item, 6-point rating scale in which teachers rate their agreement with statements like “I would recommend this intervention to other teachers.” Higher scores indicate higher social validity. Similarly, students completed an adapted version of the Children’s Intervention Rating Profile (CIRP; Witt & Elliot, 1985a; Cronbach’s α = .75–.89) before and after intervention. The adapted CIRP has five items (e.g., “This intervention is a fair way to help me”) and the same 6-point scale of agreement, with higher scores indicating higher social validity. On the postintervention form, teachers and students also had the option to respond to open-ended questions about what they liked, disliked, or would change about the intervention. We report descriptive data for the participants who completed the forms (as some did not complete them due to COVID-19 school closures).
Data Analytic Method
Our research questions regarding the effectiveness of MoBeGo in increasing AE and reducing DB were answered using planned contrasts within multivariate multilevel models (as described in Hoffman, 2015, ch. 9). More specifically, within each study condition (prebaseline, baseline, intervention, and postintervention), repeated observations at Level 1 were modeled as nested in students at Level 2 (i.e., a multilevel model is required for the multiple responses from each student within a single condition). The simultaneous prediction of responses from the four conditions to obtain tests of their differences required that conditions be modeled as multivariate outcomes within the same multilevel model. Similar to a traditional mixed-design analysis of variance, all models included fixed effects of group, condition, and their interaction; further details about model specification are provided in the online supplemental material S1. Given its imbalance across control and treatment groups (see Table 1), special education setting versus general education setting was examined as a covariate. It was nonsignificant with small effect sizes for both outcomes and was thus not included in the models reported. All models were estimated via residual maximum likelihood using Kenward–Roger denominator degrees of freedom in SAS MIXED, and ESTIMATE statements were used to create model-predicted means and all planned contrasts.
Separate analyses were conducted for each outcome (AE and DB). Given that AE was measured as a percentage, we predicted a logit-transformed version to ensure that predicted percentages remained within 0 and 100 and to stabilize its residual variance. Likewise, given that DB was measured as a count of events, we predicted a natural-log-transformed version to ensure predicted counts remained positive and to allow its residuals to follow a more plausible log-normal distribution. An alpha of .05 was used for all fixed effects; effect sizes in standardized mean difference units (Cohen’s d) were calculated from the t value and estimated denominator degrees of freedom for each effect. A post hoc power analysis was conducted using the model results as population parameters in generating 1,000 data replications to approximate empirical power rates, estimates for which are reported alongside the obtained effect sizes below.
Results
As hypothesized, a significant two-way interaction of group by condition was found for both AE, F(3, 48) = 6.52, p = .001 and DB, F(3, 46) = 2.94, p = .043. Results from these unconditional models for group-differences-by-condition, condition-differences-by-group, and group-by-condition interaction contrasts for each outcome in the model scale (log counts and logit percentages) are provided in Table 4 for AE and Table 5 for DB. The group-by-condition interaction for each outcome (as described below) is also illustrated in Figure 2 (after translating the model-predicted means back into the original data scale of raw counts and percentages).
Research Question 1 Model Results for Academic Engagement.
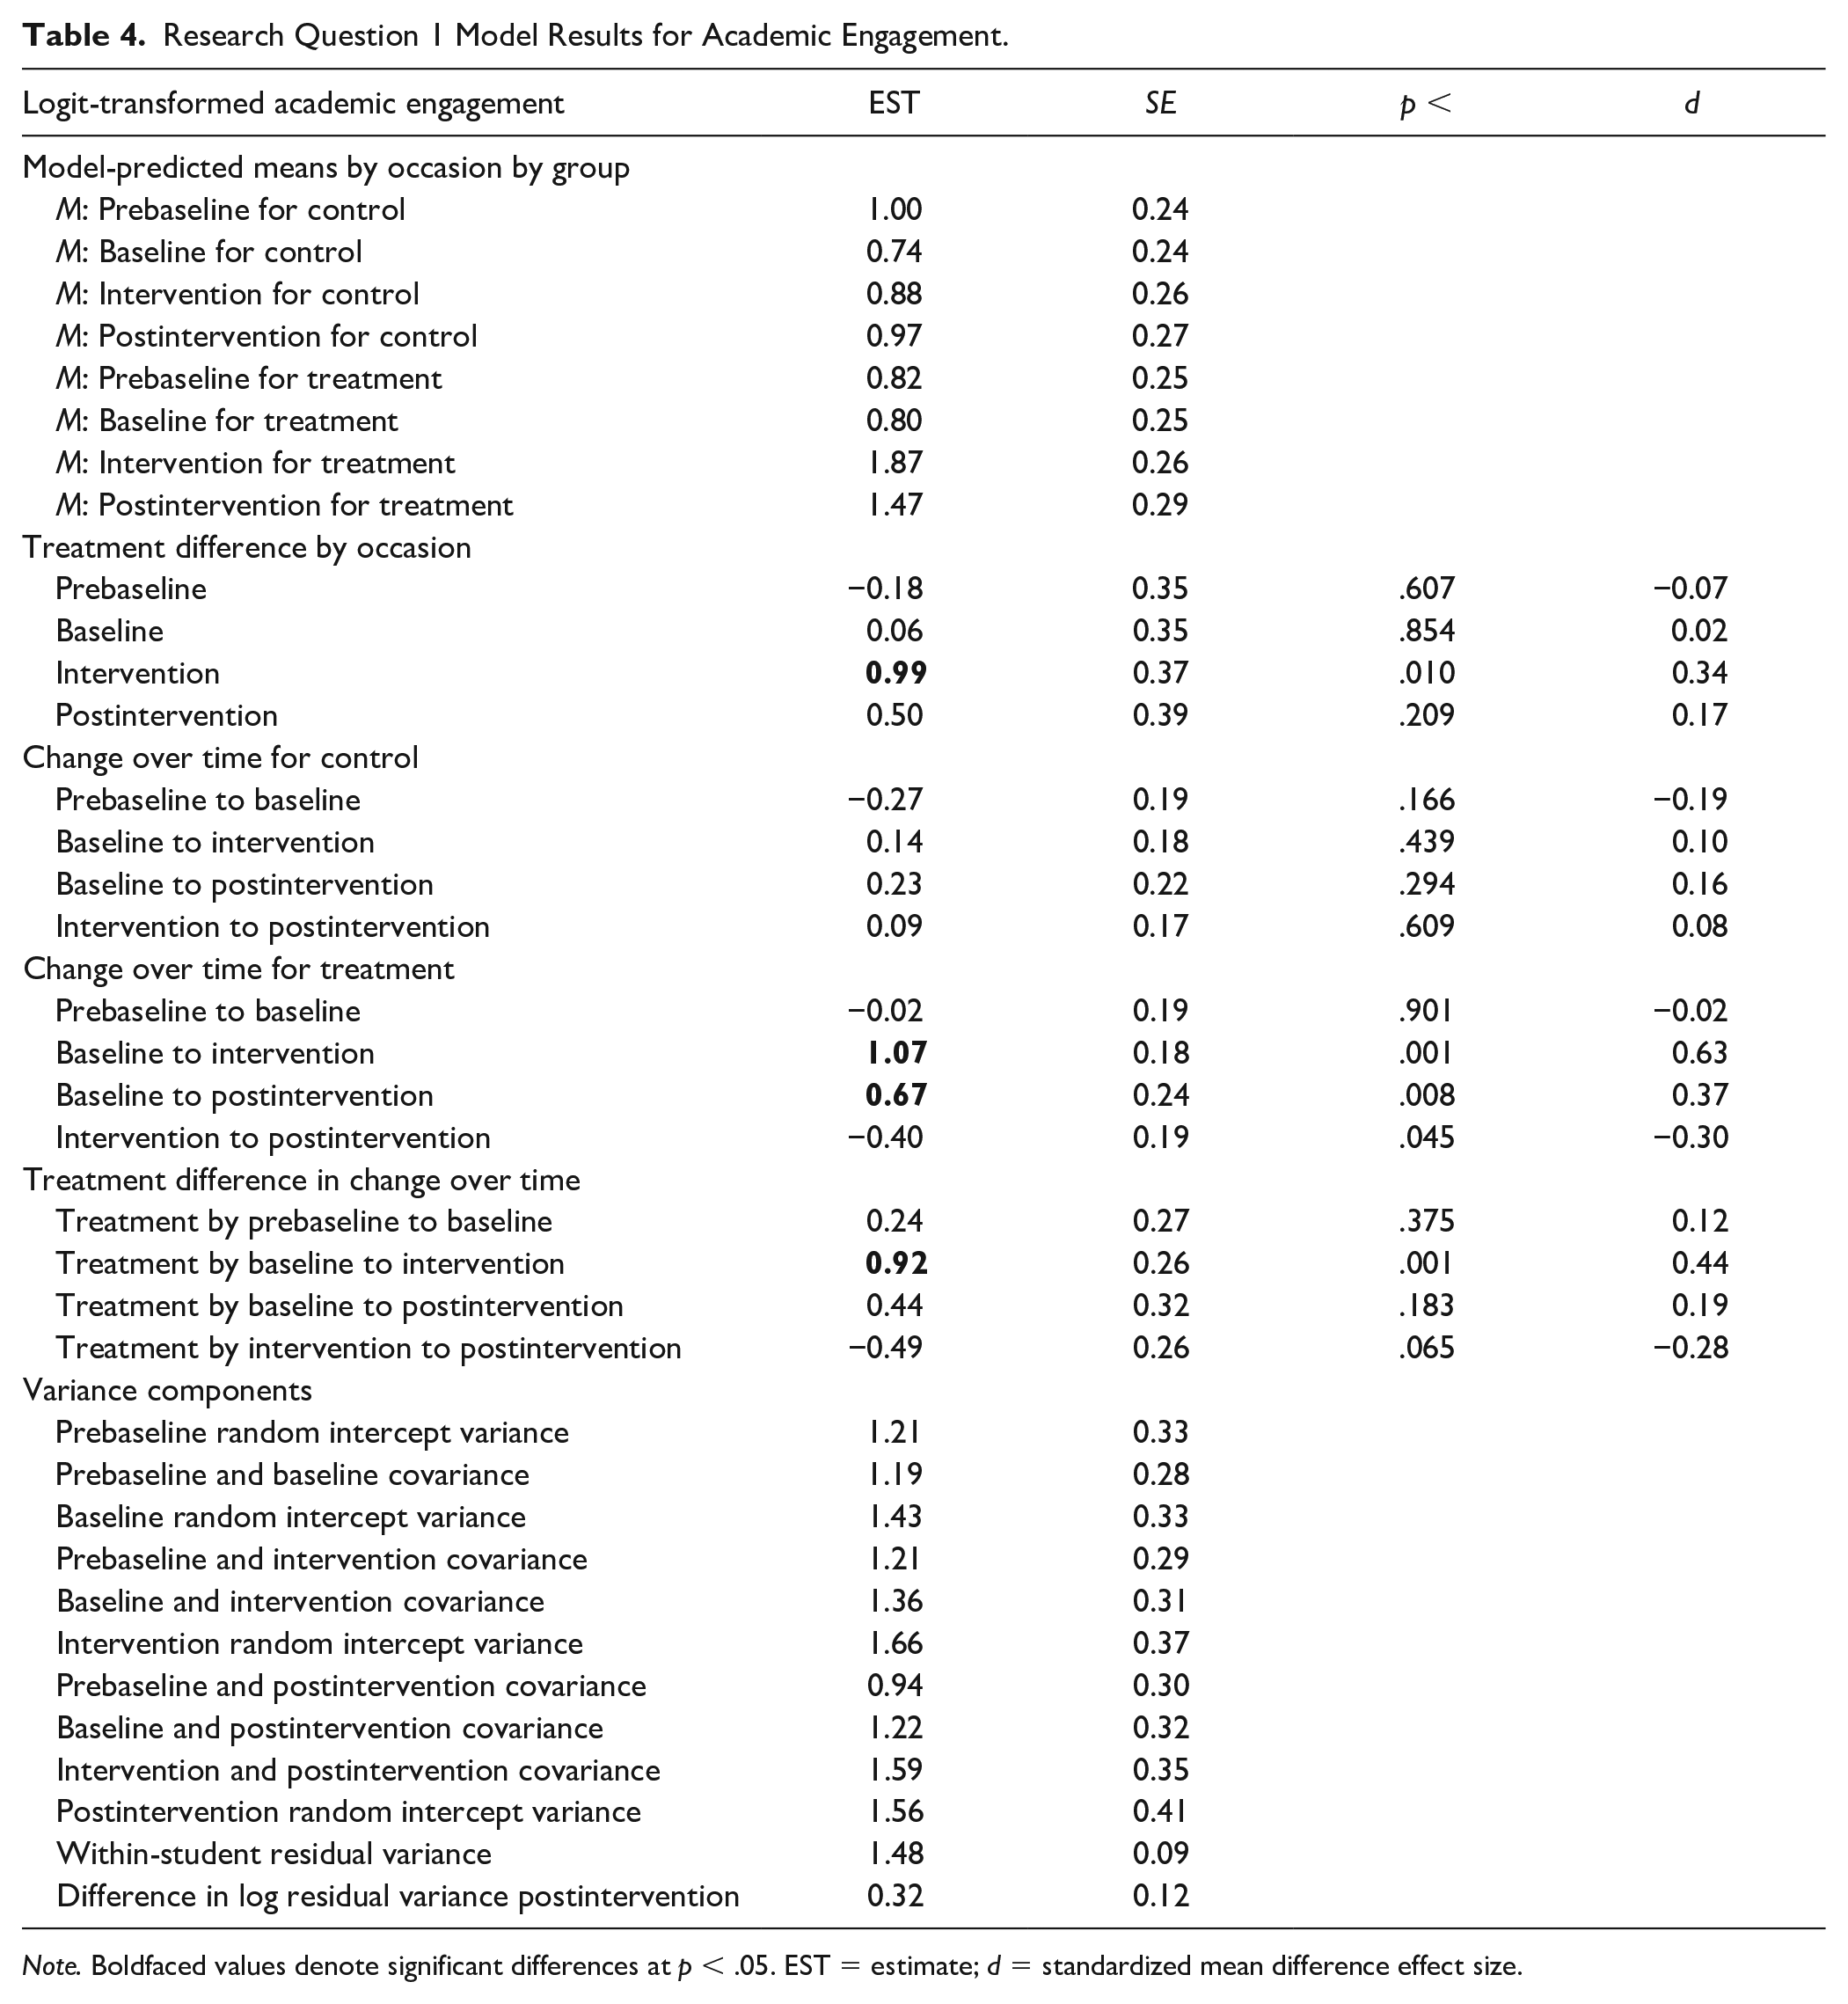
Note. Boldfaced values denote significant differences at p < .05. EST = estimate; d = standardized mean difference effect size.
Research Question 1 Model Results for Disruptive Behavior.

Note. Boldfaced values denote significant differences at p < .05. EST = estimate; d = standardized mean difference effect size.
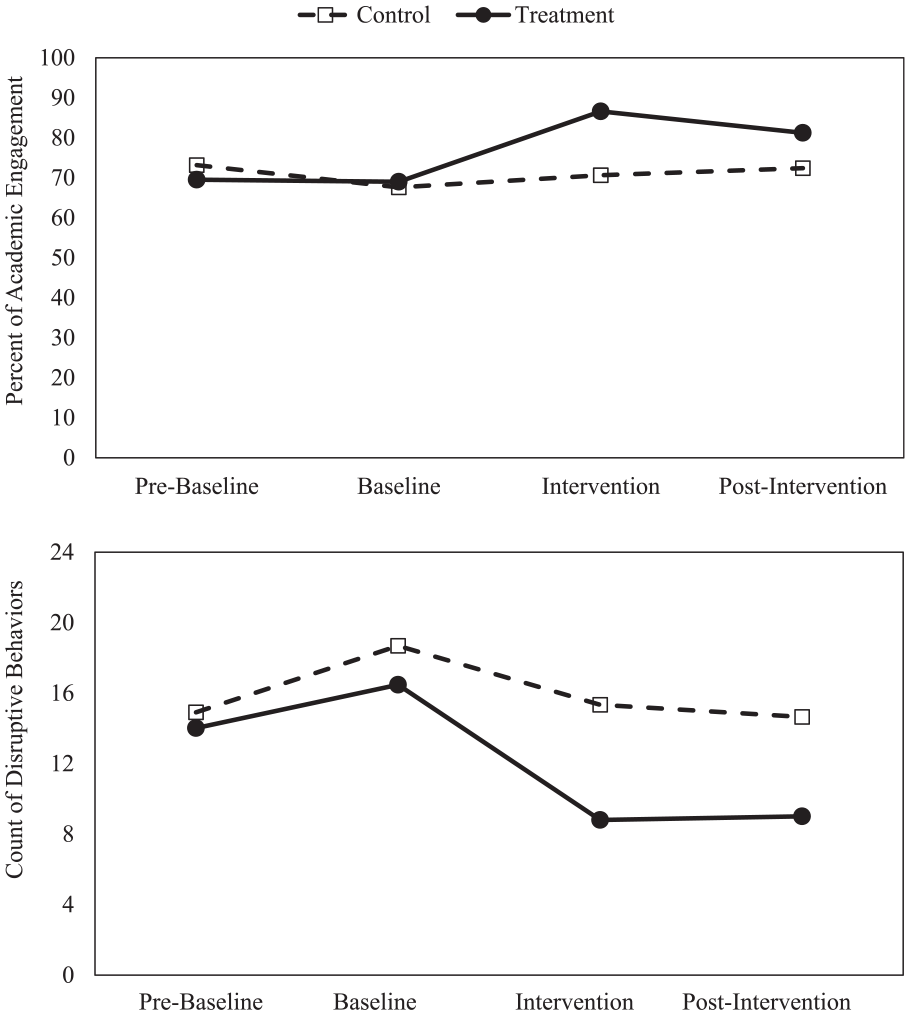
Effectiveness of MoBeGo intervention for academic engagement and disruptive behavior.
As expected, no change or group differences in change from prebaseline to baseline were found for either outcome. As shown in the top panel of Figure 2, AE increased significantly more in the treatment than control group from baseline to intervention (p = .001, d = 0.44, power = .95), but not from baseline to postintervention (p = .183, d = 0.19, power = .31). The treatment group declined significantly in AE from intervention to postintervention (p = .045, d = −0.30, power = .62), indicating initial intervention effects in AE were not maintained.
As shown in the bottom panel of Figure 2, DB decreased significantly more in the treatment than control group from baseline to intervention (p = .011, d = −0.35, power = .74) and marginally more from baseline to postintervention (p = .052, d = −0.28, power = .54), indicating a successful intervention effect. The change in DB from intervention to postintervention did not differ by group and was not significant within the treatment group, indicating maintenance of the intervention effect.
Social Validity
Teachers’ average score on the IRP-15 was 77.50 out of 90 prior to intervention and 78.40 out of 90 after intervention, indicating teachers perceived MoBeGo favorably before and after using it. Teachers most frequently commented that MoBeGo was quick and easy to use; they liked having the data and graphs to track progress and provide feedback as well as automated goal changes; it built awareness and self-reflection for students about how to change their behavior; and their students liked being able to rate themselves and view their graphed data. To improve MoBeGo, a couple of teachers recommended rating behavior less frequently (i.e., using intervals longer than 5–10 min) and making the app accessible on other devices (e.g., Chromebook). Students’ average score on the adapted CIRP was 25.05 out of 30 before intervention and 25.36 out of 30 after intervention. This indicates students’ initially rated MoBeGo favorably and those favorable perceptions maintained after using the app. Many students commented that MoBeGo helped them focus better, and they enjoyed rating themselves and seeing their progress. When asked what they disliked or would change, there were very few comments, with the most common one indicating a desire for a different ring tone to prompt self-monitoring.
Discussion
We designed this study to assess the initial and sustained impact of MoBeGo, a technology-based self-monitoring intervention app, on the behaviors of third- to eighth-grade students with persistent behavior problems in the classroom. This study adds value to the research base by addressing a relatively understudied issue related to postintervention effects while also (a) using a novel self-monitoring app with automated, data-based goal adaptations and (b) addressing the call for more rigorous research on such interventions (Briesch et al., 2019; Bruhn, Gilmour, et al., 2022; Kirkpatrick et al., 2020).
Key Findings and Implications for Practice
First, students in the MoBeGo treatment group significantly increased AE and decreased DB from the baseline condition to the intervention condition and they did so to a significantly greater extent than the control group. These positive results are consistent with previous studies of technology-based self-monitoring interventions (e.g., Bruhn, Rila, et al., 2020; Rosenbloom et al., 2019; Wills & Mason, 2014) and self-monitoring studies, in general. Improvements in AE were moderate with an effect size of d = 0.44, which was slightly lower than found in systematic reviews (e.g., Bruhn, Gilmour, et al., 2022). One thing to consider is that baseline AE was slightly higher than what we might have expected given the lower AE observed during screening; however, this is likely due to the different measurement approaches (i.e., round-robin time sampling vs. duration recording). While it appears increases in AE did not completely persist from the intervention (M = 86.62%) to postintervention condition (M = 81.25%), it should be noted that AE in postintervention was still well above that demonstrated during baseline (M = 69.00%). Although the effect size for DB (d = −0.35) was slightly smaller than for AE, it was comparable with those found in previous reviews (e.g., Bruhn, Gilmour, et al., 2022).
Perhaps more importantly, we found that students were able to maintain decreases in DB in the postintervention condition. On average, in practical terms, students in the treatment group cut their DB in half from 16.5 DBs per 15 min in baseline to 8.8 during intervention to 9.01 during postintervention. Given the impact that DB can have on student’s learning, teachers’ instruction, and the overall classroom climate, these findings are especially notable (Gage et al., 2018). DB is one of the primary reasons students are removed from the classroom (Pas et al., 2011). Because this study provides evidence that MoBeGo (in conjunction with other components such as feedback) significantly reduced DB and those reductions continued after intervention was removed, teachers may consider using MoBeGo as a proactive approach to keeping students with DB in the classroom during class periods or instructional activities that are generally problematic.
As described earlier, MoBeGo has a data-based algorithm that provides teachers with recommended goal changes as a way of promoting lasting changes in behavior. Previous research has indicated slowly adapting goals over time may be a successful way to sustain positive behavioral change in the short term (Bruhn, Rila, et al., 2020) and our study supports this notion. Although further research is needed to replicate these findings, adapting goals should be considered as a way to program for prolonged behavioral change in self-monitoring interventions beyond MoBeGo. That is, even if teachers are using a paper–pencil self-monitoring form, they can still set goals, graph progress, and adapt goals over time to foster prolonged student success.
A final implication relates to the overall acceptability of MoBeGo from teachers and students. Both sets of MoBeGo users were enthusiastic about the app prior to using it and their enthusiasm maintained after use, which is consistent with previous assessments of social validity of other technology-based self-monitoring interventions (e.g., Bruhn, Rila, et al., 2020; Rosenbloom et al., 2019). The need for practical and feasible interventions that are palatable to both teachers and students and that keep students in the classroom where they can continue to access instruction cannot be understated. Technology-based interventions such as MoBeGo (as well as SCORE IT and I-Connect) offer a modern way to deliver intervention in classrooms while also capitalizing on the efficiency of the technology that allows for collecting, graphing, and using data, and in turn adapting intervention to enhance student success.
Limitations and Future Directions
This study is somewhat limited by the sample size. First, although we had sufficient power to detect group differences in change between conditions, the sample size within the treatment group (n = 28) was prohibitive in examining potential moderators of change, such as student characteristics (e.g., Bruhn, Gilmour, et al., 2022). Second, we measured postintervention effects for 2 weeks following intervention, but we did not collect long-term follow-up data (e.g., 1–2 months later). Although we documented initial maintenance effects for DB, we do not know how long these effects remained. Relatedly, we were unable to measure postintervention effects for all treatment students due to the COVID-19 school closures. Although systematic direct observation is resource- and time-intensive, future researchers should consider collecting additional data that are further temporally removed from intervention to assess longer-term maintenance effects. In addition, we did not collect behavioral data in other classrooms or instructional settings, nor did we examine the distal effects on academic outcomes. Thus, it is unclear whether the significant improvements in AE and DB (a) generalized to other problematic times or activities, and (b) led to improved academic outcomes. Finally, as it relates to treatment fidelity, we found teachers were able to implement the most important mandated components of MoBeGo with high fidelity (e.g., teacher rates student’s behavior = 98.00%, student self-monitors own behavior = 98.63%), whereas there was less adherence to other components (e.g., precorrection at the beginning of the session = 60.88%, feedback at the end of the session = 69.82%). Although self-monitoring interventions often involve multiple components (Briesch et al., 2019; Bruhn, Gilmour et al., 2022), it is unclear whether reminding students of their behavior and goal prior to self-monitoring and providing feedback at the end of the session are necessary components. It is possible high fidelity to the most important components (i.e., teacher and student ratings) is sufficient. Given a larger sample size and greater variability across intervention components, future researchers could examine the moderating effects of these ancillary treatment components (i.e., precorrection, feedback, and reinforcement).
Conclusion
With these limitations in mind, we recognize replication with larger sample sizes is necessary to corroborate our findings. Nonetheless, we are encouraged by findings suggesting the MoBeGo app (with precorrections and feedback) was effective in improving the AE and DB of treatment group students above and beyond control group students, and that these effects remained postintervention for DB. These findings should encourage teachers and other school personnel who are considering implementing self-monitoring interventions to be planful about maintenance programming while also recognizing the efficiency of technology to support intervention delivery and data-based decision-making.
Supplemental Material
sj-docx-1-bhd-10.1177_01987429221093987 – Supplemental material for A Randomized Control Trial on the Effects of MoBeGo, a Self-Monitoring App for Challenging Behavior
Supplemental material, sj-docx-1-bhd-10.1177_01987429221093987 for A Randomized Control Trial on the Effects of MoBeGo, a Self-Monitoring App for Challenging Behavior by Allison Bruhn, Joseph Wehby, Lesa Hoffman, Sara Estrapala, Ashley Rila, Eleanor Hancock, Alyssa Van Camp, Amanda Sheaffer and Bailey Copeland in Behavioral Disorders
Footnotes
Declaration of Conflicting Interests
The author(s) declared no potential conflicts of interest with respect to the research, authorship, and/or publication of this article.
Funding
Funding for this paper was provided by the Institute of Education Sciences (510-14-2540-00000-13607400-6200-000-00000-20-0000).
Supplemental Material
Supplementary material for this article is available on the Behavioral Disorders website with the online version of this article.
References
Supplementary Material
Please find the following supplemental material available below.
For Open Access articles published under a Creative Commons License, all supplemental material carries the same license as the article it is associated with.
For non-Open Access articles published, all supplemental material carries a non-exclusive license, and permission requests for re-use of supplemental material or any part of supplemental material shall be sent directly to the copyright owner as specified in the copyright notice associated with the article.