
Abstract
The ability to interpret, construct, use and communicate statistical information is crucial for contemporary social life. This study investigates how sixth- and seventh-grade students represent primary statistical data, through prompt explicitly requests to construct a contingency table. The aims were: (a) to identify types and levels of format productions; (b) to explore whether: (a) they vary according to: (1) the explicitness of the conventional format assumed by a double-entry table; (2) the presence of an intermediary system (bar graph). Participants were 110 students (sixth = 57; seventh = 53) from a public school in a city near Rosario (Santa Fe, Argentina). The average age was 11.85 years (SD = .60, Min = 10.65, Max = 12.81). Most students produced lists rather than tables, regardless of the grade level. However, among the lists, those grouped according to height intervals predominated, suggesting some adherence to the task instructions. Variables (1) and (2) generated minor variations. The results corroborate that students prefer organizing a dataset using alternative formats such as lists or graphs, as opposed to tables. That is discussed considering levels of statistical literacy and transnumerative techniques.
The ability to interpret, construct, use and communicate statistical information is a crucial requirement for contemporary social life, characterized by massive information and vague news (Engel, 2019; Gal & Geiger, 2022). This entails citizens interpreting, critically evaluating and communicating statistical information and messages (Gal, 2002, 2022; Geiger et al., 2023). Statistical literacy (Schield, 2006, 2011; Watson, 2009; Watson & Smith, 2022) emerges as a priority in current educational programmes (Gal & Ograjensek, 2017; Johannssen et al., 2021; Kurnia et al., 2024). Specifically, the Argentinean official curriculum proposes contents on statistical tables and graphs from upper grades of primary school (Ministerio de Educación de Argentina, 2011a, 2011b).
Statistical literacy recognizes increasing levels related to data collection (sampling), data representation (tables, graphs), data reduction (averages), probabilities, inference, variation and critical thinking in decision-making (Callingham & Watson, 2017; Watson, 2009; Watson & Callingham, 2003). A crucial component of statistical literacy involves reading, interpreting and constructing statistical tables (Gea et al., 2022; Pallauta et al., 2023). They serve as effective tools for summarizing, organizing, communicating and analysing data (Estrella et al., 2017; Garfield & Gal, 1999; Pallauta et al., 2022b). Encountering tables is usual in both educational and scientific contexts. However, their interpretation and construction are complex processes (Batanero, 2001; Estrella & Estrella, 2020; Pfannkuch & Rubick, 2002).
Theoretical framework
The current study addresses the construction of double-entry tables or contingency tables. However, the inherent complexity of this construction process leads students to generate other productions, which differ to a greater or lesser extent from the double-entry table format (Martí et al., 2011). Therefore, this work also analyses these alternative productions. In summary, the study investigates how sixth- and seventh-grade students represent primary statistical data. This is done through a prompt that explicitly requests organizing data in the form of a contingency table. The framework was mainly based on three theoretical aspects: (a) an emphasis on statistical tables; (b) the conceptualization of the table as an external representation; (c) the table construction as a transnumerative process.
Statistical tables
Statistical tables refer to a two-dimensional rectangular graphical structure, comprised of rows and columns, allowing the representation of data from one or more variables and/or the relationship between them (Estrella, 2014). Generally, such representations combine categorical elements (e.g., variable categories) and quantitative elements (e.g., frequency values). They also contain the title, labels (referred to variables and categories) and the data body (Pallauta et al., 2022b).
Lahanier-Reuter (2006) differentiates three types of statistical tables. The data table aligns with the classical notion of a data matrix [row = case, except for the first one, which usually contains labels of variable(s); column = variable, except for the first one, which generally represents the ordinal identification of each case]. One-variable distribution table represents the frequency values for each modality. The first column displays the modalities of the variable. The remaining column(s) refer to frequencies (e.g., absolute, relative, cumulative, etc.). Contingency table represents the cross-tabulation of frequencies between two variables, generally categorical. The modalities of one variable are loaded in the row direction, while those of the other are in the column direction. Cells contain frequencies (intersection of both variables). Additionally, it includes marginal cells with frequency totals.
Tables as external representations
The notion of external representation is based on an interactionist perspective of knowledge, assuming that it arises from objective and material mediations (Andersen et al., 2017; Pozo, 2017). They are cultural devices that support and extend higher mental functions (Martí, 2009; Vygotsky, 1931/1988), involving both written language and other representations as numerical notation (Martí et al., 2016; Rodríguez et al., 2018), graphs (Pérez et al., 2018), location maps (Salsa et al., 2019) and others. Particularly, statistical tables denote a specific system that represents knowledge in a two-dimensional format, featuring numerical quantities (Gabucio et al., 2010; Martí et al., 2011).
In turn, an external representation can be linked to three complementary cognitive processes: understanding it, producing it and using it (Martí, 2009). Most studies about statistical tables analysed their comprehension and refer to different educational levels: preschool (Ruesga Ramos, 2005), primary (Castellaro & Roselli, 2020; Castellaro et al., 2024; Gabucio et al., 2010; Sepúlveda et al., 2018; Watson & Callingham, 2014), secondary (Gabucio et al., 2010; Pallauta et al., 2022b, 2023) and higher (Cañadas et al., 2013; García-García et al., 2019). Conceptually, most of them coincide regarding the levels of table comprehension (Friel et al., 2001): L1, to describe (read the data); L2, to interpret (read between the data); L3, to infer (read beyond the data). L4 can be added, linked to a critical reading of the system, i.e., behind the data (Pallauta et al., 2023).
The construction of tables has received less research attention than their comprehension. Martí et al. (2011) explored the individual construction of tables by Catalan students in the fifth, sixth, seventh and eighth grades. The primary data, presented as a list, consisted of 25 student names, their ordinal number within the class, age and height. The task required constructing a table indicating how many boys and girls (nominal variable: gender) measured < 130 cm, 130–149 cm, 150–169 cm and > 169 cm (height intervals).
This study revealed two main findings. Firstly, although the prompt requested the construction of a table linking two categorical variables, participants produced various formats. There were two basic formats: lists and tables. A list is characterized by presenting information in a sequential and linear manner; it enumerates series of elements, and these are organized based on a single spatial dimension (horizontal, e.g., separating elements with commas or dashes, and/or vertical, e.g., dashes). The authors identified lists ordered by gender, ordered by height intervals and ordered by gender and height. Instead, a table presents information in a crossed way: it does not enumerate but combines values of categories; it combines horizontal and vertical dimensions; it involves a higher level of selection and synthesis than the list. Two table formats were categorized: cross tables with case names in their cells and cross tables containing frequency values in the cells (two-way tables strictly). Additional categories were observed: no answer, graphs and other.
The authors also proposed an approach to assess the quality of productions based on adherence to the task, which involved primarily distinguishing height intervals. Thus, the two table formats, lists by height and lists by gender-height were classified as ‘correct’; the rest were considered ‘incorrect’. The production level did not differ among the four grades. This suggests a significant cognitive challenge that persists from primary to secondary education.
Estrella and Estrella (2020) investigated the representation of statistical data in third-grade children. The primary data comprised 30 drawings representing students’ preferred snacks. The authors also observed productions in the form of lists and tables (including quasi-tables). List formats predominated (77%).
Transnumerative thinking
Constructing a statistical table involves transforming a representation system into another (Batanero et al., 2010), for example, representing the relationship between the frequencies of two categorical variables from the primary data in a matrix. That refers to the transnumeration process (Chick, 2004; Chick et al., 2005), a specific type of statistical thinking proposed by Wild and Pfannkuch (1999). Transnumerative thinking allows for capturing, creating, defining and changing measures and representations, making sense of the data and learning about the underlying phenomenon (context).
Chick (2004) proposes 10 transnumerative techniques based on the analysis of a task that required ‘drawing a graph or something similar’ to show the relationship between variables. The primary dataset were the ‘data cards protocol’, a set of 16 cards, each bearing the name, age, weight, weekly fast food consumption, favourite activity and eye colour of a fictitious juvenile. Each transnumerative technique ‘…involves some change in representation, by creating a new variable, organizing the data differently, or representing them in a graphical way’ (p. 168).
Pallauta et al. (2022b) propose a selection of the main techniques. Sorting: data are arranged according to a criterion (no news variables arise). Grouping: data are grouped based on a criterion, such as class intervals; this generates a new variable derived from the original. Subset selection: a specific subset of data is chosen for further transnumeration. Change variable type: a numerical variable is presented in categorical terms, or a category is presented in numerical or ordinal terms. Frequency calculation: the frequencies of categories or values of a variable are determined; frequencies can be considered as a new variable. Proportion calculation: frequencies in relation to a whole, creating a new variable function. Graphing: some or all of the variables (in the current form) are graphed or tabulated. Furthermore, Estrella and Olfos (2019) explored transnumerative thinking in the responses of 80 third-grade students to a data analysis learning situation. They identified seven out of the 10 techniques proposed by Chick (2004).
Chick and Watson (2001) analysed ways of representing data in Grade 5–6 students working in triads. They worked on the ‘data cards protocol’ (see above) and could relate any variables they wanted (open-ended task). Three production levels were observed: unistructural (one relevant aspect of the information, depicting individual aspects of the dataset or a subset), multistructural (several aspects of relevant information, often in a sequential fashion, e.g., representing a single variable) and relational (integrated understanding of the relationships among different aspects of the information, e.g., drawing a contingency table). Regarding the production types, a low preference for constructing frequency tables was observed, with a preference for constructing bar charts.
Pallauta et al. (2021) analysed the transition of data between different formats in secondary students. They examined the shift from a pictogram to a frequency table and from a bar chart to a two-way table. In both tasks, correct responses predominated, although they decreased in the second one. In Pallauta et al. (2022a), the students were required to interpret a bar chart reporting information on the gender and preferred sport. Based on that information, students had to input the corresponding cross-tabulated absolute and relative frequencies into the cells of a predefined tabular system. The results indicated a greater prevalence of correct responses in loading absolute frequencies.
The current study
The current study primarily addresses the following question: in what ways do sixth- and seventh-grade students represent quantitative data? This question is formulated within the context of a task that explicitly requests ordering a dataset through the construction of a table that links the categories of two variables (Martí et al., 2011). Thus, the main aim is to identify types and levels of individually constructed representational formats as forms of organizing an initial set of data, in sixth- and seventh-grade students.
Additionally, the study also aims to explore whether type and level of production vary according to: (1) the explicitness regarding the conventional format of a two-way table; (2) the presence of an intermediary system (bar graph) that provides an initial summary organization of the original dataset. The first one involves explicitly instructing participants on the culturally expected format of a cross-tabulation table. From a socio-cultural perspective, any external representational system is a cultural skill that goes beyond individual basic operations (Martí & Pozo, 2000; Pozo, 2017). Constructing a double-entry table requires not only the operational capacity to perform cross-classifications but also the learning of the underlying logic of the system, which is socially acquired (Martí, 2009; Martí et al., 2011). The hypothesis suggests that a higher proportion of participants produce representational table formats if the culturally expected format is explicitly stated. Chick and Watson (2001) found that when the researcher suggests or describes the structure for tables or graphs, there is a higher production of such systems by students. The second variable is the presence of an intermediary bar graph system that provides an initial summary of the information originally available in the list. There may be a facilitative relationship between tables and graphs (García-Milá et al., 2014). The hypothesis suggests that the additional presence of a bar graph facilitates the process of constructing the system.
Method
Design
The main objective of the study was to describe in what ways sixth- and seventh-grade students represent quantitative data. Secondly, some variations of this process were analysed according to two variables: (1) the explicitness of the conventional format expected for a two-way table; (2) the additional presence of a bar graph (intermediary) that provided an initial summary of the original list data. Four conditions were compared.
The study was conducted within six classes, comprising three sixth-grade and three seventh-grade classes. A quasi-experimental approach was employed because the conditions were created within intact groups, i.e., each class. This decision was based on two issues: (a) feasibility, since it was not possible to randomly assign students among the four conditions by ‘disassembling’ the six classes; (b) another option could have involved replicating the four conditions within each class, but with the potential risk of influencing subjects across different treatments.
Four intact classes (6thA, 6thB, 7thA, 7thB) were randomly assigned to one of the four conditions. The remaining two classes (6thC and 7thC) were bifurcated, and the two conditions that had not been previously administered according to grade were counterbalanced. In summary, ‘one and a half’ classes participated in each condition. The distribution of cases was not precisely uniform across conditions due to the inclusion of only those students with double consent who attended on the day of the study within each class.
The study was conducted in the second period of the academic year, which consists of four periods. None of the participants had been exposed to curricular content related to the construction of statistical tables during the academic year. This information was confirmed through interviews with the mathematics teachers.
Participants
Participants were 110 students (sixth = 57; seventh = 53) from a public school in a city near Rosario (Santa Fe, Argentina). The average age was 11.85 years (SD = .60, Min = 10.65, Max = 12.81), and they were evenly distributed by gender. Only students who had their own informed consent and the consent of a responsible adult participated in the study. Atypical cases (e.g., those with developmental or learning disorders) who provided the double-informed consent also participated in the study. However, they were not considered in the final sample (n = 110) and the data processing, since their productions either had little to no correspondence with the task or failed to generate a recognizable format.
Materials and procedures
This study considered the ethical guidelines for social research established by the Consejo Nacional de Investigaciones Científicas y Técnicas (CONICET) and the Universidad Nacional de Rosario (UNR), based on the Declarations of Helsinki and Nuremberg (double-informed consent, confidentiality and anonymity of the data, and the exclusive use of the data for research purposes).
The task was adapted from Martí et al. (2011). The initial instructions requested: ‘The following list presents the data of a group of students attending another school. Using this data, CONSTRUCT A TABLE that shows the number of sixth-grade students and seventh-grade students who are less than 130 cm tall, the number of students who are between 130 and 149 cm tall, the number of students who are between 150 and 169 cm tall, and the number of students who are taller than 169 cm.’ Figure 1 shows the primary data set.
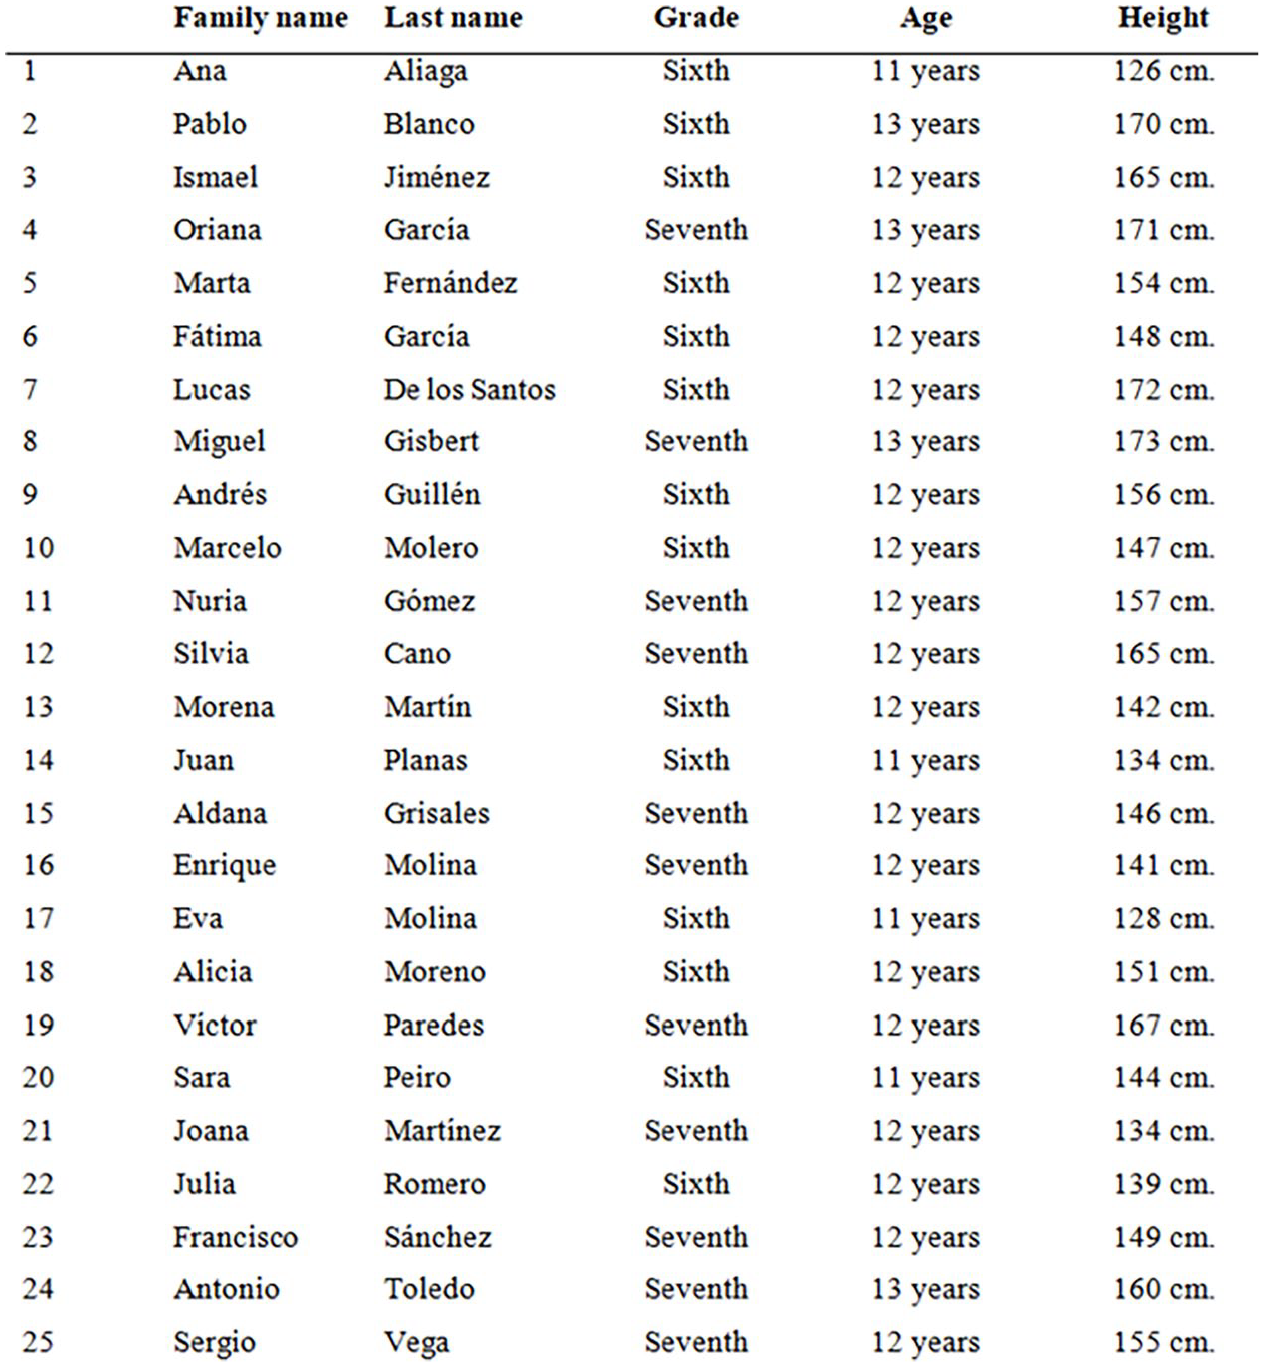
Primary dataset (original version in Spanish).
Martí et al. (2011) instructed students to differentiate height intervals based on gender (girls and boys). In contrast, in the current study, the gender variable was replaced with a similar measurement scale, grade level (sixth grade and seventh grade), to uphold ethical considerations and avoid gender bias. Furthermore, since grade level could not be inferred from the explicit data in the list (unlike the previous version, where gender could be deduced from the participant’s name), an extra column was included to explicitly indicate the grade level for each case.
After providing that uniform instruction to all participants, some were instructed to construct ‘a table’, while the remaining subjects were additionally provided with guidance on the culturally expected format for a two-way table [‘(!) PLEASE NOTE… Remember that a TABLE (like the one you need to construct) allows you to organize information in rows (horizontal) and columns (vertical). The combination of these rows and columns forms cells or spaces, which will show you how many students of each grade fall into specific height ranges.’]
In combination with those instructions, a subset of participants was also provided with an additional bar graph which already depicted a summary of the characteristics of the initial arrangement (Figure 2): ‘(!) PLEASE NOTE… The next graph shows how many sixth-grade students and seventh-grade students are shorter than 130 cm tall, how many measure between 130 and 149 cm tall, how many measure between 150 and 169 cm tall, and how many are taller than 169 cm.’
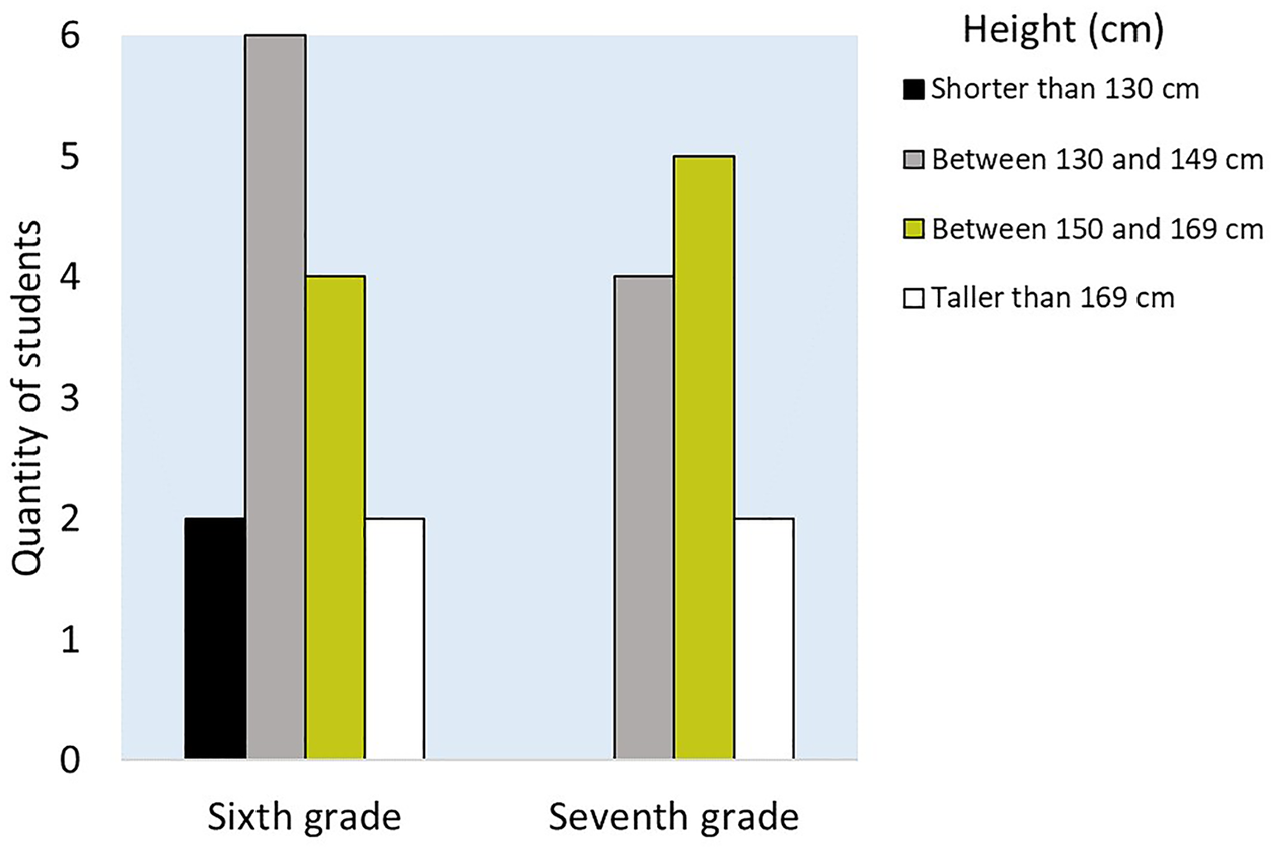
Additional bar graph (conditions 3 and 4; original version in Spanish).
All subjects performed the activity in a booklet that included the written instructions, the original data list, a blank page titled ‘Build the table on this sheet’ and a final draft page. The researcher handed out the booklet to each participant and orally communicated the instructions. Students proceeded to work independently, without any further intervention from the researcher. Data collection was conducted collaboratively by the first, second and third authors, all of whom were members of the same research group. Each researcher was responsible for overseeing two classes, adhering strictly to the established procedure. The activity was conducted collectively, without a time limit.
Data analysis
First, the productions were analysed according to the nine categories proposed by Martí et al. (2011; see next). However, two adaptations were necessary: (a) a new code for quasi-identical productions to the primary data list (‘list reproduction’); (b) three subtypes of lists ordered by height: explicit height intervals, implicit height intervals and sorting (increasing or decreasing) absolute height values.
Reproduction list (LR)
(Quasi) Literal reproduction of the original data list.
List ordered by grade (LG)
Cases ordered along a single dimension (horizontal or vertical) without attempting cross-tabulation, differentiated by grade level (see examples in Figure 3).
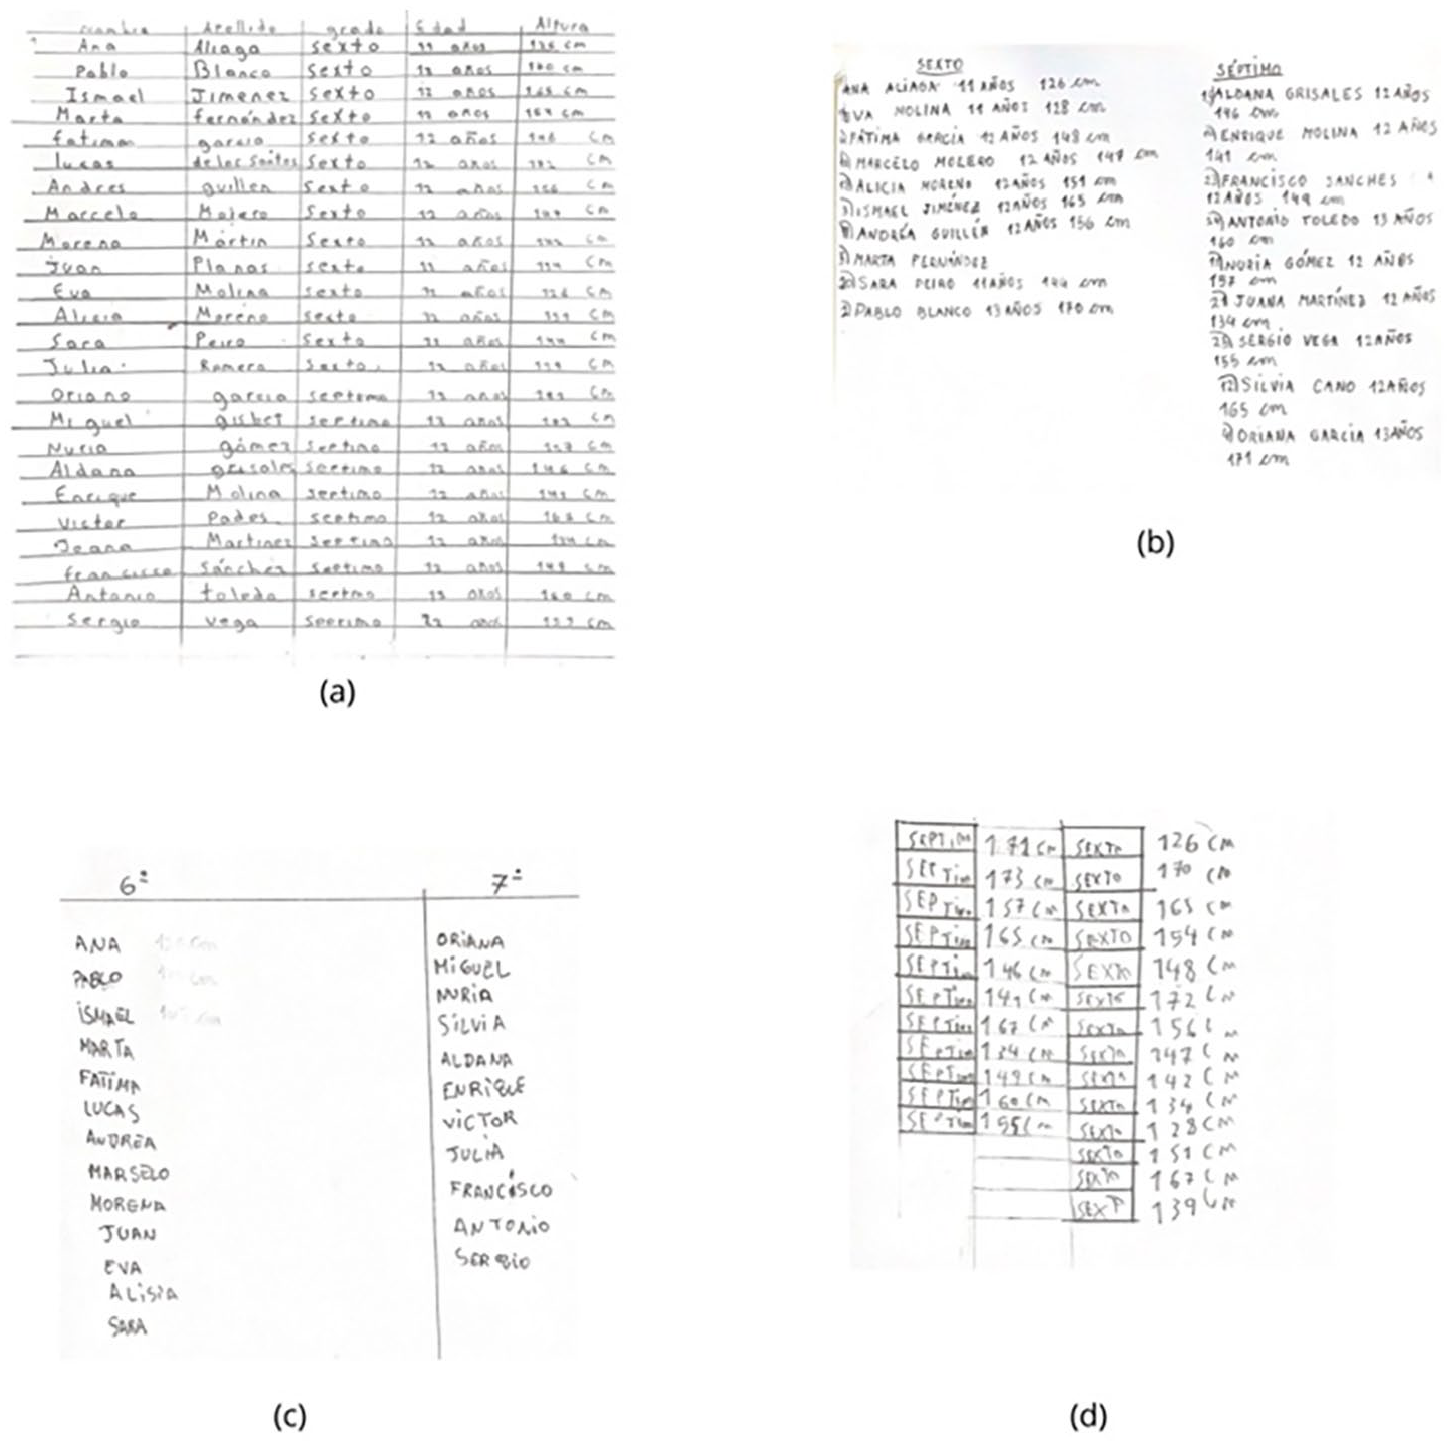
Lists ordered by grade. Examples: (a) list ordered by grade, nearly identical to the original data list; (b) list ordered by grade, with limited selection and synthesis of the original data; (c) list ordered by grade with excessive selection and limited synthesis of original data; (d) list ordered by grade, with selection of original data according to the task, but limited data synthesis.
List ordered by height (LH)
Cases ordered along a single dimension (horizontal or vertical) without attempting cross-tabulation, differentiated by height. Three criteria for ordering by height were distinguished: (a) by explicitly stated height intervals, with labels or headers (LHE); (b) by implicit height intervals, where no labels or headers are provided but an implicit ordering is observed (LHI); (c) by absolute heights, ordered in ascending or descending order (LHA). (See examples in Figure 4).
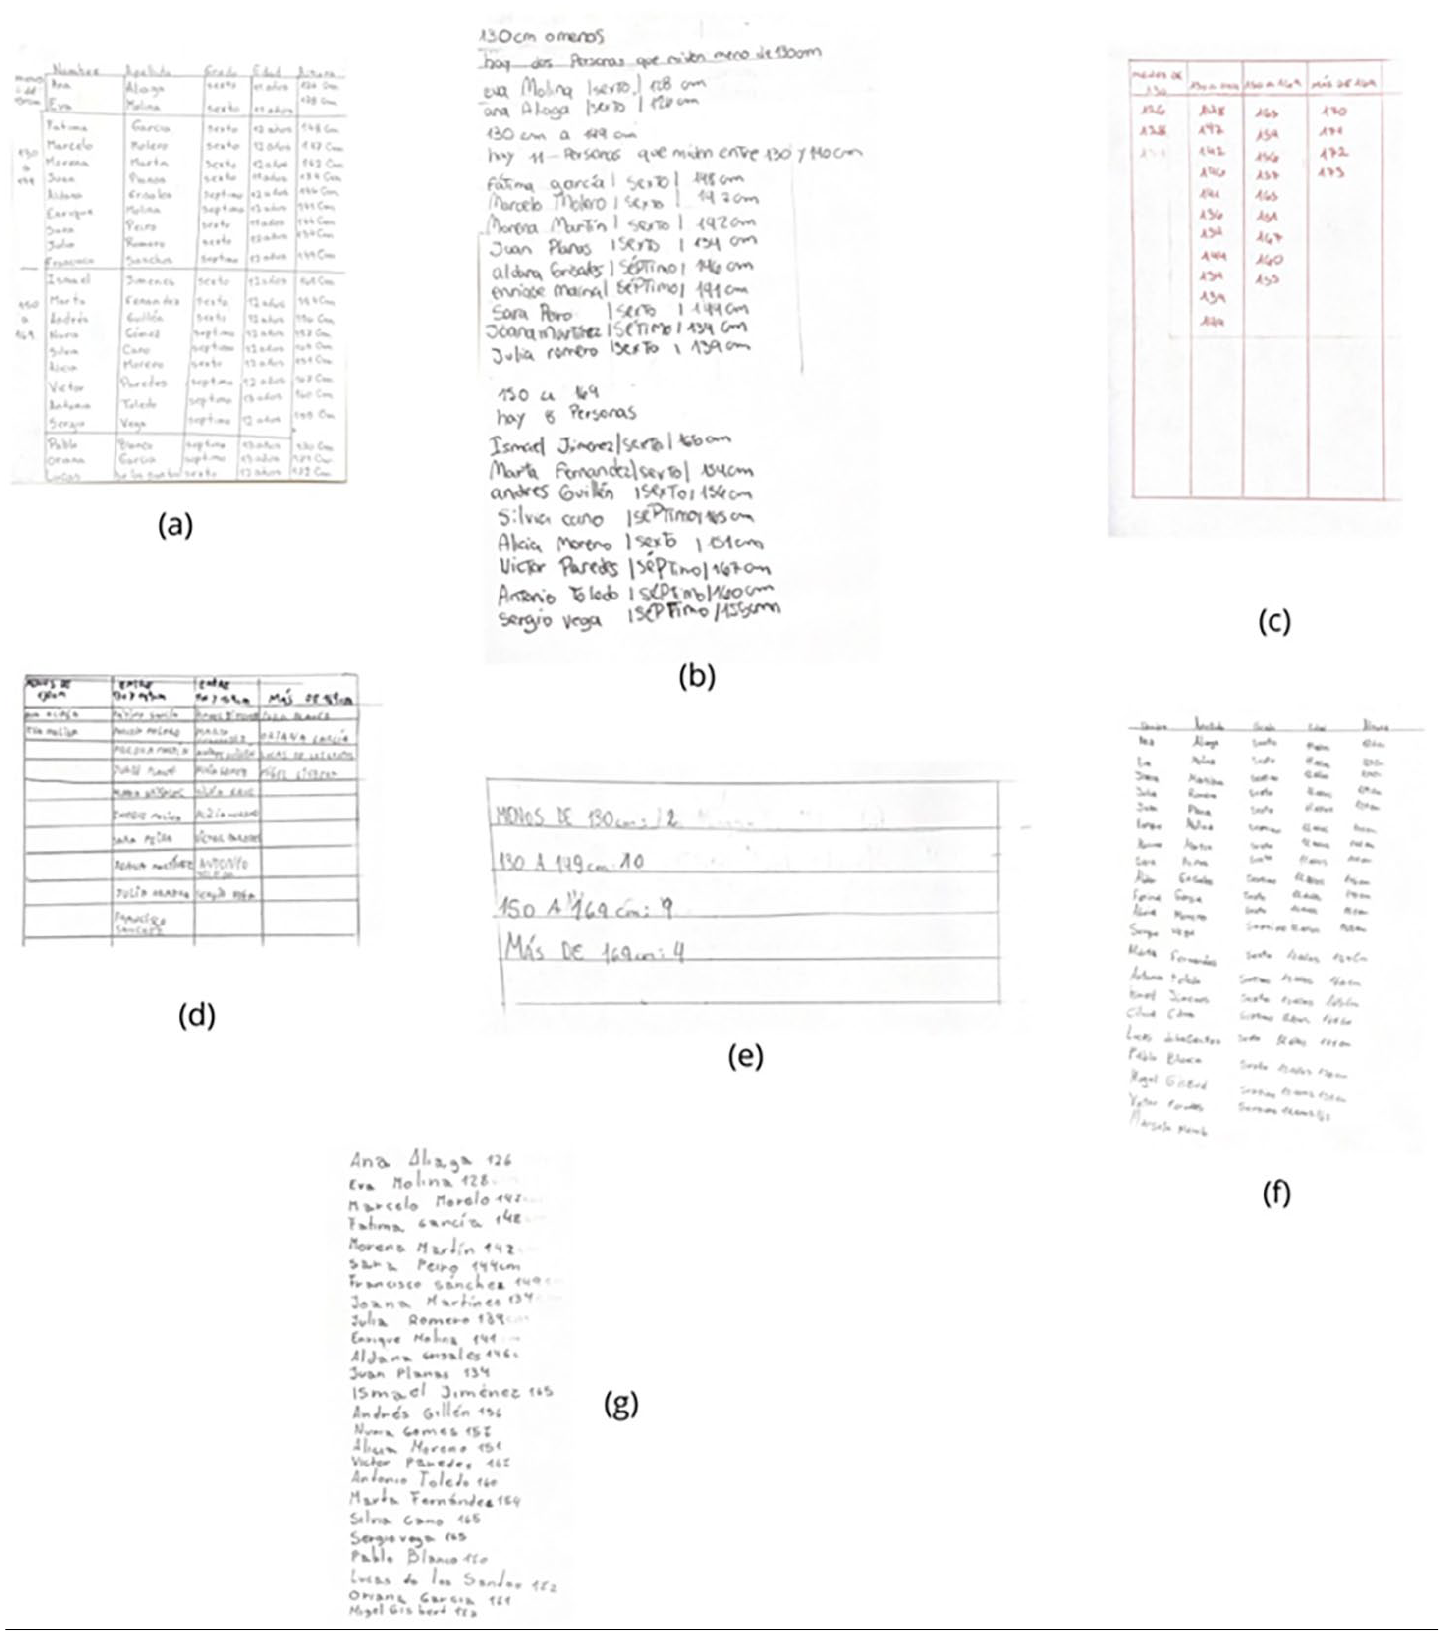
Lists ordered by height. Examples: (a) list ordered by explicit height intervals, without selection or synthesis of original data; (b) list ordered by explicit height intervals, with greater selection of original data and an attempt at synthesis (frequencies); (c) list ordered by explicit height intervals, with a higher level of selection of original data and minimal synthesis; (d) list ordered by explicit height intervals, with a higher level of selection of original data and minimal synthesis; (e) list ordered by explicit height intervals, with higher levels of selection and synthesis; (f) list ordered by implicit height intervals, without selection or synthesis of original data; (g) list ordered by implicit height intervals, with selection and limited synthesis of original data.
List ordered by grade and height intervals (LGH)
Cases ordered along a single dimension (horizontal or vertical) without attempting cross-tabulation, differentiated by height and grade level. (See examples in Figure 5a & b)
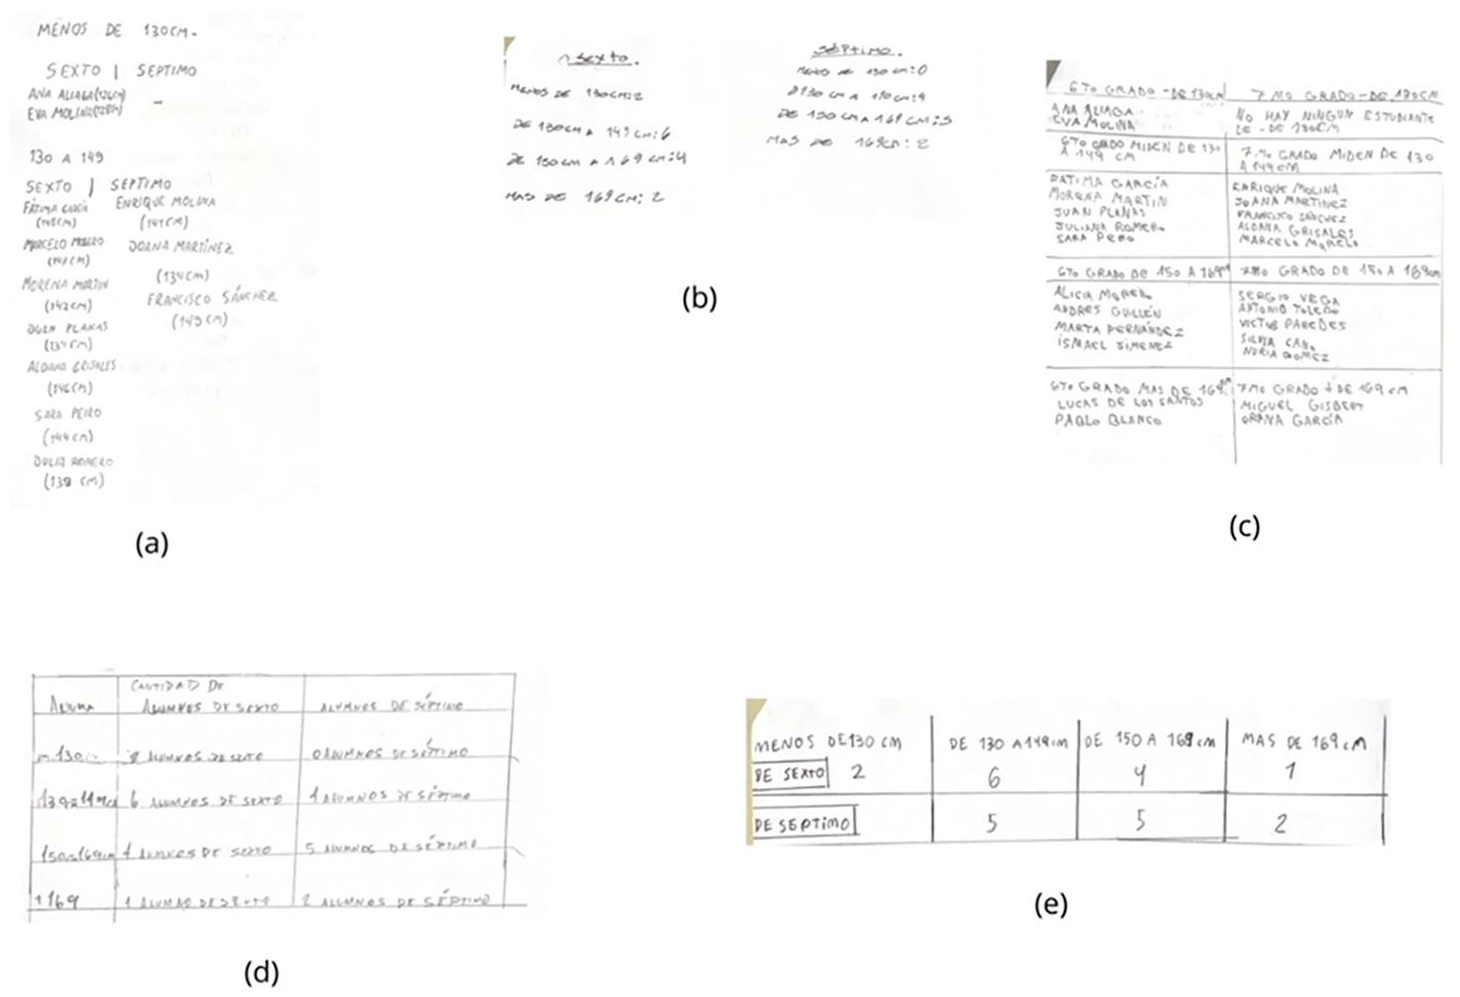
Lists ordered by grade and height, contingency tables with names, and contingency tables. Examples: (a) list by grade and implicit height intervals; (b) list by grade and implicit height intervals; (c) table with names; (d) frequency table, with lesser synthesis; (e) frequency table, with higher synthesis.
Double-entry table with names (TN)
Information presented in cells resulting from the cross-tabulation of height intervals and grade level. These cells contain case names. (See examples in Figure 5c)
Double-entry table (TF)
Information presented in cells resulting from the cross-tabulation of height intervals and grade level. These cells contain frequency or count values as a summary of cases (conventional double-entry table; see examples in Figure 5d & e).
Graph (G)
The resulting system is either a bar graph or a pie chart.
Other (O)
The ordering criterion used to produce the system does not match the proposed categories.
No answer (NA)
Task not completed or partially completed (incomplete).
List without a clear organizing criterion (LWO)
An ordering criterion cannot be identified.
Categories were classified as either ‘basic’ or ‘advanced’, according to Martí et al. (2011; see Introduction). Twenty percent of the productions were coded independently by two researchers. The inter-observer agreement exceeded 90%. Discrepancies were resolved through a second coding process.
Finally, a qualitative analysis of the primary format productions was conducted, employing the transnumerative techniques proposed by Chick (2004). The objective was to elucidate the most frequently observed variations and idiosyncratic aspects within list by grade, list by height, list by grade and height, and the two double-entry tables (with names or frequencies).
Results
Types and levels of productions
Most of the students (92.7%) produced some form of representation (Table 1). Among those who did not succeed (NA), almost all were sixth-graders (7/8). The most literal reproductions of the original data list (LR) were also produced by sixth-grade students. This category reflects some attempt at production but represents a rudimentary level of elaboration since it is merely a replica of the original list. Moreover, 13.6% of the cases produced a graph (e.g., bar chart), applying equally to both grades.
Frequencies (row and column percentages) of production types.
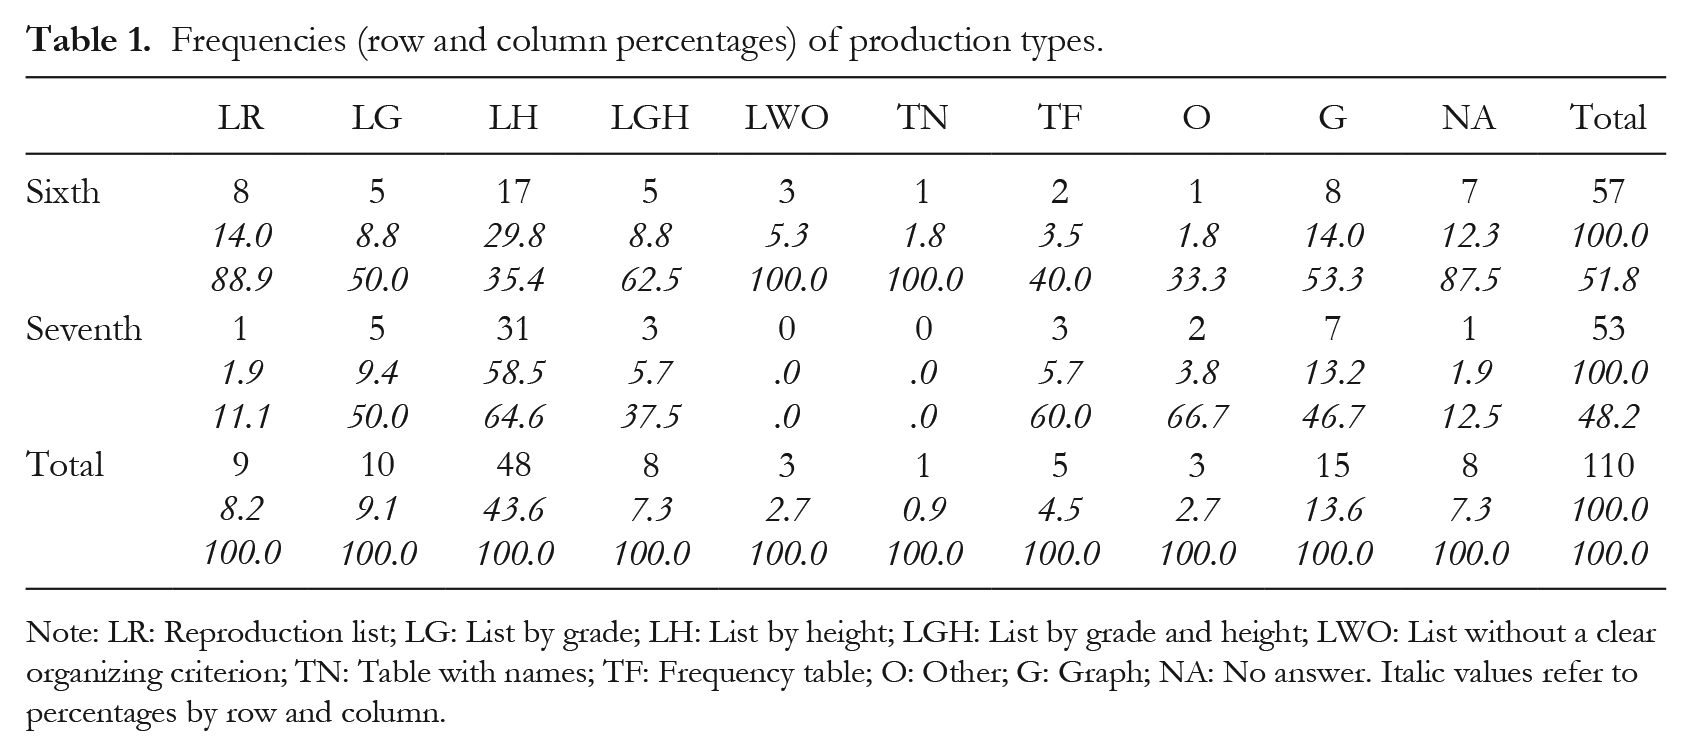
Note: LR: Reproduction list; LG: List by grade; LH: List by height; LGH: List by grade and height; LWO: List without a clear organizing criterion; TN: Table with names; TF: Frequency table; O: Other; G: Graph; NA: No answer. Italic values refer to percentages by row and column.
The most predominant category was list ordered by height (LH), observed in 43.6% of the sample. However, this value varied by grade: it increased in seventh grade (58.5%) and decreased in sixth grade (29.8%) [χ2(9) = 18.73, p < .05 1 ].
More specifically, regarding the sub-types of lists ordered by height, explicit intervals (LHE) predominated (60.4%), followed by implicit intervals (LHI, 22.9%) and absolute values (LHA, 16.7%). A significant difference is also observed by grade: 79.3% of the height-grouped lists with explicit intervals were produced by seventh-grade students, while 75.0% of the lists grouped by absolute values were produced by sixth-grade students [χ2(2) = 8.71, p < .05].
The remaining two types of lists, ordered by grade (LG) and ordered by grade height, had a low overall presence (9.1% and 7.3% respectively). Only one student constructed a table with names (TN) and five students (4.5%) achieved a conventional double-entry frequency table (TF). This was similarly observed in both grades.
Generally, the level of the productions (basic–advanced) was ‘intermediate’, since advanced productions were observed in 49.1% of the sample. However, this level of production varied significantly according to grade: in sixth grade it decreased to 33.3%, while in seventh grade it increased to 66.0% [χ2(1) = 11.75, p < .01].
Types and levels of productions in specific conditions
The analysis of the productions according to specific conditions was conducted within each grade (see Table 2). A descriptive analysis may be attempted although several categories showed low frequencies (univariate analysis), making it challenging to compare them across the four study conditions. As previously mentioned, no answer (NA), primarily noted in the sixth grade, was observed irrespective of the condition; however, the highest proportion (30.8%) was identified in condition 2. List reproduction (LR), also predominant in sixth grade, only occurred in conditions without the additional bar graph (1 and 2), especially in condition 1. Graph formats (bar graph or pie chart) were only observed in the conditions with an additional bar graph, equally in both grades.
Frequencies (and row percentages) of production types according to condition.
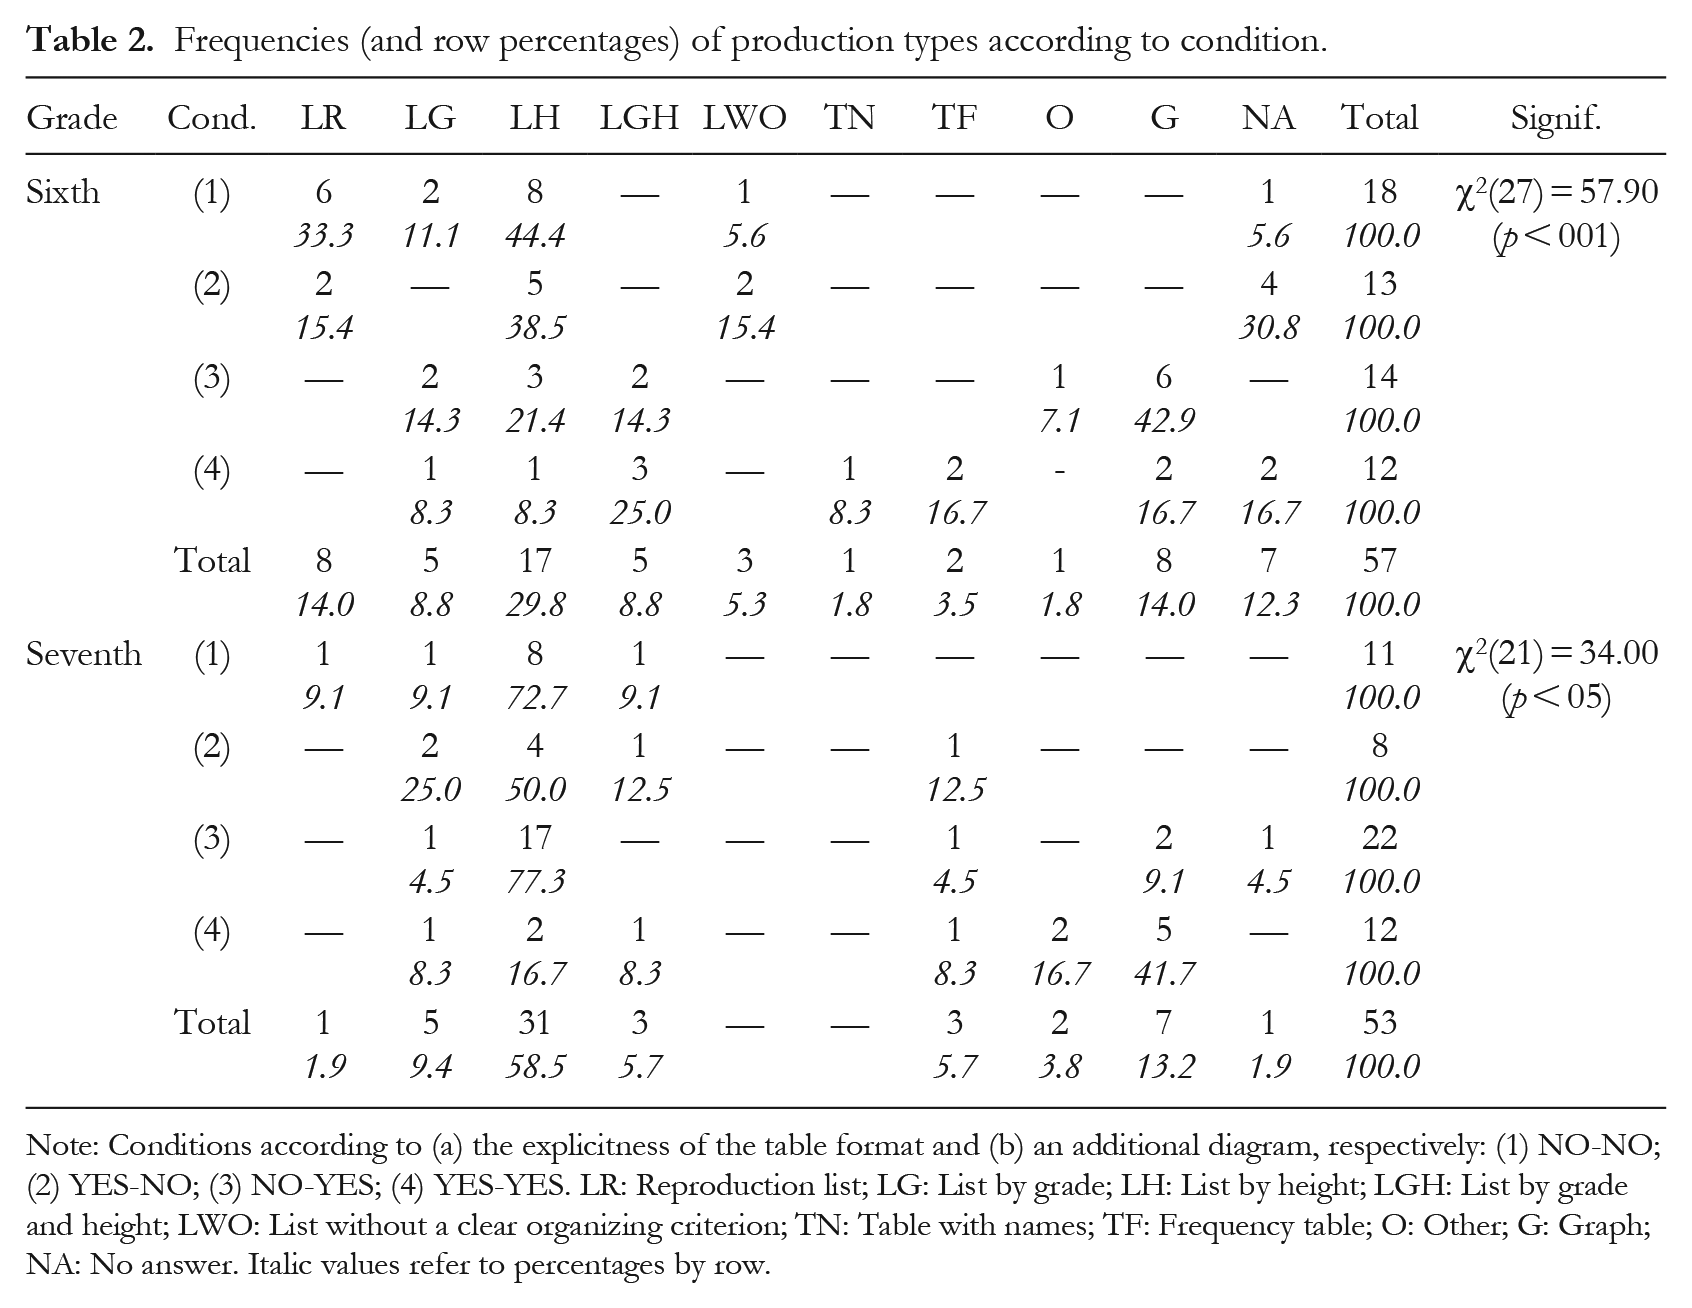
Note: Conditions according to (a) the explicitness of the table format and (b) an additional diagram, respectively: (1) NO-NO; (2) YES-NO; (3) NO-YES; (4) YES-YES. LR: Reproduction list; LG: List by grade; LH: List by height; LGH: List by grade and height; LWO: List without a clear organizing criterion; TN: Table with names; TF: Frequency table; O: Other; G: Graph; NA: No answer. Italic values refer to percentages by row.
List by height, the most observed category, in sixth grade was associated with conditions 1 and 2 (in that order), which did not have additional graphical information. In contrast, in seventh grade, list by height predominated in condition 3. Conversely, in sixth grade, the presence of an additional system was mostly linked to the replication of the same diagram.
Regarding the level of the productions, the general trend was maintained in both grades: sixth grade showed a predominance of basic level, while seventh grade showed a predominance of advanced level, except in condition 4, where this trend was reversed (Table 3). In the case of seventh grade, this reversal of the general trend reached statistical significance, but not in sixth grade.
Frequencies (and row percentages) of production levels according to condition.
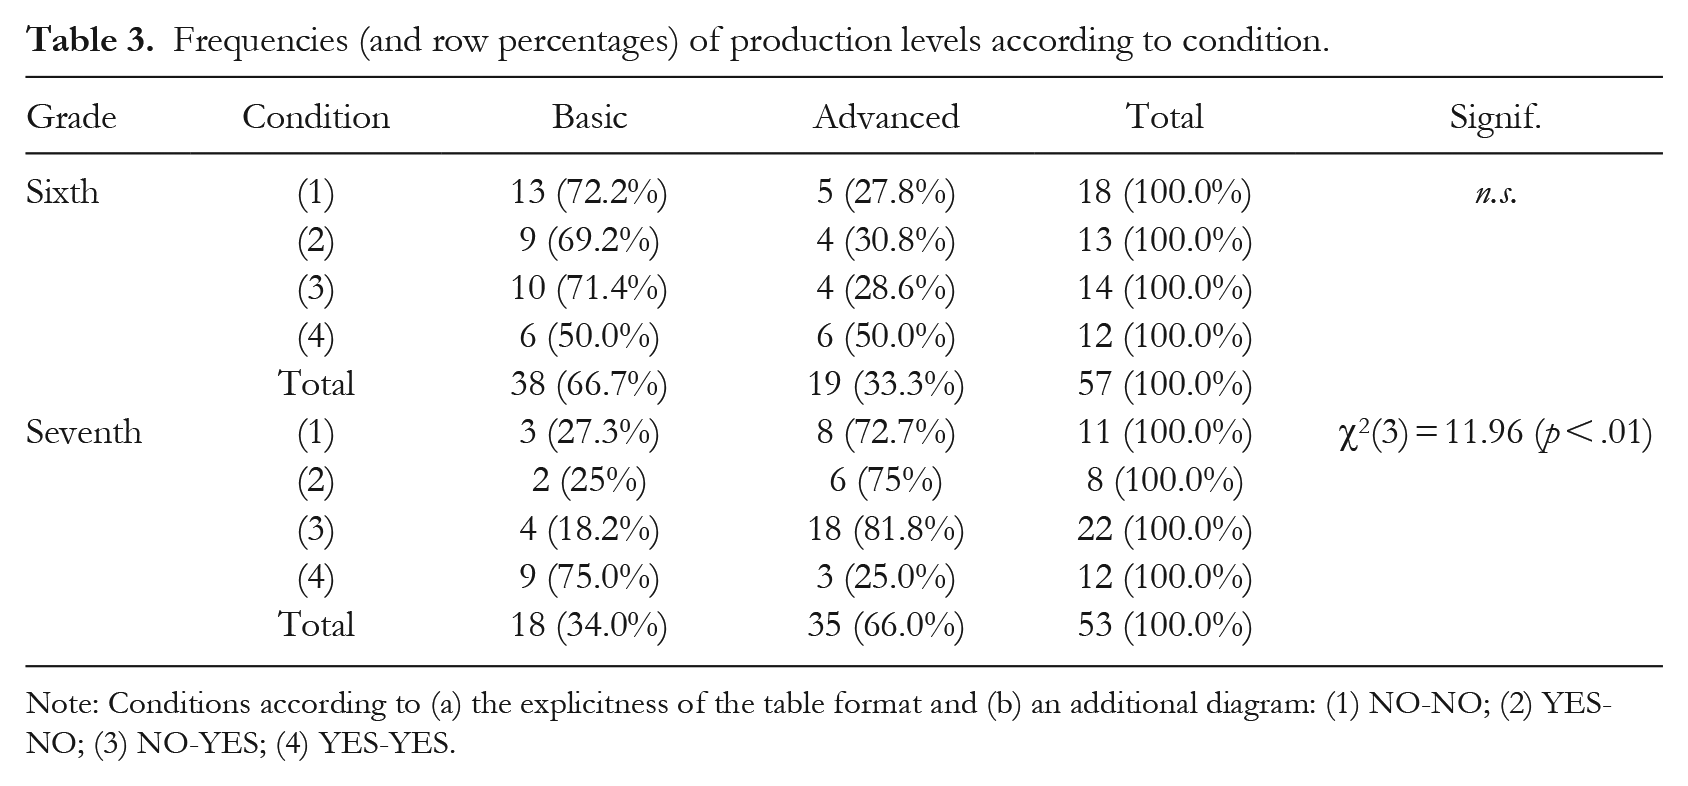
Note: Conditions according to (a) the explicitness of the table format and (b) an additional diagram: (1) NO-NO; (2) YES-NO; (3) NO-YES; (4) YES-YES.
Transnumerative techniques in main format productions
Six transnumerative techniques were identified: subset selection, sorting, grouping, change variable type, frequency calculation and graphing/tabulation. They were considered within the main types of productions.
Lists by grade
The most basic sub-type of list ordered by grade consisted of a reproduction of the original data list, but sorting the information based on the grade variable. In Figure 3a, an almost original list is presented, where in all of sixth-grade, units were consolidated in a first block, and all seventh-grade units were grouped together in a second block.
Other sub-types of lists ordered by grade showed more significant transformations of the original list. Figure 3b illustrates a two-column list, where each column represents a different grade level, indicated by a header label. However, there was a poor subset selection because almost all original data (including name, last name, age and height) were transferred. Irrelevant information like age and name remained unchanged. There were also instances in which two columns were also created (one for each grade) with headers (Figure 3c). However, contrarily to the previous figure, the difference lies in the excessive subset selection, since only the first name of each unit is mentioned in the system (reference to height is missing).
Finally, a different pattern emerges compared to the previous ones (Figure 3d). This pattern is more efficient in subset selection since the resulting system includes data related to both height and grade level (according to the prompt). However, it lacks synthesis since it does not use generic grade categories to group similar cases (e.g., sixth or seventh grade) but instead specifies the data for each participant individually. Moreover, the list provides the exact height for each unit rather than specifying height intervals (no grouping or change variable type).
Lists by height
Lists ordered by explicit height intervals
The basic format involves sorting all information from the original list through explicit intervals but without subset selection including names, surnames, grades, ages and heights (Figure 4a). Figure 4b also applied in this group, showing a key difference: a greater subset selection (age is not reported, as the task requires) and reporting frequency calculation for each interval.
Then, another format was observed (Figure 4c), which implies a higher level of subset selection. Moreover, the list specifies height intervals (either horizontally or vertically), containing the specific heights of the cases (grouping and change of variable type) while omitting the remaining data from the original list (name, surname, age, grade). Also, a variation was observed: within each height interval, instead of reporting specific heights, the names and surnames of the cases belonging to each interval are mentioned (Figure 4d).
The remaining productions involved the highest level of subsect selection and synthesis. They directly report frequency values for the cases corresponding to each height interval (Figure 4e), omitting the rest of the information available in the original list (name, age, grade). In this sense, this production shows a partial subset selection accomplished by sorting, grouping, change variable type and frequency calculation.
Lists ordered by implicit height intervals
Here, a production based on the pseudo-reproduction of the original data list structure was observed (Figure 4f). The only difference compared to the original data lies in the sorting of cases based on implicit height intervals (without header categories). Similar cases were also observed, but with greater subset selection and filtering of data from the original list in the new system. Figure 4g only reports the name and net height of each case, organizing them according to implicit groupings by height (without a header category).
Lists ordered by absolute heights
All these types of production constitute an almost identical reproduction of the original list, except that the data are sorted according to an increasing or decreasing order of the individual cases’ net heights. These productions make up the entire list, whereas just some of the lists ordered by explicit and implicit height intervals heavily relied on the original list (sorting only, without grouping or other techniques).
Lists by grade and height intervals
Firstly, productions with a lower level of data selection from the original list are identified, since the names of the cases are also included (Figure 5a; only a part of the production is shown for space reasons). However, the ordering that distinguishes data by grade and height makes a clear difference, since it represents an attempt to cross-reference two classification criteria. There are both horizontal and vertical ordering formats.
Additionally, there are formats that directly present frequency values. These frequencies can be univariate or bivariate, with the latter serving as a precursor to the conventional two-way table (Figure 5b) with slight differences in data arrangement (subset selection, grouping, change variable and frequency calculation).
Contingency tables with names (TN) or frequencies (TF)
Figure 5c shows the only case that was encoded as a contingency table with names. This level of information synthesis is incomplete, since the headers corresponding to each variable (grade and height interval) are repeated in each grouping, instead of being mentioned only once at the top of the row and/or column. Nevertheless, the classificatory criterion of combining counts between the variables requested by the prompt is evident.
Finally, among the few double-entry table productions, two levels of synthesis could be distinguished. On the one hand, those that showed some duplication of information regarding the categories of each variable were observed. For example (Figure 5d), in addition to the frequency of each cell, the corresponding grade is specified again, despite having already been stated in the header of the corresponding column. On the other hand, in another case, a higher level of synthesis was achieved, as can be seen in Figure 5e.
Discussion
The study allowed analysis of how sixth- and seventh-grade students represent quantitative data. This question is formulated within the context of a task that explicitly requests ordering a dataset through the construction of a table that links two categorical variables.
The proportion of subjects who constructed a conventional table was low, compared to the production of lists and graphs. This finding aligns with previous studies. Chick and Watson (2001) observed that grades 5–6 students, working on an open-ended task, showed a lesser preference for constructing frequency tables than bar charts. Estrella and Estrella (2020) found a greater proportion of lists than tables in third-grade children. Martí et al. (2011) also observed a low proportion of tabular productions. In summary, students would prefer ordering a dataset through alternative formats such as lists, graphs or others, as opposed to table formats.
List by height was clearly the most observed category (almost half of the sample). This finding relatively differs from Martí et al. (2011), who found height-based list formats but in a smaller proportion. Furthermore, they did not identify a marked leap in the production of height-based lists from sixth to seventh grade, as observed here. It could be inferred that for students it was more accessible to think and organize the data based on a single dimension (horizontal or vertical), which was generally the height expressed in the intervals provided in the instructions. In contrast, the need to organize the data based on the combination of two variables proved to be a challenge for the majority of cases. The construction of a table involves a segmentation process, wherein significant units of information are chosen and organized (Martí et al., 2011). Crossing two variables requires the simultaneous consideration of their values (and frequencies) through the categorization of variables and matching correspondences (Chick & Watson, 2001). This must then be translated into a designated spatial layout. Taking these steps (and associated transnumerative techniques) into consideration could assist with identifying specific difficulties and designing teaching strategies.
Also, the results suggest a direct relationship between the production level and the presence of specific transnumerative techniques (Chick, 2004). For example, list by grade (basic production) only showed subset selection accomplished eventually by sorting. In contrast, a double-entry frequency table that links grades and height intervals (as the prompt asked) included, for example, subsect selection, sorting, grouping, change variable type and frequency calculation. Thus, table production promotes transnumerative processes more than lists, which is a crucial component of statistical thinking (Chick et al., 2005; Wild & Pfannkuch, 1999). Nevertheless, as asserted by Pfannkuch and Rubick (2002), students are not aware of the need to represent implicit information in the data, since it is not straightforward for them to establish classification criteria. Similarly, students hesitate between grouping or not grouping the data, in a tension between focusing on each isolated case or on the variable that describes the behaviour of a group.
Comparing results with Martí et al. (2011), the adequacy of the original data list is important. In their study, gender (girls and boys) was inferred from first names, unlike in the current study, where gender was replaced by school grade (sixth and seventh), with an added column in the primary data list. This explicit inclusion of data for both variables (height and grade) may impact a higher proportion of list formats incorporating grade as a sorting criterion. Furthermore, there could be educational and cultural differences between the two samples, i.e., Catalan and Argentinean students.
Another possible explanation for the low proportion of table formats refers to students’ motivation (an attitudinal factor). Attitudes are pre-existing evaluations about different aspects of reality, essentially involving a person’s disposition towards a specific situation and implying a judgment about it (Richardson, 2002). A constructivist perspective of learning (Pozo, 2017) encompasses cognitive, content and attitudinal aspects.
The study also analysed the influence of explicitness of the table prompt and the presence of an additional intermediate system (bar graph). The second one showed the main effects, with an inverse pattern depending on the school grade. For the sixth grade, higher-quality productions were observed in conditions without additional graphical information, and its presence is associated with the reproduction of the same diagram. Conversely, in the seventh grade, higher-quality productions occurred in the conditions that included the presence of the bar graph, especially the condition without explicitness of the expected format for a table. The findings regarding the seventh grade are consistent with the proposal by García-Milá et al. (2014), suggesting a facilitation relationship between tables and graphs. Nevertheless, the mechanism explaining this difference concerning the sixth grade is not clear. Future research should address this aspect.
The findings regarding the explicitness of the culturally expected prompt for a cross-tabulated table challenge the initial hypothesis. Contrary to expectations, the presence of the prompt did not lead to a higher proportion of table-like formats. This could be attributed to participants potentially overlooking the section that explicitly outlined the expected table structure. Additionally, the limitations of a simple prompt in teaching the complex processes involved in culturally teaching an external system could also explain these results.
Among the main limitations of the study, it focused on sixth- and seventh-grade students in a specific context. Replicating the study in earlier and later years of formal education, as well as in diverse educational contexts, would be necessary. Secondly, the overall mathematics ability of the participants was not controlled; however, students did not work with statistical content during the academic year (homogeneity). Thirdly, a quasi-experimental approach was employed to promote feasibility. When working with intact groups, there was limited control over extraneous variables linked to idiosyncratic aspects of each class, for example, group dynamics or overall academic achievement.
Initially, students do not exhibit a pronounced inclination to use tables as a primary means of data representation. Nevertheless, the ability to interpret and construct tables is a fundamental competence for social life, since it facilitates improved communication of specific types of data. It is crucial to design strategies that enhance students’ motivation, such as linking them to contexts (Wild & Pfannkuch, 1999) that generate interest (for example, organizing data about the class study trip). Furthermore, increasing familiarity with statistical tables is relevant, starting from earlier educational levels, or incorporating them more extensively into various curricular subjects. Secondly, the identification of different levels of individual competence in table construction allows consideration of the specific needs and skills of each student. An alternative could be to initiate the process from other spontaneous statistical productions, such as lists sorted by height, or even from non-statistical tables, in order to advance towards the generation of authentic contingency tables.