
Abstract
This study examines price discovery and volatility linkages between USD/INR spot and futures contracts in India and between USD/INR futures contracts on National Stock Exchange of India Limited (NSE), India and on three international exchanges, namely Singapore Exchange (SGX), Dubai Gold and Commodity Exchange (DGCX) and Chicago Mercantile Exchange (CME), from 29 August 2008 to 30 March 2015. Findings show that, at domestic level, the futures dominate spot in the Indian currency market; these findings are stronger than those in an earlier study, indicating improved pricing as well as hedging efficiency in the Indian currency market. At international level, NSE is dominated by both CME and DGCX in price discovery and in short-term volatility spillovers, while NSE dominates both exchanges in long-term volatility spillovers. Further, NSE dominates SGX in the international information process. The dominance of CME and DGCX over NSE may be on account of their several advantages such as longer trading hours, operations being open even after NSE has shut business, much lower trading costs as well as lower regulatory restrictions. The study provides several significant policy suggestions for improving efficiency of the Indian currency market and is also relevant for foreign portfolio investors (FPIs), domestic investors, researchers and academicians. It contributes to literature on information transmission relating to currency markets in emerging economies.
Keywords
Introduction
The foreign currency market is a key component of the financial market system that serves as a bridge between the domestic economy and the rest of the world, by facilitating transactions with the global economy for all goods and services. In addition, it serves as a credible barometer of the stability of an economy, both externally and internally, with its influence permeating the real sector as also the financial and monetary sectors. For these reasons, all countries strive to maintain requisite stability in the exchange rates by building up adequate foreign exchange reserves that lend credibility to nations’ financial strength and provide critical support in times of financial distress. Stable exchange rates also have significant implications for the quantum and direction of external trade, besides having a salutary impact on portfolio investment flows. Investors and consumers rely heavily on stable exchange rates to ensure that their investment and expenditure plans are viable and get implemented fully. All these activities are critically dependent on the prevailing (spot) foreign exchange rate as well as the likely rate in the future (futures prices), particularly in the short to medium term, as these rates determine, to a very large extent, the timing, frequency and size of individual transactions. However, at times, turbulence in currency markets leads to such plans going askew, potentially halting the growth of economies. Hence, price and volatility movements in currency markets are of vital significance, particularly with respect to the implications arising from lead–lag relationships in price discovery as well as risk management implications of volatility transmission within and across the currency markets, both domestically and internationally. Therefore, this article is aimed at studying the currency market with respect to price discovery and volatility linkages within India as well as across counterpart exchanges abroad.
In India, the spot market for foreign currency is an Over-The-Counter (OTC) market, regulated by the Reserve Bank of India (RBI). A reference rate 1 for rupees per US dollar (referred to as USD/INR) is announced by the RBI on all business days, and this rate is used for determining the official exchange rates for other important foreign currencies. Futures and options (F&O) were introduced in the foreign currency market in India on 29 August 2008, beginning with the US dollar, followed by contracts against three other currencies, namely, euro (EUR), Great Britain pound (GBP) and Japanese yen (JPY). For the present study, USD/INR has been selected to represent the currency market in India, as it accounts for more than 95 per cent of the total volume in terms of number of contracts of all the four foreign currency futures in India during 2010–2011 to 2014–2015 (Table A1). For the same reason, the National Stock Exchange of India Limited (NSE) is the domestic exchange selected for the study, as it has the highest volumes (49%) in terms of the number of contracts among the three domestic exchanges 2 dealing in currency futures in India (Table A2).
Globally, USD/INR futures are offered for trading at the Dubai Gold and Commodity Exchange (DGCX) since 7 June 2007 (i.e., even before USD/INR futures trading was launched in India), and at the Chicago Mercantile Exchange (CME) since 28 January 2013 as well as at the Singapore Exchange (SGX) since 11 November 2013. They are also offered at the Intercontinental Exchange (ICE), USA, since 26 November 2013, but the volumes are negligible. Volumes at all the three major international exchanges in terms of number of contracts are lower than those at NSE. Among the international exchanges, volumes are highest at DGCX, followed by SGX, with CME having the lowest volumes (Table A2). It is noted that contract size at these international exchanges is much bigger, as it is ₹2 million (approximately USD33,000) at SGX and DGCX, and ₹5 million (approximately USD82,000) at CME, while it is USD1,000 at NSE. Hence, volumes at the exchanges have been examined in terms of the value of trading, but on this basis also, NSE has higher volumes as compared to CME and SGX, and lower only as compared to DGCX (Table A3).
USD/INR futures are also offered in OTC markets abroad as non-deliverable forward (NDF) contracts, in centres such as London and Singapore. The NDF markets deal in cash-settled, short-term contracts, on which little information is available in public domain. Hence, this segment is not included in the study. Options on USD/INR spot were introduced in India on 29 October 2010, and globally, were first launched in DGCX on 26 September 2011, followed by CME on 28 January 2013 and by SGX in August 2016. Since trading in foreign currency options was introduced abroad much later and globally, the volumes 3 are negligible, options are not covered in the study. The major contract specifications of USD/INR futures, including trading hours and trading costs at each sample Exchange (NSE, DGCX, CME and SGX), are given in Table A4.
In 2013, the USD/INR rate witnessed unusual volatility, particularly when it jumped from a level below 55 in May (53.82 on 2 May 2013) to almost 70 in August (68.83 on 28 August 2013). The major factor was global uncertainty following the May 2013 announcement by the US Federal Reserve about its intent to withdraw quantitative easing, which led to a bout of depreciation in currencies of emerging economies. 4 There was also growing apprehension about sovereign default in the euro area. In July 2013, RBI 5 prohibited banks from taking proprietary positions, doubling the initial and extreme loss margins, and reducing client limit positions from ‘higher of’ to ‘lower of’ 6 per cent of open interest or USD10 million, while also reducing member limits from ‘higher of’ to ‘lower of’ 15 per cent of open interest or USD100 million. As the USD/INR rate stabilized, from June 2014 6 onwards, foreign portfolio investors (FPIs) were permitted to participate in currency derivatives subject to specified position limits, and even beyond these limits with exposure linked to their net worth exposure in the debt and equity securities in India. Further, banks were allowed to once again take proprietary positions, and domestic participants were permitted to take positions exceeding USD10 million after establishing existence of underlying exposure. Subsequently, position limits were enhanced for domestic clients and FPIs from USD10 million to USD15 million for USD/INR and USD5 million for the other three currency pairs per exchange, without having to establish underlying exposure. 7 However, the USD/INR rate, in general, appears to have become more vulnerable due to factors such as declining ratio of foreign exchange reserves to external debt, 8 increasing private sector external debt 9 and a sharp fall in the growth rate in the economy. 10 The inflation gap as well as the interest rate gap between USA and India may have also contributed towards the exchange rate volatility. 11 Resultantly, the annual average USD/INR rate declined from a level of 54.41 in 2012–2013 to 61.14 in 2014–2015. 12 Such movements in the price level as well as fluctuations in the USD/INR rate have significant implications for the economy, particularly through impact on exports, imports, the Balance of Payments (BOP) position, unemployment and growth. The increase in the exchange rate exposure due to rupee depreciation must have also severely hurt the balance sheets of corporate sector in India. Under the circumstances, it is of special interest to study the price discovery and volatility spillovers within the USD/INR markets in India and abroad with a view to arriving at possible policy suggestions to strengthen the currency derivatives market in India.
In view of the above, the objectives of the study are as follows: (a) to examine the domestic information linkages in terms of price discovery between the spot and futures segments of the currency market for USD/INR in India, and international linkages between USD/INR futures in India and the counterpart platforms abroad; (b) to examine the domestic and international linkages in terms of volatility spillovers; and (c) to provide policy suggestions for achieving higher efficiency of the currency market in India as compared to the counterpart markets abroad.
This rest of the article is organized into the following sections: the second section provides a review of relevant literature; the third section gives details of the data; the fourth section describes the methodology and empirical results along with their interpretation relating to price discovery; the fifth section describes the methodology and results along with interpretation relating to volatility spillovers; and finally, the sixth section contains the summary, conclusions and policy suggestions.
Review of Literature
This section begins with the concept of ‘information linkage’, followed by discussion on the two linkages included in the study, namely price discovery and volatility spillovers. For each linkage, available empirical evidence relating to currency markets is presented, while delineating studies on foreign and Indian markets.
In the context of financial markets, ‘information’ is typically defined as innovations from asset pricing models or as volatility in the returns of an asset. Concomitantly, ‘information linkage’ refers to the process of information flow, that results in transmission of price and volatility, as well as other signals between markets, reinforcing linkages among them. Hence, the focus of studies on information linkages is on the impact of innovations or volatility in one market, on returns or volatility in another market.
Price Discovery
The price discovery function refers to the ability to discover present and future equilibrium prices (Cheung & Fung, 1997). During the price discovery process, lead–lag relationships usually emerge between markets, primarily from asymmetries in information between them. Pascual, Pascual-Fuster, and Climent (2006) indicate two sources of information asymmetries between markets: (a) agents revealing superior information through trading, causing transitory differences in markets’ expectations, and (b) public announcements providing the market that has superior processing capacity with temporary advantage over other markets. Thus, the direction and strength of information flows across different financial markets are important determinants of the efficiency of individual markets.
In empirical literature on price discovery relating to currency markets, Chiang, Yang, and Wang (2000) analyse the interaction of national stock returns with foreign exchange rate changes in eight Asian countries from January 1990 to February 1998, and their results suggest that appreciation of the national currency encourage higher stock returns. Tse, Xiang, and Fung (2006) use data on euro and Japanese yen, and conclude that electronic trading platforms are more conducive to price discovery than floor trading. Bhargava and Malhotra (2007) analyse trading in futures in four currencies during 1982–2000 and conclude that day traders and speculators destabilize the market for futures, but it is inconclusive whether hedgers stabilize or destabilize the market. Andersen, Bollerslev, Diebold, and Vega (2007) study the impact of real-time US macroeconomic news on US, German and British stock, bond and foreign exchange markets from July 1998 to December 2002, using most actively traded nearest-to-maturity contracts, and show highly significant contemporaneous cross-market and cross-country linkages, thereby pointing towards important direct spillover effects among foreign and US markets.
Rosenberg and Traub (2008) study the spot and futures market for Swiss Franc, Deutsche mark, yen, British pound and euro on the CME, covering two separate periods, May to August 1996 and March to May 2006, and find that during the first period, futures market has greater information content, although spot market has larger volumes, while in the second period, the dominant market share is held by the spot market, leading them to emphasize the key role played by the much higher transparency of the futures market in the earlier period. Cabrera, Wang, and Yang (2009) report that information found in the spot market leads the futures market for the euro and lags for the yen.
Chen and Gau (2010) show that spot market provides greater contribution to price discovery than futures market does, and that news releases on GDP, employment and durable goods have a positive impact on price discovery of foreign exchange futures rates, confirming that information flow is an important determinant in price discovery. Boyrie, Pavlova, and Parhizgari (2012) investigate price discovery role of spot and futures markets during January 2005 to March 2011 and using the vector error correction model (VECM) conclude that futures market has a more prominent role in price discovery for the Brazilian real, the spot market has a leading position in the Russian rouble, while the South African rand results are mixed. Garcia, Medeiros, and Santos (2014) also study the Brazilian foreign exchange markets between January 2008 and June 2013, and find that futures market dominates price discovery, primarily ascribing the result to the spot market transactions being highly decentralized with access typically provided to a few financial intermediaries, while futures market are characterized by publicly traded prices with broad access to financial and non-financial institutions, both of which are key market efficiency drivers. Chen and Gau (2015) also study the role of foreign exchange market intervention by the Japanese government in the price discovery process of the USD/JPY market during January 2003 to December 2004 and find that when Japanese authorities intervene in the market, dealers tend to adjust to new information faster than on days when no intervention occurs, perhaps because intervention reduces magnitude of asymmetry in bid and ask prices.
In the Indian context, Guru (2010) studies USD/INR futures and underlying spot exchange rates in India during 29 August 2008 (the date of commencement of currency futures contracts on the NSE) to 28 August 2009 and conclude that returns in futures markets drive returns in spot markets, indicating higher information content and information advantage of futures markets. However, Sriram and Senthil (2013) study the same contracts from June 2009 to July 2013 and find the spot prices correcting disequilibrium in the market, along with unidirectional causality from the spot to the futures. Sehgal, Ahmad, and Deisting (2015) examine four major international currencies (USD/INR, euro/INR, GBP/INR and JPY/INR) traded on two Indian trading platforms (NSE and MCX-SX 13 ) during February 2010 to February 2012 and show the futures prices leading the spot prices, thereby supporting Guru (2010), while also suggesting pricing efficiency between the spot and futures as well as efficient information transmission between the two Indian exchanges.
Volatility Spillovers
Giannellis, Papadopoulos, and Kanas (2010) state that volatility is much of concern as it is one indication of the level of risk in the market or portfolio over a period of time. Transmission of volatility from one market to another, referred to as ‘volatility spillover’, essentially refers to the impact of an innovation (information) from one market (or one segment of a market) on the conditional variance of another market (or another segment of the same market). An alteration in volatility in one country’s financial market might be affected by financial market volatility of other countries, referred to as volatility spillover effects (Kalemli-Ozcan, Sorensen, & Volosovych, 2010; Ke, Wang, & Murray, 2010). In recent literature, Mwambuli, Xianzhi, and Kisava (2016) state that volatility spillover usually results from normal interdependence among market economies and can be transmitted across countries because of their financial linkages.
In empirical literature, Engle, Ito, and Lin (1990), Baillie and Bollerslev (1991), Dacorogna, Muller, Nagler, Olsen, and Pictet (1993), and Hogan and Melvin (1994) emphasize the transmission of volatility across trading centres and time, through the so-called meteor shower effect, reflected in a volatile Tokyo market being followed by a volatile New York market. Chatrath, Ramchander, and Song (1996) examine the relationship between currency futures trading and volatility in spot rates of the British pound, Canadian dollar, Japanese yen, Swiss franc and Deutsche mark, and provide strong evidence of trading activity in futures having a positive impact on conditional volatility in spot changes, with a weaker feedback in the reverse direction. Cheung and Fung (1997) study information flows between Eurodollar spot and futures markets from January 1983 to July 1997 and show that movements in spot rates and their volatility tend to induce fluctuations in futures data, but futures rate tends to have a stronger impact on the spot rate. They also show causality in variance results, providing evidence of volatility spillover between the two markets.
Ito, Lyons, and Melvin (1998) study spot quotes of yen/dollar and mark/dollar between September 1994 and March 1995 in Tokyo foreign exchange market (which till 1994, was restricted from trading over lunch break (12:00 to 1:30 local time), and using a generalized autoregressive conditional heteroscedasticity (GARCH) model, conclude the presence of private information in the foreign exchange market, as lunch time return variance is seen to double with introduction of trading, which the study points out cannot be due to public information since flow of public information did not change with the trading rules. Kanas (2000) investigates the interdependence of stock returns and exchange rate changes within the same economy for six industrialized countries (US, UK, Japan, Germany, France and Canada), and using a bivariate EGARCH model, finds evidence of volatility spillovers from stock returns to exchange rate changes for all countries except Germany, but insignificant volatility spillovers in the reverse direction for all the countries. Bodart and Reding (2001) use a bivariate two-factor, two-country GARCH model of stock returns and exchange rate fluctuations from 1990 to 1998 and show that exchange rate fluctuations exert a significant, although small, influence on the mean and volatility of industry stock returns.
Fang and Miller (2002) use a bivariate GARCH-in-mean (GARCH-M) model of stock market returns proxied by the Korea Composite Stock Price Index (KOSPI) of South Korea from January 1997 to December 2000 and find that currency depreciation has statistically significant effects on stock market returns and importantly alters stock market investment decisions, thereby concluding that small open stock markets are vulnerable to exchange rate movements. Giampiero and Otranto (2008) examine volatility spillovers, interdependence and co-movements between five Asian markets using multi-chain Markov switching model and find that volatility in one market reacts to innovations in other markets as a result of financial integration. Oduncu (2011) studies the impact of introduction of currency futures trading on volatility of underlying currency market for Turkey during 2002–2008 employing GARCH (1, 1) model and shows that volatility of spot market is reduced due to introduction of currency futures trading and also increased the speed at which information is impounded into spot market prices. Jayasinghe, Tsui, and Zhang (2014) study five developed markets (USA, UK, Canada, Japan and Australia) and four emerging markets (Korea, Singapore, Taiwan and Thailand) during January 1999 to July 2012, using a modified trivariate BEKK-GARCH-M model of Engle and Kroner (1995), and find the presence of strong persistence and volatility clustering in the exchange rate markets, implying existence of strong volatility spillover effects in these markets. Do, Brooks, Treepongkaruna, and Wu (2016) examine linkages both within and between stock and foreign exchange markets via three higher moments of return distributions (volatility, skewness and kurtosis) for 27 national stock market indices and foreign exchange quotes during January 1997 to May 2010 and find that cross-asset market linkages are of a similar magnitude to intra-asset-market linkages within emerging markets but the latter are stronger in developed markets.
In the Indian context, Mishra, Swain, and Malhotra (2007) study daily closing return values of four indices—Sensex of BSE, BSE National index of 100 scrips, S&P CNX Nifty and S&P CNX 500—during January 1993 to December 2003 using AR (1)-GARCH (1, 1) framework, and conclude that bidirectional volatility spillover exists between the Indian stock market and foreign exchange market with exception of S&P CNX NIFTY and S&P CNX 500. Sharma (2011) examines relationship between USD/INR futures at NSE and exchange rate volatility in India from April 2008 to February 2011 and show existence of two-way causality between volatility in the spot and futures markets, with volatility of spot rate being greater after introduction of currency futures. Palakkod (2012) studies volatility spillovers between the Indian stock, commodity and foreign exchange markets during June 2005 to March 2010, and using AR (1)—GARCH(1, 1) methodology, finds evidence of volatility spillovers from currency and commodity markets to capital markets, and from capital to currency market, but no spillovers to commodity markets from either of the other two markets, concluding that internationalization of stock markets, liberalized capital flows and large foreign investment in equity markets in India have led the stock and foreign exchange markets to be increasingly interdependent.
Sriram and Senthil (2013) find evidence of volatility spillovers from the spot to the futures price, but not in the reverse direction. Singhal and Mahajan (2013) and Goyal and Mittal (2014) study the impact of currency futures trading on USD/INR volatility in India using GARCH (1, 1) model from March 2000 to December 2010 and find increase in volatility of the spot market after introduction of currency futures in India. Singh and Tripathi (2014) investigate the impact of currency derivatives on spot market for GBP/INR and EURO/INR, respectively, during April 2006 to December 2013, and find a decline in spot market volatility after introduction of currency derivatives. Sehgal et al. (2015) use BEKK-multivariate GARCH model and find the presence of bidirectional ST volatility spillovers between futures and spot markets, stronger from the futures to spot, while in the LT, unidirectional spillovers exist in the reverse direction.
As may be seen from the above, currency markets abroad have been analysed in depth over the years, both in terms of price discovery and with respect to volatility spillovers. Studies also exist on currency markets in India, but there is little evidence regarding linkages between the domestic and international platforms where USD/INR futures are traded, and accordingly, sufficient findings do not exist on whether the spot market or the futures market plays the leadership role in the country. The lack of literature could perhaps be ascribed to currency futures having been introduced in India only in 2008. However, since currency futures are now being offered in India as well as on exchanges abroad, it is striking that the international dimension of USD/INR trading seems to be totally missing in literature. Moreover, the existing studies on linkages do not cover any period after 2013, although currency markets witnessed considerable volatility after this period (Basu, Eichengreen, & Gupta, 2014). These important research gaps are sought to be filled through the present study.
Data Description
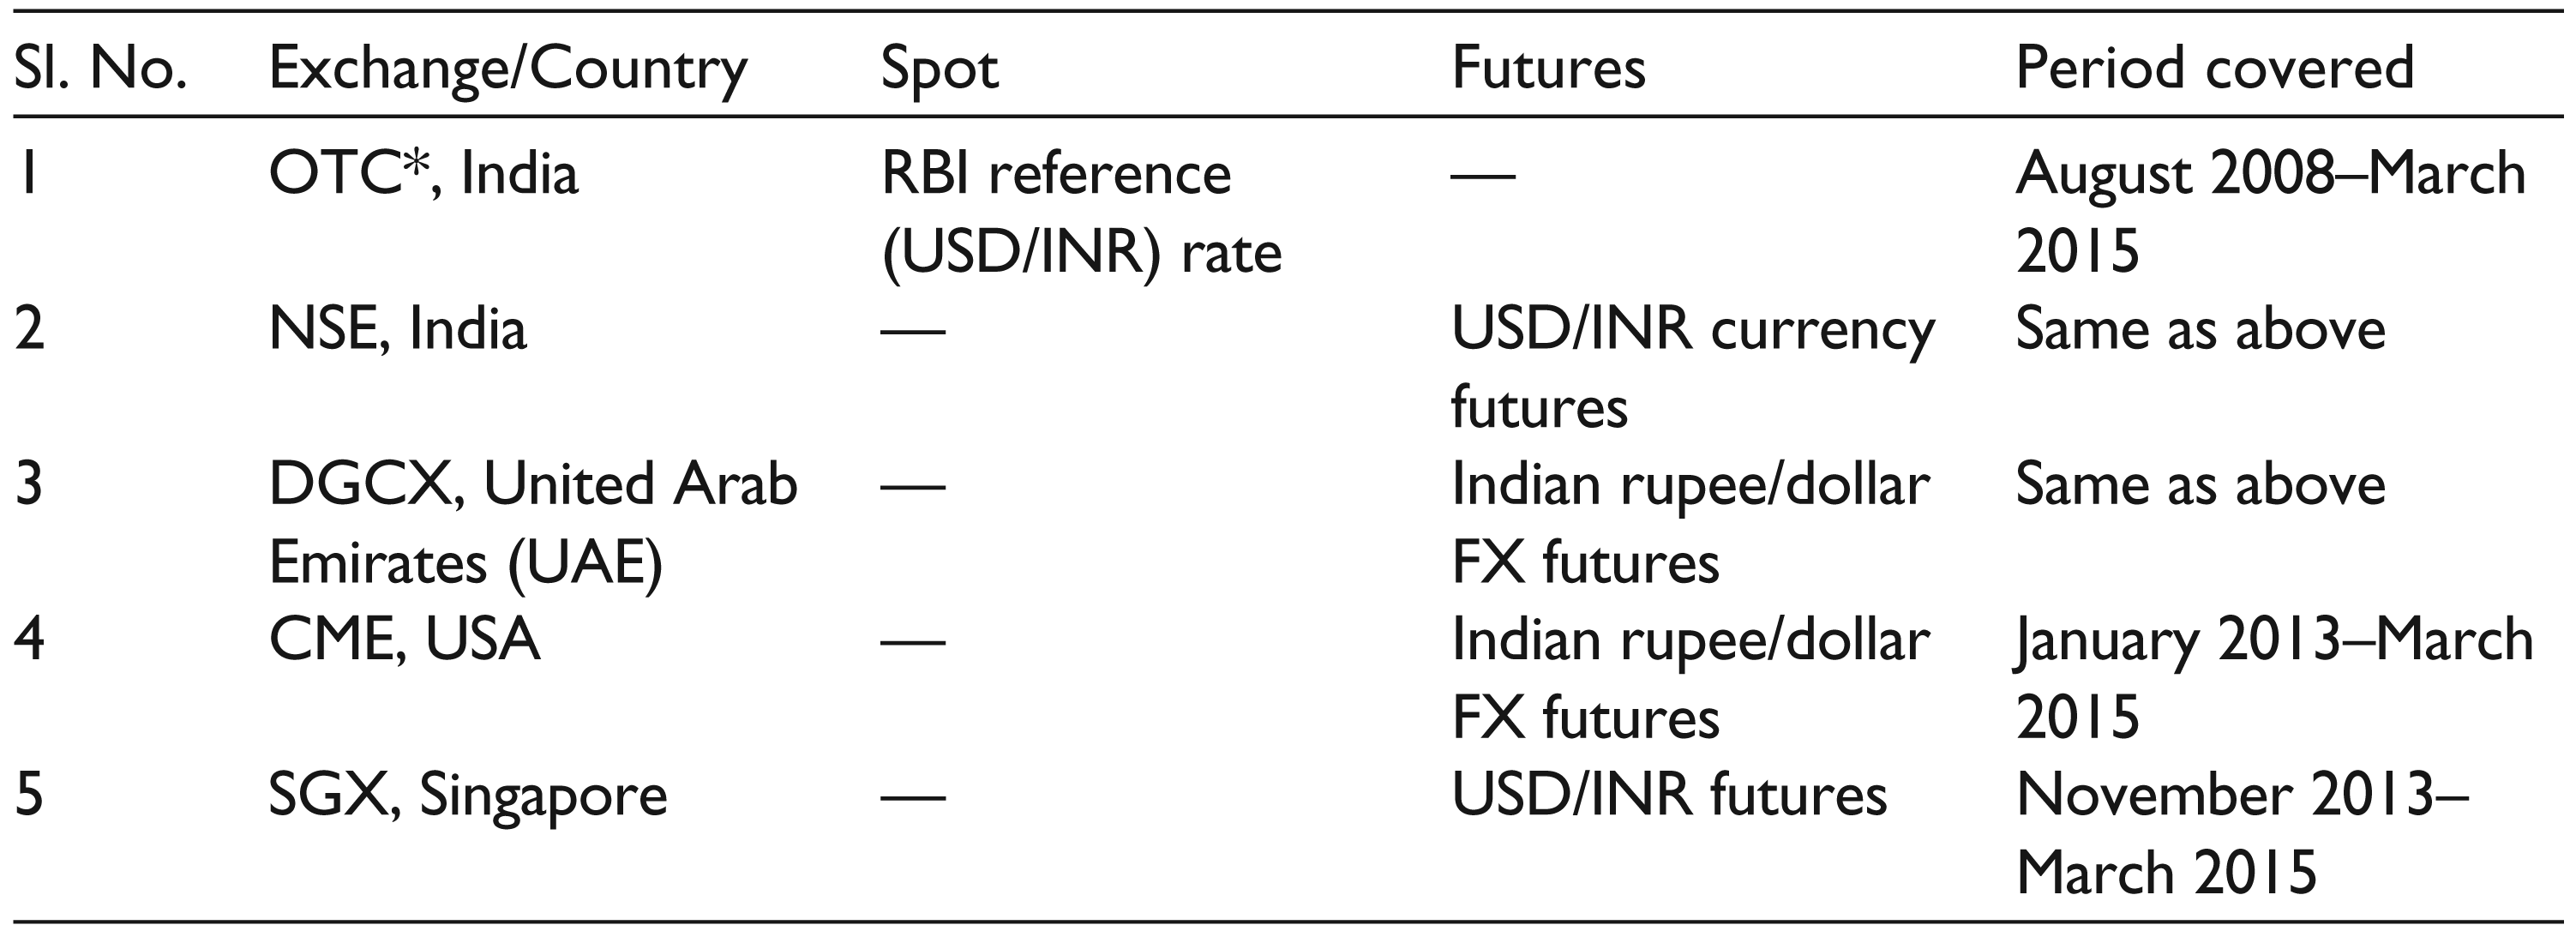
The study uses price series of the rupee/dollar spot rate announced by the RBI, as well as price series of the rupee/dollar futures contracts traded on the NSE and on three international exchanges (i.e., DGCX, CME and SGX). The spot series consists of the daily reference rate announced by the RBI on all business days based on the domestic OTC market, while the futures series consists of the daily closing prices of the futures contracts nearest to maturity, at the respective exchanges. The period covered is 29 August 2008 (i.e., the date on which currency futures were introduced in India) to 31 March 2015, except for CME and SGX where USD/INR futures were introduced with effect from 28 January 2013 and 11 November 2013, respectively. Hence, for analysis relating to these two exchanges, data on USD/INR futures at NSE have also been taken from the respective dates. Pairwise analysis has been undertaken between domestic spot and futures series of USD/INR and between domestic and international USD/INR futures, after excluding non-trading days. Spot prices from RBI and futures prices at NSE are available in rupees per US dollar, while the futures prices at the international exchanges are in US cents per ₹100. For international comparisons, futures price series at NSE are converted into US cents per ₹100, using direct (or American) quote. For each data series, prices are converted into daily log returns by taking the first difference of the log-transformed series. All futures price data have been extracted from the Bloomberg database while spot price data have been taken from RBI. The exchanges and USD/INR contracts selected for the study and the period covered are summarized in Table 1.
Trading Platforms, Contracts and Period Covered for USD/INR
Price Discovery Process—Domestic and International Linkages
Methodology
Johansen’s (1991) cointegration procedure is undertaken for pairs of series, followed by the VECM to obtain the lead–lag relationship for each pair that are reconfirmed through the Granger causality test. Testing of the price discovery process is undertaken at domestic and international levels separately: (a) at domestic level between USD/INR spot rates announced by RBI and futures segment on NSE, and (b) at international level for all pairs between USD/INR futures on NSE, SGX, CME and DGCX. Analysis is undertaken separately for the domestic and international levels because domestic and international markets have significant differences in characteristics, particularly in terms of the nature of participants and the trading platforms. In the domestic market, particularly in the futures segment, entities availing buyers’/suppliers’ credit constitute a sizeable segment of the market who usually operate at lower volumes and for shorter periods, as compared to international markets that are dominated by institutional investors and corporates engaged in currency transactions for commercial purposes, mainly for procuring capital goods, involving investments for longer periods and typically also higher volumes. This is evident from the much bigger size of contracts available at the international exchanges as compared to the size on the domestic exchange (Refer to section ‘Introduction’). Another difference pertains to the trading platforms, as the currency futures in India are traded on stock exchanges, while they are available on commodity exchanges abroad, except in Singapore (SGX). 14 Stock exchanges usually have different characteristics, for example, with respect to trading hours available, as compared to commodity exchanges.
The results obtained from various tests relating to the price discovery process are discussed to bring out policy suggestions for achieving higher efficiency of the currency market in India vis-à-vis foreign exchanges.
Descriptive Statistics
Descriptive statistics of return series are discussed below briefly but not presented here. However, they are available on request.
In the domestic market, USD/INR spot shows marginally higher returns and also higher volatility as compared to the futures. Both spot and futures series show positive skewness and leptokurtic distribution, implying non-normality which is confirmed by the Jarque–Bera (JB) statistic. The autoregressive conditional heteroscedasticity (ARCH) test on residuals indicates the presence of volatility clustering in both series. The Ljung–Box (LB) statistic confirms inter-temporal dependencies in prices. At the international level, daily mean returns on USD/INR futures are higher at SGX and CME as compared to NSE, while they are the same between DGCX and NSE. Volatility follows the same trend, except that it is marginally higher at DGCX as compared to NSE. All series are negatively skewed and leptokurtic, implying non-normality and also tend to have autocorrelation.
Empirical Results
Domestic Level
Cointegration results between USD/INR spot and futures series (Panel A of Table 2) based on trace and maximum eigenvalue, with the optimal lag length of 5 obtained through the Akaike information criterion (AIC), 15 establish the presence of at least one cointegrating relationship. The Vector Autoregressive (VAR) adequacy test is also met. The VECM results (Panel B of Table 2) show bilateral adjustment, with futures segment leading the price discovery process. The Granger causality test (Panel C of Table 2) also indicates bidirectional causality, stronger from futures to the spot segment, reconfirming the VECM result. Thus, bidirectional relationship exists between futures and spot segments, but futures segment leads the spot.
Price Discovery—Domestic-level Analysis for USD/INR
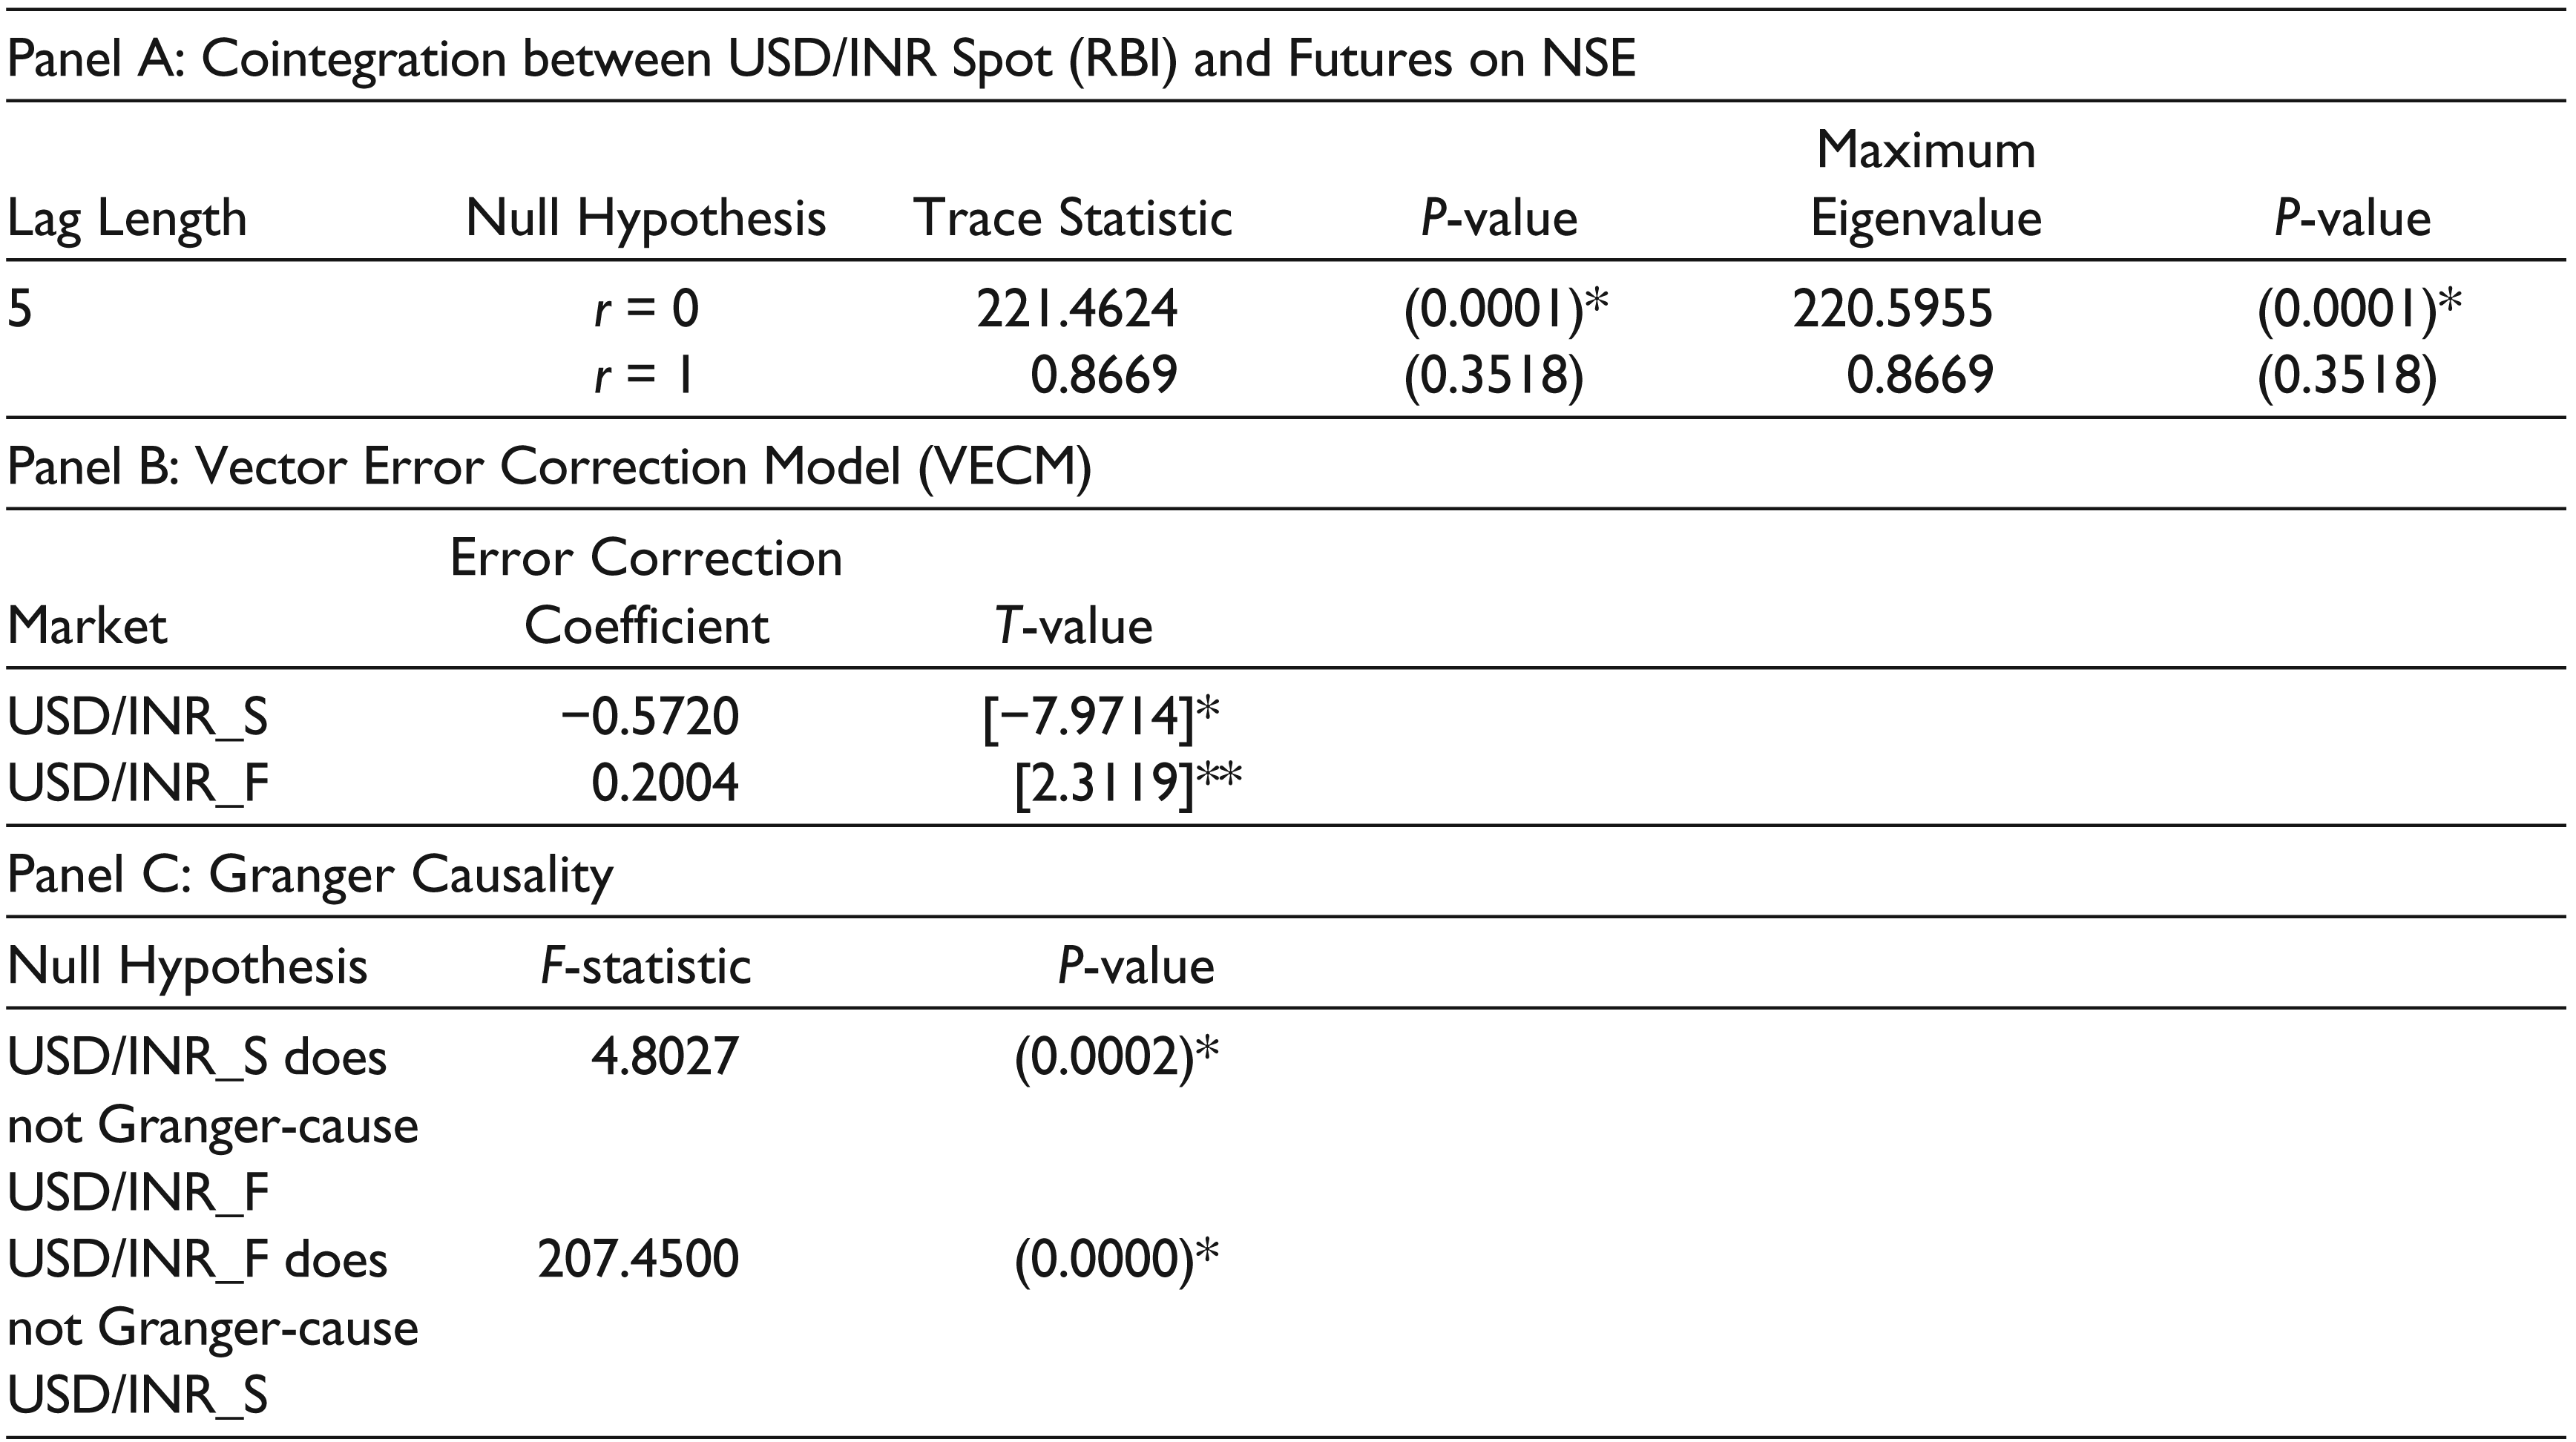
2. r = cointegration rank of the model.
3. USD/INR_S denotes USD/INR spot announced by RBI from OTC market in India; USD/INR_F denotes USD/INR futures traded on NSE, India.
4. Figures in brackets ( ) denote p-values; Figures in brackets [ ] denote t-values.
5. *Denotes significance at 1% level; **denotes significance at 5% level.
From investors’ perspective, there is limited fungibility of investment between spot and futures segments because both segments have different regulators (RBI and SEBI, respectively) and also because futures segment is exchange-traded, while the spot segment is an OTC market operating mainly through banks/financial intermediaries. Despite this handicap, the price discovery process between the two segments is bidirectional, which is encouraging. Further, since exchange-traded systems tend to be generally more efficient than OTC markets due to greater transparency and better price discovery, and considering that the futures segment is leading, it can be inferred that the currency market in India is informationally efficient. These results showing the lead position of USD/INR futures segment over the spot in price discovery in the domestic market support the results of Sehgal et al. (2015).
It is also to be noted that the leading role of futures segment in the domestic market is despite the marginally lower returns in the futures segments (refer to section ‘Descriptive Statistics’) as compared to the spot. This finding is significant as it points towards a growing interest among investors for participation in the futures market irrespective of the returns from the currency market, implying that currency futures are gradually emerging as an independent hedging tool in the foreign currency market in India. This development could partially be ascribed to a larger section of business population with exposure in US dollars, such as exporters and importers, hedging their foreign exchange risk. This perhaps has its roots in the losses that exporters faced during the global financial crisis in 2008–2009, arising from derivatives on foreign exchange receivables which they entered into, without complete understanding of derivatives’ operations and implications. At the same time, however, the losses also led the exporters, importers and other market participants in the external sector realize the potential benefits of currency derivatives as effective hedge against exchange rate fluctuations, provided positions are taken cautiously and consciously. It is, therefore, not surprising that futures segment is leading the spot segment in India. In addition, it could also have resulted from a number of recent developments in the currency futures market, namely, increased sophistication in financial technology, greater transparency in electronic trading and growing use of trading algorithms.
It is also important that entry of FPIs in exchange-traded currency derivatives has been permitted in India since June 2014, subject to specified position limits, and beyond these levels, exposure is linked to their net worth exposure in the debt and equity securities (refer to section ‘Introduction’). It can be reasonably presumed that as FPIs increase their participation in the futures segment, and as the market deepens and begins to offer better hedging opportunities, the futures segment may grow further. It may also gradually begin to attract the OTC-traded forwards 16 and swaps segment of currency trading to the exchanges in the form of futures, thereby further increasing exchange-traded exposure in currency futures. Although at present, volumes traded through banks in the spot market in India are far higher than volumes of futures contracts traded on the exchanges (Table A3), this trend may soon witness a reversal, as futures transactions rise in the country. Also, as is evident from Table A1, exposure in the futures market currently pertains mainly to the rupee/dollar trade (constituting more than 95% of total number of futures contracts). As the futures market matures in India, its profile will certainly undergo change. But is it not surprising that as of today, insofar as rupee/dollar trade is concerned, the futures market has already started to dominate the spot market, in a two-way process, with both markets receiving price signals from each other.
International Level
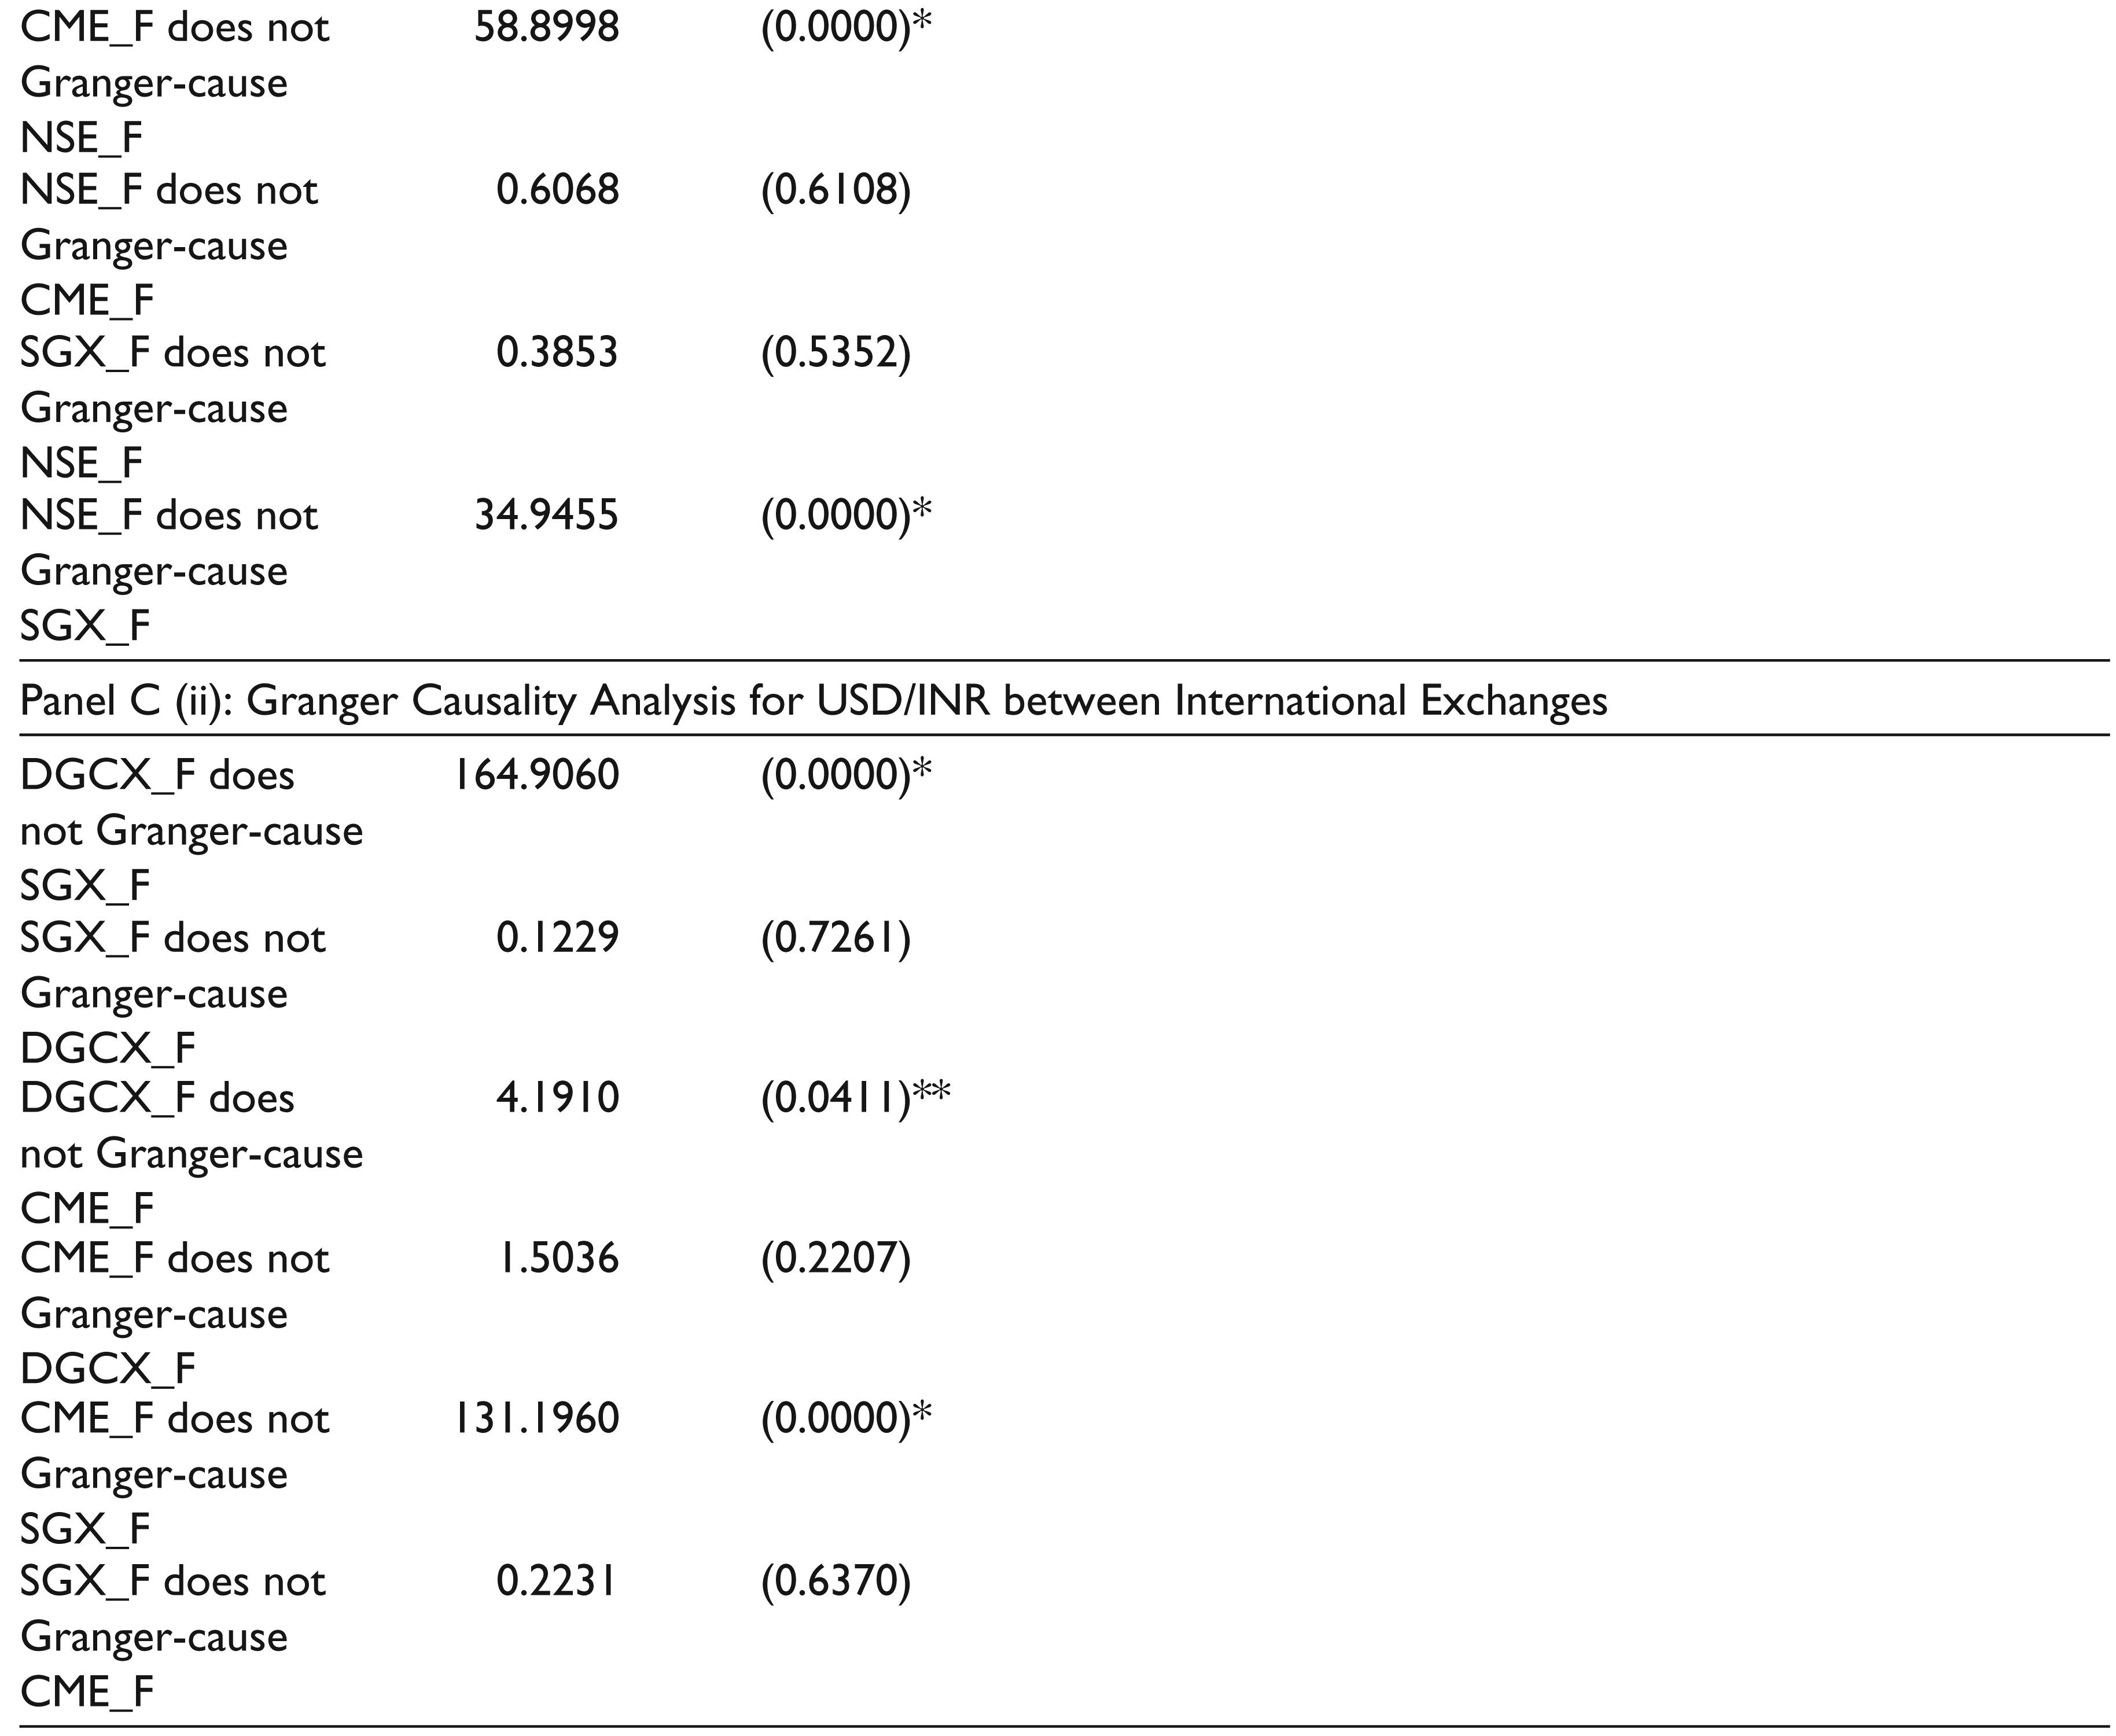
Cointegration results for pairs of platforms (Panel A of Table 3) show the presence of at least one cointegrating relationship between USD/INR futures at NSE and each of the three international exchanges, and also between pairs of international exchanges, confirming that all platforms share common long-run equilibrium relationship. The VAR adequacy test confirms that the model is appropriate. The VECM results (Panel B(i) of Table 3) indicate unidirectional adjustment towards long-term equilibrium between all pairs, with NSE leading only SGX while DGCX and CME both lead NSE in price discovery. Granger causality results (Panel C(i) of Table 3) reconfirm VECM results. Hence, NSE leads the price discovery process vis-à-vis only one international platform (SGX) while it is dominated by the remaining two international exchanges (DGCX and CME).
Price Discovery—International-level Analysis for USD/INR
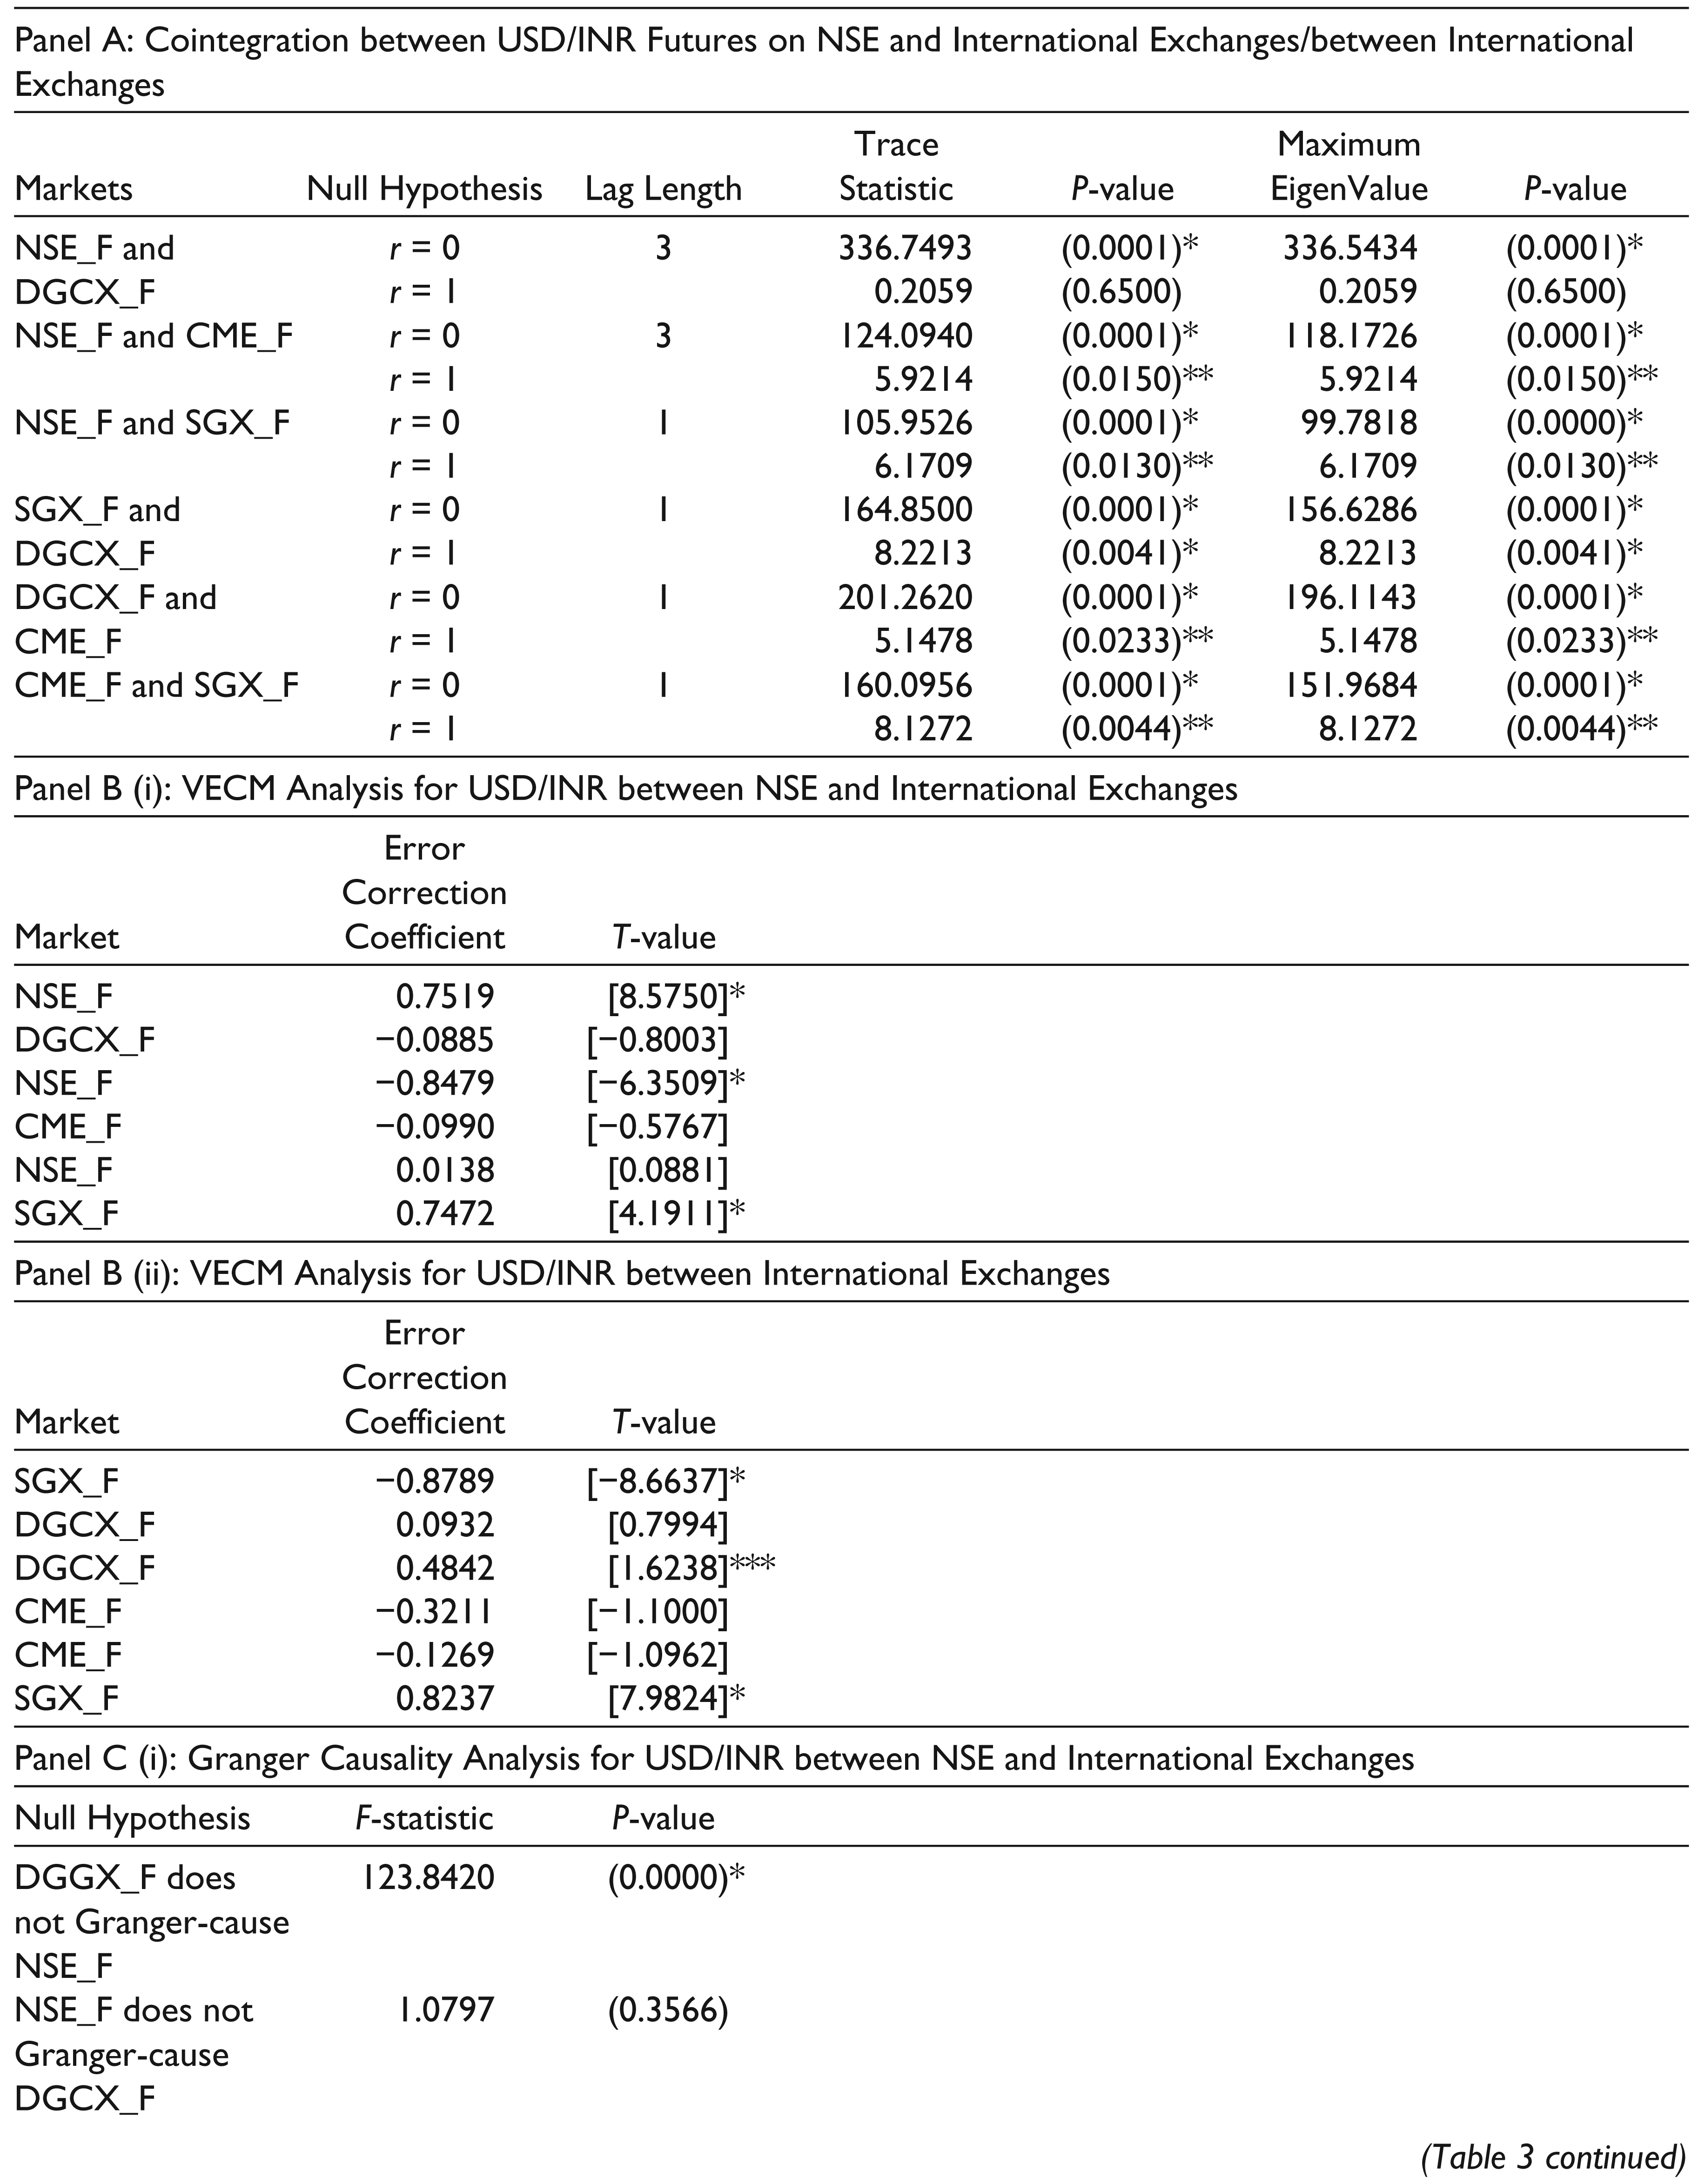
2. r = cointegration rank of the model;
3. NSE_F and DGCX_F denote USD/INR futures traded on NSE and DGCX, respectively; other pairs are interpreted in the same manner.
4. Figures in brackets ( ) denote p-values; figures in brackets [ ] denote t-values.
5. *Denotes significance at 1% level; **denotes significance at 5% level; ***denotes significance at 10% level.
As regards pairs of international platforms, VECM results for USD/INR futures (Panel B(ii) of Table 3) show unidirectional adjustment in all cases, with DGCX and CME both leading SGX, and CME marginally leading DGCX. Granger causality tests (Panel C(ii) of Table 3) reconfirm these results. Thus, CME which is the smallest exchange in terms of value traded leads DGCX as well as SGX, despite DGCX having the highest volumes of USD/INR futures among the international exchanges, followed by SGX. The relationship between the domestic USD/INR spot segment and international platforms has also been examined, and domestic spot is seen to dominate USD/INR futures only on SGX. These results are not reported, but are available on request.
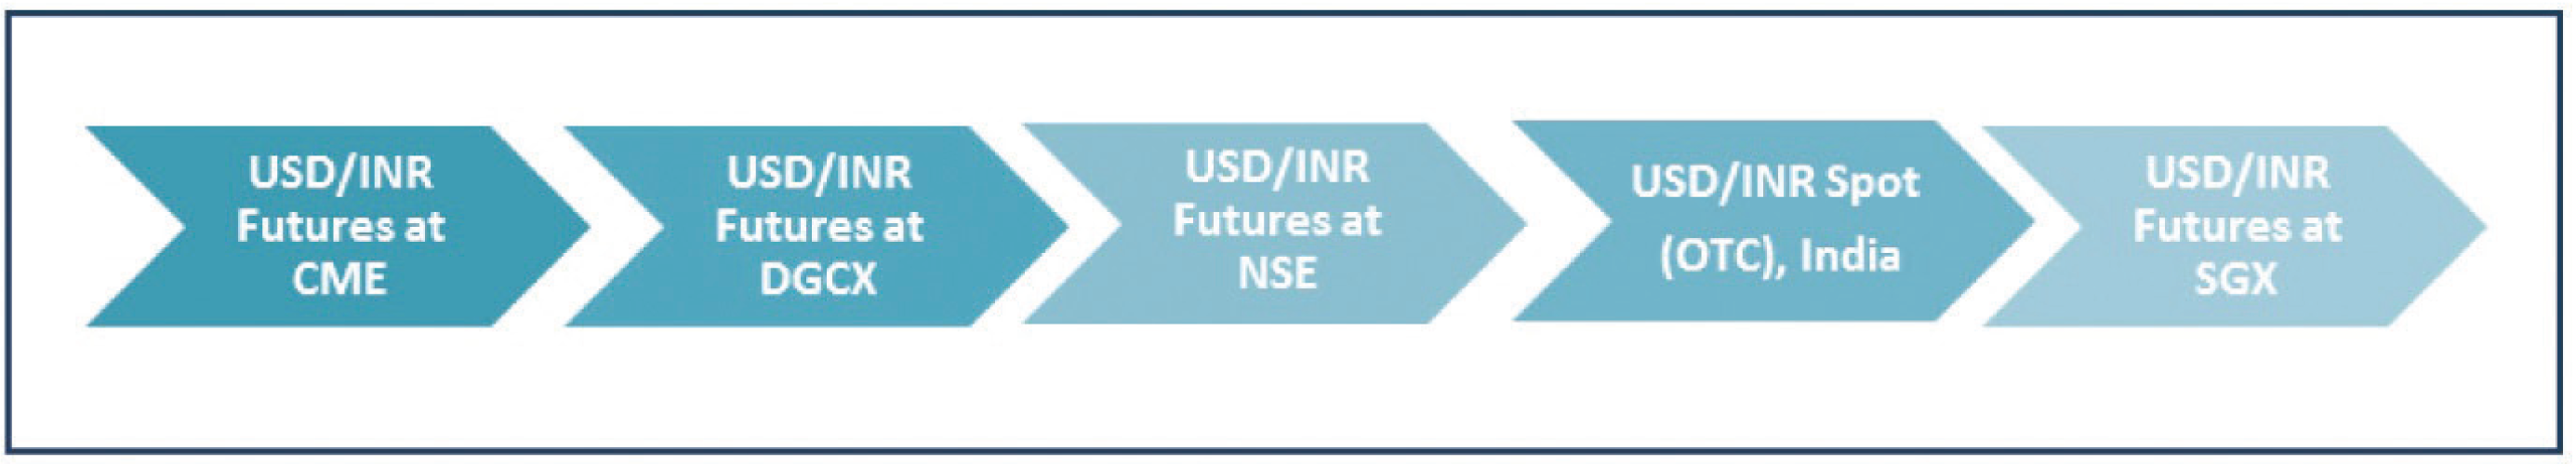
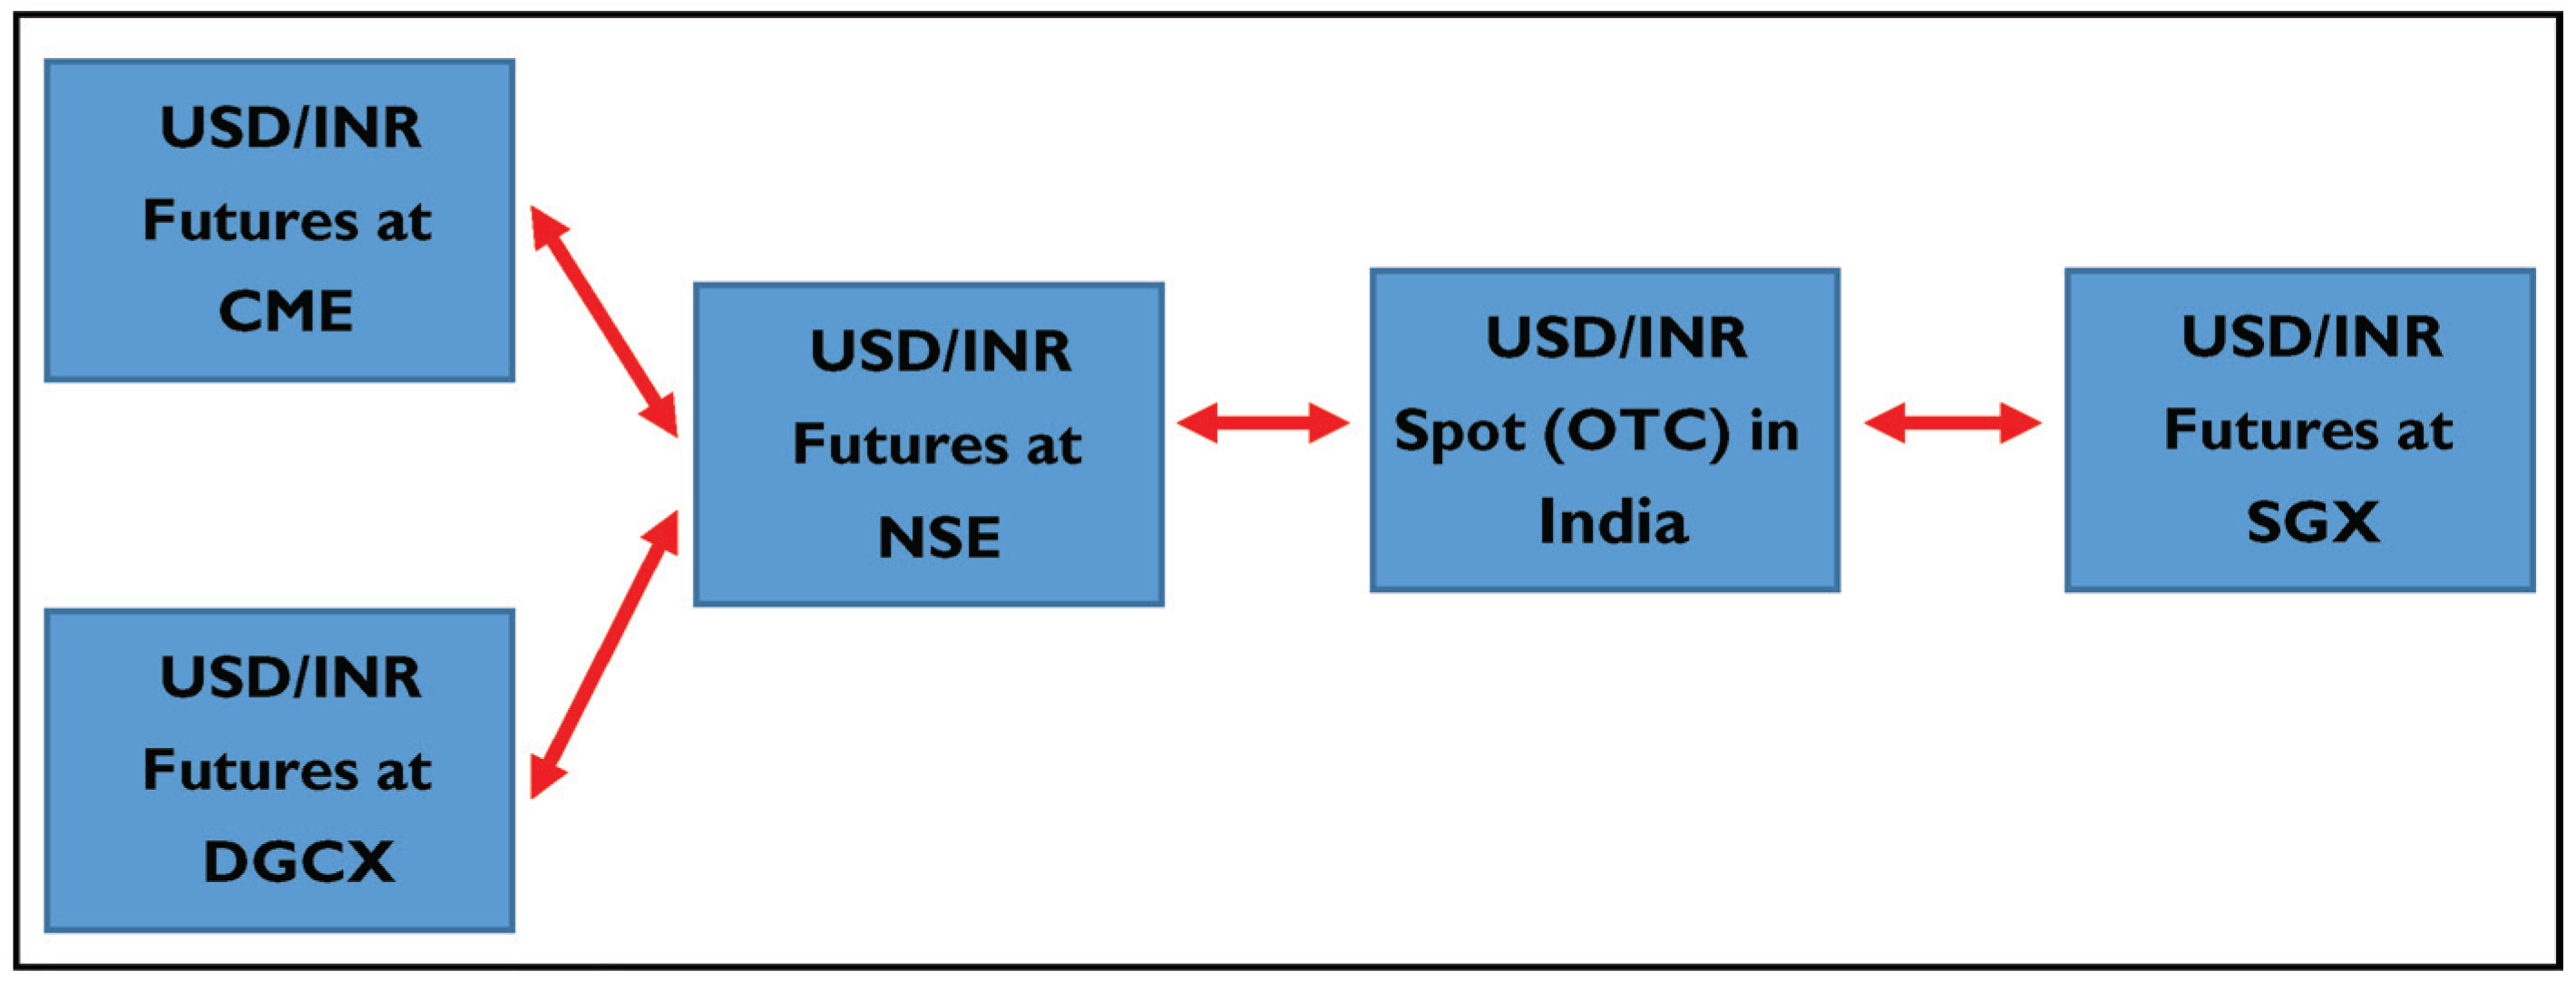
Considering the price discovery results at the domestic and international levels together, the transmission of price signals appears to originate from USD/INR futures at CME, which move to DGCX, and from there to the futures segment in India on NSE, followed by movement to the USD/INR spot in the OTC market in India, and finally to USD/INR futures at SGX. Thus, the complete information path for transmission of USD/INR price signals becomes evident, which can be depicted graphically as given in Figure 1.
The NSE leading SGX in price discovery is not surprising as NSE has considerably higher volumes in terms of number of contracts as well as in terms of value traded compared to those at SGX (Tables A2 and A3, respectively). Higher volumes give greater liquidity to NSE and, therefore, perhaps evince greater interest from investors. But the leading position of CME and DGCX vis-à-vis NSE appears surprising because volumes in terms of number of contracts traded are considerably higher at NSE compared to volumes at both CME and DGCX (Table A2). However, with respect to value traded, volumes are still higher at NSE as compared to CME, but they are lower at NSE as compared to DGCX (Table A3). Hence, while DGCX’s dominant position could be attributed to higher volumes, CME’s dominant position perhaps flows from the general perception that it ought to be the price leader, rather than on account of higher volumes.
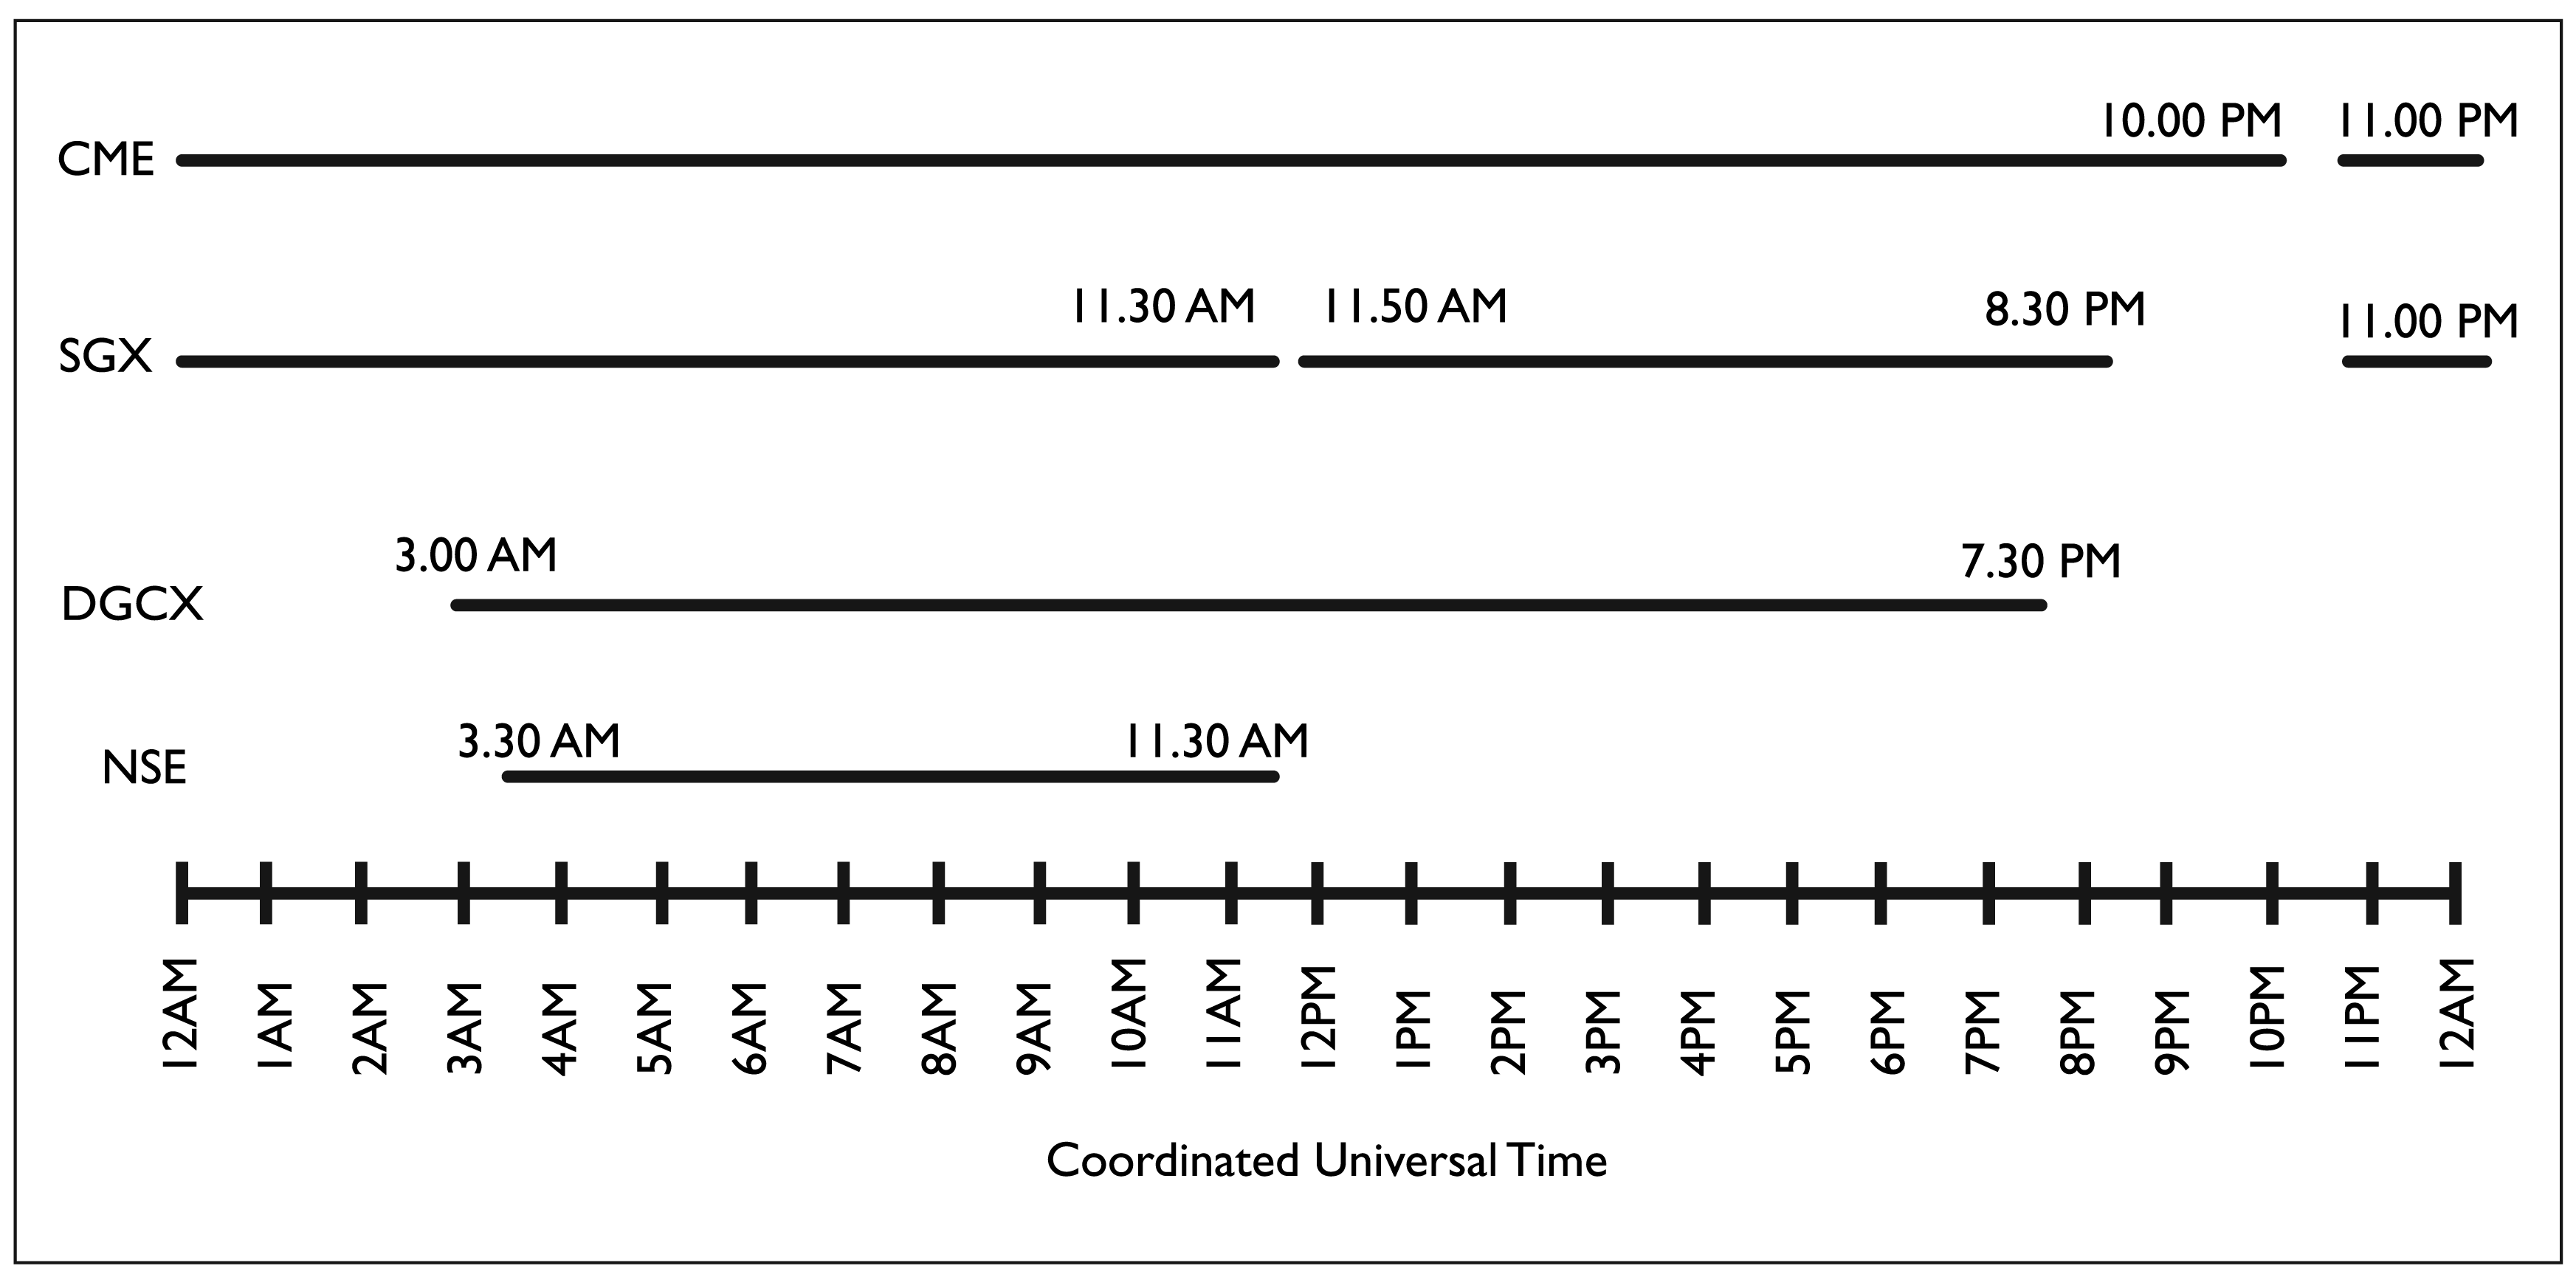
Two other factors that could explain the results are, first, differences in trading hours available at each exchange and, second, location of the exchanges in different time zones, which determine the common or overlapping time available across the exchanges. Chicago (CME) is 10 ½ hours behind Mumbai (in summer) and DGCX is 1 ½ hours behind Mumbai, while Singapore (SGX) is 2 ½ hours ahead of Mumbai (NSE). Also, NSE trades for only 8 hours per day, while DGCX trades for 16 ½ hours, SGX trades for 21 hours and CME operates almost round-the-clock (23 hours on Sunday to Friday). Keeping in view the actual opening and closing time at individual exchanges, all the three international exchanges get full 8 hours of common time with India, but while two of them (DGCX and CME) continue to be open even after NSE closes, the third exchange (SGX) closes at the same time as NSE and opens only after a 20-minute break (Refer to Figure 2 which indicates the trading hours at each exchange in terms of the coordinated universal time).
In fact, there are long hours when CME and DGCX are open for trade, but NSE is not. SGX is also, similarly, open for several hours when NSE is not, except the 20-minute gap (mentioned above) when SGX closes at the same time as NSE and reopens, after which it remains open for 8 ½ hours more. This temporary halt in trading at SGX is perhaps another factor that could explain, at least partially, the leading role of NSE in price discovery vis-à-vis SGX. It, therefore, appears that even a small break (of just half an hour) in trading activity, if not timed properly, can have deleterious impact on business of an exchange. For this reason, and considering the continuous nature of foreign exchange dealings, potential market players perhaps prefer the alternate exchange in the region (DGCX) which provides uninterrupted trading facility over SGX. For the same reason, DGCX is also perhaps preferred over NSE because DGCX opens 30 minutes before the Indian market and is also open for 8 hours more after the Indian market closes at 5
Another aspect of time difference between the exchanges which could impact the pattern of trading relates to the level of trading activity. Considering the time difference between Mumbai (location of NSE) and Chicago (location of CME), when the Indian market opens at 9
Yet another factor that could explain the dominant position of CME and DGCX over NSE in price discovery is the higher cost of trading on the Indian platform. As per CME’s website, a combined fee is charged per side per contract, amounting to USD1.60 for outright transactions and USD1.35 for spreads (futures). Considering the contract value at CME, this fee structure implies a maximum fee of 0.002 per cent of the value of contract. Similarly, at DGCX, charges include contract trade fee of USD0.35 and a clearing fee of USD0.10, along with the Securities and Commodities Authority (SCA) fee of USD0.03, taking the total fee to USD0.48 per contract (0.001% of contract value), which is even lower than that at CME. In contrast, costs payable at NSE include stamp duty of 0.002 per cent on value of transactions; SEBI turnover fees of 0.0002 per cent of the price at which contracts are purchased or sold (₹20 per ₹10 million of turnover); service tax at the rate of 12.36 per cent 17 on brokers who charge the clients (although it is exempted if services are partly performed outside India and payment is received in convertible foreign exchange within 6 months); and finally, transaction charges of NSE, amounting to ₹1.10 per ₹0.1 million of traded value for first and second month expiry contracts and ₹0.09 per ₹0.1 million for far month (i.e., third month) and beyond expiry contracts. On account of these numerous cost elements, trading costs are higher at NSE as compared to the international exchanges, which could significantly dissuade investors willing to trade in India. This is despite the fact that, unlike the stock index futures and commodity futures on which Securities Transaction Tax (STT) and Commodities Transaction Tax (CTT), respectively, are payable, there is no transaction tax on currency futures in India.
Dominant position of certain exchanges over others could also be due to differing levels of regulation that investors face at different exchanges. For example, at CME, the position trigger level is USD600 million and it is USD2 billion in the spot month on or after the day 1 week prior to the termination of trading day. In DGCX, client- and member-level position limits are USD160 million and USD400 million, respectively. In contrast, position limits for USD/INR futures contracts in India, which are the same for domestic clients and for FPIs, are much lower at USD15 million for USD/INR and USD5 million for all other currencies together, per exchange. Naturally, the CME and DGCX are less regulated markets than NSE, making CME and DGCX more attractive to investors.
A plausible explanation for larger volumes at DGCX is the early bird advantage that DGCX would have derived by virtue of being the first international exchange to commence trading in USD/INR futures (in fact, DGCX launched USD/INR trading even before it was permitted in India). Besides, DGCX also has the advantage of longer trading hours, lower trading costs and lower level of regulation compared to NSE, as already mentioned above. Perhaps for these reasons, DGCX emerges as the dominant platform, leading NSE in price discovery.
It may also be noted that NSE, DGCX and CME are not strictly comparable platforms for currency transactions, because NSE is primarily a stock exchange while DGCX and CME are both mercantile exchanges which are typically open till midnight. India’s biggest commodity exchange, MCX, is also open till 11.55
The above results show that despite the progress made in the currency market as evident from the futures segment emerging as the dominant platform over the spot in the domestic market, certain limitations such as early market closing time, higher transaction costs, regulatory restrictions and perhaps also, operations through stock exchanges (rather than mercantile exchanges), are bottlenecks being faced in the Indian market vis-à-vis international exchanges, with the result that price signals are originating from the market which has the least volumes (CME) rather than from India which has higher volumes (Table A3). This is a matter of concern as the Indian exchanges where USD/INR derivatives are traded, should dominate all international exchanges in price discovery, since India is the main producer and consumer of the asset under consideration.
Volatility Spillover Process—Domestic and International Linkages
Methodology
The GARCH-BEKK (generalized autoregressive conditional heteroscedasticity—Baba, Engle, Kraft, & Kroner, 1990) model is utilized in the study to test the process of volatility spillover between USD/INR spot and futures in the domestic market and between USD/INR futures across international exchanges. Bivariate model is used, and (1, 1) order is employed for ARCH and GARCH terms (Li, 2015).
Just as for the price discovery process (section Methodology), testing for volatility spillovers is also undertaken at two levels. First, it is tested at domestic level within the spot and futures segments of USD/INR on NSE, making it an intra-market study. The second level involves testing the volatility spillovers across international markets, between USD/INR futures on NSE and the same futures on SGX, CME and DGCX. The results obtained from this testing procedure are used to bring out policy suggestions for increasing the efficiency of the Indian currency market.
Empirical Results
Domestic Level
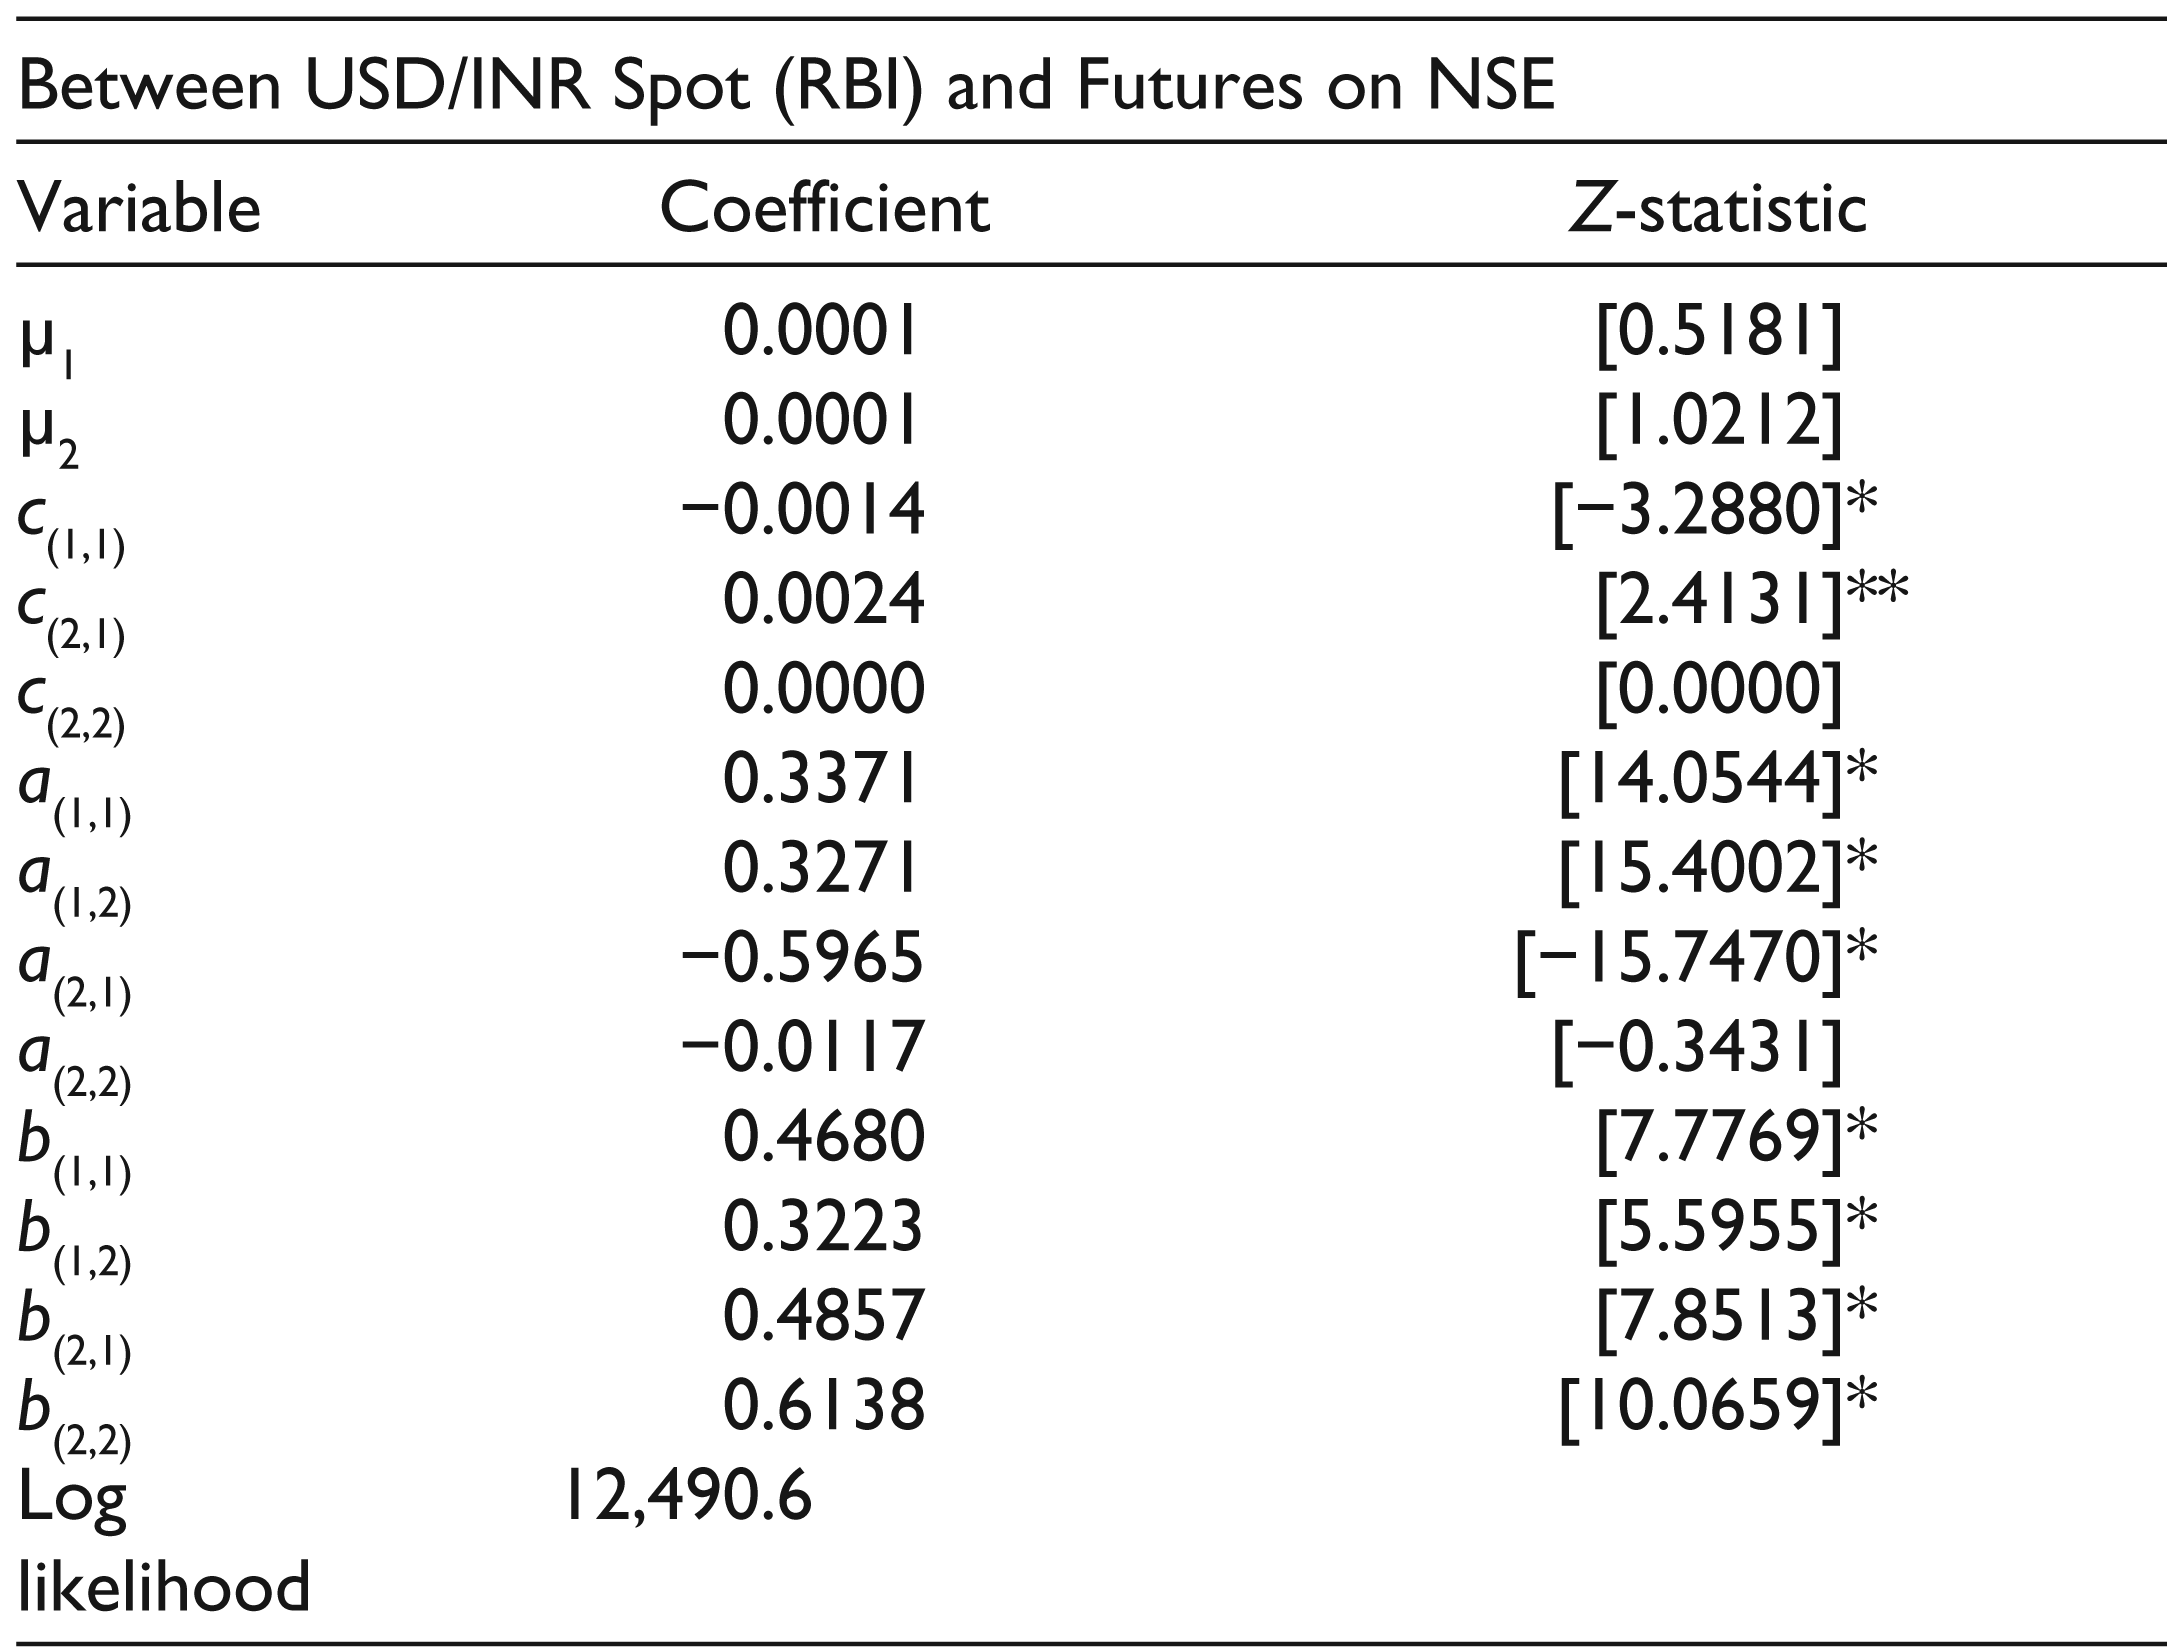
In the domestic market (Table 4), significant short-term (ST) as well as long-term (LT) volatility spillovers are observed between the spot and futures series, which are bidirectional, but stronger from the futures to the spot segment. It is important to note that these findings are in line with results of the price discovery process that show the dominance of futures over the spot. Combining the results of price discovery and volatility spillovers for the domestic market, the futures segment clearly emerges as the dominant platform compared to the spot segment, implying that information contained in the second moment of prices is incorporated faster by the futures market as compared to the spot market. The results also imply that investors focus on developing both ST and LT price-hedging strategies. This process is perhaps facilitated by the difference in volatility between spot and futures segments. Investors could go long in spot market where variance is high, and go short in futures where volatility is low. However, since the futures contracts’ volatility is lower, the hedge ratio, and therefore, the cost of hedging, may be higher because investors will be required to sell a larger number of futures contracts to hedge the risk.
Volatility Spillovers—Domestic-level Analysis for USD/INR
2. 1 refers to USD/INR spot and 2 refers to USD/INR futures. Thus, coefficient a(1,1) represents ARCH (clustering) effect within the USD/INR spot market, while the cross-coefficient a(1,2) represents the short-term volatility spillover from USD/INR spot to USD/INR futures; similarly, the coefficient b(1,1) represents GARCH (persistence) effect within the USD/INR spot market, while b(1,2) represents the long-term volatility spillover from USD/INR spot to USD/INR futures; other coefficients are interpreted in the same manner.
3. Figures in brackets [ ] denote Z-statistics.
4. *Denotes significance at 1% level; **denotes significance at 5% level; ***denotes significance at 10% level.
A majority of the risk hedging in the Indian currency market is traditionally expected to be in the short term, because most commercial traders (exporters/importers) and service providers require cover for about 3 months or maximum up to 6 months. 18 Portfolio managers/FPIs are also expected to take exposure mainly in the ST or for a few months to hedge their equity exposure. 19
The above results for the domestic market are supported by Sehgal et al. (2015) who study the USD/INR market in India during 1 February 2010 to 29 February 2012 and show evidence of bilateral volatility spillovers in the ST, stronger from the futures to the spot. The present study has also found evidence of bilateral LT spillovers, again stronger from the futures to the spot, while Sehgal et al. (2015) find evidence of unidirectional LT spillovers in the reverse direction, that is, stronger from the spot to the futures. These results could be due to commercial traders and service providers, who were perhaps till recently operating mainly in short term, now also facing long-term requirements, such as for long-term service contracts, for example, in the IT sector, for which they may have started to avail LT hedging. In addition, it is plausible that the corporate sector in India is also more conscious now about the benefits of using LT hedging, and is therefore engaging in such hedging at a higher scale than hitherto. The corporate sector may also be taking hedging positions while availing LT lines of credit. Although the number of such transactions involving LT hedging may be relatively small at present, the values involved may be higher, and in addition, the number may also be rising. Accordingly, the presence of bilateral LT hedging, stronger from the futures to the spot segment within India, as seen from the present results, is perhaps indicative of increasing LT currency exposure of domestic traders and service providers, who are, therefore, increasingly seeking LT hedging opportunities. Since the currency futures are exchange-driven, exchange-traded futures seem to be replacing the forwards (refer to section ‘Domestic Level’) which may carry some element of counterparty risk. Therefore, on overall basis, the findings of the study show that the currency futures market in India is maturing, as stronger signals are now directed from the futures to the spot, and the informational efficiency of the market system is also higher as signals are now bidirectional.
International Level
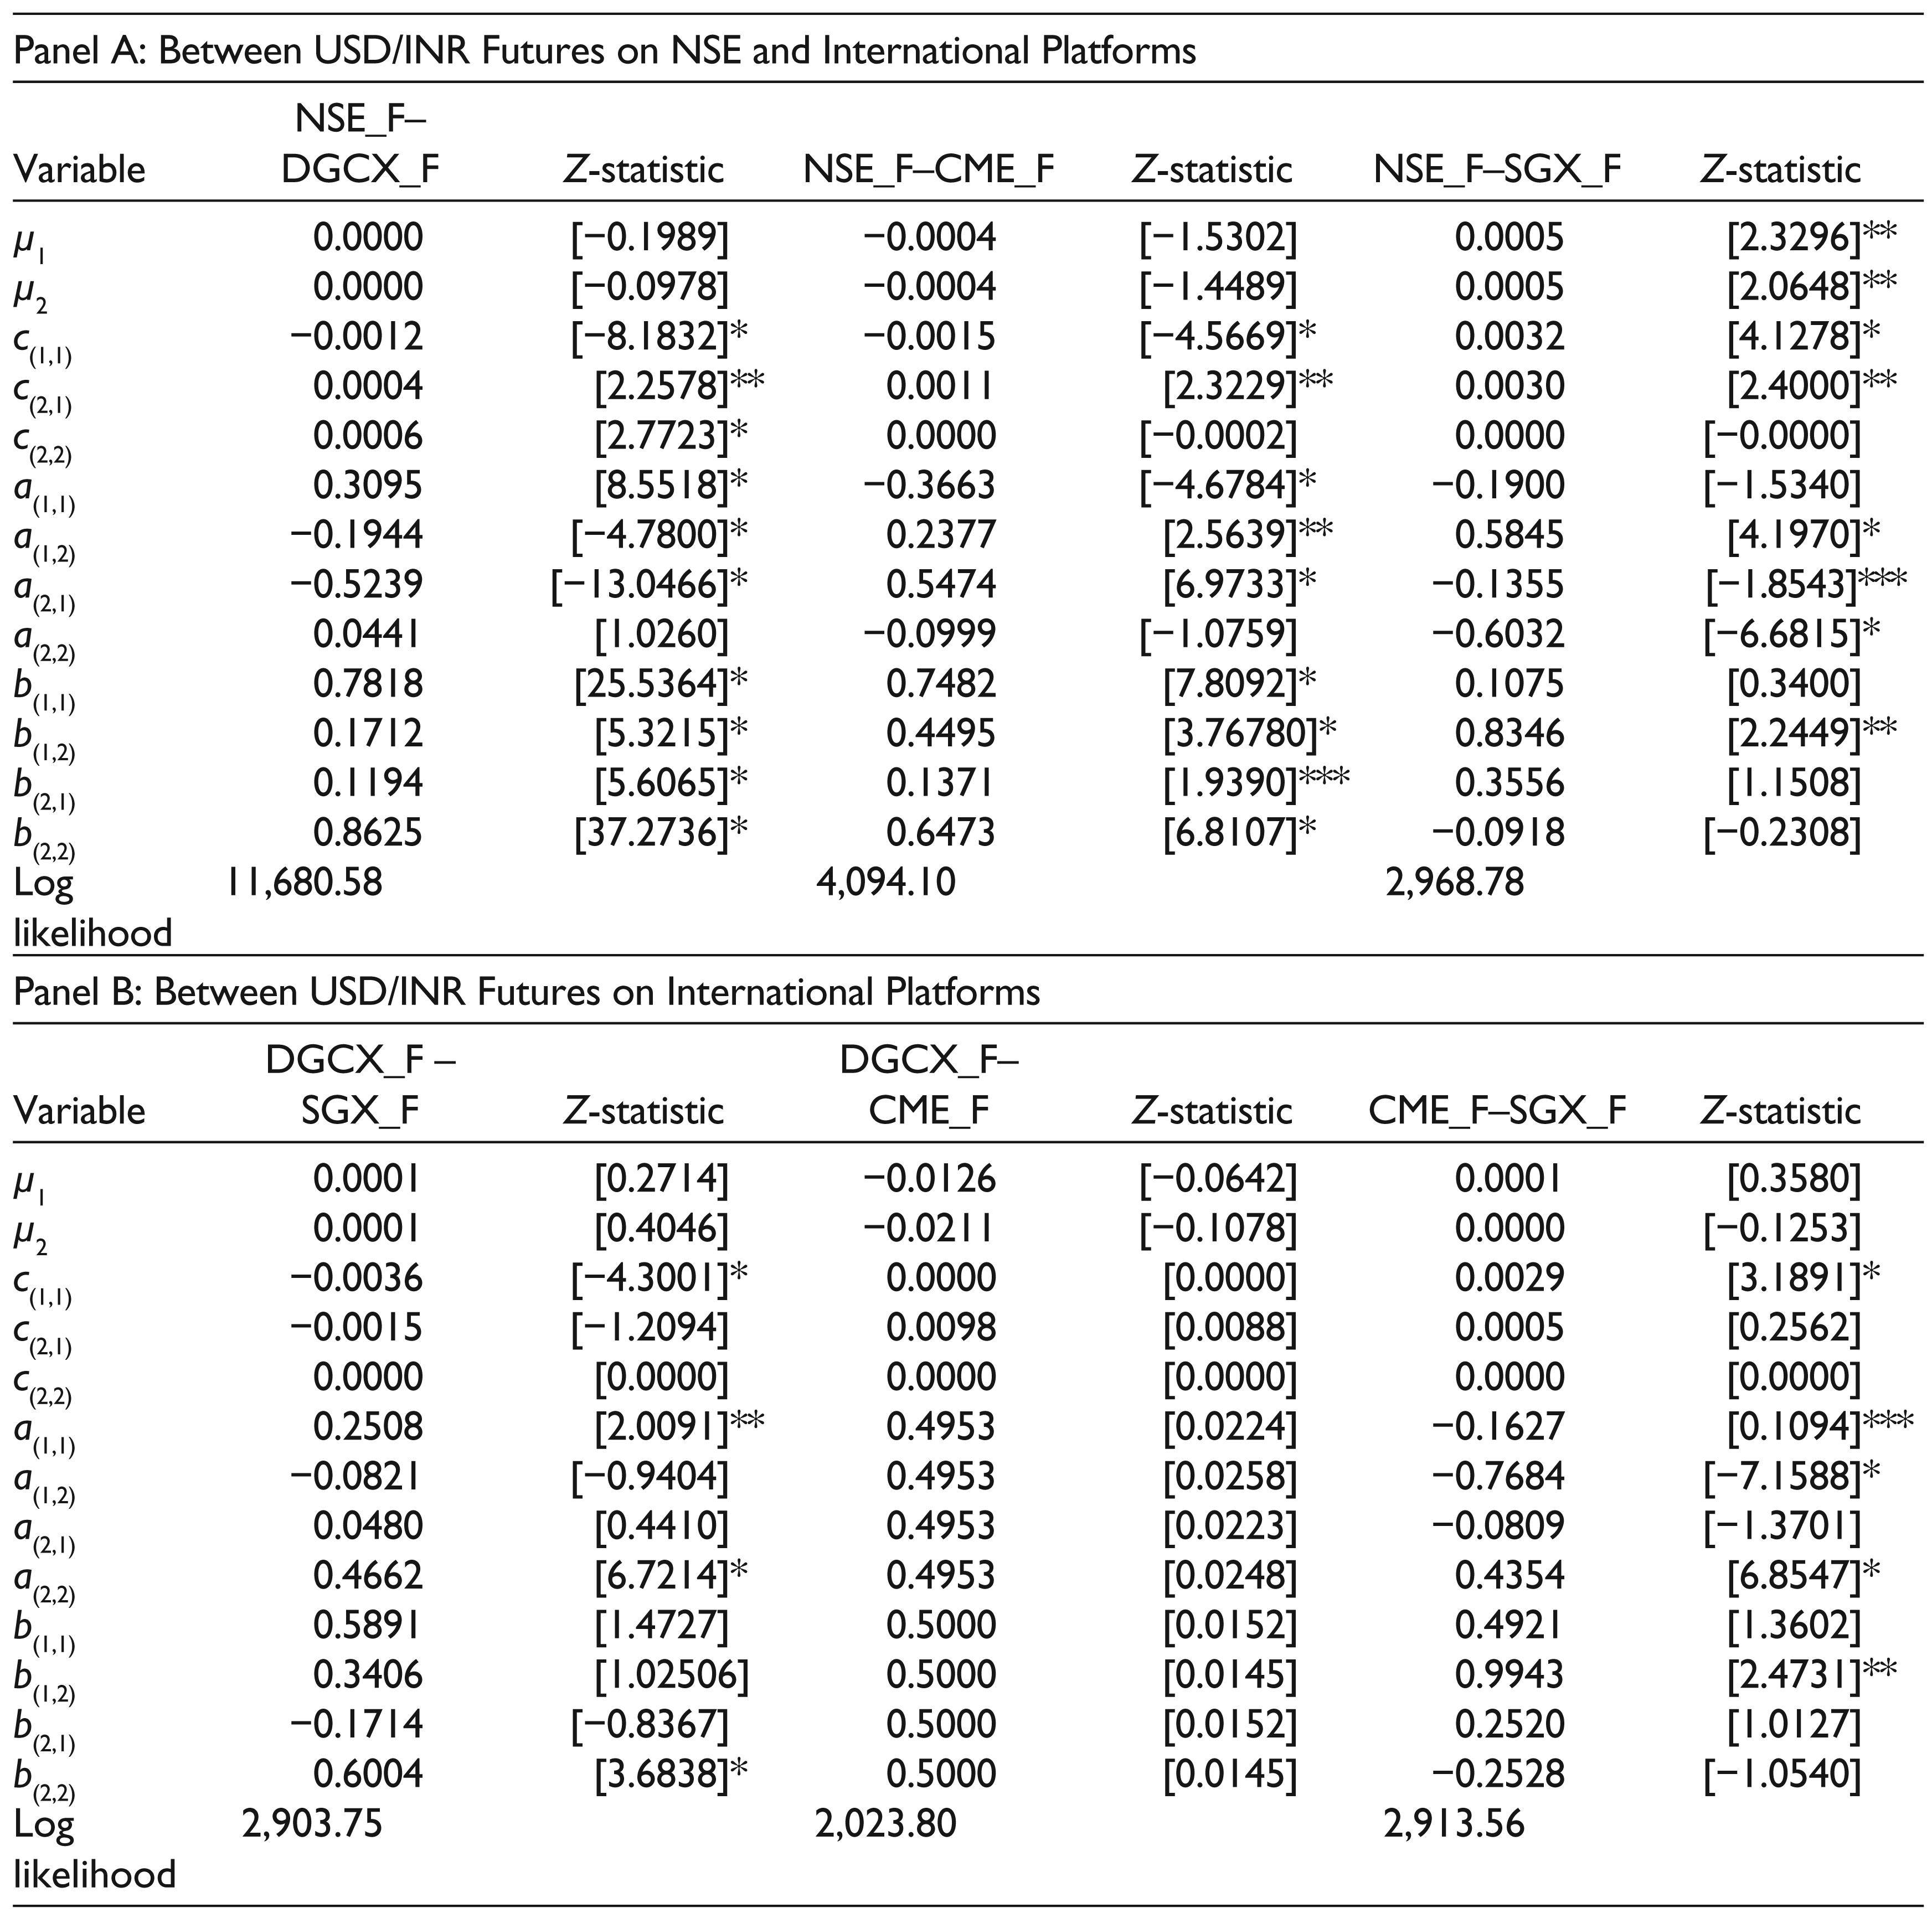
In respect of futures at NSE and at the international exchanges (Panel A of Table 5), significant ST as well as LT volatility spillovers are observed between NSE and DGCX, which are bidirectional. But ST spillovers between them are stronger from DGCX, while LT spillovers are stronger from NSE. Similarly, between NSE and CME, both ST and LT spillovers are significant and bidirectional, with ST spillovers being stronger from CME and LT spillovers stronger from NSE. As regards NSE and SGX, ST spillovers are bidirectional, stronger from NSE, while LT spillovers are unidirectional, again from NSE to SGX. Thus, in brief, it is seen that LT spillovers are stronger from NSE to all the three international exchanges, while ST spillovers are also stronger from NSE only in respect of SGX.
Volatility Spillovers—International-level Analysis for USD/INR
2. 1 and 2 refer to USD/INR futures at the two exchanges, in the order in which they appear at the head of the column;
3. Remaining notes are same as for Table 4.
The varying spillover patterns in ST and LT hedging observed for exchanges in India and abroad could perhaps be explained in terms of differences in the broad nature and requirements of market participants located in India and abroad. One major category of market participants in India comprises FPIs whose general trading behaviour is to take exposure mainly in the ST/for a few months to hedge their equity exposure. 20 Considering their focus on ST exposure and since they are located abroad, it is not surprising that ST triggers are stronger from the international exchanges (DGCX and CME) to the NSE. This implies that the FPIs are playing the dominant role in taking positions in the short term as compared to the Indian domestic investors, on account of which two of the three international exchanges are dominating the Indian exchange in ST hedging. Another possible factor that could explain the lack of dominant position of the Indian exchange in ST hedging is the general reluctance on the part of Indian investors to undertake hedging. This may be particularly true of small commercial traders who may be exposed to short-term risk, but may not fully understand the operations of derivative instruments, due to which they may prefer to bear the exchange risk instead of engaging in complex financial dealings. Another factor may be the general lack of awareness about the benefits of hedging.
As regards LT hedging, FPIs do not play a significant role (as they operate mainly in ST), whereas the Indian corporates as well as commercial traders and service providers, who hitherto mainly had ST requirements, are perhaps encountering increased LT currency exposure in their business with overseas entities, on account of which they are perhaps now focussing more on hedging such LT exposure. This may explain LT triggers originating from India (NSE) and moving to all the three international exchanges (DGCX, CME and SGX), thereby clearly showing the dominant role of the Indian exchange vis-à-vis the international exchanges, in LT hedging. This trend is also supported by the findings in the domestic spot and futures segments, where LT hedging is seen to be rising, stronger from the futures segment.
An important highlight of the findings is that in the case of SGX, NSE dominates both in the ST and in LT spillovers. This was also observed in the price discovery results which show NSE dominating SGX in price discovery due to factors such as larger volumes traded at NSE and a temporary halt in trading at SGX, particularly due to geographical proximity between the two exchanges.
With respect to the pairs of international platforms (Panel B of Table 5), it is surprising that there are no significant ST or LT volatility spillovers between DGCX and CME, or even between DGCX and SGX. Significant spillovers are observed only in the case of CME and SGX, where both ST and LT spillovers exist. However, the spillovers are unidirectional from CME to SGX, and LT spillovers are weak (significant at 10% level).
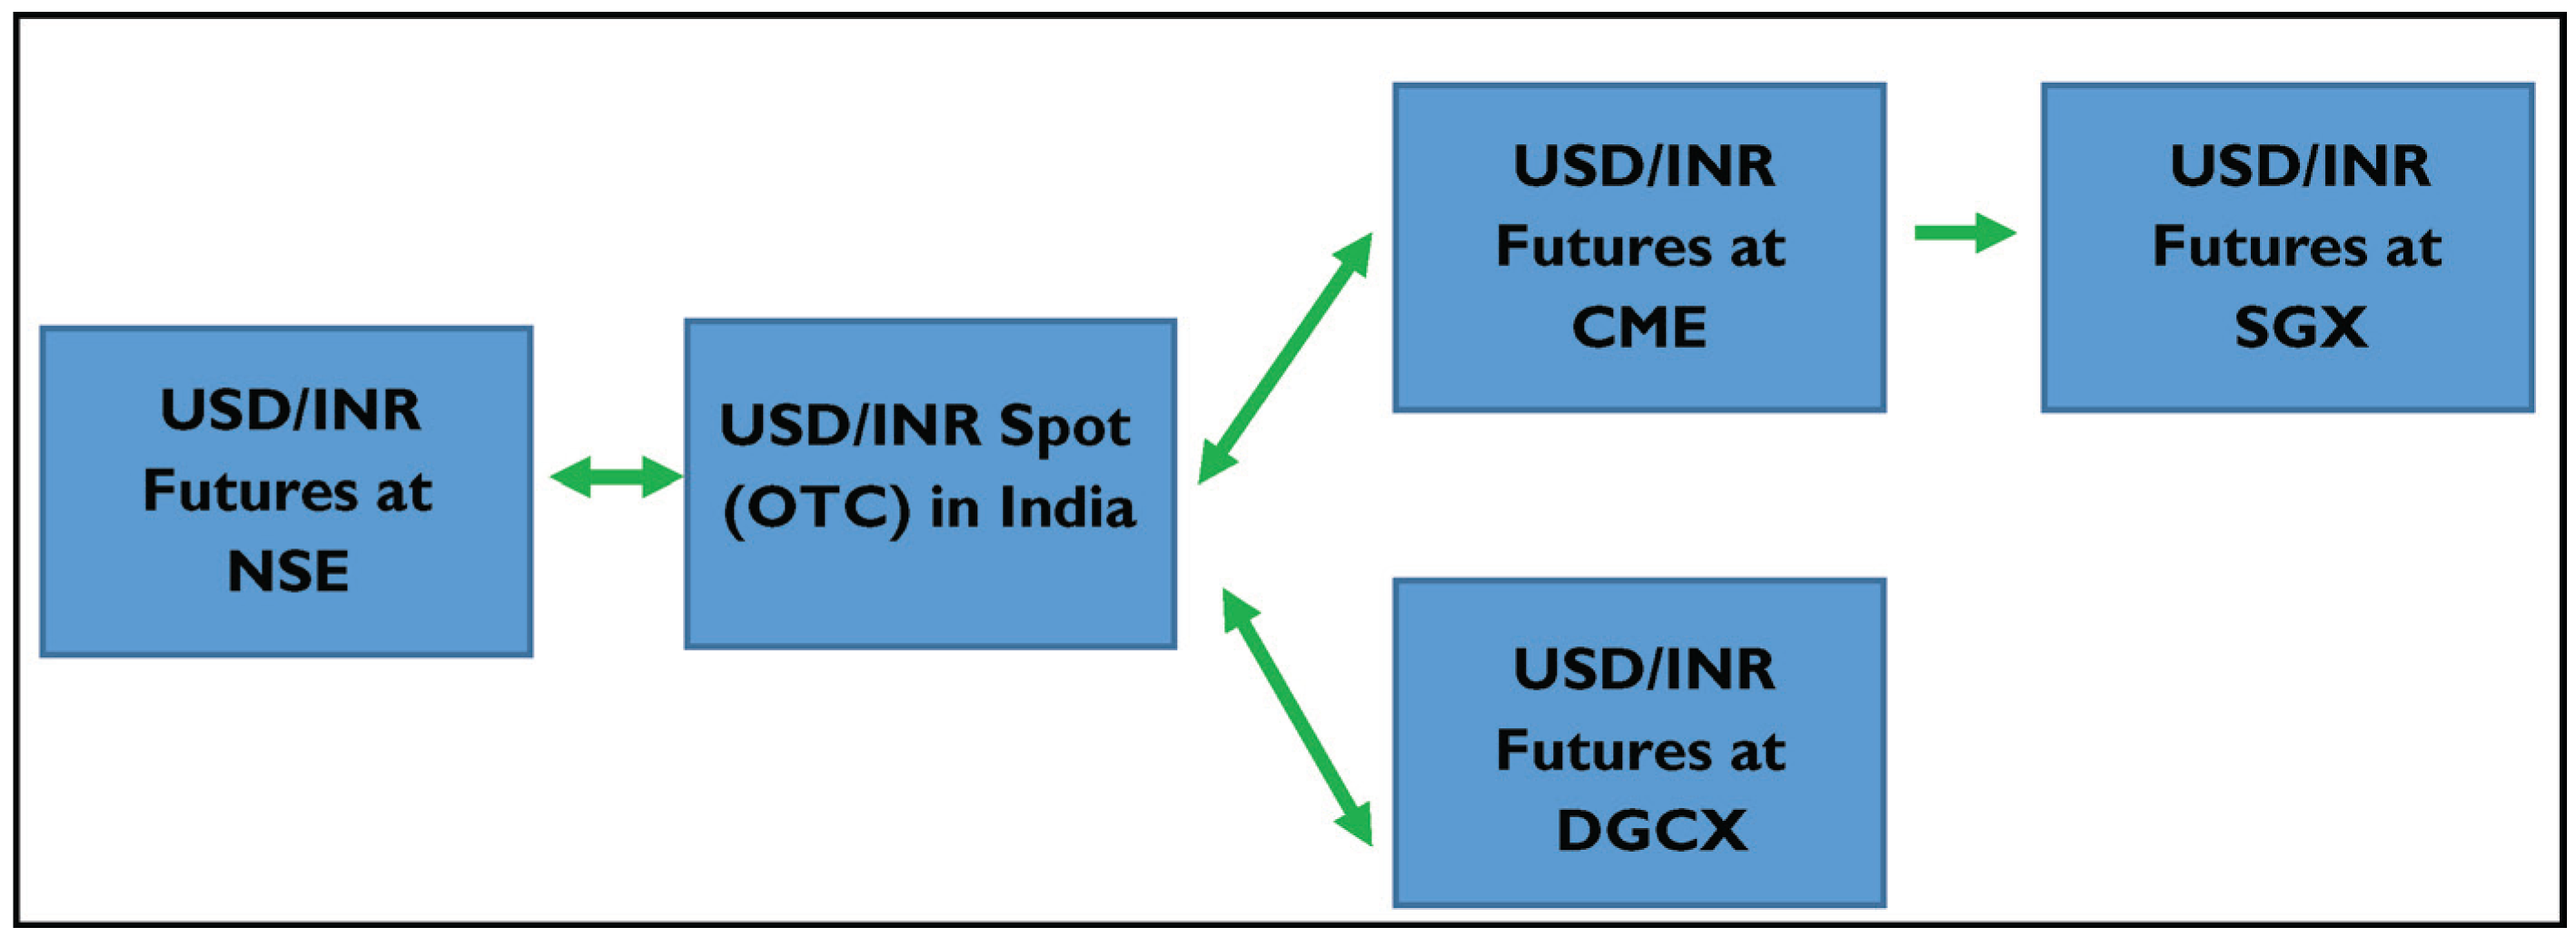
In view of the above, the information path for volatility spillover process for both domestic and international markets, separately for ST and LT spillovers, is given in Figures 3 and 4, respectively.
The findings from the study give rise to several significant policy suggestions, which are indicated below.
Summary, Conclusions and Policy Suggestions
This study examines price and volatility linkages in the currency market in India and also across international markets during August 2008 to March 2015. The price discovery process is tested through the cointegration procedure and the VECM, supported by the Granger causality test, while volatility spillovers are studied through the multivariate BEKK-GARCH model. The results show that in the domestic market, the futures segment leads the spot segment in price discovery as well as in ST and LT risk hedging, and the relationship is bidirectional in all cases. The findings are stronger than those in an earlier study (Sehgal et al., 2015). Thus, it can be concluded that in the domestic market, India’s currency futures trading platform has started to play a more significant role in price discovery and also in hedging opportunities, thereby resulting in improved pricing as well as hedging efficiency within the currency (USD/INR) market in India. At the international level, however, two exchanges, namely, CME and DGCX, dominate India both in price discovery and in ST volatility spillovers, while NSE leads only in LT volatility spillovers. The NSE seems to dominate only SGX in the international context. Certain limitations such as early market closing time, shorter trading hours, higher trading costs as well as higher regulatory restrictions and also operations through stock exchanges (rather than mercantile exchanges), besides general lack of awareness about benefits of hedging, are perhaps constraining the Indian market vis-à-vis the international exchanges, with the result that price signals are originating from the market which has the least traded volumes (CME) rather than from India despite its higher volumes.
These findings point towards the need for relevant currency market reforms to make NSE a preferred platform for international investors in respect of price discovery as well as for risk hedging, so that NSE could play a more dominant role in the information transmission process. Certain significant policy reforms in the currency market that may be considered are as follows:
Trading costs at NSE may be reduced by keeping the currency transactions outside the ambit of service tax (now replaced by GST) and abolishing the stamp duty. Major exchanges such as CME and DGCX do not have such cost elements. In fact, in view of the introduction of the GST in India, a comprehensive review of taxes applicable to the currency market may be undertaken to lower trading costs. Authorities may consider raising the position limits for domestic clients and trading members as well as for FPIs in a gradual manner so as not to limit the operations of large participants and also prevent such transactions from end up on competing platforms, besides the OTC market. To prevent such a shift, position limits could be benchmarked to those fixed by competing exchanges. Managements of respective exchanges should calibrate the market opening and closing time carefully vis-à-vis those prevailing in competing exchanges, particularly in the neighbouring region, to prevent avoidable trade migration to other regional platforms. Specifically, the Indian market could be kept open beyond 5 To facilitate currency transactions beyond 5 Currency trade should ideally take place on commodity exchanges and not on stock exchanges, as majority demand for currency derivatives is related to commodities. Also, currency transactions have greater synergy with commodity exchanges which are usually open for longer hours than the stock exchanges. It is also the general practice worldwide. This requirement would be met if all exchanges in India are allowed to trade in all assets, as has been announced recently by the Government.
21
To capitalize on growing interest in the futures market, as evident from the results, efforts may be made to project the useful features of the futures market and also make conscious attempts to increase market depth by extending the ongoing financial literacy campaigns being run by the government as well as by financial regulators and exchanges, to include awareness among investors regarding potential benefits of spread trades that help to create offsetting positions, thereby minimizing likely losses from the market.
Besides providing suggestions for policymakers, the study is also relevant for FPIs and domestic investors as they can utilize the results to draw up suitable risk mitigation and portfolio diversification strategies. Further, the study is of deep academic interest as it covers both spot and futures segments in India as well as all the major counterpart exchanges abroad where USD/INR futures are traded, which do not appear to have been studied earlier. The study is equally relevant for researchers as they could extend the study to cover other currency contracts, namely EUR/INR, GBP/INR and JPY/INR as well as cover currency options. Researchers could also investigate related aspects, such as possible factors responsible for the dominant position of CME in price discovery and volatility spillovers, despite having lowest turnover among the exchanges. Future research could also include additional methodology such as dynamic conditional correlation (DCC) and asymmetric dynamic conditional correlation (ADCC) to provide for changing correlations over time and make the results of the study more robust. The recent emergence of cryptocurrencies and implications of the same on real currency contracts in the future is another frontier area for possible research. The study contributes to information transmission literature for emerging markets.
Declaration of Conflicting Interests
The authors declared no potential conflicts of interest with respect to the research, authorship and/or publication of this article.
Funding
The authors received no financial support for the research, authorship and/or publication of this article.
Footnotes
Appendix
Major Contract Specifications including Trading Hours and Trading Costs of USD/INR Futures at NSE, DGCX, CME and SGX
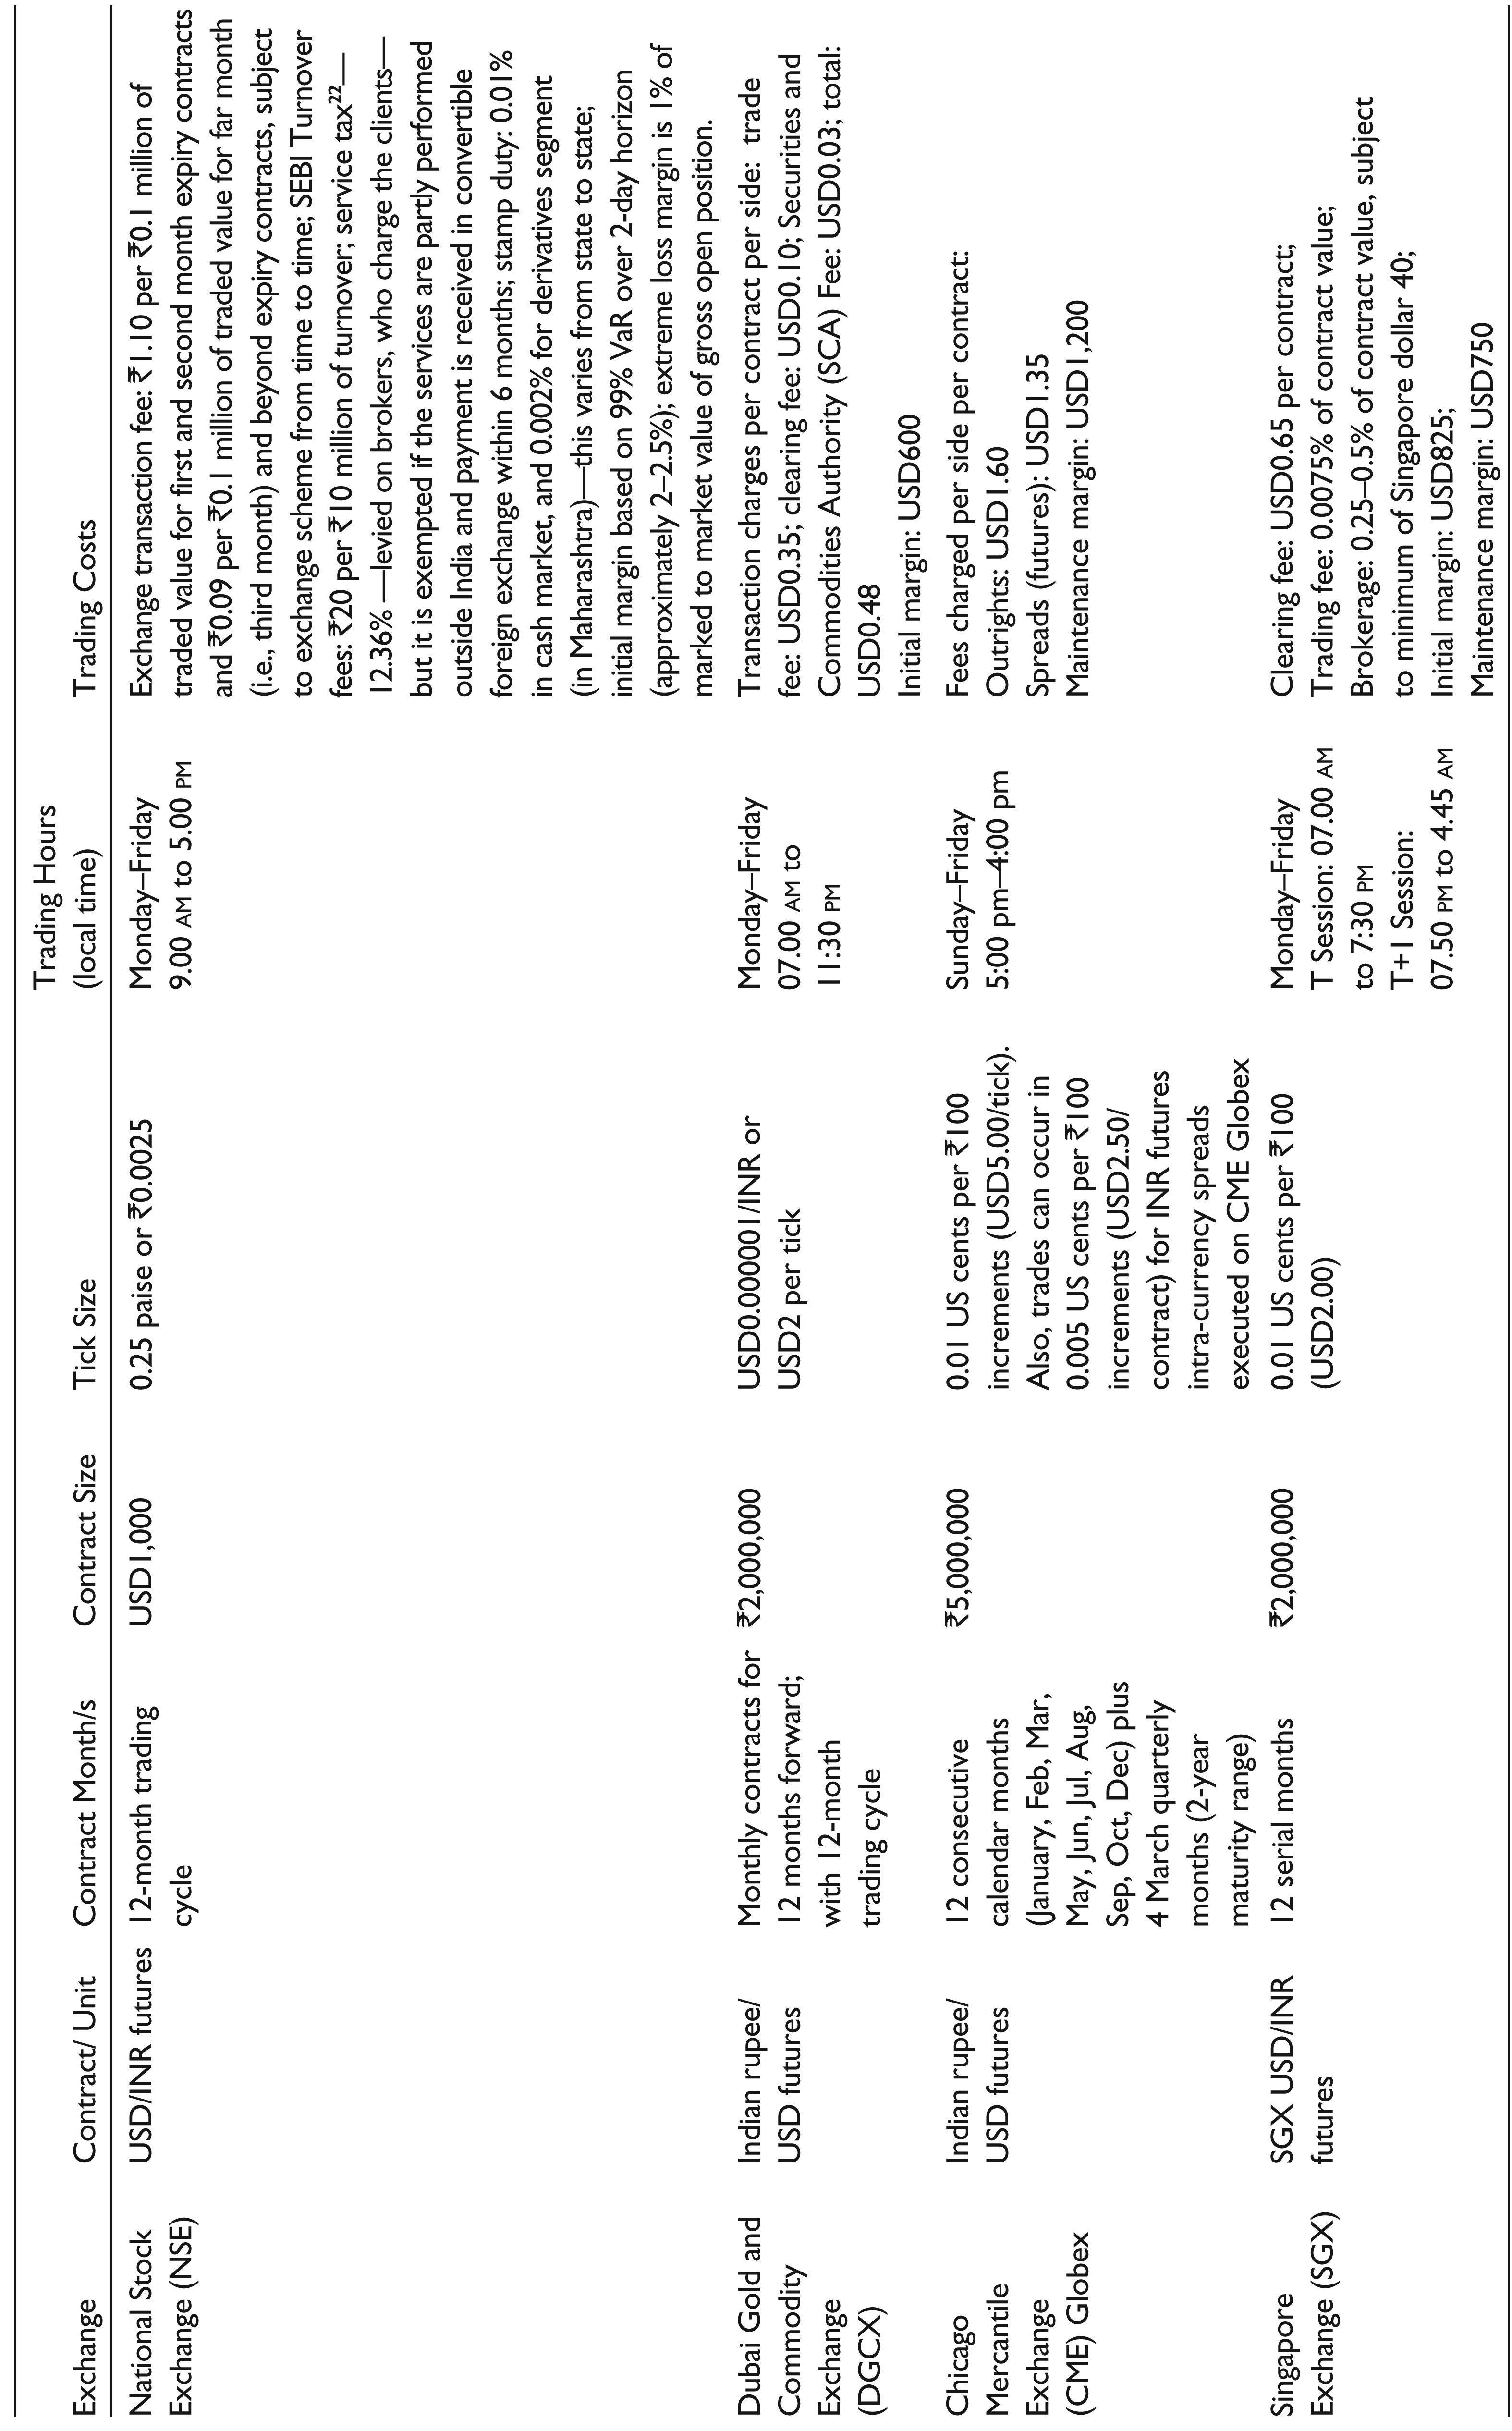
| Exchange | Contract/ Unit | Contract Month/s | Contract Size | Tick Size | Trading Hours (local time) | Trading Costs |
| National Stock Exchange (NSE) | USD/INR futures | 12-month trading cycle | USD1,000 | 0.25 paise or ₹0.0025 | Monday–Friday 9.00 |
Exchange transaction fee: ₹1.10 per ₹0.1 million of traded value for first and second month expiry contracts and ₹0.09 per ₹0.1 million of traded value for far month (i.e., third month) and beyond expiry contracts, subject to exchange scheme from time to time; SEBI Turnover fees: ₹20 per ₹10 million of turnover; service tax |
| Dubai Gold and Commodity Exchange (DGCX) | Indian rupee/USD futures | Monthly contracts for 12 months forward; with 12-month trading cycle | ₹2,000,000 | USD0.000001/INR or USD2 per tick | Monday–Friday 07.00 |
Transaction charges per contract per side: trade fee: USD0.35; clearing fee: USD0.10; Securities and Commodities Authority (SCA) Fee: USD0.03; total: USD0.48 Initial margin: USD600 |
| Chicago Mercantile Exchange (CME) Globex | Indian rupee/USD futures | 12 consecutive calendar months (January, Feb, Mar, May, Jun, Jul, Aug, Sep, Oct, Dec) plus 4 March quarterly months (2-year maturity range) | ₹5,000,000 | 0.01 US cents per ₹100 increments (USD5.00/tick). Also, trades can occur in 0.005 US cents per ₹100 increments (USD2.50/contract) for INR futures intra-currency spreads executed on CME Globex | Sunday–Friday 5:00 pm–4:00 pm | Fees charged per side per contract: Outrights: USD1.60 Spreads (futures): USD1.35 Maintenance margin: USD1,200 |
| Singapore Exchange (SGX) | SGX USD/INR futures | 12 serial months | ₹2,000,000 | 0.01 US cents per ₹100 (USD2.00) | Monday–Friday T Session: 07.00 T+1 Session: 07.50 |
Clearing fee: USD0.65 per contract; Trading fee: 0.0075% of contract value; Brokerage: 0.25–0.5% of contract value, subject to minimum of Singapore dollar 40; Initial margin: USD825; Maintenance margin: USD750 |