
Abstract
Consumption of ready-to-drink beverages, as a potential source of fluoride (F), has increased considerably in China over the last decade. To help inform the public and policy makers, this study aimed to measure F concentration of ready-to-drink beverages on sale in Heilongjiang province, north east China. Three batches of 106 drink products manufactured by 26 companies were purchased from the main national supermarkets in Harbin, Heilongjiang province, China. The F concentration of all samples was determined, in triplicate, using a fluoride ion-selective electrode in conjunction with a meter and a direct method of analysis. The products were categorised into 10 groups according to product type. F concentrations of the samples ranged from 0.012–1.625 mg/l with a mean of 0.189 mg/l and a median of 0.076 mg/l. More than half of the products (55%) had an F concentration of ≤0.1 mg/l, while <5% had a F concentration of >0.7 mg/l. The ‘tea with milk’ group contained the highest mean F concentration (1.350 mg/l), whereas the lowest mean F concentration (0.027 mg/l) was found for the ‘fruit juice’ group. For some products, such as tea, fruit juice and carbonated beverages, there were substantial variations in F concentration between batches, manufacturers and production sites. In conclusion, ready-to-drink products (apart from tea), sold in Heilongjiang province, China, when consumed in moderation are unlikely to constitute a substantial risk factor for the development of dental or skeletal fluorosis.
Introduction
Fluoride (F) is an element that is naturally present in water and soils at different concentrations. F is considered beneficial for mineralisation of bones and teeth, with almost 99% of the body burden of F being in calcified tissues. However, the key acknowledged health-related role of F is in the prevention and control of dental caries, a preventable disease that remains a public health problem in both developed and developing countries, and exposure to fluorides topically in the mouth helps to prevent the caries process. Conversely, excessive systemic F ingestion during tooth development can increase the risk of developing dental fluorosis. A total systemic F exposure of 0.05–0.07 mg/kg body weight (bw)/day, in children, has been suggested as optimum for dental health benefits, whereas F intakes of more than 0.1 mg/kg bw/day during the first five years of life can increase dental fluorosis risk (Burt, 1992). Chronic high systemic F exposure in adults (>6 mg F/day), over several years can lead to skeletal fluorosis; a debilitating condition resulting in stiffness and pain in the joints (Krishnamachari, 1986).
According to the second National Oral Health Survey (NOHS) in China, undertaken in 1995–1996, almost 77% of five-year-olds had dental caries experience, with the mean decayed, missing and filled primary teeth (dmft) being 4.5 teeth (Hong-Ying et al., 2002). By 2005, caries experience in children was still high, affecting 66% of five-year-olds with a mean dmft score of 3.5 (Hu et al., 2011). The pattern was similar for adults, with 63% of 35–44-year-olds found to have decay experience in the second NOHS (Hu et al., 2011) reducing to a prevalence of 61% by the third NOHS in 2005 (Hu et al., 2011; Qi, 2008). The third NOHS (Qi, 2008) also reported a mean prevalence of dental fluorosis of 11.6% in 12 year olds, of which only 4.3% was severe fluorosis.
The main sources of systemic F exposure are diet and inadvertent ingestion of dental products, e.g. toothpastes. Depending on age, the contribution of diet to total F intake varies from 95% at age six months (Levy et al., 2001) to 41% at age six years (Zohoori et al., 2013) in communities where fluoridated toothpastes are used. Studies in China have reported that 83% of 12 year olds (Zhu et al., 2003) and 79% of adults (Zhu et al., 2005) brushed their teeth at least once per day, but of these groups only 17% and 5%, respectively, used toothpaste containing F. Consequently, for the majority of the Chinese population, diet appears to be the main contributor to F intake. The second Chinese NOHS, conducted in 1995–1996, found F concentrations of below 1 ppm in all samples of drinking water collected from the 11 study sites (Hong-Ying et al., 2002); however, other localised studies in China have reported higher F concentrations of up to 8 ppm in ground water (Li et al., 2001; Ruan et al., 2005). Therefore, water, alone or added to other drinks and foods during preparation, could be a primary source of F exposure in some communities in China.
With the improving economic status of China and its population and swift changes in lifestyle including dietary behaviour, the consumption of soft drinks has increased rapidly in recent years, with more than 149 million tonnes consumed in 2013; 10 times the production in 2000 (Research and Markets, 2014), with bottled water, carbonated drinks, ready-to-drink teas, fruit and vegetable juices and protein drinks comprising the main markets.
The emergent consumption of sugary drinks and the consequent potential for a further rise in the prevalence of dental caries in China could lead to a substantial cost to individuals as well as to its national health service. Therefore, there is a need to implement a comprehensive oral health preventive programme to reduce oral disease burden. The World Health Organisation (WHO) Global Oral Health Programme promotes the ‘effective use of F’ as an important strategy to prevent dental caries (Petersen and Lennon, 2004). However, the circumstances in China are fairly unique, with a significant prevalence of dental caries in some regions and endemic fluorosis in others. In order to take full advantage of F for caries prevention, while controlling the risks for development of dental fluorosis, exposure to systemic F should be regulated. Evaluating current F exposure before implementing any community programme using F has been emphasised by the WHO (WHO, 2014). However, currently there is no information on F contents of food and drink items in China to aid the assessment of total F exposure from diet at individual or community levels.
This study was therefore designed to undertake F analysis of a broad selection of drinks currently on sale in the north-east of China to provide some insight into the scale of systemic F exposure from commonly consumed drinks in this region.
Materials and methods
Sampling
In total, three different batches of 106 drink products (n = 318) were purchased from the main national supermarket chains in Harbin, Heilongjiang Province, in north-east China. These products included the most commonly consumed ready-to-drink items, produced by 26 manufacturers in China. Selection of the manufacturers and type of drinks was based on the China Beverage Market Report (Chow, 2011). According to this report the top Chinese beverage brands were Master Kong, Wahaha, JDB group, HuiYuan, NongFu Spring, JianLiBao and LuLu. The number of purchased products from each supermarket was based on the availability of those in stock at the location on the collection date. The drinks products were sold either in plastic bottles, cans or cardboard boxes (cartons). Information on the type of drink, brand name and batch number was recorded. Since the material and composition of storing and cooking containers may influence the F content of its contents (Full and Parkins, 1975; Hattab, 1981; Kandavel et al., 2015), the type of container was also noted.
Sample preparation and analysis
The F analysis was conducted at the analytical laboratory of the Harbin Commerce University – Department of Food Engineering. After shaking the container of the drink, a 1.0 ml aliquot was taken and mixed with 0.1 ml of total ionic strength adjusting buffer III (TISAB: YanTai Science and Biotechnology Co Ltd, Yantai, Shandong, China) to adjust the total ionic strength and maintain the pH to approximately 5.3. The F concentration of the aliquot was then determined using a fluoride ion-selective electrode (ISE) (model: PF-1-01, Scientific Instrument and Materials Co Ltd. Shanghai, China) in conjunction with an ISE meter (model: PXS270, ShangHai Instrument Scientific Co Ltd). Four F standards ranging from 0.01 mg F/l to 10.00 mg F/l (i.e. 0.01, 0.1, 1.0, 10 mg F/l) were used to produce the calibration line (Martínez-Mier et al., 2011; Zohouri et al., 2003).
Ten percent of each batch of the samples was randomly selected and re-analysed to assess the reliability of the method. All the samples (at analysis and re-analysis) were analysed in triplicate and a mean value derived that was then used for data analysis.
Data analysis
Based on the China Beverage Market Report (Chow, 2011), beverage products on the China market include drinking water, carbonated drinks, juice drinks, milk drinks, tea beverages and functional beverages. In the present study, the same categorization strategy was employed; however, tea products were divided into four separate groups due to the reported diverse range of F concentrations of different types of tea found in the literature.
The analysed items were then divided into ten groups (Table 1) in line with the type of product: (1) black teas; (2) green teas; (3) herbal teas; (4) teas with milk; (5) carbonated beverages; (6) fruit juices; (7) Kvass, a fermented Russian non-alcoholic drink (0.05–1.0% alcohol) made from rye bread; (8) non-dairy milks; (9) vitamin drinks; and (10) bottled waters.
Categories of the 106 drink products.
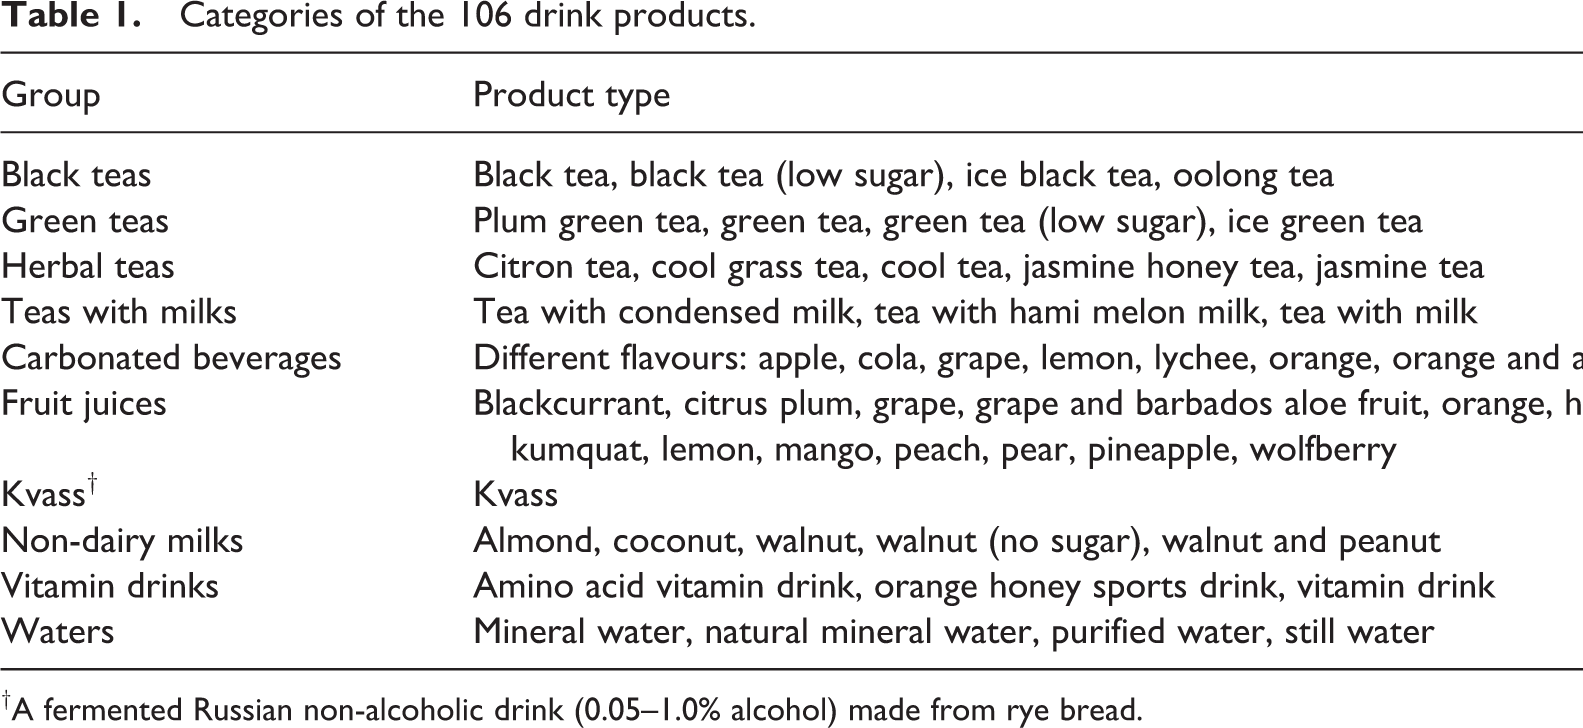
†A fermented Russian non-alcoholic drink (0.05–1.0% alcohol) made from rye bread.
Within each group, the items were categorised further into several sub-groups, according to brand name. Descriptive analysis was undertaken using the SPSS statistical package (version 21, IBM Corporation, New York, USA) to report mean, median and range of F concentrations of all samples, classified according to the type of drink, manufacturer/brand and site of production. A paired t-test was used to compare the analysis and re-analysis measurements.
Estimation of maximum F intake from drink consumption
Maximum daily F intake from drink consumption (mg/day) was estimated from the mean F concentration of drinks, analysed in the present study, and the average daily beverage consumption (including ready-to-drink tea, carbonated soft drinks, fruit and vegetable drinks and functional drinks) of 345 ml/day and 186 ml/day reported for Chinese children (Ma et al., 2012) and adults (Du et al., 2013), respectively. Maximum daily F intake per kg body weight (mg/kg bw/day) from drink consumption was then estimated based on a 15 kg child and a 60 kg adult.
Results
The accuracy of the method was confirmed by comparing the analysis and re-analysis measurements. The results showed no statistically significant differences (p = 0.23) between the two measurements with a mean (SD) difference of 0.009 (0.025) mg F/l. The correlation between the analysis and re-analysis measurements was r = 0.988 (p < 0.001), indicating excellent reproducibility.
The F concentrations of the 106 drink products, manufactured by 26 companies, ranged from 0.012 mg/l (fruit juice by TongYI) to 1.625 mg/l (tea with milk by Lipton) with a mean of 0.189 mg/l and a median of 0.076 mg/l. The distribution of F concentration for the drinks is summarised in Figure 1. The F concentrations of 55% of drinks were at, or below, 0.1 mg/l while fewer than 5% of the products had a F concentration of more than 0.7 mg/l. The majority (n = 82) of drinks were sold in plastic bottles (overall mean for all drinks in plastic bottles tested: 0.194 mg F/l, range: 0.012–1.625 mg F/l). The overall mean F concentration of products sold in cans (n = 18) was 0.211 mg/l (range: 0.044–0.650 mg F/l) and in cardboard cartons (n = 6) it was 0.056 mg/l (range: 0.012–0.207 mg F/l).
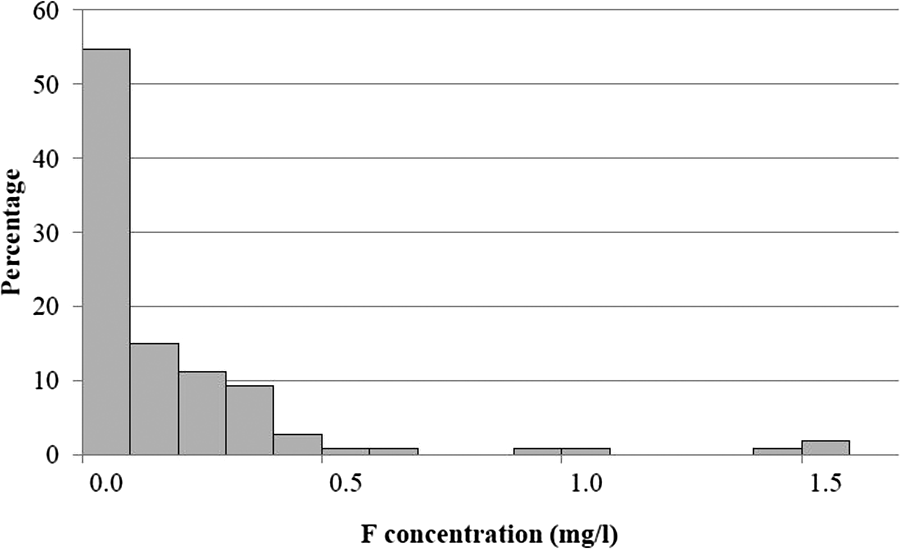
Distribution of F concentrations (mg/l) for all drinks (n = 106).
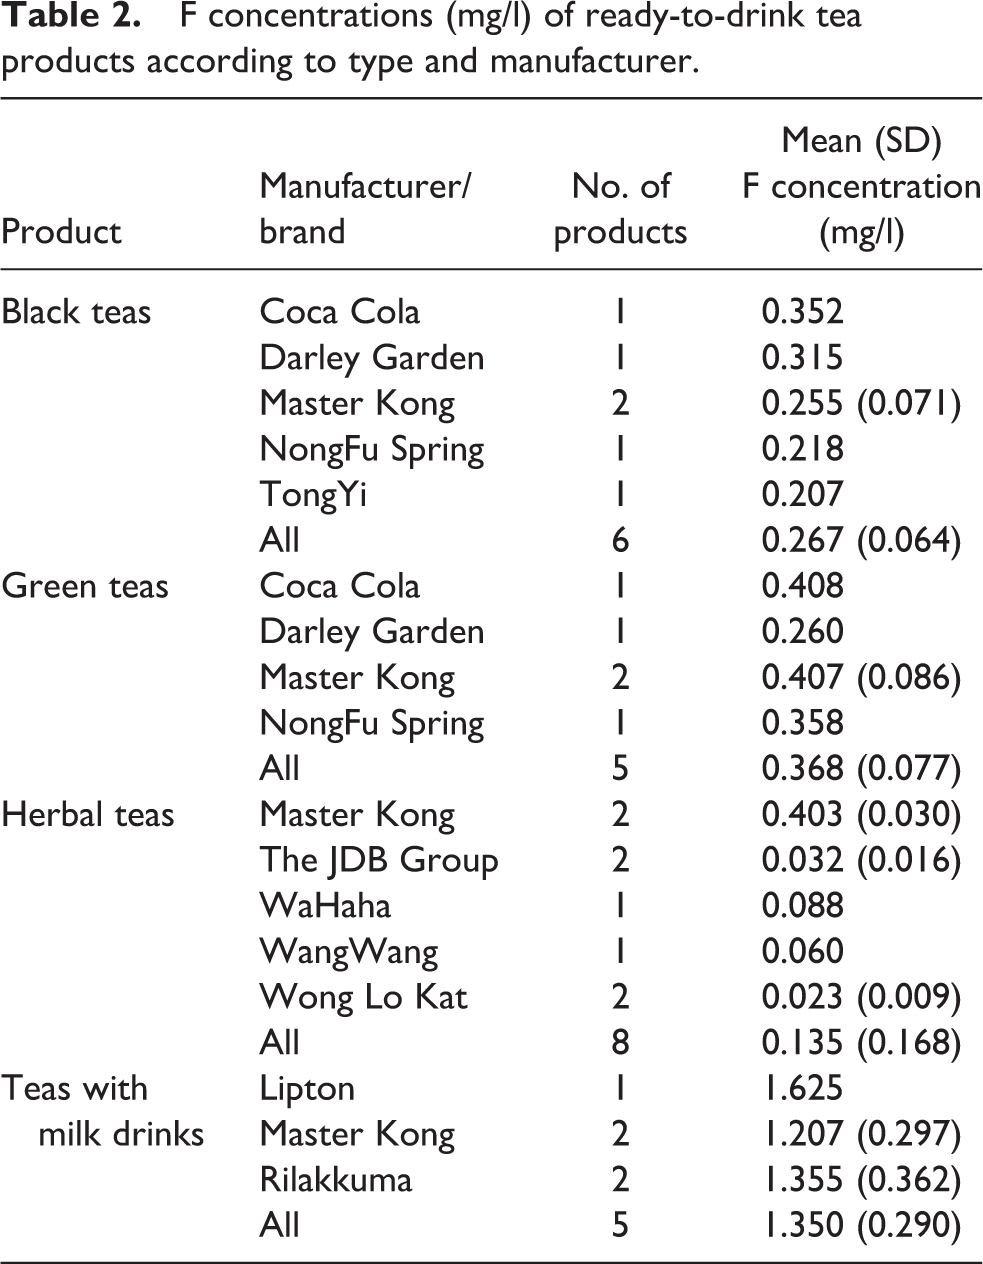
Table 2 presents the mean (SD) F concentration (mg/l) of ready-to-drink tea products by type and manufacturer/brand. The ‘teas with milk’ group contained the highest mean concentration of F (mean: 1.350 mg/l, range: 1.207–1.625 mg/l), followed by the ‘green teas’ with a mean F concentration of 0.368 mg F/l (range: 0.260–0.408 mg F/l).
F concentrations (mg/l) of ready-to-drink tea products according to type and manufacturer.
Among the other drinks (Table 3), the ‘non-dairy milks’ group had the highest F concentration (0.320 mg F/l), followed by the ‘carbonated beverages’ group (0.175 mg F/l). The lowest F concentration was found for the ‘fruit juices’ group with a mean F concentration of 0.027 mg/l.
Mean F concentrations (mg/l) of other ready-to-drink products according to type and manufacturer.
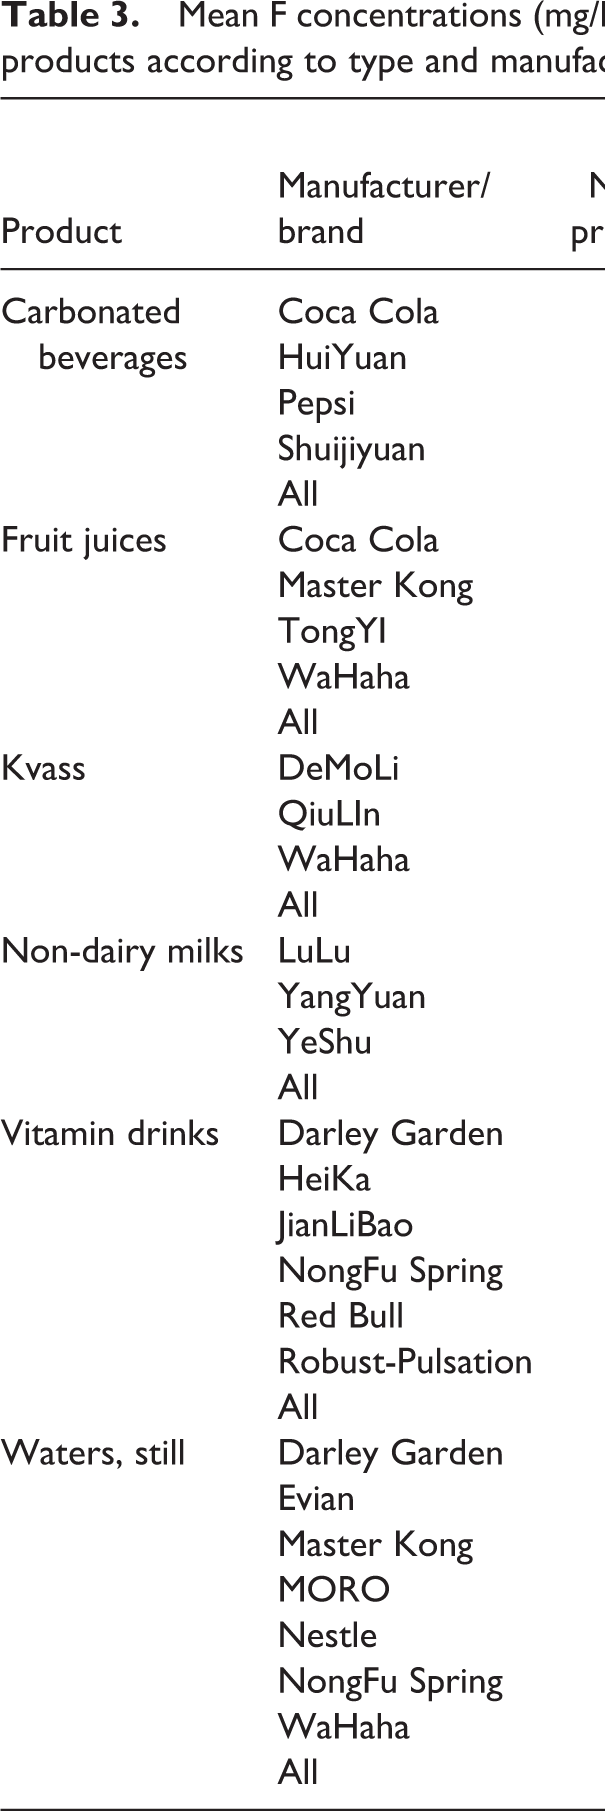
There was considerable variation in the mean F concentration of similar products manufactured by different companies (Tables 2 and 3). The largest variation in F concentration between manufacturers was found for ‘herbal teas’, ranging from 0.023 mg F/l for a herbal tea manufactured by Wong Lo Kat to 0.403 mg F/l and a corresponding product manufactured by Master Kong. The Master Kong brand also comprised the highest number of products (n = 22) with an overall F concentration ranging from 0.012 mg/l to 1.417 mg/l followed by the Coca Cola brand with 19 products ranging from 0.025 mg F/l to 0.408 mg F/l and the Pepsi brand with 10 products ranging from 0.050 mg F/l to 0.303 mg F/l (Tables 2 and 3).
When the F concentration of each individual drink product was considered, a substantial variation in F concentration between batches was found for some products, with a two-fold difference seen for 60 (57%) products and a three-fold or more difference seen for 18 (17%) products. However, in only 4 out of the 18 products was the difference in mean F concentration between batches more than 0.2 mg/l, with the largest between-batch variation in F concentration being for a green tea manufactured by Master Kong in Harbin.
Table 4 summarises the F concentration of drinks by production site. The majority of products (n = 35) were manufactured in Harbin and surrounding towns in Heilongjiang Province with a mean F concentration ranging from 0.014 mg/l to 0.468 mg/l for these products that were primarily carbonated beverages (n = 19) and fruit juices (n = 8). Fifteen products were manufactured in Shenyang, Liaoning Province, with fruit juices (n = 8) as the primary products. These were followed by Beijing (n = 10), Changchun, Jilin Province (n = 10) and Hebei Province (n = 10) as popular manufacturing locations.
F concentration (mg/l) of all drinks by production site.
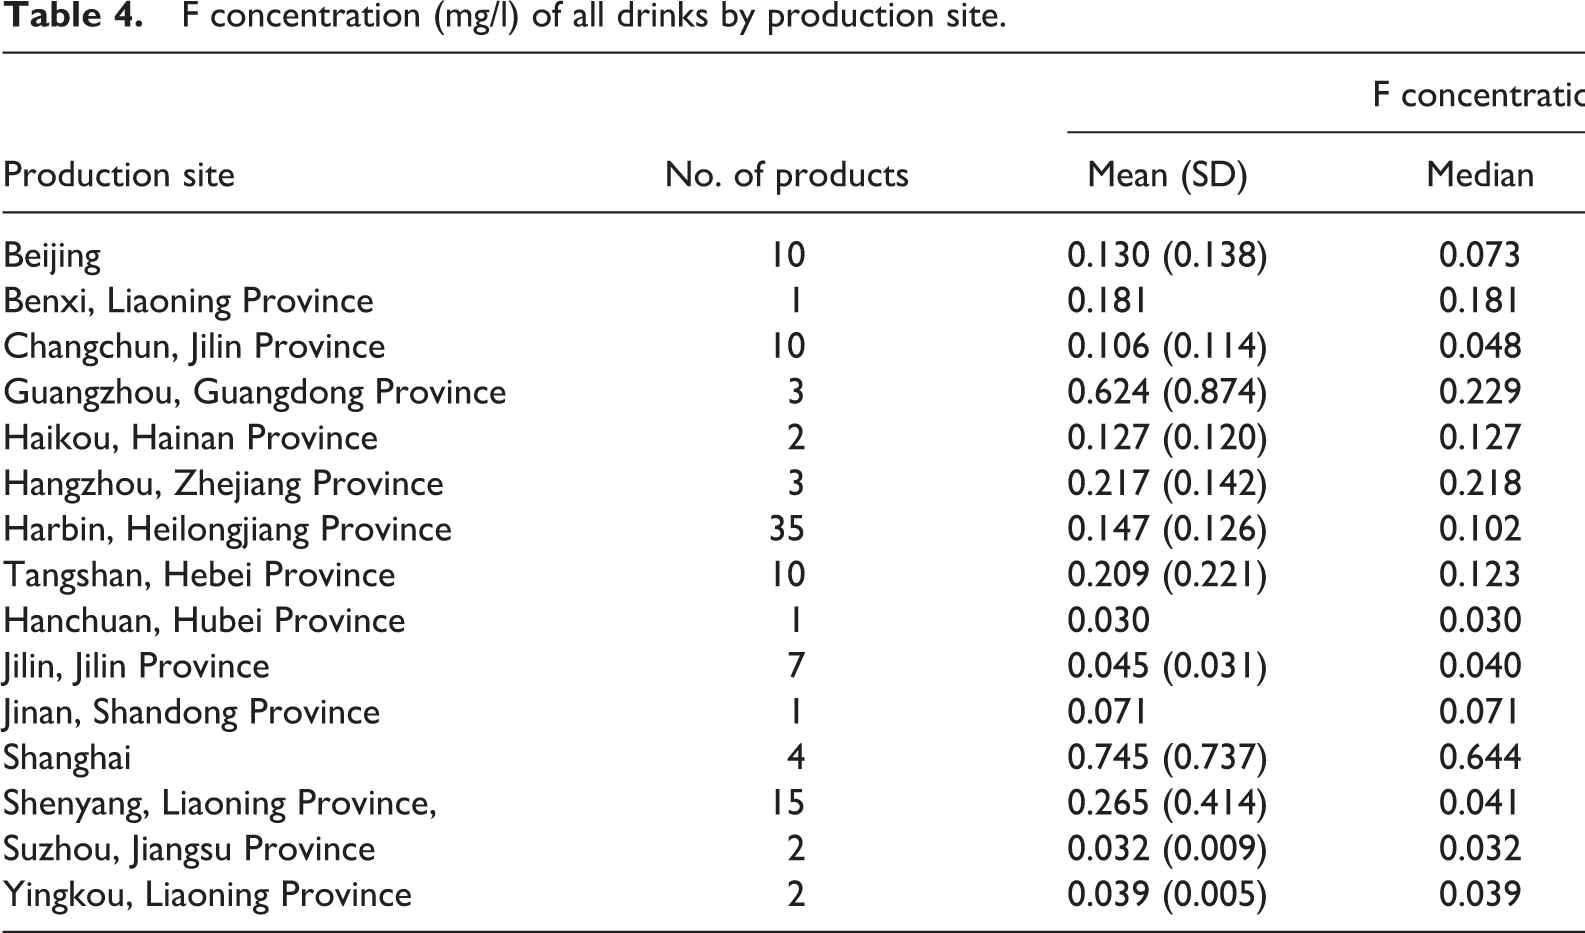
The results showed a non-significant variation in F concentrations of fruit juices manufactured at seven different production sites (range: 0.022 mg F/l in Changchun, Jilin Province, to 0.038 mg F/l in Yingkou, Liaoning Province); however a substantial variation in F concentrations was found for vitamin drinks (n = 12) manufactured at the five different production sites (range: 0.053 mg F/l in Changchun to 0.229 mg/l in Guangzhou).
The maximum amount of F ingested through consumption of beverages including ‘teas with milk’ containing 1.625 mg F/l was estimated at 0.037 mg/kg bw/day for a 15 kg child and 0.005 mg/kg bw/day for a 60 kg adult in Heilongjiang Province. However, when the tea categories were excluded, the corresponding figures for F intake through beverages were 0.015 mg/kg bw/day and 0.002 mg/kg bw/day, respectively (Table 5).
Estimation of F ingested (in mg/day and mg/kg bw/day) through consumption of beverages byn Chinese children and adults.
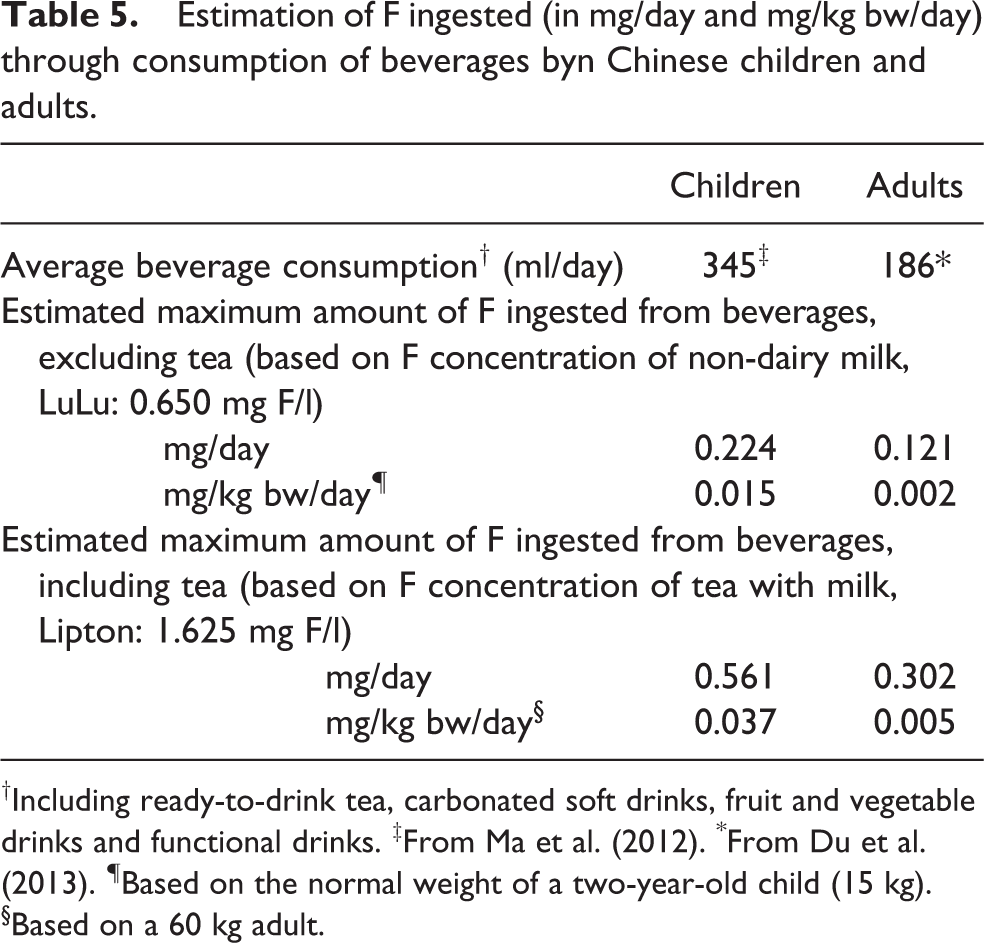
†Including ready-to-drink tea, carbonated soft drinks, fruit and vegetable drinks and functional drinks. ‡From Ma et al. (2012). *From Du et al. (2013). ¶Based on the normal weight of a two-year-old child (15 kg). §Based on a 60 kg adult.
Discussion and conclusions
This study is, to our knowledge, the first to investigate and report F content of soft drinks in China. In this study, three different batch-numbered items for each of 106 ready-to-drink products, manufactured by a total of 26 companies, were analysed for their F concentration. One limitation of the study was that all 318 items were purchased from only one geographic area (i.e. Harbin, Heilongjiang Province, north east China); therefore, although they are strongly representative of that area, they may not fully represent the nature of soft drink products used elsewhere in China. The study was also limited in that the products were purchased from main supermarkets but not from local independent shops; consequently extrapolation of the results warrants cautious consideration. However, according to the China Beverage Market Report (Chow, 2011), production of soft drinks is much higher in the east of China than in the west of the country, and eastern cities make up the largest market for soft drink consumption when comparing the amount of sales in absolute terms (Chow, 2011). According to our study, the proportion of drinks produced in Harbin was greater than the other production sites identified for the 318 purchased items.
The results revealed a substantial variation in F concentration of the drink products with the lowest F concentration found in fruit juice and the highest F concentration in tea. Generally, the F concentration of any drink depends on the endogenous F contained in ingredients as well as the F content of water used to prepare the product.
There is no report on F concentration of ready-to-drink products in China for comparison with the results of this study. However, several studies from China have reported F concentrations for tea infusions. Cao and co-workers (Cao et al., 2006) measured F concentrations of several brands of teas including two black stick teas produced and marketed in China. They reported mean F concentrations of 1.08 mg/l and 1.45 mg/l for the two tea infusions, each of which were brewed for 10 minutes using deionised water. Another study from China (Cao et al., 1996) reported a mean (SD) F concentration of 1.81 (1.09) mg/l for a brick tea infusion prepared using water containing an F concentration of 0.70 mg/l from Eijin Horo Banner (Li et al., 2009), while an F concentration of 2.59 (1.73) mg/l was reported for a brick tea from Tibet and 0.55 (0.16) mg/l for a green tea from Han, both of which were brewed using low F water (0.11 mg F/l).
According to the Mintel Report in 2012 (Hong, 2012), the average annual consumption of ready-to-drink tea in China was 11.5 litres per capita (31.5 ml/day/person). On this basis and the results of the current study on F concentrations of ready-to-drink teas, the range of F intake from ready-to-drink tea consumption in Heilongjiang Province could be from 2.3 × 10⁻⁵ mg/day (herbal tea, Wong Lo Kat: 0.023 mg F/l) to 0.051 mg/day (tea with milk, Lipton: 1.625 mg/l). These estimates, however, should be treated with some caution since they are based on the F concentrations of the 24 tea samples purchased from main supermarkets, while other teas with higher and/or lower F concentrations might be sold in local independent shops.
A study in Poland (Malinowska et al., 2008) reported the F concentrations of five ready-to-drink teas that ranged from 0.66 to 1.65 mg F/l, close to the range reported in the present study. The latter study also reported F concentrations of teas infused for 5 minutes as ranging from 0.32–4.54 mg/l for black teas, to 0.37–0.54 mg/l for white teas and 0.02–0.09 mg/l for herbal teas. However, the F concentration of drinking waters used for brewing the teas was not reported in the Polish study. The overall F concentration of a tea depends on the F concentration of its constituent tea leaves as well as the water used in its preparation. Generally, the F concentration of tea leaves, which contain 98% of the F of the whole plant, could be up to 1000 times higher than that in water and 2–7 times that found in the soil (Lu et al., 2004). It has also been reported that the F concentration in tea leaves increases with increasing maturity and lessening quality grades of leaves (Lu et al., 2004).
The mean F concentration of carbonated beverages, in the present study, was narrower than the range of 0.02–1.28 mg F/l reported by Heilman and co-workers (Heilman et al., 1999) for carbonated drinks, sold in Iowa, US.
The F concentration of all fruit juices, vitamin drinks and bottled waters tested in the present study was less than 0.2 mg F/l, while the highest F concentration of the non-dairy milks was 0.650 mg F/l. The non-dairy milk samples tested in the present study were made from coconut, walnut, peanut and almond, and there are no data on F concentration for these types of milks in the literature for comparison with the results of the present study. Of the non-dairy milks, almond milk manufactured by LuLu in Hebei Province had the highest F concentration. There was a considerable difference in F concentrations of the two coconut milk products manufactured by the same company (YeShu) at the same site (Haikou, Hainan Province) but sold in a can (0.21 mg F/l) and in a cardboard carton (0.042 mg F/l). In the present study, an adequate number of similar products manufactured by the same company in the same area was not available to compare the effect of container type on F concentration of samples. More studies are needed to establish a possible container effect on the F concentration of non-dairy milk products. Researchers have reported a decreased F concentration of water boiled in aluminium and in glass containers, whereas an increased F concentration has been reported with Teflon and stainless steel containers (Full and Parkins, 1975; Kandavel et al., 2015). It was also reported that F concentrations of contents were more stable in plastics than in glass containers (Hattab, 1981). However, the study by Heilman and co-workers (Heilman et al., 1999) found no substantial differences between type of container, flavour or between diet and regular soft drinks, but reported that the variation in F concentration of soft drinks analysed was mainly due to the F concentration of water used at different production sites. The present study also found some variation in F concentration of drinks manufactured at different production sites. However, in many cases the production sites, as labelled, referred to the province where the product was manufactured but not the exact location within the province. Although there was no information on F concentrations of waters used at the site to produce the drinks, the literature reports variations in the F concentration of drinking waters in the localities of production sites cited in the present study. According to the second Chinese NOHS (Hong-Ying et al., 2002), F concentration of drinking water was 0.25–0.40 mg F/l in urban areas and <0.5 mg F/l in rural areas of Beijing, <0.5 mg F/l in Hubei and 0.45–0.61 mg F/l in Shanghai. In addition, the F concentration of 21 drinking water samples collected in Suzhou showed a wide range from 0.28 mg/l to 1.19 mg/l (Gao et al., 2013).
The study found considerable differences in F concentrations between batches of some drink products. This could be due to the variation in F concentration between waters used at the production site and/or the endogenous F of natural ingredients. Weather factors such as rainfall and temperature can influence F contents of waters. Extensively different F contents of waters between wells within one village community have also been reported as a result of variations in the local hydrological conditions, and the F content of ground water may also fluctuate depending on the presence of F-containing geological formations at different depths (Li et al., 2016).
According to the National Standard of the People’s Republic of China for Municipal Water Standard GB 5749 – 2006, developed by the Ministry of Health, the standard F concentration for drinking water is 1 mg/l for urban areas and 1.2 mg/l for rural areas (China Ministry of Health, 2006). The present study only found a F concentration of more than 1 mg/l F in four ready-to-drink tea products. Based on the scientific research and guidelines established by the US National Institute of Dental and Craniofacial Research (US Department of Health and Human Services, 2000), based on normal consumption levels, the lowest effective concentration of F in drinking water to warrant optimal oral health benefit is 0.7 mg/l. In the present study, of the drink products analysed, only five products (tea with milk drinks) contained more than 0.7 mg F/l. In addition, according to the estimation of F intake from drink consumption in the present study (Table 5), the maximum amount of F ingested was less than the so-called optimum F intake of 0.05 mg/kg bw/day (Burt, 1992). However, it is not only the F concentration of drinks but also the F content of other dietary and non-dietary sources as well as dietary and oral hygiene habits that determine total F exposure in a community. For example, high dietary F exposure has been reported in some parts of China as a result of consumption of maize polluted by fly ash produced by the burning of high F coal (Yan, 1991).
In China, more than 66% of five-year-olds and 61% of adults have experience of dental caries (Hu et al., 2011), while, concurrently, there are more than 26 million cases of dental fluorosis resulting from drinking waters with high F concentrations and another 16.5 million cases due to coal smoke pollution (Fewtrell et al., 2006). Due to this distinctive situation of F exposure in China, any oral health promotion strategy involving the use of F needs to be considered and planned carefully at a local province level rather than nationally. Of key importance is the evaluation of F exposure and sources of F exposure, especially during the first five years of life when there is a greater risk of development of dental fluorosis of aesthetic concern in teeth.
In summary, it can be concluded that drinks (excluding tea) do not appear to be a main source of F intake in Heilongjiang Province, China and consequently are unlikely to constitute a substantial risk factor in the development of dental or skeletal fluorosis when consumed in moderation. However, in view of China’s size in geographical and population terms, decision and policy making for health at a local or regional authority level might be the most appropriate approach to address any issues of over- and under-exposure to F. With this approach in mind, more localised research is required to provide the strength of evidence that policy makers will need in order to manage dental and skeletal fluorosis without losing the beneficial caries-preventive effect of fluorides in the community.
Footnotes
Declaration of conflicting interests
The authors declared no potential conflicts of interest with respect to the research, authorship, and/or publication of this article.
Funding
The authors received no financial support for the research, authorship, and/or publication of this article.