
Abstract
Background:
Kinanthropometry offers to exercise and health professionals a standardized procedure of acquiring surface anatomical measurements that might be used to track changes in body composition.
Aim:
To describe simple anthropometric indices to monitor body composition changes in amateur and elite athletes, and to provide reference values during the competition phase.
Methods:
A search of articles indexed in PubMed/MEDLINE, ScienceDirect, Cochrane, and SciELO databases using the string body composition AND (anthropometric OR skinfolds OR circumferences OR girth OR estimation equation) AND “body fat”. Inclusion criteria were: quantitative and/or qualitative research published between 2009 and 2020, written in English or Spanish, reporting simple anthropometric indices that included skinfolds, girths, or basic measures in amateur and elite athletes.
Results:
A total of 51 studies (Price’s index = 66.4%) met all the inclusion criteria and were included in this scoping review. Contrary to the frequent practice, the use of a regression equation might not be accurate to evaluate body composition. To avoid this, anthropometrists should base their analysis on the absolute values of the sum of skinfolds (∑S) and related variables, such as skinfold-corrected girths and lean mass index. While not definitive, because further research is required, the practical recommendations and updated reference values in competition phase provided by this review would contribute to the accurate identification of body composition changes.
Conclusions:
∑S and lean mass index have been shown to be valid for monitoring changes in fat mass and fat-free mass, respectively. More research is needed to derive the lean mass index-specific coefficient for each sports population.
Keywords
Introduction
Currently, several socio-technological phenomena generate confusion, malpractices, and problems in the development of specialized knowledge and the communication of science in exercise, sport, and health. Among these situations are misinformation, biased professionals, monetary interests, influencers and their thousands of followers (i.e. broscience/pseudoscience), predatory journals, among others that are categorized under the concepts of scienciness (Burke, 2017), and junk science (Dadkhah et al., 2018; Fisher, 2019). In this context, kinanthropometry (kine- movement, anthropos- human, and metron- measurement), as a discipline for analyzing the influence of several factors affecting the morphological characteristics and body composition (BC) in physically active individuals or athletes (training, recovery, and nutrition; Figure 1), has been negatively affected by each of the socio-technological factors mentioned above.
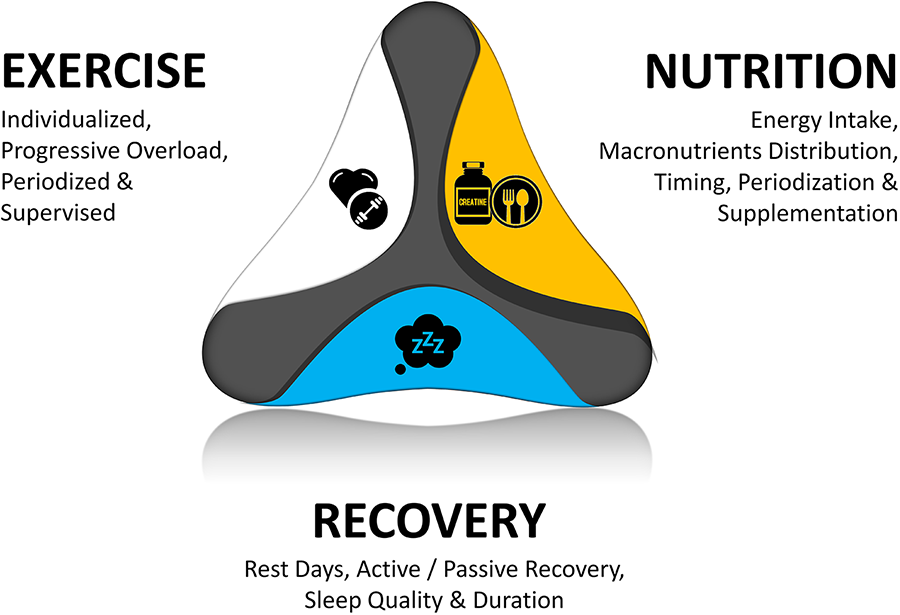
Factors affecting morphology and body composition. Exercise, recovery, and nutrition promote physiological adaptations by several mechanisms. Assessment of different variables, including body composition, should be performed during the time course of the athletes’ preparation or for aesthetic goals.
In practice, misunderstanding and technical errors are common not only when making measurements but also during the data analysis process. Thus, the standardization of the technique at the international level, following the standards of the International Society for the Advancement of Kinanthropometry (ISAK) (Esparza-Ros et al., 2019), has contributed significantly: (a) to the reduction of the technical error of measurement (TEM); (b) to the increase in the reproducibility of studies; and (c) to the preservation of professional ethics in nutrition, medicine, training, and other disciplines that frequently collect kinanthropometric data. Kinanthropometry offers to exercise and health professionals a scientific procedure of acquiring surface anatomical dimensional measurements, which in spite of its limitations is easily accessible, inexpensive, short in duration, mobile, and routinely used in many sports (Zemski et al., 2018b). In the ISAK handbook for instructors (ISAK 3 and criterion/ISAK 4) and the reference manual for technicians (ISAK 1 and 2), the international anthropometric standards are described. These data not only encompass basic measurements, such as body mass (BM), stature (height), sitting height, and arm span, but also three general categories that provide important information about BC and morphology: skinfolds, as indicators of subcutaneous body fat; girths, as indicators of muscle and fat mass; and breadths and lengths, as indicators of bone structure (Esparza-Ros et al., 2019). In fact, the International Olympic Committee research working group on body composition, health, and performance recommends the procedures established by the ISAK (Larson-Meyer et al., 2018).
Anatomical landmarks correspond to body references that can be easily identified with good technique and practice. Special attention should be paid to obese participants since it is more difficult to locate the marks, although this is out of the scope of this review. In brief, every anthropometrist must: (a) find these points of reference by palpation; (b) release the site; (c) relocate the landmark; (d) mark the site using a dermographic pen once it is verified; and (e) re-check the mark before continuing with the measurement protocol. People interested in working with kinanthropometric data have to follow the rule: all landmarks are identified before any measurements are made (Norton and Eston, 2018). It is important to highlight based on our experience that many people doing anthropometry do not mark, which can affect the TEM and validity of the data.
All anthropometrists or professionals interested in collecting data are encouraged to follow the ISAK protocol verbatim (Esparza-Ros et al., 2019) since, for instance, measuring 1 cm away from a defined site produces significant differences in the majority of obtained skinfold values (Hume et al., 2018). Ensuring the skinfold caliper is calibrated (e.g. using an engineer’s Vernier caliper or even sponge as inner calibration), performing repeated measurements (two or three per site), among other recommendations, are within the reference manual of the international anthropometric standards (Esparza-Ros et al., 2019; Norton and Eston, 2018). Similar to the location of landmarks, there are important features to highlight throughout data collection and subsequent analysis for the correct interpretation of the data and a consequent application for the exerciser/athlete’s intervention. For example, during the annotation of the anthropometric measurements, there may be an error by number handling (human error) when recording the data in the proforma. This error is very common in the field of research when the investigator has a recorder (e.g. beginner anthropometrist or student) who is not focused/experienced in the correct way to register the numbers that are dictated by the anthropometrist. The most common mistakes when making the data registrations are number mistyping (e.g. Ø is recommended instead of zero) and mishearing. Additionally, in practice, a common issue is the frequent reductionism due to both the argumentum ad verecundiam and the wrong extrapolation of conclusions from articles published in specialized journals, which directly affects data analysis. Therefore, the analysis of the recorded data is frequently often out of context, considering the lack of preparation of professionals in matters of descriptive, inferential, and/or estimation statistics and data interpretation, even though there are easy-to-understand materials in this regard (Cumming, 2013a, 2013b; Norton and Olds, 2007). All aspects mentioned above make it necessary to update recommendations when analyzing anthropometric data with the aim to evaluate BC changes over time in physically active individuals and athletes, especially when a more valid methodology like dual-energy X-ray absorptiometry (DXA) is inaccessible.
Objective
Thus, to identify gaps in the literature to aid the planning and commissioning of future research and evidence-based practices, this scoping review aims: (a) to describe simple anthropometry-based calculations to track BC in amateur and elite athletes, while we discuss the best practices to monitor these changes, and (b) to summarize findings in several sports disciplines and provide reference values among amateur and elite athletes.
Methods
Protocol and registration
This study employed the guidelines for Preferred Reporting Items for Systematic reviews and Meta-Analyses extension for Scoping Reviews (PRISMA-ScR) (Tricco et al., 2018). The aim of this methodology was to synthesize the available evidence regarding simple anthropometric indices to track BC in amateur and elite athletes, and provide reference values in sports populations. The scoping review allows a more inclusive/heterogeneous sample of studies that account for the different types of evidence or data sources (e.g. quantitative and/or qualitative research) that may be eligible as opposed to only studies. As this review was not eligible to be registered on PROSPERO, the summary information was uploaded to Figshare to make it publicly accessible in order to avoid unnecessary duplication (https://doi.org/10.6084/m9.figshare.12618887).
Eligibility criteria
The inclusion criteria for this scoping review were as follows: (a) empirical or theoretical articles (quantitative, qualitative, mixed methods studies); (b) studies published between 2009 and 2020; (c) written in the English or Spanish language; (d) reporting simple anthropometric indices that include either skinfolds, girths or basic measures (body mass and stature); and (e) studies performed in amateur and elite athletes. Additionally, data published in studies with a sample size greater than or equal to 10 participants were included to extract reference values. The search excluded papers on participants of <15 or >45 years old, on unhealthy population, commentaries, editorials, letters to the editor, and books.
Search and sources of evidence
In order to summarize recently published data, we performed a search of articles indexed in PubMed/MEDLINE, ScienceDirect, Cochrane, and SciELO databases using the following Boolean algorithm: body composition AND (anthropometric OR skinfolds OR circumferences OR girth OR estimation equation) AND “body fat”. The data search was enriched by using the string NOT obesity NOT overweight NOT disease in all databases, besides the free language terms related to “skinfolds, anthropometric, circumferences, equation or body fat percentage” in Google Scholar. To capture relevant articles for the review, the search of the databases took place during the first week of July 2020.
Data charting process and items
Databases were evaluated for articles that met the inclusion criteria. Those publications that met all the requirements went on to the next phase of data analysis and synthesis. In brief, simple anthropometric indices used for tracking changes in BC were summarized and discussed. Furthermore, a table with the population characteristics (sport, sample size, sex, region, age, stature, and study year) and relevant anthropometric indices to track changes in the percentage of body fat (%BF) was developed. Discrepancies were identified and resolved through discussion between authors where necessary.
Results
Selection of sources of evidence
The first search, solely with the Boolean algorithm, resulted in 6311, 14,569, 1141 and 51 references from the PubMed/MEDLINE, ScienceDirect, Cochrane, and SciELO databases, respectively. After activation of the filter options of the databases, it resulted in 722 publications although after the removal of duplicates and the screening of articles to meet the inclusion criteria (a to c) we found 280 potential studies. However, after reviewing the abstracts, 184 were excluded due to ineligibility. From the remaining publications, 45 articles were excluded since they had low sample size (<10), had low homogeneity to extract reference values, were focused on BC changes after a certain nutritional or supplementation intervention, or had data missing. A total of 51 studies (Price’s index = 66.4%) met all the inclusion criteria and were included in this scoping review. Figure 2 represents a flow chart of the article selection process.
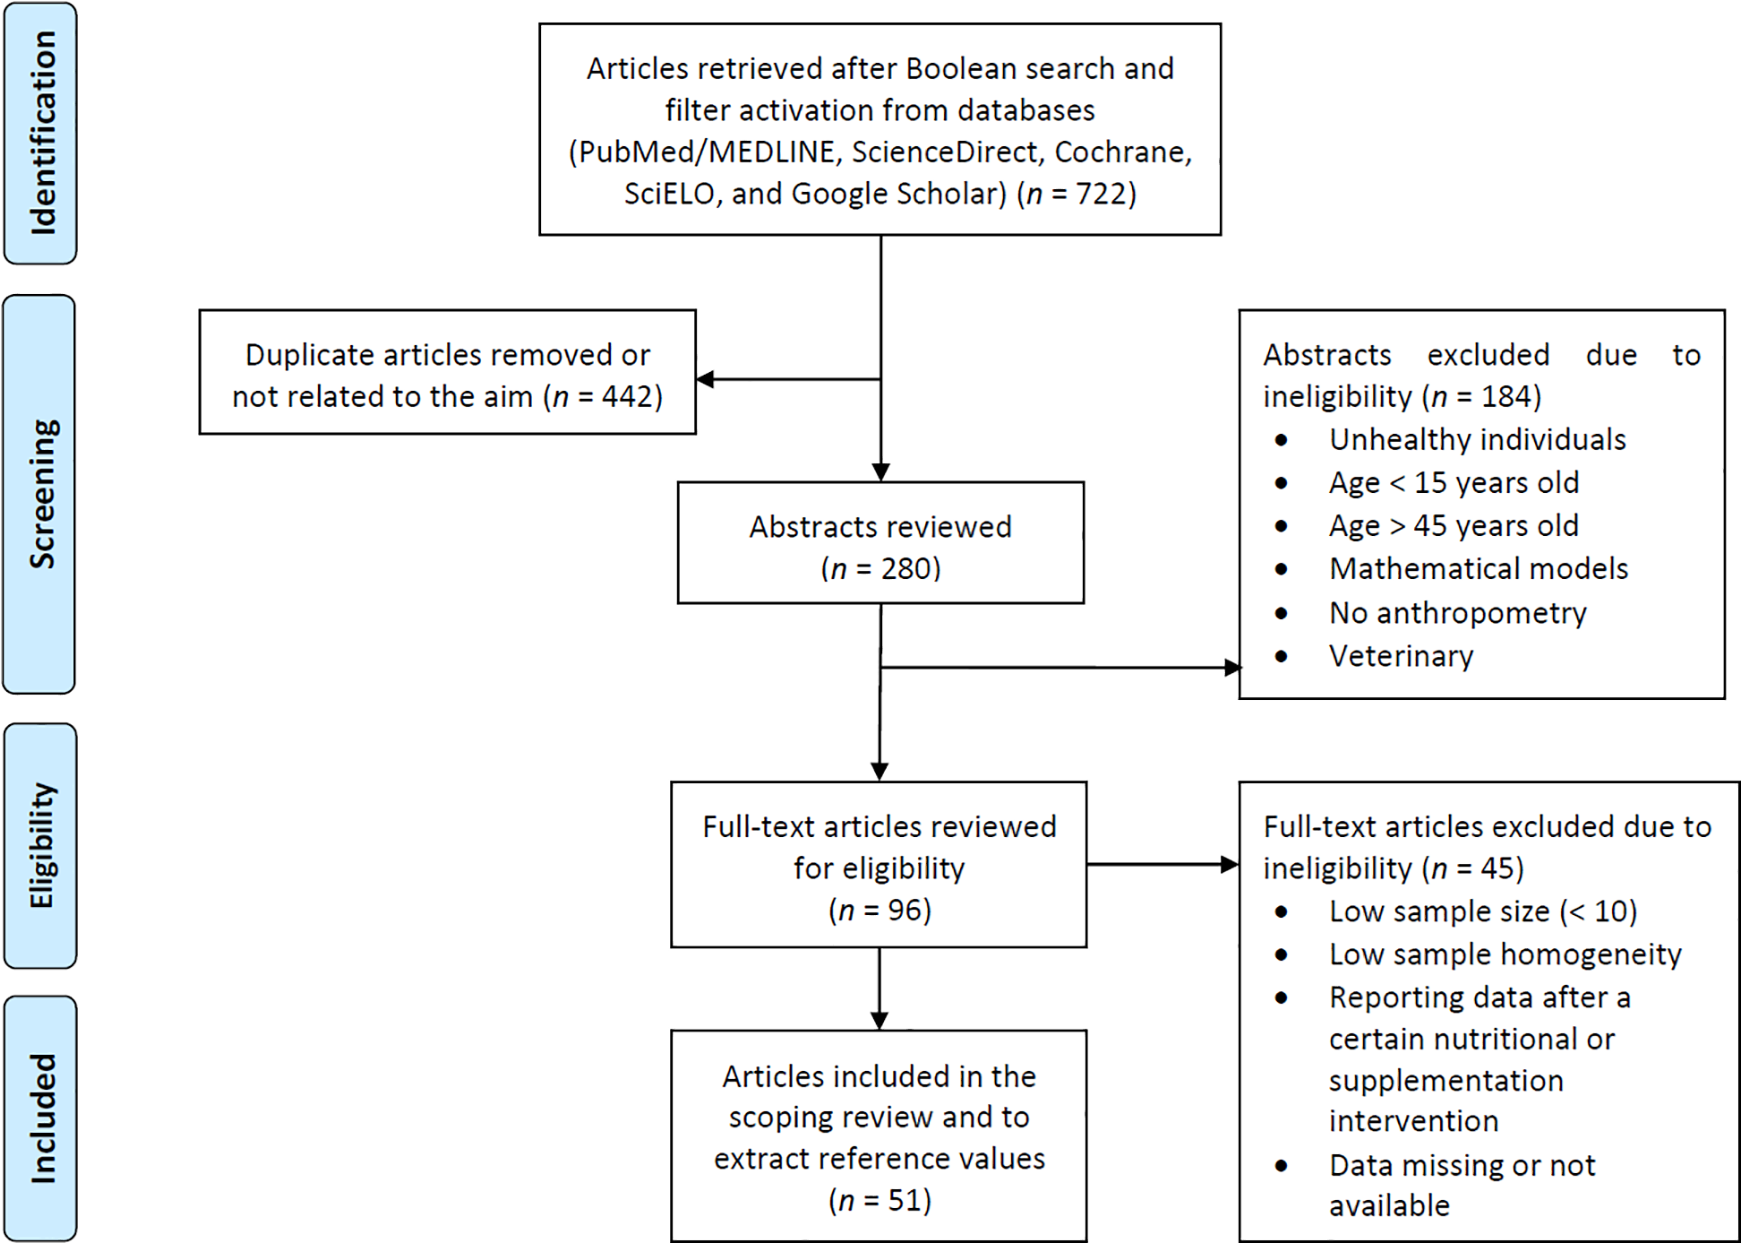
PRISMA flow chart of the scoping review.
Characteristics of sources of evidence
Table 1 shows the characteristics of the obtained studies, with useful information regarding BC during the competition phase in different sport populations. While not definitive, these values of sum of skinfolds (∑S) and estimated/quantified %BF will provide helpful guidance for athletes’ preparation, but further research is needed to have reference values in each country and to evaluate the validity of lean mass index (LMI) in other sports. Moreover, the high between-study heterogeneity when reporting anthropometric variables (e.g. number of ∑S) is itself informative as it might be seen as an opportunity to standardize and explore missing data that contribute to the literature.
Fat percentage and/or sum of skinfolds in different female and male sports populations in competition phase.
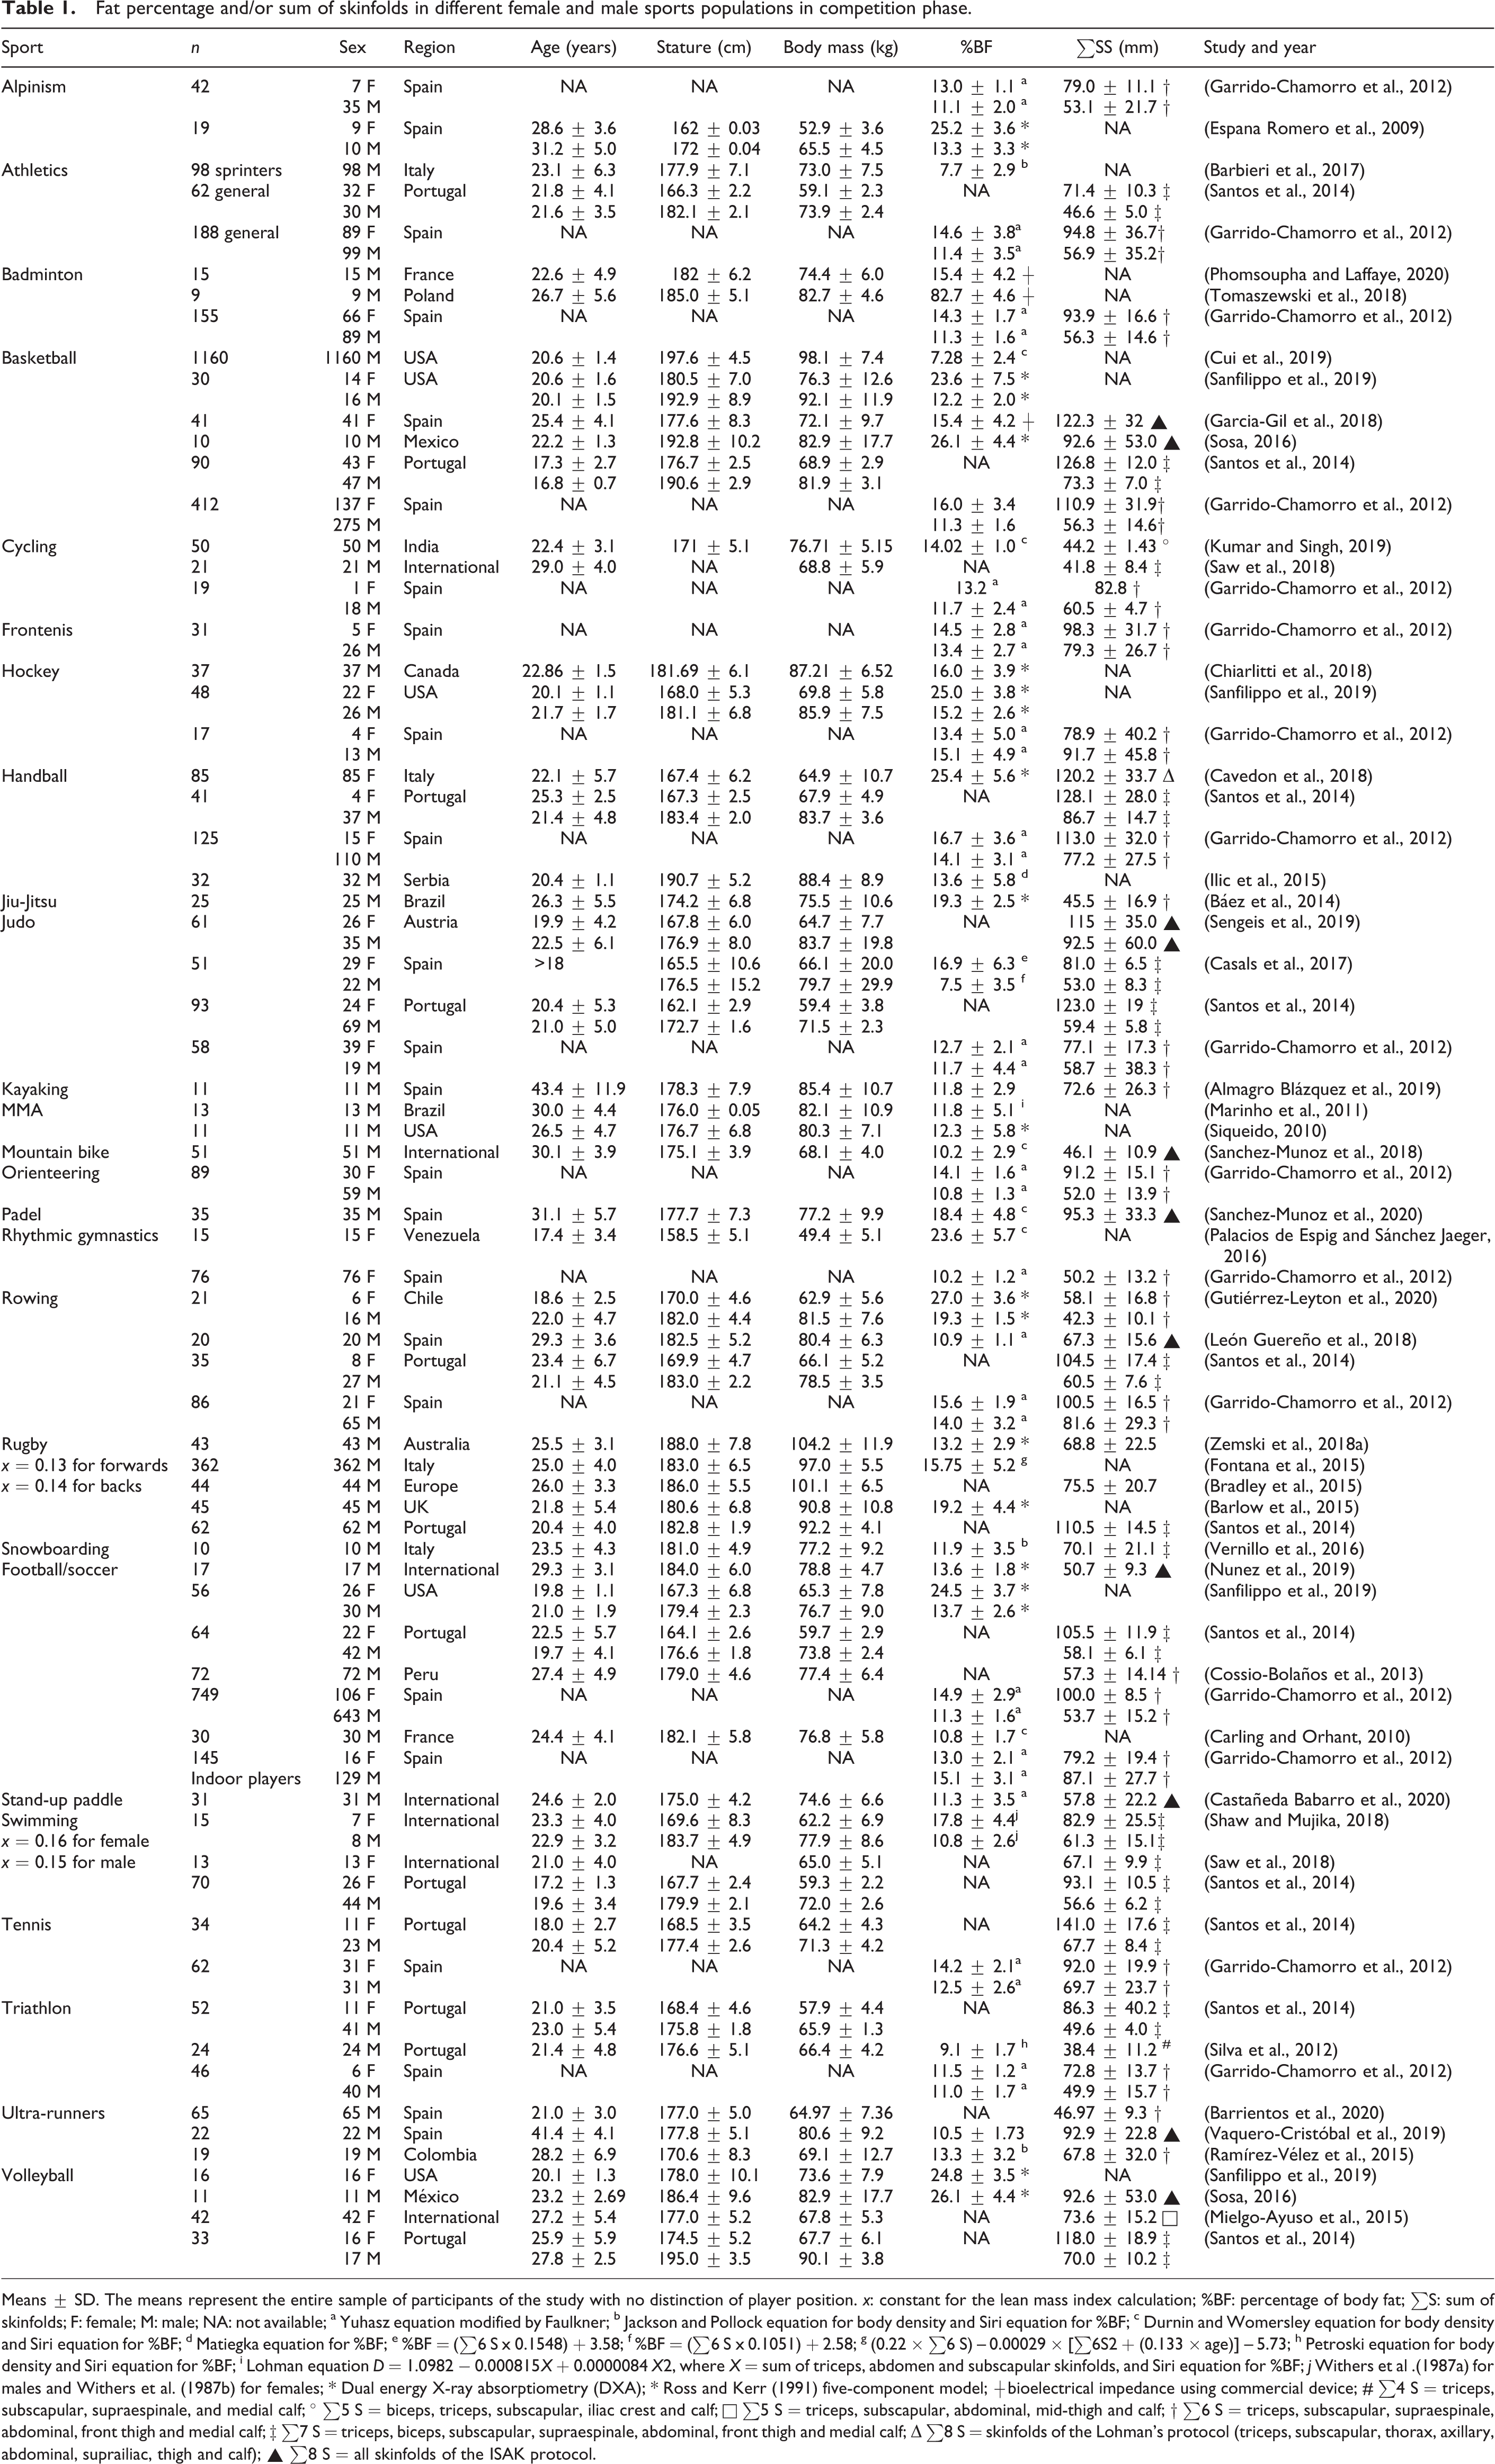
Means ± SD. The means represent the entire sample of participants of the study with no distinction of player position. x: constant for the lean mass index calculation; %BF: percentage of body fat; ∑S: sum of skinfolds; F: female; M: male; NA: not available; a Yuhasz equation modified by Faulkner; b Jackson and Pollock equation for body density and Siri equation for %BF; c Durnin and Womersley equation for body density and Siri equation for %BF; d Matiegka equation for %BF; e %BF = (∑6 S x 0.1548) + 3.58; f %BF = (∑6 S x 0.1051) + 2.58; g (0.22 × ∑6 S) – 0.00029 × [∑6S2 + (0.133 × age)] – 5.73; h Petroski equation for body density and Siri equation for %BF; i Lohman equation D = 1.0982 − 0.000815X + 0.0000084 X2, where X = sum of triceps, abdomen and subscapular skinfolds, and Siri equation for %BF; j Withers et al .(1987a) for males and Withers et al. (1987b) for females; * Dual energy X-ray absorptiometry (DXA); * Ross and Kerr (1991) five-component model; † bioelectrical impedance using commercial device; # ∑4 S = triceps, subscapular, supraespinale, and medial calf; º ∑5 S = biceps, triceps, subscapular, iliac crest and calf; □ ∑5 S = triceps, subscapular, abdominal, mid-thigh and calf; † ∑6 S = triceps, subscapular, supraespinale, abdominal, front thigh and medial calf; ‡ ∑7 S = triceps, biceps, subscapular, supraespinale, abdominal, front thigh and medial calf; Δ ∑8 S = skinfolds of the Lohman’s protocol (triceps, subscapular, thorax, axillary, abdominal, suprailiac, thigh and calf); ▴ ∑8 S = all skinfolds of the ISAK protocol.
In the following sections, we discuss several anthropometric indices found in the reviewed articles in order to improve anthropometrists’ praxis (beginners and intermediate experience).
Equations to estimate percentage of fat mass
Kinanthropometry is considered a doubly indirect method when the aim is to evaluate BC, or more specifically to estimate the %BF based on a two-component model (Wang et al., 2000). This is because from the recorded data (skinfolds and sometimes girths) it is possible to estimate body density by applying regression equations that have been developed by different authors using a “gold standard” comparison (e.g. DXA, nuclear magnetic resonance), which in turn indirectly estimates the BC of an individual. Consequently, there are more than 100 available equations in the scientific literature that use anthropometric measurements for the prediction of body density and %BF. In this process, the use of additional formulas is required, such as Siri (1956), Brozek et al. (1963), or Willmore and Benkhe (1969, 1970). However, there are differences in the accuracy level of using any of these equations to estimate the %BF from body density in certain populations (Guerra et al., 2010). This might be due in part to the lack of comparable experimental data to support the initial conclusions in the human body (i.e. Siri), given they have been demonstrated extensively in animal models, such as the guinea pig (Pitts, 1956).
Unfortunately, in an attempt to fulfill the insistent feedback demands of exercisers/athletes in regards to %BF, many professionals in exercise, sport or health sciences incorrectly choose the estimation equation to track changes in BC. Generally, the most commonly used equations are (a) Durnin and Womersley (1974) for sedentary population; (b) Jackson and Pollock (1978), Jackson et al. (1980), Harbin et al. (2017) for physically active men and women; and (c) Yuhasz (1962) or Faulkner (1968) for sub-elite and elite athletes. However, anthropometrists should be aware of the recent validation studies (compared to DXA), which have revealed new equations for different populations, such as Caucasian young male and female football players (Lozano-Berges et al., 2019), international soccer players of the Italian Serie-A (Nunez et al., 2019), professional Mexican male soccer players (Gonzalez-Mendoza et al., 2019), Spanish elite youth male soccer players (Munguía-Izquierdo et al., 2018), Japanese male athletes (Takai et al., 2018), Colombian adult women (Aristizabal et al., 2018), physically active women and men (Lahav et al., 2018), southern Brazilian adolescents (Ripka et al., 2017), Italian female handball players (Cavedon et al., 2018), and young Iranian wrestlers (Riyahi-Alam et al., 2017). In “fitness” and bodybuilding, the success and achievement of goals can be accounted for in large part by easily obtained physical variables, as Fry and colleagues (Fry et al., 1991) demonstrated after they analyzed anthropometric features as discriminators of success in North American bodybuilders. It has been established that the Lohman equation (Lohman, 1981) might be particularly appropriate for the estimation of body density in extremely muscular and lean bodybuilders, which may also be appropriate in male athletes with similar physical characteristics (Fry et al., 1987). It should be noted that the Yuhasz equation has been also used to track changes in bodybuilding competitors (Manore et al., 1993). Furthermore, Sesbreno et al. (2020) not only reported a new equation that could be useful for tracking BC changes across a range of physiques if an accepted methodology like DXA is inaccessible, but also showed that equations incorporating skinfolds and limb girths were more effective at explaining the variance in DXA estimates of lean tissue.
A simple recent anthropometric linear equation, designed as relative fat mass (RFM), was proposed as an alternative for body mass index to correlate with whole-body fat in healthy adult Mexican-Americans, European-Americans, and African-Americans (Woolcott and Bergman, 2018). This equation was developed considering the height-to-waist ratio, with height and waist girth expressed in meters (Table 2). Although we already discussed considerable limitations when estimating %BF from conventional anthropometric indices, the external validation of the RFM has shown a strong correlation with DXA in north-west Mexican population (Guzmán-León et al., 2019), and in adolescents from 15 to 19 years (Woolcott and Bergman, 2019); notwithstanding, most of the current research in terms of validation and usefulness of the RFM has been carried out in generalized non-athletic and/or obese populations (Ferrinho et al., 2019; Kobo et al., 2019; Machado et al., 2020; Woolcott and Bergman, 2020). Interestingly, in an athletic population, Takai et al. (2018) demonstrated that an equation with body mass-to-waist circumference and waist circumference-to-body height as independent variables was applicable for predicting whole-body fat-free mass in male athletes, which might reinforce the potential of RFM in an athletic population. Future research might focus on the external validation of this simple anthropometric formula in amateur and elite athletes, since it represents an even faster in-field procedure.
Anthropometry-based calculations to monitor fat mass and/or fat-free mass.
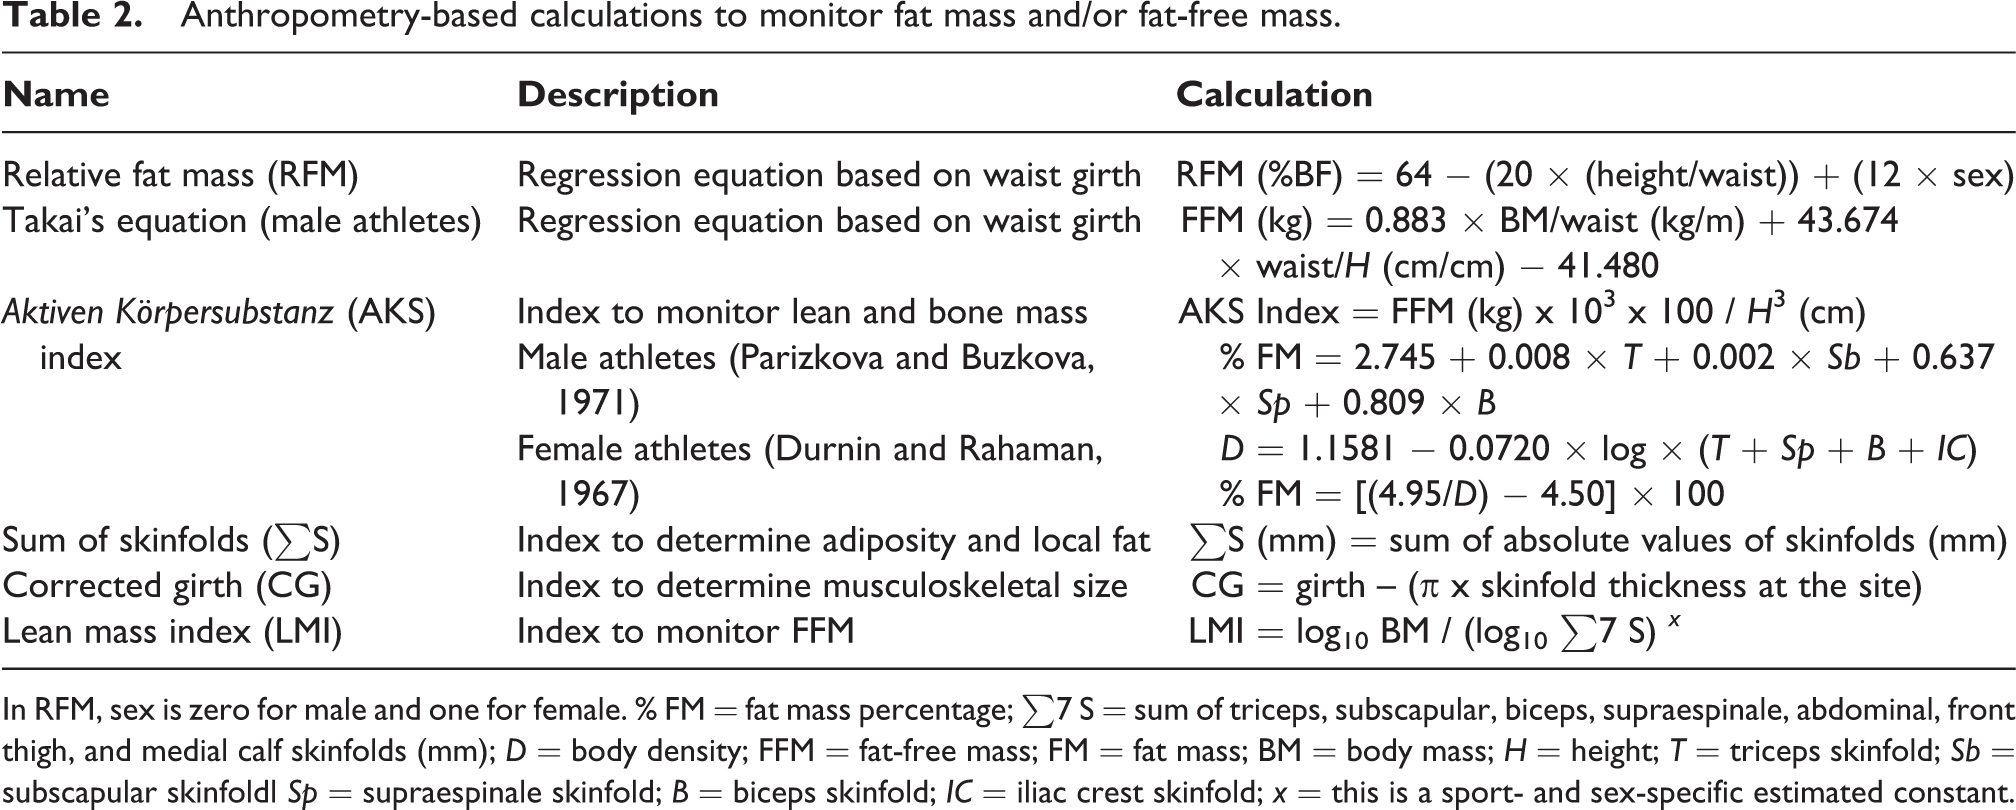
In RFM, sex is zero for male and one for female. % FM = fat mass percentage; ∑7 S = sum of triceps, subscapular, biceps, supraespinale, abdominal, front thigh, and medial calf skinfolds (mm); D = body density; FFM = fat-free mass; FM = fat mass; BM = body mass; H = height; T = triceps skinfold; Sb = subscapular skinfoldl Sp = supraespinale skinfold; B = biceps skinfold; IC = iliac crest skinfold; x = this is a sport- and sex-specific estimated constant.
In general, equations for estimating body density or %BF vary considerably depending on the unique characteristics of each study population, the equipment used, the measurement technique or protocol, and the degree of experience and preparation of the researchers. Interestingly, sex has an important effect on influencing the correlations between DXA and anthropometric indices (Salamat et al., 2015). Based on the aforementioned discussion some authors infer that analyzing the BC of an individual through the values obtained by a kinanthropometric assessment lacks reliability and presents considerable variation (Moreira et al., 2015). Hence, the use of popular and “recommended” equations for certain populations do not seem to have sufficient accuracy when compared to other methods. In the sports field, several studies have also shown that prediction equations developed for non-athletes do not offer good validity for athletes, and should be avoided (Fonseca et al., 2007; Fonseca-Junior et al., 2017; López-Taylor et al., 2018; McLester et al., 2019). Therefore, further studies are needed in order to investigate other valid, reliable, affordable, easily accessible, and safe methods or equations that could replace DXA in the evaluation of %BF in specific populations.
Considering the aforementioned, before using any given equation, it is mandatory for the registered dietitian, sports nutritionist or sports science specialist to perform a preliminary search in different databases to determine the suitability of the equation for predicting body density or %BF, considering it is necessary to map the population in which these prediction equations were developed with the working participants to determine the suitability and avoid misinterpretation. A systematic search strategy proposed by Umapathysivam et al. (2017) is available for guidance in using Boolean terms and the algorithm construction in this regard. Parameters to be considered in the selection of the equation should include the following: (a) the assessed exercisers/athletes should be similar to the ones used to develop the original equation; (b) similarities in age and sex; (c) average adiposity and physical activity levels of both populations; (d) the technique or protocol used in the study; and (e) the equipment used.
Anthropometrists are expected to be aware of the errors involved in the use of regression equations and we, therefore, emphasize the paradigm shift, considering that there are better indices to track the changes in BC during/after nutrition and/or exercise interventions.
Aktiven Körpersubstanz index
The Aktiven Körpersubstanz (AKS) index was first defined by Tittel and Wutscherk (1972), and originally applied to the evaluation of muscle development in athletes and used for anthropometric nutritional assessment. It represents the amount of fat-free mass (FFM) existing in a volume of BM represented by a cube, whose edges have the length of the stature (Henriquez-Pérez et al., 2009). The AKS index is calculated by applying the formula shown in Table 2. This table also shows the regression equations that must be used, according to the sex population, to derive the FFM value from fat mass (FM) calculation.
Arencibia-Moreno et al. (2017) reported that the AKS index is a sensitive parameter for assessing increases in lean body mass and bone mass, since positive variations were found from the physical conditioning phase to competition phase in highly competitive Ecuadorian rugby players, while no significant changes were seen on muscle mass or %BF, both calculated by the Mosteller’s formula (Mosteller, 1987). It has been shown that the greater the muscle and bone mass, the higher the AKS index and the greater the mesomorphism in Colombian karate fighters (Chow-Siado, 2017). Furthermore, this index has been shown to serve as an indicator of the proportion of muscle mass in professional Colombian soccer players (Castillo-Vanegas, 2012) and has been used to track changes in Venezuelan amateur marathoners (Fuenmayor et al., 2018), German shot-putters and javelin throwers (Raschka et al., 2015), and Cuban elite kayakers (Orta Miranda and Torres López, 2020). Thus, the AKS index allows the analysis of musculoskeletal development according to the modality and the training period of an athlete, although care should be taken when using it to compare populations considering that its value depends on the mean stature of the participants.
Sum of skinfolds and related indices
Although the use of regression equations might be recommended for the estimation of %BF in large population studies (where the errors may be due to the sample size) (Fosbol and Zerahn, 2015), if a smaller sample size is available or the aim is to evaluate the exerciser/athlete’s progression, it is advisable to use the ∑S (Reilly et al., 1996). This absolute measurement (expressed in millimeters) not only gives information concerning local fat distribution in the body but also provides an index to determine adiposity, since subcutaneous fat reflects the amount of fat present in the adipose tissue (Ballard et al., 2014; Garrido-Chamorro et al., 2012). In fact, the ∑S may avoid errors and help to increase the accuracy and consistency of the measurements obtained by the anthropometric method (Moreira et al., 2015). A very recent study by Gomes et al. (2020) reported that the ∑8 S (r = 0.959) and ∑7 S (r = 0.911) are very accurate anthropometric tools for tracking changes in BC as compared to the DXA measure of FM, in well-trained Australian female (n = 29) and male (n = 27) athletes from various sports. Therefore, we recommend evaluating changes in FM during a nutrition and/or exercise intervention via variations in ∑S. Importantly, including sites from both the upper and lower-limbs (e.g. ∑8 S, ∑7 S) is worthwhile; however, it should be noted that this kind of anthropometric data is always complemented by other measures (Zemski et al., 2018a).
On the other hand, anthropometric girths might be corrected for the skinfold at the measurement sites using the expression shown in Table 2 (Martin et al., 1990). These skinfold-corrected limb circumferences have been shown to be reliable indicators of musculoskeletal size at each anthropometric location. Several studies have included them as estimators of skeletal muscle mass throughout a time course (García et al., 2018; Idrizovic et al., 2018; Kerr et al., 2007; Mielgo-Ayuso et al., 2015; Ramos-Campo et al., 2016; Vaquero-Cristóbal et al., 2019). Interestingly, Bahamondes-Avila et al. (2018) established a predictive model of jumping performance with simple anthropometric measures (including the corrected middle thigh girth), achieving between 74 and 90% of security for squat and countermovement jump in Chilean adolescent athletes. Additionally, in 2020, a cross-sectional study which aimed to develop a novel equation to estimate appendicular muscle mass in young soccer players showed that the best predictor model (r2 = 0.83, compared with measurements by DXA) was the corrected middle thigh girth. The authors concluded that this predictive equation was valid (Bland-Altman analysis showed a mean difference of 0.049 kg and 95% CI from −1.481 to 1.578 kg), easy to calculate, and a low-cost tool to estimate lower-limbs muscle mass in Chilean athletes (Zapata-Gómez et al., 2020).
Similarly, changes in FFM can be monitored via fluctuations in the LMI, which assesses within-athlete proportional changes in BM controlled for changes in ∑S (Slater et al., 2006). LMI is a function of log-transformed values of BM and the ∑7 S as shown in Table 2, and an estimated constant called x (which depends on the athletic population and sex) (Duthie et al., 2006; Pyne et al., 2006). The log transformation is a widely used method to address skewed data to approximately conform to normality (Feng et al., 2014). This empirical measure of LMI has been validated (r = 0.97 related to DXA) and represents an inexpensive, non-invasive, safe, and in-field methodology (Delaney et al., 2016) that can be used to obtain measures during training or competition; however, more research is needed to assess accuracy (Mitchell et al., 2020) and to derive the specific coefficients for each sports population. Based on reviewed articles, the use of these indicators (∑S, corrected girths, and LMI) might be part of the set of variables to be monitored by a professional during an exercise or nutrition program in different athletic populations (Ackland et al., 2012; Aslan et al., 2019), as an alternative to avoid the use of equations to estimate the %BF.
Technical error of measurement (coefficient of variation)
TEM refers to individual precision measurement and technical variation. As described by Perini et al. (2005), the TEM index allows anthropometrists to verify the precision degree when performing and repeating anthropometrical measurements (intra-tester) and accuracy when comparing their measurements with data from other expert anthropometrists (inter-tester). The absolute TEM is calculated with the equation √∑d 2/2n, where d is the difference between two measurements and n is the number of pairs of measurements. This absolute value can be transformed in the relative TEM in order to obtain the error, expressed as a percentage, corresponding to the total average of the variables analyzed. ISAK has established reference values of intra-TEM for beginner (skinfolds = 7.5%, other measures = 1.5%) and skillful anthropometrists (skinfolds = 5.0%, other measures = 1.0%). Refer to Perini et al. (2005) and Norton and Olds (2007) for a comprehensive systematic explanation for the TEM calculation.
Exploring changes over time
Anthropometrists should perform the kinanthropometry assessment twice, considering as valid repeat measures when the calculated intra-tester is lower than the TEM (Esparza-Ros et al., 2019). Awareness of the percentage of error and the confidence intervals of analyzed data is important to establish real changes over time (i.e. a significant change in BC after several weeks of nutrition and/or exercise intervention) and should help ensure quality in improving the validity of anthropometric measurements (Mony et al., 2016).
Notwithstanding, there are several technical factors that can affect the analysis of anthropometric data and subsequent interpretation. The most frequent and important errors are briefly described below: The biological variation of the individual: time of day, day of the week, menstrual period, hydration (post-exercise, after a shower, etc.), and compressibility of skinfolds (Lohman, 1971). Technique: there are different protocols for carrying out anthropometric measurements; however, the most frequently used and accepted in scientific research is the ISAK protocol (Norton and Eston, 2018). Metrological conditions and equipment: it is recommended to perform measurements with instruments calibrated and certified by metrology laboratories that are validated for use in kinanthropometry (Mony et al., 2016; Norton and Olds, 2007). Error by number handling (human error) when recording the data in the proforma.
Statistically speaking, the calculation of the confidence intervals for the true score is a much more useful procedure for interpreting a dataset, rather than overemphasizing hypothesis-assessment tests and the use of P-values to differentiate significant from non-significant results (Nakagawa and Cuthill, 2007). In fact, according to Gardner and Altman (1986), in medical research, authors are often interested in the magnitude of the difference of an outcome measured in two different groups or in data taken before and after an intervention, not in a simple indication of whether or not that difference is statistically significant. Thus, the true score confidence intervals present a range of values, based on the sample result and typical error, in which the population difference can be found, and the effect size represents the magnitude of a significant difference. The calculation of the TEM and the true score confidence intervals allow us to verify if the changes detected in repeated measurements are a result of a given exercise/nutrition intervention or a result of the method’s relative variation/anthropometrist’s error (Mony et al., 2016; Perini et al., 2005). We recommend that anthropometrists express in their routine reports if the intervention has been successful or not based on whether confidence intervals for change lie to the desired side of the zero line (smallest worthwhile change) (Swinton et al., 2018). As a more objective determination of the smallest worthwhile change to evaluate clinical significance, we also recommend the calculation of the effect size (e.g. unbiased Cohen’s d). This must be applied specifically to the ∑S, as a valid proxy measurement of adiposity (Marfell-Jones, 2001). On the other hand, for reporting results of an investigation, it is advisable to give complete statistical information including statistics power, sample estimates, confidence intervals, test statistics P-values, and effect size (assuming that basic details such as sample size and standard errors have already been given in the text) (Gardner and Altman, 1986), whilst the public awareness of artificial intelligence’s practical benefits in kinanthropometry is raised (Bonilla et al., 2020). See a comprehensive step-by-step explanation of these statistical calculations, with anthropometric data examples, for a personalized approach to evaluating progress and effectiveness of exercise and sports nutrition interventions in Swinton et al. (2018).
Conclusions
Recent, partially valid and simple anthropometry-based calculations to monitor changes in BC in amateur and elite athletes have been examined in this scoping review. We emphasize the importance of following international anthropometric standards (i.e. ISAK protocol) to reduce TEM, and improve reproducibility between the studies. Special attention should be paid when the aim is to evaluate the %BF since there are several sources of error in kinanthropometry and the use of a regression equation might not be accurate. To avoid this, anthropometrists should base their analysis on the absolute values of ∑S, which gives information concerning local fat distribution in the body and also provides an index to determine adiposity. Complementary, corrected girths are limb circumferences that are adjusted for skinfold thickness, with good reliability as indicators of musculoskeletal size. Furthermore, the LMI appears to be valid for monitoring moderate to large changes in the lean mass of athletes, but more research is needed to derive the specific coefficients for each sports population. In conclusion, the ∑S, skinfold-corrected girths, and LMI can be easily obtained/derived using calipers and the information provided might be quickly interpreted, represent normative data, and allow comparing between different groups. We invite anthropometrists to be familiar with basic statistical procedures (e.g. TEM, true score confidence intervals, smallest worthwhile change, and effect size) and to be very cautious of using the reference values reported in this review, in order to analyze and interpret correctly the exerciser/athlete’s changes in BC. Proper identification of changes before both delivering the anthropometric report and modifying the dietary/exercise intervention is part of the comprehensive work of a qualified professional.
Footnotes
Acknowledgements
The authors would like to thank all DBSS International fellows (with special mention to Professor Alexandra Pérez-Idárraga for her comments on this manuscript), invited speakers, and attendees at the Ibero-American Symposium in Sports and Physical Activity: Nutrition and Training SIDANE where this topic was fully covered. Moreover, we would like to thank the practicum student of Universidad Santo Tomás (Brayan Pulido) who collaborated as research assistant at DBSS International with the first version of the drafted manuscript.
Author contributions
Conceptualization, DAB; Methodology, DAB; Search and data extraction: DAB; Writing—original draft preparation, DAB; writing—review and editing, JLP, SV, CAH-A, PA-C, AO, GD-L; project administration, DAB.
Consent for publication
All authors have read and consent for publication of this manuscript.
Ethical approval
Ethical approval was not required for this research because it did not involve human participants.
Declaration of conflicting interests
The authors declared no potential conflicts of interest with respect to the research, authorship, and/or publication of this article.
Funding
The authors received no financial support for the research, authorship, and/or publication of this article.