
Abstract
Introduction
Literature reviews have revealed that many obesity risk factors increased during the COVID-19 pandemic, including physical inactivity, poor diet, stress, and poverty (Anderson et al., 2023; Shimpo et al., 2022; Zeigler, 2021). However, the situation may vary by country, population density, age group, occupation, etc. Various reports have described a weight gain or an increase in body mass index (BMI) associated with unhealthy dietary habits during the COVID-19 pandemic, including the lockdown period (Alamri, 2021; Bennett et al., 2021; Cheikh Ismail et al., 2021; Muth et al., 2022). Conversely, weight loss was also reported in older adults living alone in an area not locked down (Kubo et al., 2022).
Although investigating lifestyle habits before and during the COVID-19 pandemic is essential for precise comparison (Meule, 2023), few studies have compared the lifestyle habits surveyed before and during the COVID-19 pandemic with examination findings, including blood test results (Fuhrmann et al., 2023; Kikuchi et al., 2022).
Relationships between dietary habits and smell dysfunction have been studied (Aschenbrenner et al., 2008; Schubert et al., 2012). The olfactory dysfunction was associated with an elevation of BMI (Nettore et al., 2020). Chemosensory impairment is closely associated with food choices but does not diminish eating pleasure and appetite (Arganini and Sinesio, 2015). On the contrary, persistent olfactory and gustatory dysfunctions associated with long-Covid are related to reduced quality of life (Jaramillo et al., 2023; Vaira et al., 2022)—the chemosensory dysfunctions associated with long-COVID must be studied further.
We have been attending a health checkup in rural Yakumo, Japan (Katayama et al., 2023; Nakashima et al., 2021). After the 2019 health checkup, the 2020 and 2021 health checkups were canceled because of the COVID-19 pandemic. However, a 2022 health checkup was performed. The health checkup included an olfactory evaluation with dietary habits, alcohol drinking habits, exercise, or sports habits investigation. We report the results here with blood test results.
Materials and methods
Five hundred and ten and 396 participants attended the health checkup in 2019 and 2022, respectively, in Yakumo town, Japan. Yakumo town announced the health checkup for old inhabitants, and the participants attended voluntarily. Yakumo is in a rural area of Hokkaido's southern part, the second largest island located north of mainland Honshu in Japan. The population of Yakumo town was 16,685 in 2019 and 15,050 in 2022. Yakumo town thrives in terms of dairy, agriculture, and fishery. The area of the town is 956 km2. The Yakumo health checkups with detailed questionnaires and research-purposed examinations have been performed yearly since 1982, except in 2020 and 2021, when the health checkups were canceled due to the COVID-19 pandemic. Eighty-four percent of the participants in 2022 reported attending the Yakumo health checkup before the COVID-19 pandemic, including in 2019. This study included smell function and lifestyle habits before and during the COVID-19 pandemic. The detailed questionnaire was sent to the participants before the health checkup, and they were asked to fully respond to the questions through interviews on an attending day.
Smell function
The participants were asked to select one of four grades on general subjective smell sensation: Grade 3 for “sense smells well,” Grade 2 for “sometimes hard to smell,” Grade 1 for “slightly,” and Grade 0 for “not at all.” As an objective olfactory test, we used the odor stick identification test for Japanese, which consists of 12 odors easily recognizable to Japanese adults: India ink, wood, perfume, menthol, Japanese orange (mikan), curry, household gas, rose, Japanese cypress, sweaty socks, condensed milk, and roasted garlic (Kobayashi et al., 2006). The participants were requested to choose one from six answers: one correct item, three incorrect items, “unknown smell,” and “no smell,” as described previously (Katayama et al., 2023). In this study, we classified the smell test results into three levels: Level 2 (correct answer six or more), Level 1 (correct answers 3, 4, or 5), and Level 0 (correct answer two or less).
Dietary habits
Frequency of dietary intake was investigated for each of the following foods or drinks: (1) carrots, (2) broccoli, (3) green leafy vegetables, including spinach, komatsuna, and spring chrysanthemum, (4) other green and yellow vegetables, including green pepper, and snap beans with yellow pods, (5) cabbage, (6) radishes, (7) other light-colored vegetables including cucumbers, onions, sprouts, Chinese cabbage, and lettuce, (8) orange (including mandarin orange) and grapefruits, (9) other fruits including strawberry, kiwi, apple, and watermelon, (10) potatoes, including sweet potatoes, (11) pumpkin, (12) mushrooms, (13) tofu, (14) eggs, (15) chicken, (16) beef and pork, (17) ham, sausage, and bacon, (18) fish (raw, baked, or boiled fish), (19) squid, shrimp, crab, and octopus, (20) shellfish, (21) seaweed, (22) deep fried food, (23) stir-fried food, (24) milk, (25) yoghurt, (26) miso soup, (27) coffee, (28) green tea, (29) western sweets (cake, cream puff, candy, etc.), (30) Japanese sweets (Manju, confectionery, etc.).
The participants selected any one answer from the following eight frequencies describing each food or drink's intake as described previously (Nakashima et al., 2021).
hardly eat or drink 1–3 times a month once or twice a week three or four times a week five or six times a week once a day twice a day three or more times a day
Alcohol drinking habits
The frequency and amount of alcoholic beverages were asked about six beverages: beer, whiskey, wine, Japanese rice wine (Japanese Sake), shochu, and chuhai. Japanese Sake made from rice is brewed alcohol, while shochu made from rice, barley, or sweet potatoes is a traditional Japanese distilled spirit. Chuhai is a cocktail of shochu with fruit or soda.
The participants selected any one answer from the following six frequencies at each of the six kinds of alcohol:
hardly drink 1–3 days a month one or two days a week 3–4 days a week 5–6 days a week everyday
In this list, we regarded the frequency of alcohol intake as zero, two days per 30 days, 1.5 days a week, 3.5 days a week, 5.5 days a week, and every day.
Each alcoholic beverage was asked as the amount per drinking day. The amount of alcohol (g) was obtained from the table https://www.kirin.co.jp/csv/arp/proper/check_list.html as beer 500 ml is 20 g, whiskey single (30 ml) is 9.6 g, whiskey double is 19.2 g, a glass of wine (120 ml) is 11.5 g, Japanese Sake 1 Gou (180 ml) is 21.6 g, a glass of shochu (180 ml) is 36 g, chuhai 350 ml is 14 g.
Exercise or sports habits
We asked about exercise or sports habits, divided into four grades: rare, 1–2 h/week, 3–4 h/week, and five hours or more/week. In the questionnaire, the participants selected one of the four grades in the past week. We did not ask about the intensity of the exercise or sports.
Statistical analysis
Fisher's exact test, Mann–Whitney test, logistic regression model analysis, and generalized linear model analysis were performed. The calculations were conducted using STATA 15 and SPSS 26.0, and statistical significance was set at a p-value of <.05.
Results
Participants
Table 1 shows the age distribution of the male and female participants in 2019 and 2022. Male and female participants were 215 and 295 in 2019 and 174 and 222 in 2022, respectively. The median age of males was 68 in 2019 and 69 in 2022, and that of females was 65 in 2019 and 2022. Mann–Whitney test revealed a significant difference in age between females and males in 2019 and 2022 (p < .01).
Number of participants.
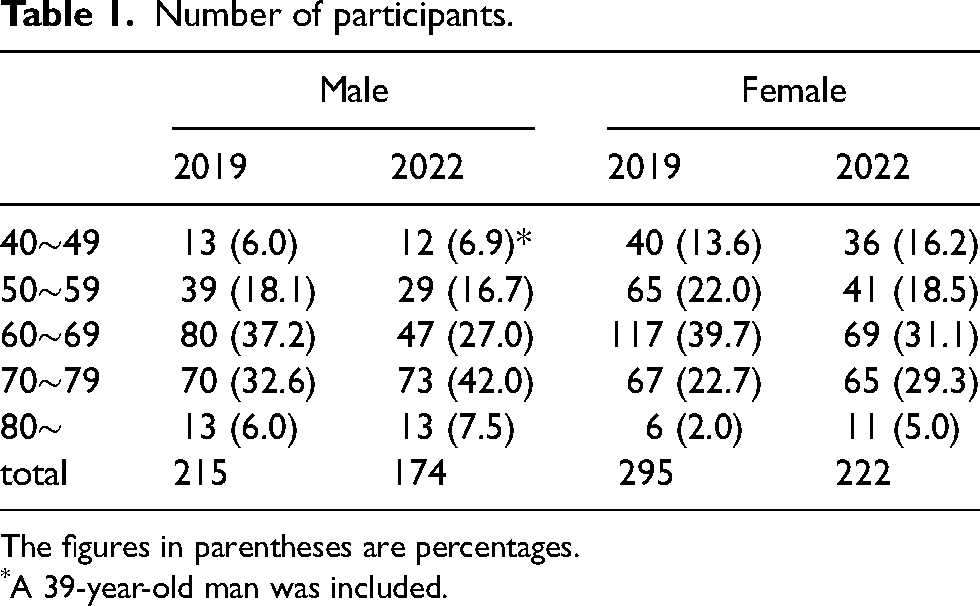
The figures in parentheses are percentages.
A 39-year-old man was included.
The proportion of persons aged 70 or more was significantly higher in 2022 than in 2019, both in males and females (chi-square test, p < .05). However, the Mann–Whitney test did not reveal a significant age distribution between 2019 and 2022 in males and females.
Eating and drinking habits
Among seven vegetables from (1) to (7), males took fewer all kinds of vegetables in 2022 than in 2019. Among (18)∼(21) marine products and (24) to (25) dairy products, the intake frequency was less in 2022 than in 2019, both males and females, except for shellfish in men.
We performed a multivariate analysis to investigate the effects of age, sex, and checkup year (2019 and 2022) on intake frequency. In the ordinal logistic regression model, the objective variable was eight grades intake frequency, and the explanatory variables were age, sex, and the checkup year. Table 2 demonstrates three kinds of food for which the intake frequency decreased significantly in 2022 than in 2019 after adjusting age and sex.
Effect of age, sex, and study year on food intake frequency: Three food items with a significant effect on study year.
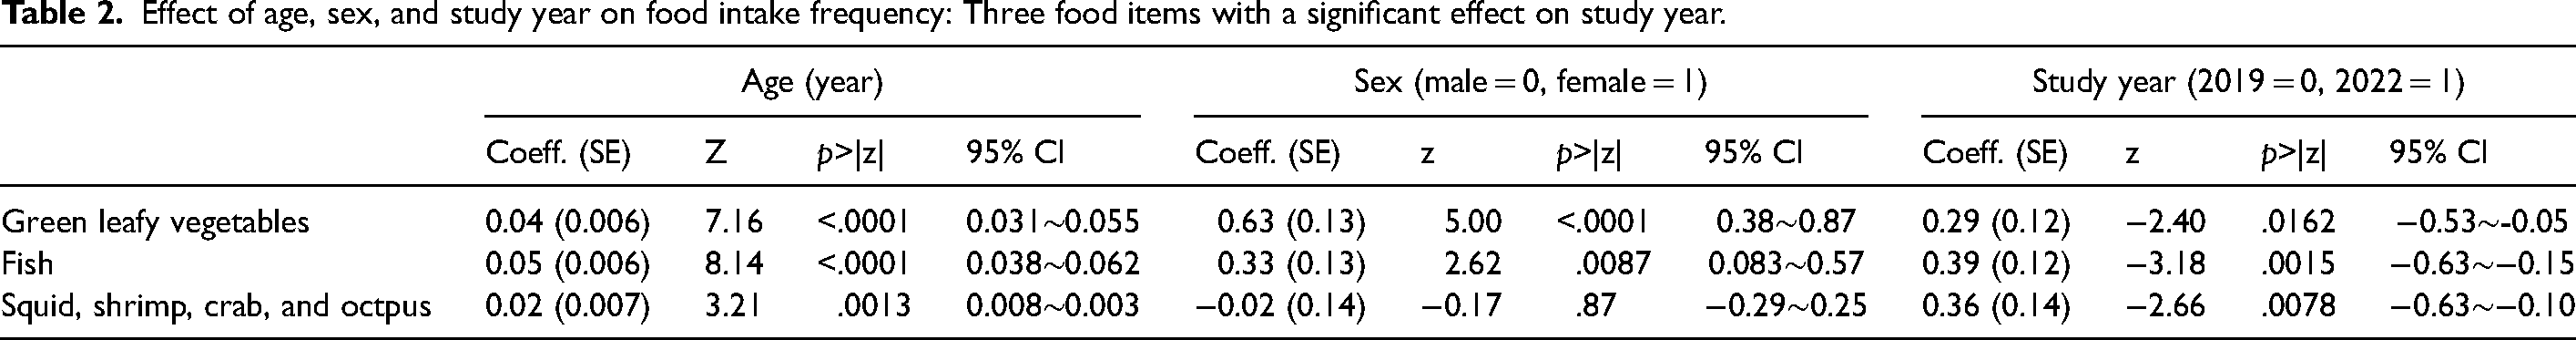
Table 2 also reveals that older age significantly positively affected the intake frequency of the three kinds of food, and females took green leafy vegetables and fish more frequently than males. In 30 kinds of foods and drinks, after adjusting sex and the checkup year, aged persons took 23 kinds more frequently ((1)–(7) vegetables, (8)–(9) fruits, (10) potatoes, (11) pumpkin, (12) mushrooms, (13) tofu, (14) eggs, (18)∼(21) marine products, (24)–(25) dairy products, (26) miso soup, (28) green tea, (30) Japanese sweets). The aged persons took less four kinds: (15) chicken, (16) beef and pork, (17) ham, sausage and bacon, deep-fried foods, (27) coffee. The multivariate analysis also showed that females took 23 kinds more frequently than males, except for seven kinds ((15) chicken, (17) ham, sausage, bacon, (19) squid, shrimp, crab, and octopus, (20) shellfish, (22) deep-fried foods, (26) miso soup, (29) western sweets) that had no significant difference between females and males. Females took all kinds of vegetables and dairy products more frequently. On the opposite point of view, males took these foods less frequently, including vegetables, fruits, and dairy products, after adjusting age and checkup year.
Mann–Whitney test revealed that the intake frequency was less in males than in females both in 2019 and 2022 in 17 kinds: (1)∼(7) vegetables, (9) other fruits, (11) pumpkin, (12) mushrooms, (13) tofu, (16) beef and pork, (21) seaweed, (23) stir-fried foods, (25) yoghurt, (28) green tea, and (30) Japanese sweets. The significant difference that males take less than females appeared in 2022 also in (10) potatoes and (15) chicken. The intake frequency of (18) fish was less in 2022 than in 2019 in females (p = .004).
The relationship between subjective smell function and smell test result
Table 3 reveals the relationship between the subjective smell function and smell test results. Significant correlations existed between the subjective smell function and the smell test results in males in 2019 (Fisher's exact test, p < .001) and 2022 (p = .002) and females in 2022 (p = .007). The p-value of the correlation in females in 2019 was .084. Ordinal logistic regression analysis was performed: the objective variable was the three-level smell test result, and explanatory variables were age, sex, subjective four-grade smell evaluation, and the study year. In this regression model, old age (p < .001), male sex (p < .001), subjective smell dysfunction (p < .001), and the study year 2022 (p = .009) were related to low smell test scores significantly.
Relationship between subjective smell function and smell test results in 2019 and 2022.
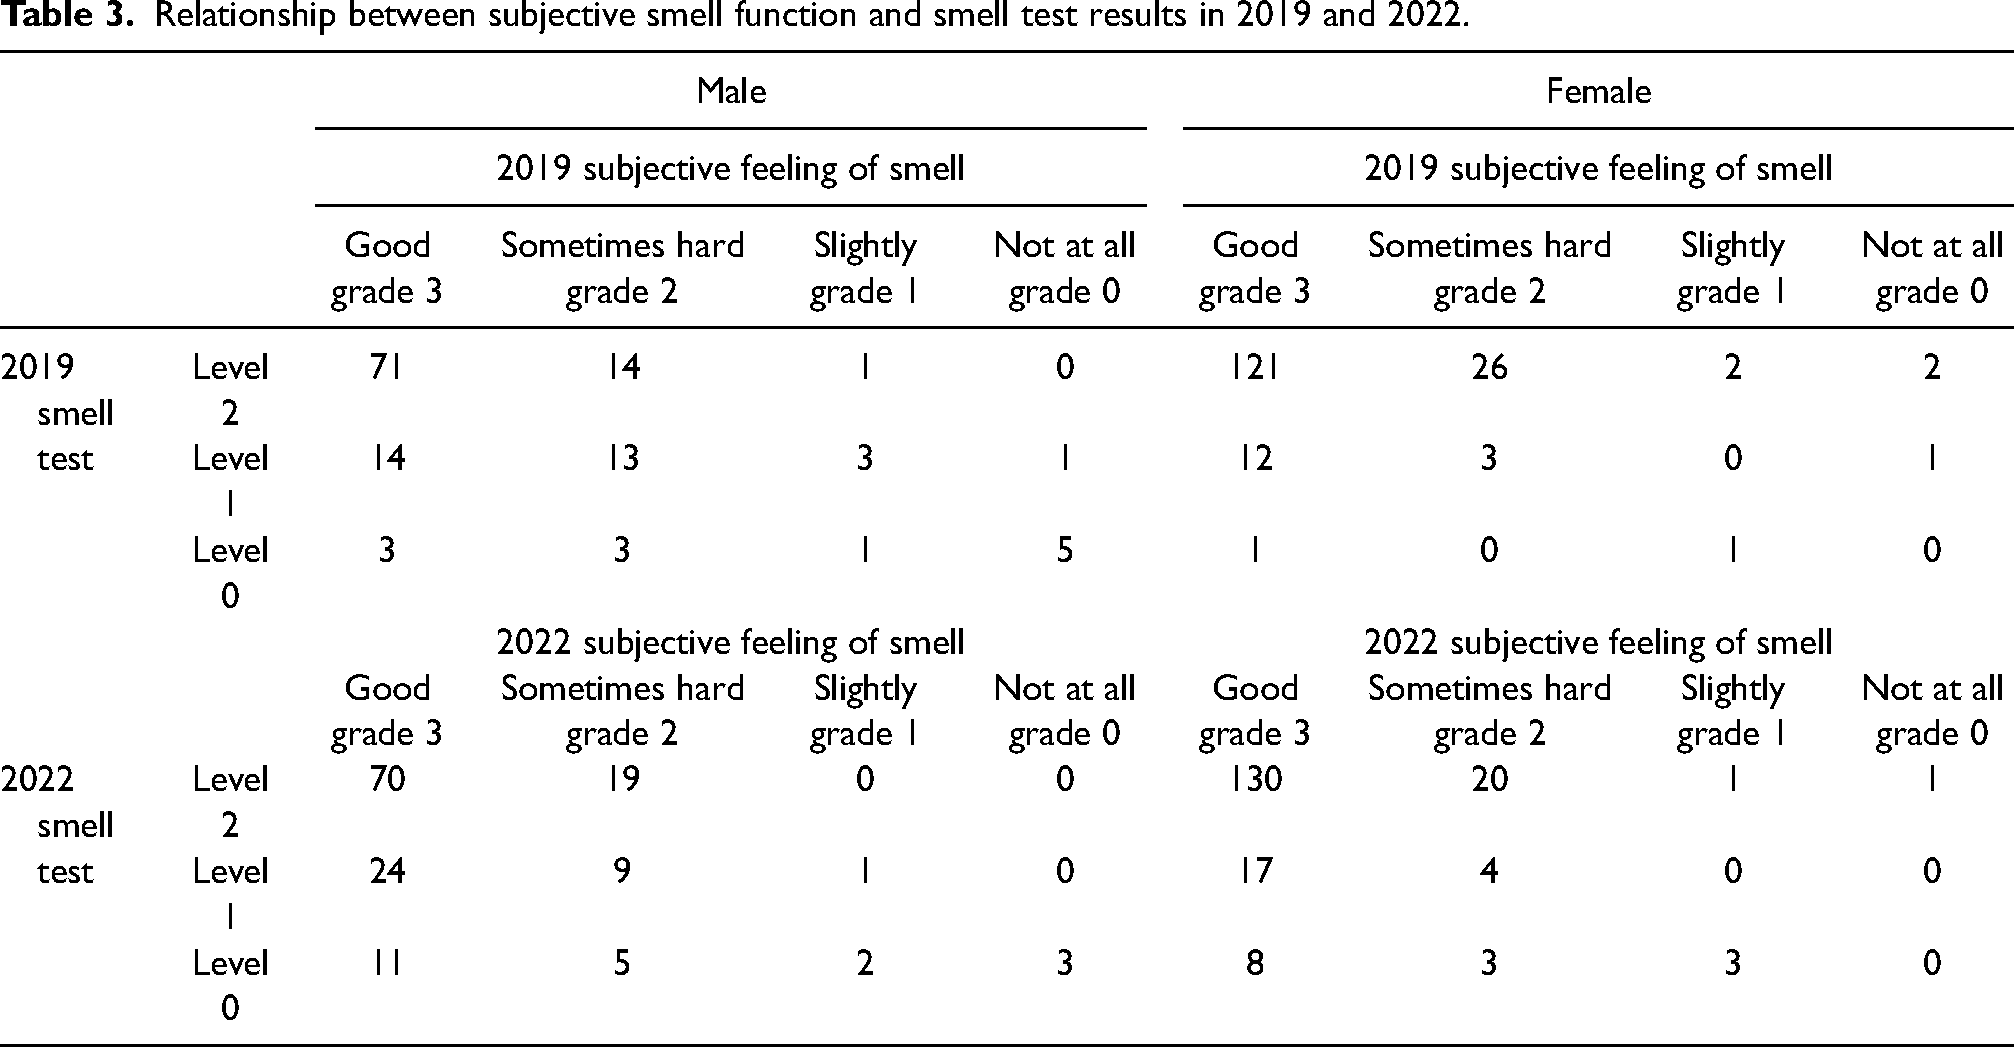
Level 2: correct answer six or more; Level 1: correct answer 3, 4, or 5; and level 0: answer two or less.
Sixteen participants described having had a COVID-19 infection. The average interval between the infection and the health checkup in 2022 was 4.75 months. A logistic regression analysis did not reveal a significant influence of the COVID-19 infection on subjective smell feeling and smell test results after adjusting age and sex.
Effect of smell function on intake frequency of foods and drinks
We performed ordinal logistic regression analysis: the objective variable was the intake frequency of each of the 30 kinds of foods and drinks, and the explanatory variables were age, sex, and the smell test levels (2, 1, and 0), or subjective smell grades (3, 2, 1, and 0). Better smell test levels increased (2) broccoli intake (p = .040) in 2019, (7) other light-colored vegetable intake (p = .004) in 2022, and (18) fish intake (p = .003) in 2022. Better subjective smell grades increased (3) green leafy vegetables (p = .034) in 2019, (4) other green and yellow vegetable intake (p = .037) in 2022, (6) radishes intake (p = .018) in 2022, (7) other light-colored vegetables (p = .018) in 2019, and decreased (17) ham, sausage, and bacon (p = .024) in 2019. Thus, a decrease in subjective smell feeling and smell test results was associated with decreased intake frequency of the vegetables, adjusting age and sex.
Alcohol consumption
Figure 1 demonstrates the alcohol consumption amount (gram/week) in each chuhai, whiskey, shochu, beer, wine, and Japanese Sake, and the total alcohol in alcohol drinkers in 2019 and 2022. The gram of alcohol per week was calculated according to the method described in the methods section. The Mann–Whitney test revealed that alcohol consumption amount increased significantly in 2022 than in 2019 in men who drank beer (p = .007) and chuhai (p = .040).
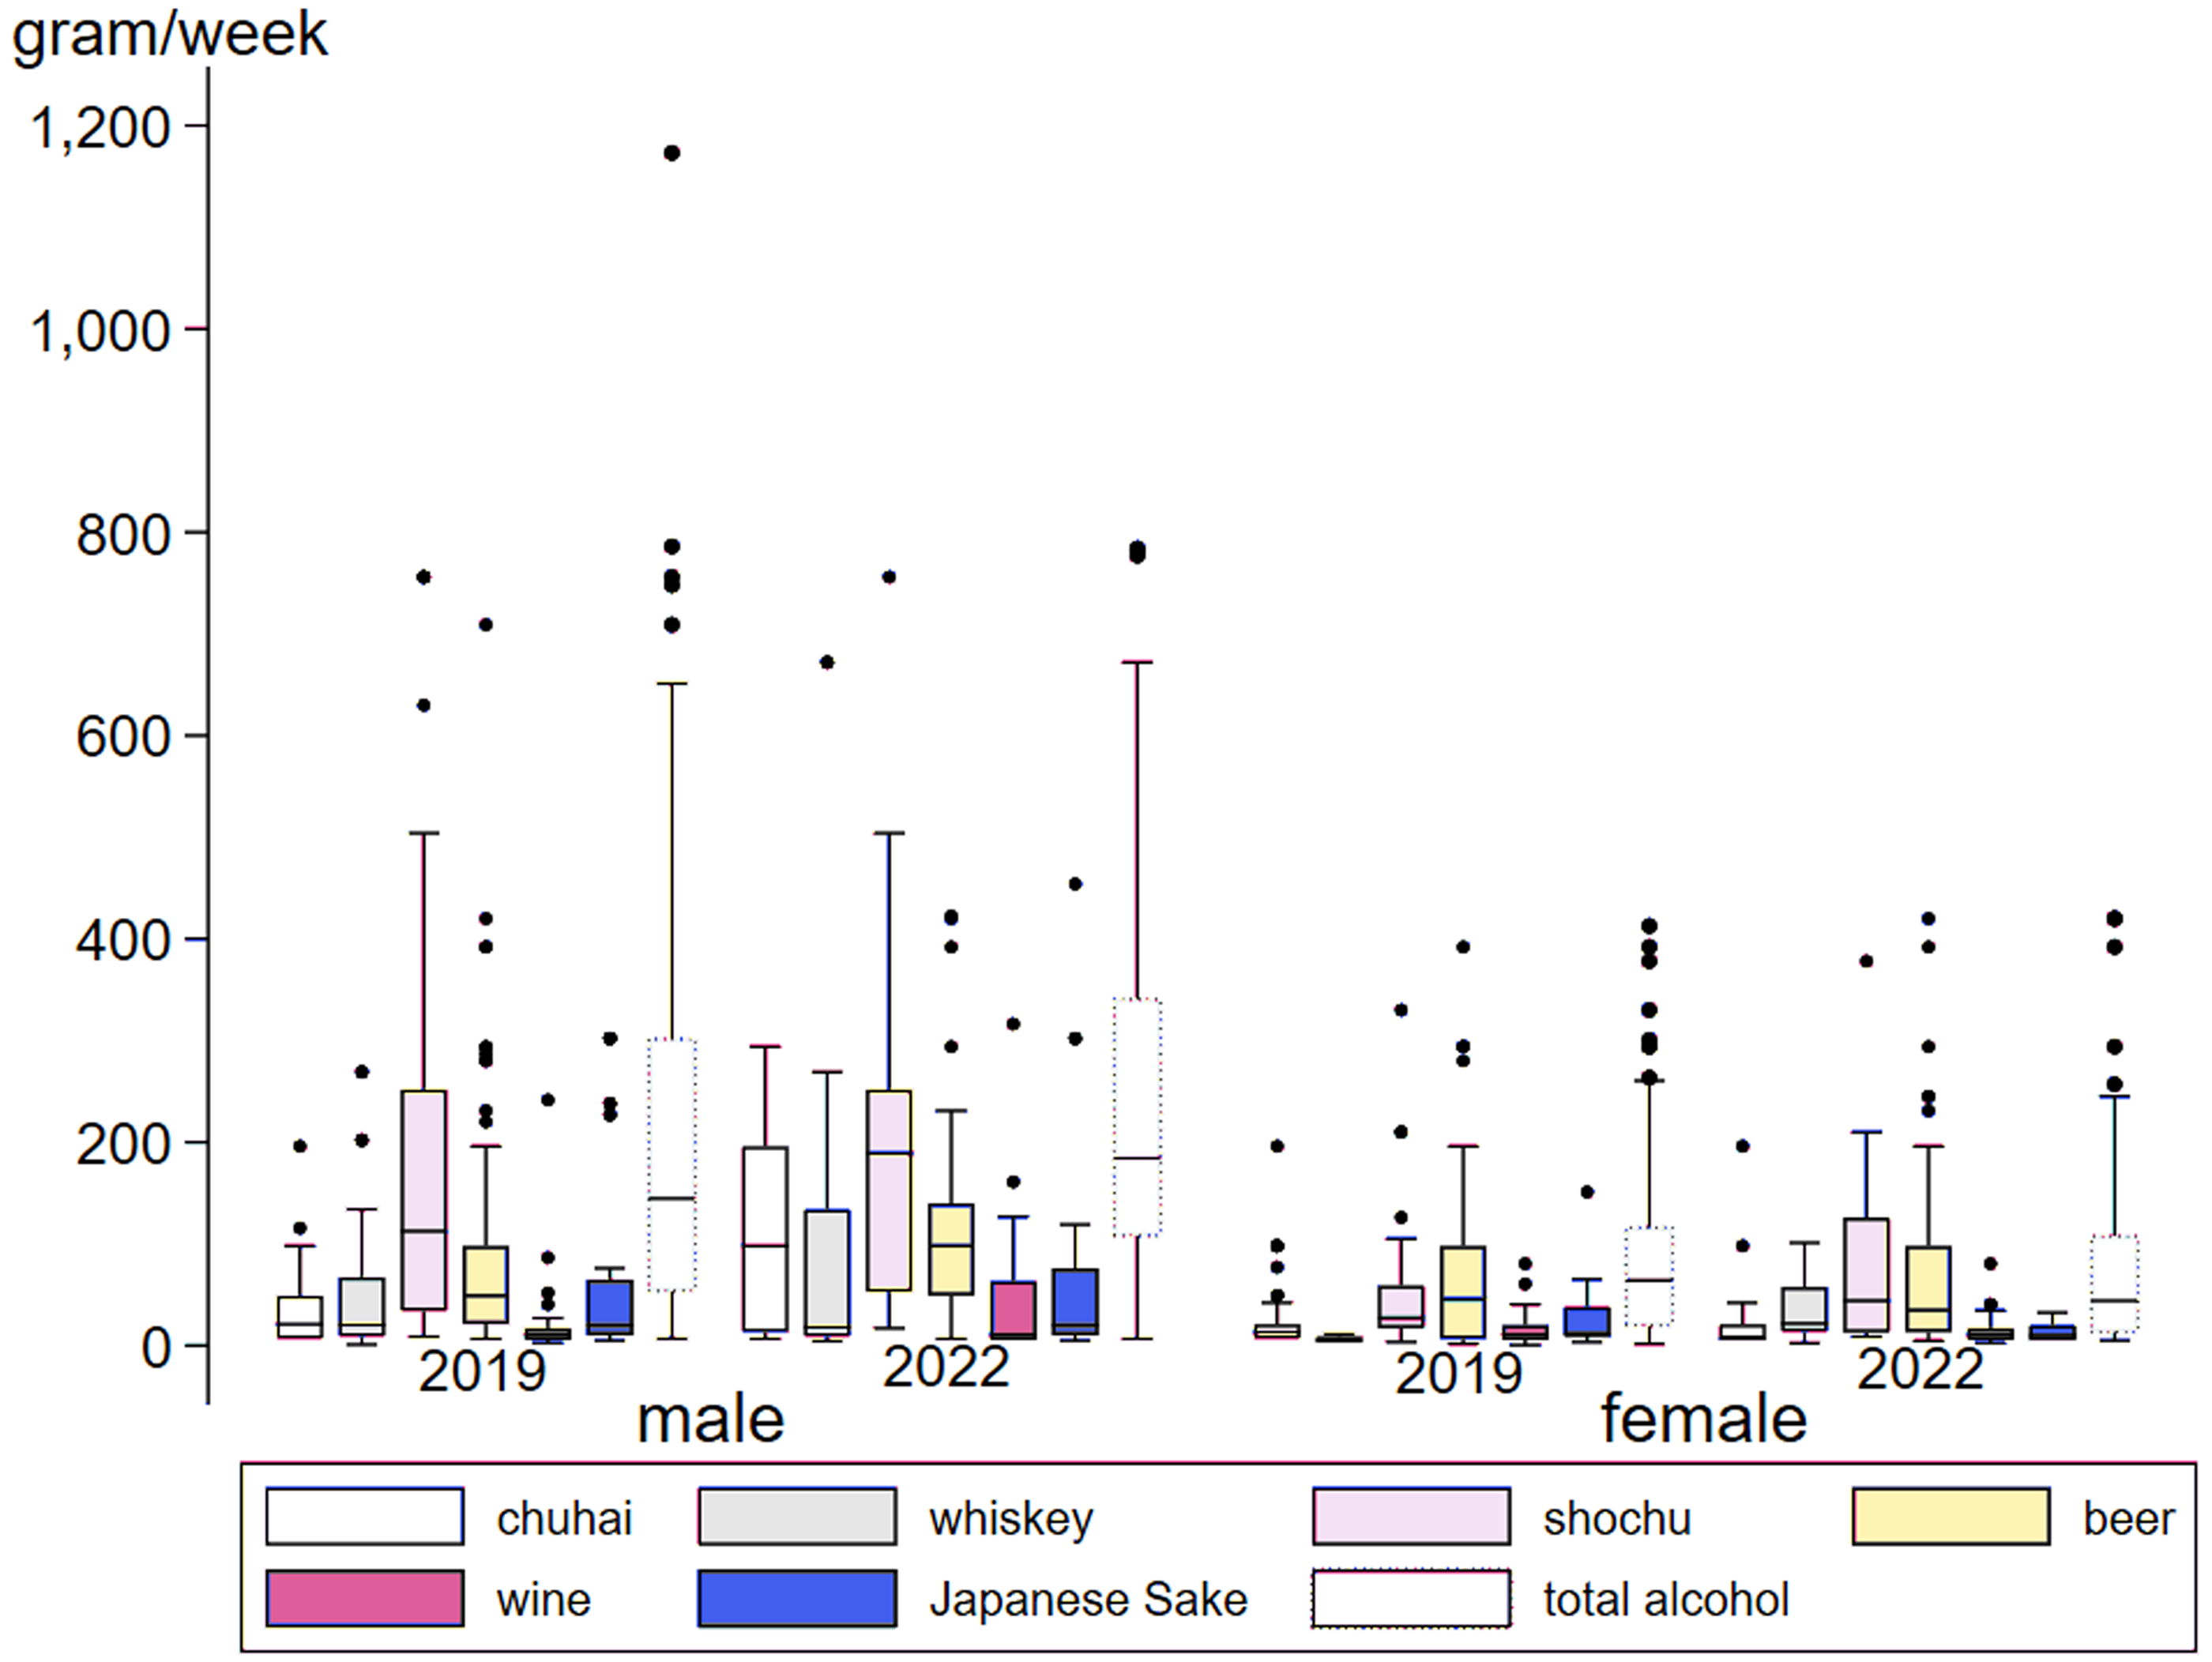
Alcohol consumption amount in 2019 and 2022.
Quartile graphs of alcohol consumption amount (gram/week) in chuhai, whiskey, shochu, beer, wine, Japanese Sake, and the total alcohol. From left to right in this boxplot, the number of drinkers of chuhai, whiskey, shochu, beer, wine, and Japanese Sake, and the total was 25, 30, 67, 112, 26, 42, and 140, in 2019 in males, 23, 19, 45, 75, 19, 34, and 101 in 2022 in males, 40, 6, 25, 80, 33, 11, and 107 in 2019 in females, 31, 6, 12, 50, 21, 7, and 73 in 2022 in females.
Exercise habits
Table 4 shows exercise or sports habits in 2019 and 2022. The chi-square test revealed no significant difference between 2019 and 2022 in males and females. The chi-square test revealed that men had more sports or exercise habits than women in 2019 (p = .004) and 2022 (p = .047).
Hours for exercise or sports per week (number of persons).
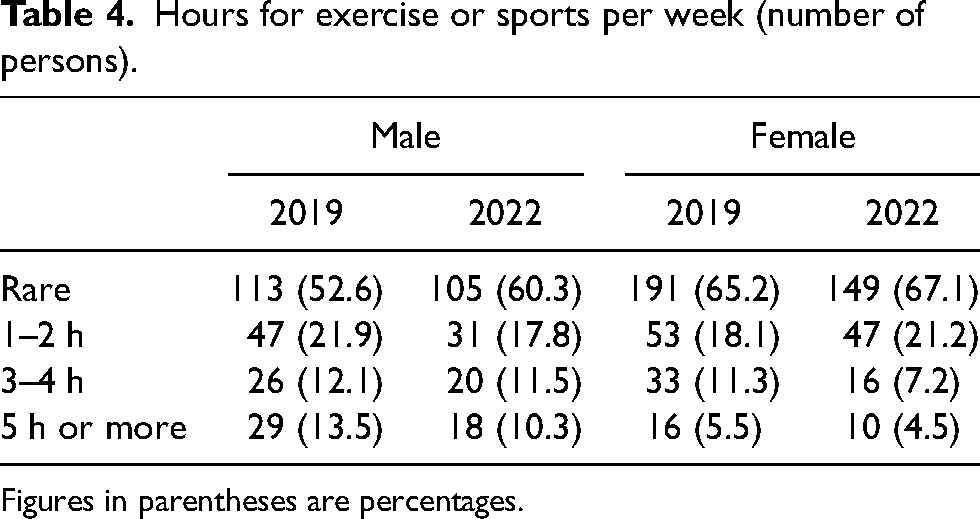
Figures in parentheses are percentages.
We performed a logistic regression analysis by dividing it into two groups: “rare” as having no exercise habits, and the other three as having exercise habits. The presence or absence of exercise habits was not significantly different between 2019 and 2022 in males and females. In a logistic regression analysis in which the presence or absence of exercise habits was an objective variable, the intake frequency of fifteen foods was associated positively with exercise habits, adjusting age, sex, and study year.
(1) carrots (p = .018), (2) broccoli (p = .001), (3) green leafy vegetables (p < .001), (4) other green and yellow vegetables (p = .008), (5) cabbage (p = .002), (6) radishes (p = .019), (7) other light-colored vegetables (p = .011), (9) other fruits (p < .001), (13) tofu (p = .007), (14) eggs (p = .002), (15) chicken (p = .006), (21) seaweed (p = .014), (23) stir-fried food (p = .013), (24) milk (p < .001), (250 yoghurt (p < .001).
Sleep situation
The number of persons with irregular sleep was 45 (21.0%) in 2019 and 43 (24.4%) in 2022 in males, 76 (25.9%) in 2019 and 45 (20.3%) in 2022 in females. The chi-square test indicated no significant change in the proportion of irregular sleep between 2019 and 2022 in males and females. The average sleep hours in persons with regular sleep was 6.94 in 2019, 6.80 in 2022 in males, 6.65 in 2019, and 6.54 in 2022 in females. Although hours of sleep were minor in 2022 compared to 2019, in males and females with regular sleep, the difference was insignificant when the Mann–Whitney test was performed. The Mann–Whitney test revealed that hours of sleep were significantly shorter in females than in males both in 2019 (p < .001) and 2022 (p = .025).
Blood examination results in 2019 and 2022
Table 5 reveals examination results in 2019 and 2022 in males and females. Table 5 reveals that hematocrit and albumin decreased, and serum calcium increased in 2022 from those in 2019, both in males and females. When a generalized linear model analysis was performed as an objective variable is each item in Table 5 and explanatory variables are age, sex (male = 0, female = 1) and survey year (2019 = 0, 2022 = 1), MCHC (p < .0001), platelet (p < .0001), and serum calcium increased significantly by the survey year 2022; albumin (p < .0001), hematocrit (p < .0001), MCV (p = .0003), WBC (p = .0005), total cholesterol (p = .0175), LDL cholesterol (p = .0153), HDL cholesterol (p = .021), and uric acid (p = .0419) decreased significantly by the survey year 2022. Thus, these examination results changed significantly by the survey year after adjusting age and sex.
Median (25th percentile–75th percentile) of examination results in 2019 and 2022.
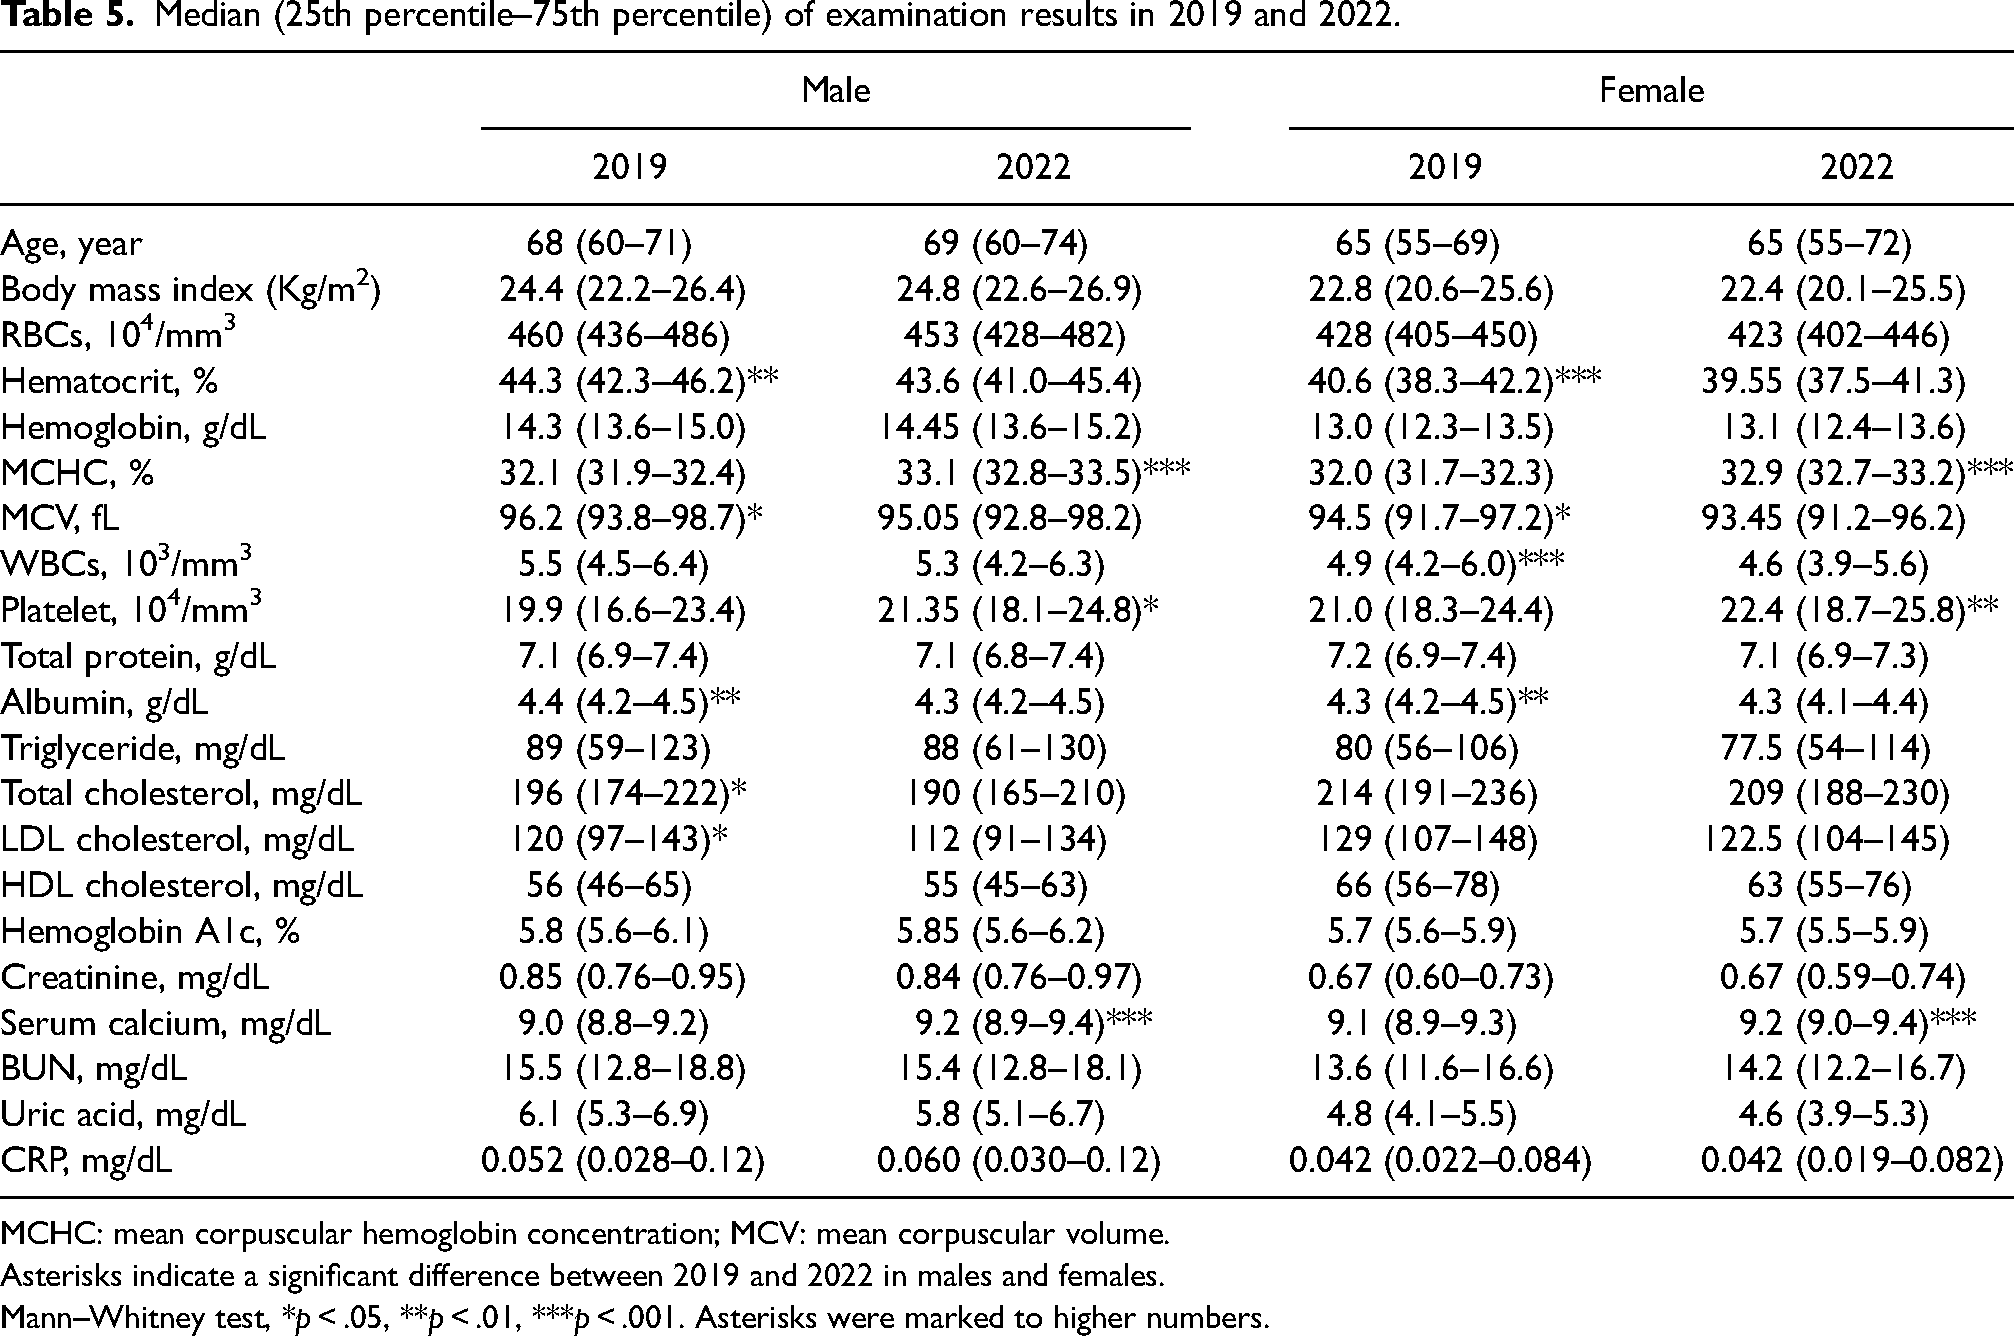
MCHC: mean corpuscular hemoglobin concentration; MCV: mean corpuscular volume.
Asterisks indicate a significant difference between 2019 and 2022 in males and females.
Mann–Whitney test, *p < .05, **p < .01, ***p < .001. Asterisks were marked to higher numbers.
Effect of eating, drinking, and exercise habits on BMI and blood test results
When the BMI was divided into four grades: underweight (less than 18.5), normal (18.5 ∼ less than 25), overweight (25 ∼ less than 30) and obesity (30 or more), the percentages of underweight, normal, overweight and obesity in males were 2.33%, 53.35%, 38.60%, and 3.72% in 2019, 1.72%, 48.85%, 41.95%, and 7.47% in 2022, respectively. In females, the percentages were 9.49%, 59.66%, 25.42%, and 5.42% in 2019, 11.71%, 60.36%, 22.52%, and 5.41% in 2022, respectively.
We evaluated dietary habits and alcohol consumption on BMI and blood test results, adjusting age and sex in 2019 and 2022 using a generalized linear model. When the objective variable was BMI, the intake frequency of carrots, broccoli, and pumpkins decreased BMI significantly in 2019 and 2022. Intake of green vegetables, other green vegetables, radishes, tofu, seaweeds, and miso soup decreased BMI significantly in 2022. Other fruits decreased BMI significantly in 2019. The alcohol consumption amounts did not significantly influence BMI.
When the objective variable was HbA1c, the intake frequency of green vegetables, pumpkin, and milk decreased HbA1c significantly in 2022, and the carrots intake decreased HbA1c significantly in 2019. On the contrary, deep-fried food intake frequency elevated HbA1c significantly in 2022. Among six kinds of alcoholic beverages, only chuhai consumption amount elevated HbA1c significantly in 2019 (p = .015) after adjusting age and sex. In 2022, the effect of chuhai consumption on HbA1c was not evident. However, the chuhai consumption amount elevated HbA1c significantly (p = .021) when the explanatory variables were age, sex, chuhai consumption amount, and study year.
The generalized linear model analysis showed that the intake frequency of all vegetables decreased uric acid after adjusting age, sex, and the study year. When BMI was added as one of the explanatory variables, the effect of vegetable intake decreased or disappeared. Accordingly, BMI influenced the uric acid level more than the vegetable intake frequency. On the contrary, a significant effect of beer and total alcohol consumption on uric acid elevation remains even after adding BMI to the explanatory variables.
We could not find a significant effect of exercise or sports habits on BMI, HbA1c, uric acid, LDL, and HDL cholesterols after adjusting age and sex in 2019 and 2022. However, exercise or sports habits were associated significantly with dietary habits.
Discussion
This study revealed that various blood examination results were significantly different between 2019 and 2022 after adjusting age and sex. Changes in lifestyle habits may be associated with examination results. Both lifestyle habits and examination results are critical to investigating the influence of COVID-19 on the area's inhabitants.
Numerous studies have indicated that diet can play an essential role during COVID-19. In this study, a multiple regression analysis revealed that old age (p < .001), male sex (p < .001), subjective smell dysfunction (p < .001), and the study year 2022 (p = .009) significantly decreased the smell test score. Smell dysfunction associated with old age and male sex have been reported worldwide (Dong et al., 2017; Jalali et al., 2020; Suzuki et al., 2022). For the reason of the aggravating factor of the study year 2022, we considered the possibility of COVID-19 infection. However, when we added the presence of the medical history of the COVID-19 infection to the explanatory variables, we found no significant effect of the COVID-19 infection on the smell test score. The number of participants who had COVID-19 infection was only 16. Moreover, they received 2022 health checkups after an average of 4.75 months from the COVID-19 infection. In Japan, COVID-19 infection appeared first in big cities, and the infection rate was still lower in rural areas than in big cities in the summer of 2022 (Akaba et al., 2022; Arimura et al., 2020; He and Traphagan, 2021).
Our study revealed that the intake frequency of vegetables and seafood decreased significantly in 2022 than in 2019, adjusting for age and sex. The decrease in intake frequency was not associated with the production amount in Yakumo because, according to the annual reports by Yakumo town, agricultural production, and fishery landings did not decrease in 2022 than in 2019. The unfavorable direction of dietary habits may be associated with the loneliness of persons living during the COVID-19 pandemic (Hanesaka and Hirano, 2022; Lal et al., 2022). Alcohol consumption amount also increased in males in 2022 than in 2019. For an investigation of the relationship between alcohol drinking and food choice, we added Western sweets and Japanese sweets to 28 kinds of foods and drinks reported previously (Nakashima et al., 2021). Consequently, the intake frequency of dairy products, fruits, and western sweets was less in alcohol drinkers in this study. Several papers have reported an inverse relationship between alcohol consumption and the intake frequency of fruits and vegetables (Kesse et al., 2001; Shimotsu et al., 2012; Tachi et al., 2020). Smell function may be related to intake of some kinds of alcohol with a strong scent. Because the number of persons who drank each alcohol was not sufficient in this study, more people are expected to investigate the relationship between smell function and various kinds of alcohol consumption.
Our study revealed that alcohol consumption on HbA1c may depend on the kind of alcoholic beverage. Chuhai consumption was associated with elevated HbA1c, although the other alcoholic beverages were not associated with HbA1c. In northern California, alcohol consumption was linearly and inversely associated with HbA1c among 38,564 diabetes patients in multivariate-adjusted models (Ahmed et al., 2008). In Korea, higher alcohol intake was associated with lower HbA1c levels, even after adjusting for confounding factors, in 24,594 ordinary persons (Hong et al., 2016). In Japan, HbA1c was significantly lower in light and heavy alcohol drinkers than nondrinkers in 19,398 men (Wakabayashi, 2010). Thus, there is a tendency for HbA1c to become low in heavy alcohol drinkers. In our study, there were few heavy alcohol drinkers, as shown in Figure 1. Alcohol consumption was associated with glucose levels in a time-dependent biphasic pattern (Ishihara et al., 2023). The pattern should be investigated regarding the contents of meals and the kinds of alcohol. Taste preference may be associated with the selection of alcoholic beverages. It is well known that there are sweet and dry wines and Japanese Sake. Shochu also has dry and relatively sweet ones, but chuhai is generally a sweet alcoholic beverage. Taste preference may be involved in the selection of alcoholic beverages and foods. It is probable that chuhai drinkers with elevated HbA1c like relatively sweet foods. However, nonsweet chuhai has been coming to the market recently. Further study is needed regarding the preference for a sweet or dry alcoholic beverage associated with eating habits.
We found a decreased tendency in LDL and HDL cholesterols and uric acid in 2022 than in 2019 after adjusting age, sex, and taking antilipidemic drugs. During the lockdown in Austria, LDL cholesterol improved significantly (p < .001) despite body weight gain (Fuhrmann et al., 2023). The authors estimated that LDL cholesterol decreased due to medical consultation, telemedicine, or at a doctor's office. Our study investigated voluntary participants to health checkups performed in a rural area in Japan; no significant body weight change was recognized. No clear worsening trend in examination findings was observed during the COVID-19 pandemic, although an unfavorable trend in dietary habits and alcohol consumption was noted.
Limitations of this study
Eighty-four percent of the participants in 2022 attended the Yakumo checkup conducted previously. However, we could not identify the same person between the 2019 and 2022 studies. The exercise or sports habits were divided into four categories based on frequency. However, we did not ask about the intensity of the exercise or sports. In the 2019 study, the questionnaire included whether or not to live alone (Nakashima et al., 2021), but it was not included in the 2022 study. We could not compare dietary habits and blood examination results in persons living alone between 2019 and 2022.
Conclusion
We performed health checkups before and during the COVID-19 pandemic in a rural area in Japan. The intake frequency of vegetables and seafood decreased significantly in 2022 than in 2019, adjusting age and sex. Chuhai and beer consumption increased significantly in 2022 compared to 2019 for male drinkers. Thus, dietary and alcohol drinking habits moved in an unfavorable direction, even in rural areas where COVID-19 infection was relatively low. Worse smell functions were associated with decreased intake frequency of some vegetables, adjusting age and sex. Various blood examination results differed significantly in 2022 compared to 2019, adjusting age and sex. Both lifestyle habits and examination results are critical to investigating the influence of COVID-19 on the area's inhabitants.
Footnotes
Acknowledgments
This study was supported by Yakumo town, Hokkaido, Japan. We are thankful to the participants who responded to the detailed questionnaire.
Authors’ contributions
NK, TY, TN, HS, and MS designed this study. NK, TY, and MK performed the field study. NK, TY, TN, and NH performed the statistical analysis and wrote the manuscript. All authors contributed to the article and approved the submitted version.
Consent for publication
The participants provided their written informed consent to publish the results of the health checkups on condition of anonymity.
Data availability
The data that support the findings of this study are available on request from the corresponding author, TN.
Declaration of conflicting interests
The authors declare that the research was conducted without any commercial or financial relationships that could be construed as a potential conflict of interest.
Ethical approval
The studies involving human participants were reviewed and approved by the Ethics Committee of Nagoya University School of Medicine (Approval No. 2014–0207).
Funding
This study was supported by the Japan Society for the Promotion of Science (JPS) KAKENHI Grand-in-Aid for Scientific Research JP20K02372 and JP20K11183.