
Abstract
Background
Although literature demonstrates controversial results regarding the association between selenium and glucose metabolism, no studies have specifically targeted a population with obesity even though this group is vulnerable to insulin resistance.
Aim
To evaluate the association between selenium biomarkers and insulin resistance in women with obesity.
Methods
This case–control study recruited 84 women with obesity and 129 with healthy weight (control). Selenium intake was assessed by 3-day food record. Selenium concentration in plasma, erythrocyte, and urine was assessed by inductively coupled plasma optical emission spectrometry. Serum glucose, insulin, and glycated hemoglobin (HbA1c) were assessed in a fasting blood sample. Homeostasis Model Assessment of Beta Cell Function (HOMA-β) and Homeostasis Model Assessment of Insulin Resistance were calculated according to standard methods.
Results
Women with obesity had higher dietary selenium intake in comparison to the control group (p < 0.001). Further, the plasma and erythrocyte concentrations were lower in individuals with obesity (p < 0.001), while selenium in urine was higher (p < 0.001) than in controls. No significant differences in insulin resistance markers were observed between groups. Selenium intake was positively associated with HOMA-β in both groups. In women with obesity, selenium intake was also positively associated with insulin and HbA1c, while in the controls the clearance of selenium was negatively associated with insulin and HbA1c. There was a positive correlation between dietary selenium intake, fasting insulin, HbA1c, and HOMA-β (p < 0.05).
Conclusions
Women with obesity present impaired selenium metabolism. Further, we observed an association between dietary selenium and markers of insulin resistance, which may reflect the possible negative action of selenium on insulin signaling.
Introduction
Obesity is characterized by excessive accumulation of body fat resulting from the imbalance between food intake and energy expenditure, which favors adipose tissue dysfunction (Fontenelle et al., 2021). Such dysfunction affects the synthesis and secretion of pro and anti-inflammatory adipocytokines, interfering in mechanisms involved in signaling pathways of insulin action (Ahmed et al., 2021). Insulin resistance is defined as the inefficiency of insulin in favoring glucose uptake by target tissue cells, as well as by elevated glucose production by liver, which induces the manifestation of a hyperglycemic and hyperinsulinemic picture, which can lead to the development of diabetes mellitus (Ahmed et al., 2021; Lee et al., 2022).
Nutritional aspects that are present in individuals with obesity that may contribute to the control of insulin signaling have been extensively studied in recent years, such as selenium. This is an essential mineral, incorporated into selenoproteins, through which it performs physiological functions with and impact on insulin action, such as its anti-inflammatory and antioxidant roles that occur in the presence of glutathione peroxidase (GPX), as well as in selenoprotein P (SELENOP) (Ouyang et al., 2022). This mineral has an insulin-mimetic action that favors glucose uptake in situations in the absence of insulin stimulation (Casanova and Monleon, 2023; Fontenelle et al., 2017; Ueno et al., 2018).
Results of studies show that selenium deficiency results in lower expression of insulin receptor, substrates 1 and 2 of the insulin receptor (IRS-1 and IRS-2), phosphatidylinositol 3-kinase (PI3K), protein kinase B (Akt), and glucose transporter 4 (GLUT-4) (Yang et al., 2017). Nonetheless, supplementation with this nutrient evidenced increased expression of IRS-1, PI3K, and GLUT-4 proteins in skeletal muscle tissue of diabetic rats and, consequently, increased sensitivity to insulin action (Xu et al., 2013). Thus, selenium deficiency in people with obesity may constitute an important contributing factor to glycemic uncontrol (Fontenelle et al., 2021; Oliveira et al., 2021; Steinbrenner et al., 2022).
However, selenium intake in high amounts may bring adverse health effects, leading to the inhibition of important events in the signaling cascade of insulin action. A study in humans demonstrated that supplementation with 200 µg of selenium yeast resulted in lower insulin receptor expression in healthy subjects (Jablonska et al., 2016). It was also shown in an animal model that ingestion of doses higher than recommended reduced the expression of genes encoding for the insulin receptor, IRS-2, Akt, and PI3K, compromising insulin action in specific tissues (Stahel et al., 2017).
Studies have demonstrated a controversial relationship between selenium and glucose metabolism, requiring research to clarify the role of this mineral in regulating glycemic control, especially in individuals with obesity, as they have a greater risk of developing insulin resistance. This study particularly focused on women as they present with higher prevalence of obesity (Cooper et al., 2021). Thus, this study aimed to evaluate selenium biomarkers and its relationship to insulin resistance in women with obesity. The study hypothesis is that individuals with obesity present changes in the selenium biomarkers assessed, which is associated with a greater risk of developing insulin resistance when compared to the control group.
Methods
Study participants
Women with obesity (case group) and healthy weight (control group) were recruited on an outpatient clinic in the city of Teresina-Piauí, Brazil. The participants were selected by interview according to the following eligibility criteria: women aged 20–50 years; body mass index (BMI) ≥ 35.0 kg/m2 (case group) and between 18.5 and 24.9 kg/m2 (control group); absence of diabetes mellitus, chronic kidney disease, cancer, or recent infections; nonsmokers; pregnant or breastfeeding women, as well as participants who reported chronic alcohol consumption, use of vitamin–mineral supplements and/or medications that could interfere with selenium-related nutritional status and insulin resistance, or were participating in other research study were excluded from the study. Women attending the clinic between 2018 and 2020 that met the eligibility criteria were invited to participate of the study. The final recruited sample comprised of 84 women with obesity and 129 with healthy weight. Written informed consent was obtained from all participants, and the study was approved by the Federal University of Piauí Research Ethics Committee (no 3.276.485).
Anthropometric evaluation
Body weight was measured to the nearest 0.1 kg using a digital scale, with a maximum capacity of 180 kg. Height was measured to the nearest 0.1 cm using a wall-mounted stadiometer graduated in centimeters, with a vertical and fixed bar for positioning on the head. The participants were in an upright position, barefoot, with the feet together and looking straight ahead (World Health Organization, 2000). Body mass index was calculated as weight divided by height squared, as we show in formula (Figure 1). Waist circumference was measured in the narrowest region between the chest and the hip using a flexible and nonstretchable tape to the nearest 0.1 cm (World Health Organization, 2008):
Body mass index formula.
Dietary assessment
Energy, macronutrient, and selenium intakes were assessed from three self-reported 24-h dietary records, collected in two alternate weekdays and one weekend day, which allows to obtaining an estimate of the amount of mineral intake, being a tool already used in previous studies (Fontenelle et al., 2021; Fontenelle et al., 2023; Oliveira et al., 2021; Yikyung et al., 2018). Participants were provided with instructions on how to fill out the records along with graphic information about home measures in order to minimize misreporting. Energy, macronutrients, and selenium intakes were calculated using Nutwin software version 1.5 (EPM-UNIFESP, Sao Paulo, Brazil). Software database was supplied with data for energy and macronutrients from the Brazilian Table of Food Composition (TACO, 2011) and the Table of Food Composition of the Brazilian Institute of Geography and Statistics (IBGE, 2011a), and selenium data from the study by Ferreira et al. (2002), the Food Composition Table of IBGE (2011a), and the US National Nutrient Database for Standard Reference (2016). Home measures were converted into grams according to Pinheiro et al. (2009), IBGE (2011b), and Alvarenga et al. (2005).
Macronutrients and selenium intake were compared with the estimated average requirement (EAR) established by the US Dietary Reference Intakes (carbohydrates: 45–65%, protein: 10–35%, lipid: 10–35%, selenium: 45 µg; Institute of Medicine, 2000; Institute of Medicine 2005). Selenium intake was adjusted for energy using the residual method and corrected for intrapersonal and interpersonal variability, and compared with the EAR (Fisberg et al., 2005; Jaime et al., 2003; Willett and Stampfer, 1986).
Biological samples
In the morning (7–9 am), 12 mL of fasting venous blood was collected by trained personnel and aliquoted as follows: two vacuum tubes containing ethylenediaminetetraacetic acid for selenium and glycated hemoglobin analysis (HbA1c) (4 mL each), and one vacuum-dried siliconized tube for serum glucose and insulin analysis (4 mL). Plasma and serum were separated by centrifugation (CIENTEC® 4K15, São Paulo, Brazil) at 1831×g for 15 min at 4°C and stored in demineralized microtubes at −20°C until analysis for selenium.
The erythrocyte mass resulting from the centrifuge process was washed with 5 mL of isotonic saline solution (NaCl 0.9%) followed by homogenization by inversion and centrifugation (2493×g for 10 min) so the supernatant was aspirated and discarded. This procedure was repeated three times, and after the last centrifugation, the erythrocyte mass was carefully extracted using an automatic pipette and transferred to demineralized microtubes for storage at −20°C until analysis for selenium (Whitehouse et al., 1982).
A 24-h urine sample was collected by the participants in a previously demineralized amber plastic bottle provided by the research team. Aliquots (44 mL) were transferred to demineralized collection flasks (40 mL) and microtubes (4 mL) and stored at −20°C until analysis for selenium (Robberecht and Deelstra, 1984).
Determination of plasma, erythrocytic, and urinary selenium
Selenium concentrations in plasma, erythrocyte, and urine were analyzed by inductively coupled plasma optical emission spectrometer (720 ICP/OES, Varian Inc., United States), using a hydride generator system (NABH4) mounted on a V-Groove platform with a Babington-type nebulizer with a 70 mm gas orifice attached (Błażewicz et al., 2013; Harrington et al., 2014; Niedzielski and Siepak, 2003). The apparatus was configured with the following experimental conditions: power: 1.4 kW; plasma flow (gas): 15 L/min; auxiliary gas flow: 1.5 L/min; type of spray chamber: cyclonic; and nebulizer flow: 0.7 L/min.
Plasma samples were diluted 1:20 (v/v) as follows: 3.0% (w/v) 1-butanol, 0.1% (v/v) TAMA (high purity surfactant), and 0.05% (v/v) HNO3. Erythrocyte samples were diluted 1:60 (v/v) as follows: 3.0% (w/v) 1-butanol, 0.2% (v/v) TAMA (high purity surfactant), and 0.1% (v/v) HNO3. For the urine samples, a Mars 6 microwave-assisted system (CEM®, USA) with acid digestion with 65% HNO3 (1 mL HNO3: 9 mL deionized water) was used. After digestion, the solutions were diluted 1:40 v/v in ultrapure water and placed in polytetrafluoroethylene volumetric flasks. The Se+6 was reduced to Se+4 in 4 M HCl by heating the dilute solution at 90°C for 30 min. The choice of spectral lines of analysis was based on both their sensitivity and spectral interference, and readings at wavelengths 196.026 nm and 203.985 nm were optimized for selenium. The samples were measured in triplicate.
All standards were prepared in the same way as the samples. Calibration curves were prepared using a stock solution of 1000 μg/mL selenium (Spex®CertiPrep, USA) at the following concentrations: 1, 5, 10, 20, 50, and 100 μg/L in diluent solutions containing 3.0% (w/v) 1-butanol, 0.1% (v/v) TAMA (high purity surfactant), and 0.05% (v/v) HNO3. Detection limits were determined from the equation: 3 × standard deviation (SD) of 10 blank measurements divided by the slope of the calibration curve. Samples of certified reference material (Seronorm® Oligoelement Serum, Norway) were determined to validate the analytical measurements in ICP-OES.
Selenium concentrations were compared with the following reference values: plasma selenium: 80–95 μg/L (Thomson, 2004); and erythrocyte selenium: 0.18–0.55 μg/gHb. Erythrocyte selenium, expressed as a ratio of hemoglobin concentration, was obtained by dividing the selenium values (ug/dL) by the hemoglobin concentration (g/dL) of each subject in the sample (Vitoux et al., 1999). Urinary selenium was assessed as the total amount excreted in 24-h urine, but no reference values were used for comparison given the lack of consistency in the literature. In addition, selenium clearance was calculated as the urinary selenium multiplied by the rate of urine production in 24-h and divided by plasma selenium concentration (Robinson et al., 1985).
Determination of glycemic control parameters
Plasma glucose concentrations were assessed by a colorimetric enzymatic method, using Labtest® kits. Values between 75 and 99 mg/dL were considered normal, according to the criteria defined by the American Diabetes Association (2016). The analysis of HbA1c was performed by the ion exchange chromatography method. Values between 5.7% and 6.4% indicated high risk for developing diabetes (American Diabetes Association, 2017). Serum insulin was determined by chemiluminescence (Ortho Vitros 5600, Ortho Clinical Diagnostics, United States of America, and Diasorin Liaison XL, Diasorin, Italy), considering values between 6 and 27 µU/mL as healthy range (American Diabetes Association, 2017). Homeostasis Model Assessment of Beta Cell Function (HOMA-β) index, a marker of pancreatic β-cells function, was calculated using the HOMA Calculator software (Oxford University, version 2.2.3) (The Oxford Centre for Diabetes, 2024). Homeostasis Model Assessment of Insulin Resistance (HOMA-IR) index was also calculated, with values above 2.71 indicative of insulin resistance (Matthews et al., 1985).
Missing data
The final dataset had 17% of missing data. Thus, a data imputation process was implemented with the objective of “completing” the database and enabling the analysis with all the individuals in the study. We used a single imputation via the Expectation-Maximization algorithm after using Little's test to confirm that missing data were Missing Completely at Random (Dempster et al., 1977). The function created by Andreozzi (2013) and the Multivariate Imputation by Chained Equations package were used to perform a single imputation on R program (R Development Core Team, 2019). The number of data imputations performed is available in Supplemental Table 1.
Statistical analysis
Data analysis was carried out using the Statistical Package for the Social Sciences software (SPSS) (v 20.0) for Windows® (IBM, USA). For all tests performed, a p < 0.05 was considered statistically significant. Kolmogorov–Smirnov test was applied to verify data normality. A descriptive analysis was performed by reporting normally distributed continuous variables as mean ± SD, and variables that were not normally distributed was height, plasma, and erythrocyte selenium. Between-group comparisons were assessed by Student's t-test for variables with normal distribution or Mann–Whitney test for non-normal data. Categorical variables were compared between groups with Pearson's chi-square or Fisher's exact test, as appropriate. When more than two groups were compared, one-way analysis of variance was performed, using either Tukey's post hoc or Dunn's post hoc tests. Correlation between variables was tested by Pearson's or Spearman's correlation coefficients.
Results
Anthropometric parameters for nutritional status assessment
The mean values and SDs of age and anthropometric parameters used to evaluate the nutritional status of the study participants are described in Table 1, with no differences regarding age, and as expected, the obesity group presented with significantly higher BMI and waist circumference (p < 0.05).
Mean values and standard deviations of age and anthropometric parameters, dietary intake, selenium, and glycemic biomarkers of women with obesity and control group.
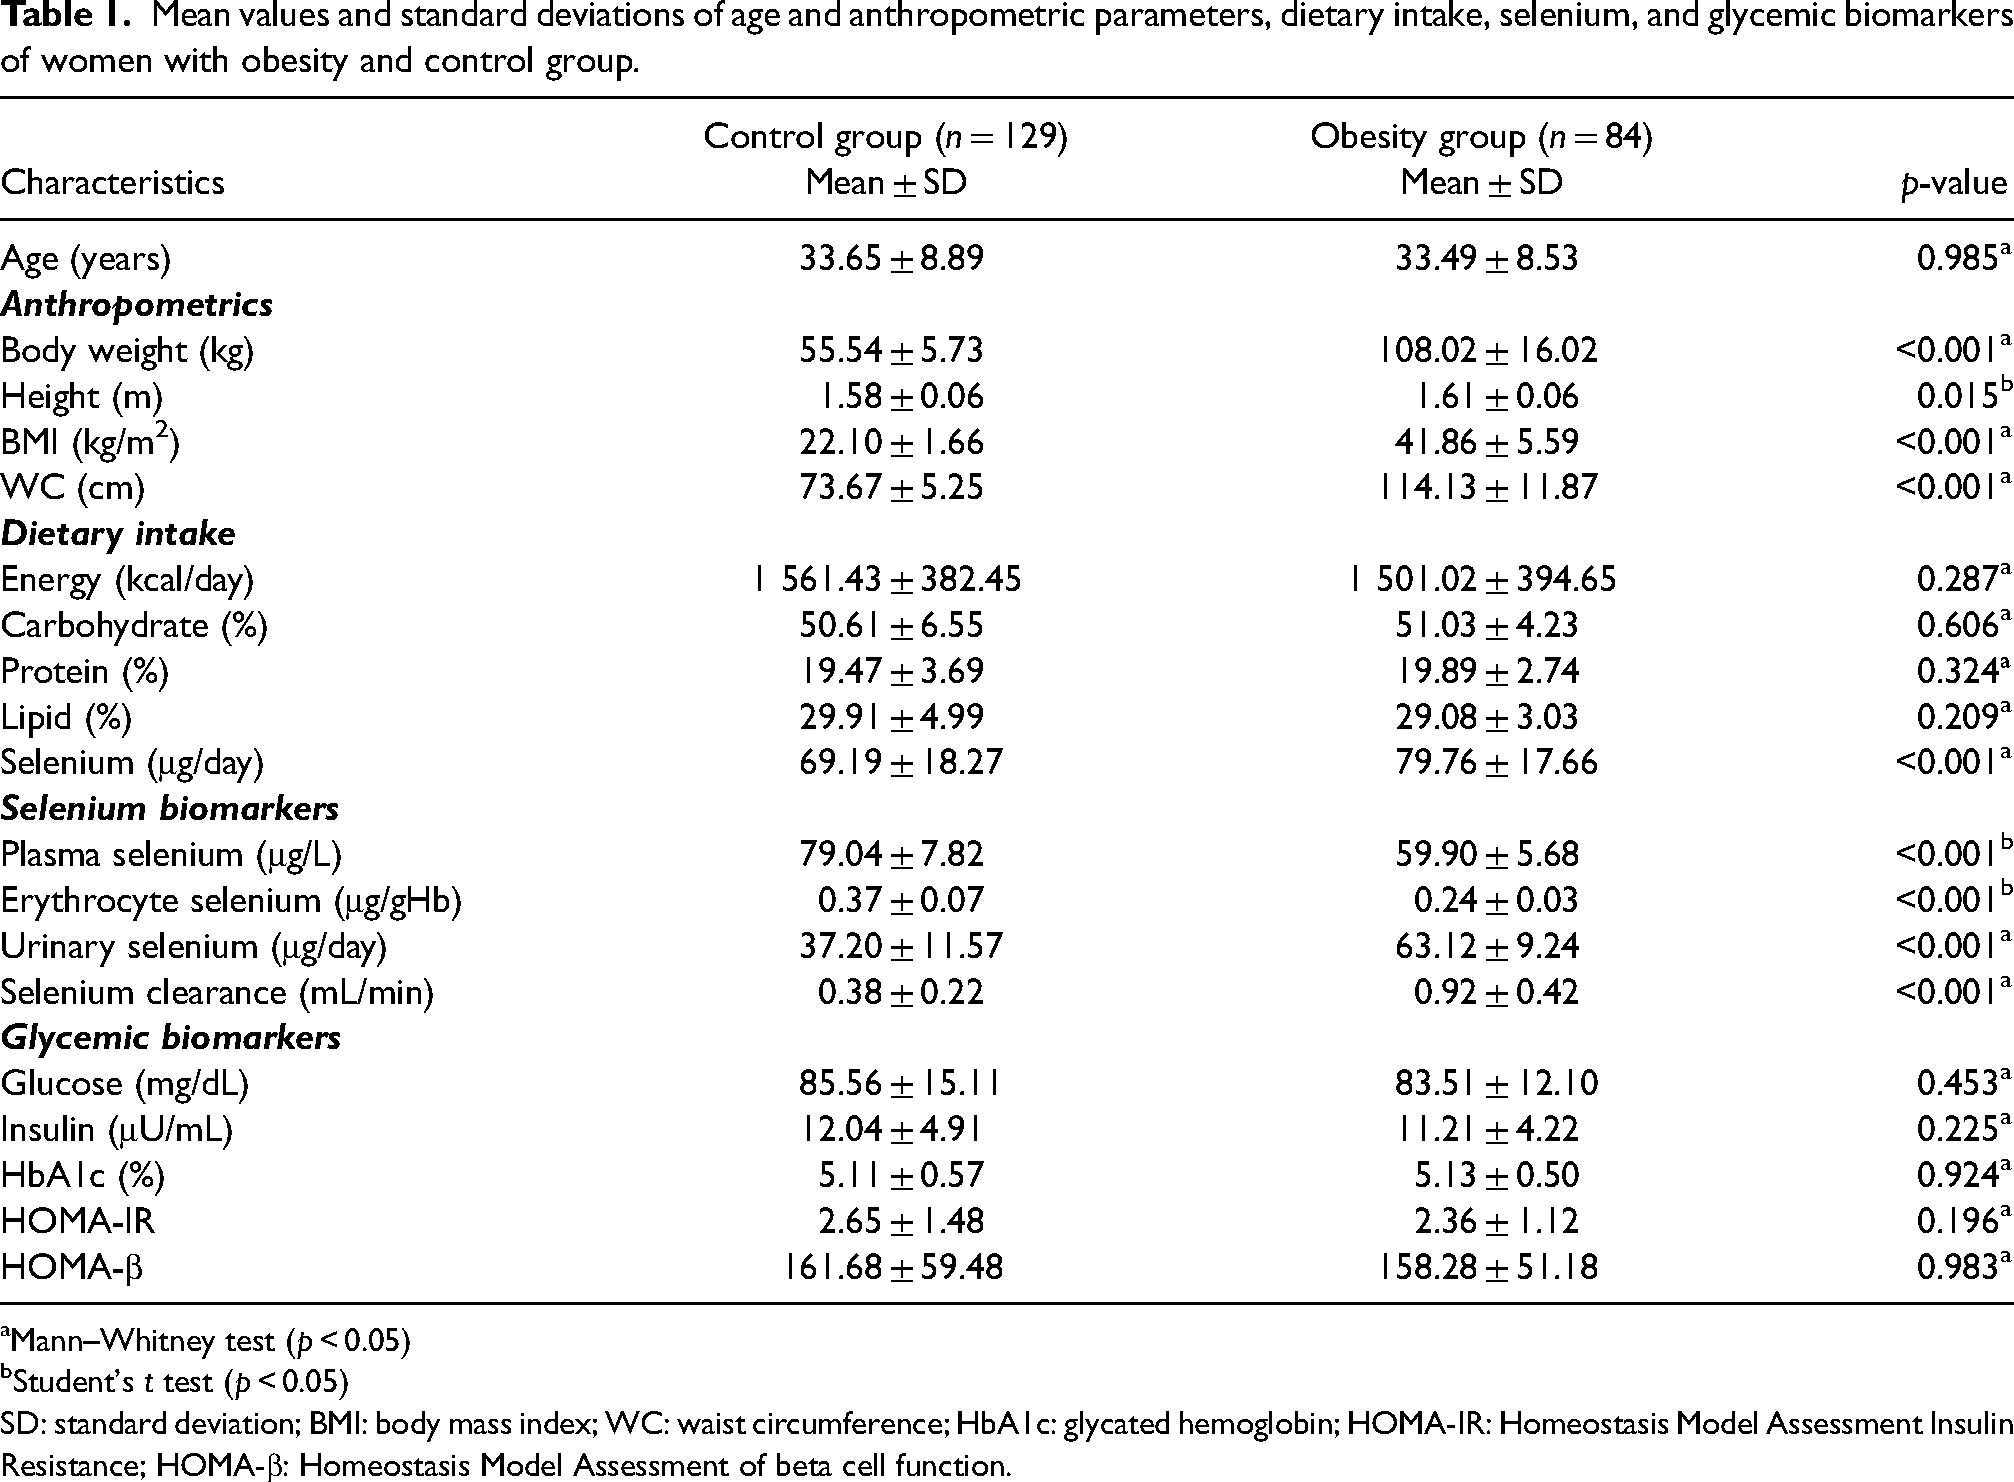
Mann–Whitney test (p < 0.05)
Student's t test (p < 0.05)
SD: standard deviation; BMI: body mass index; WC: waist circumference; HbA1c: glycated hemoglobin; HOMA-IR: Homeostasis Model Assessment Insulin Resistance; HOMA-β: Homeostasis Model Assessment of beta cell function.
Food consumption assessment
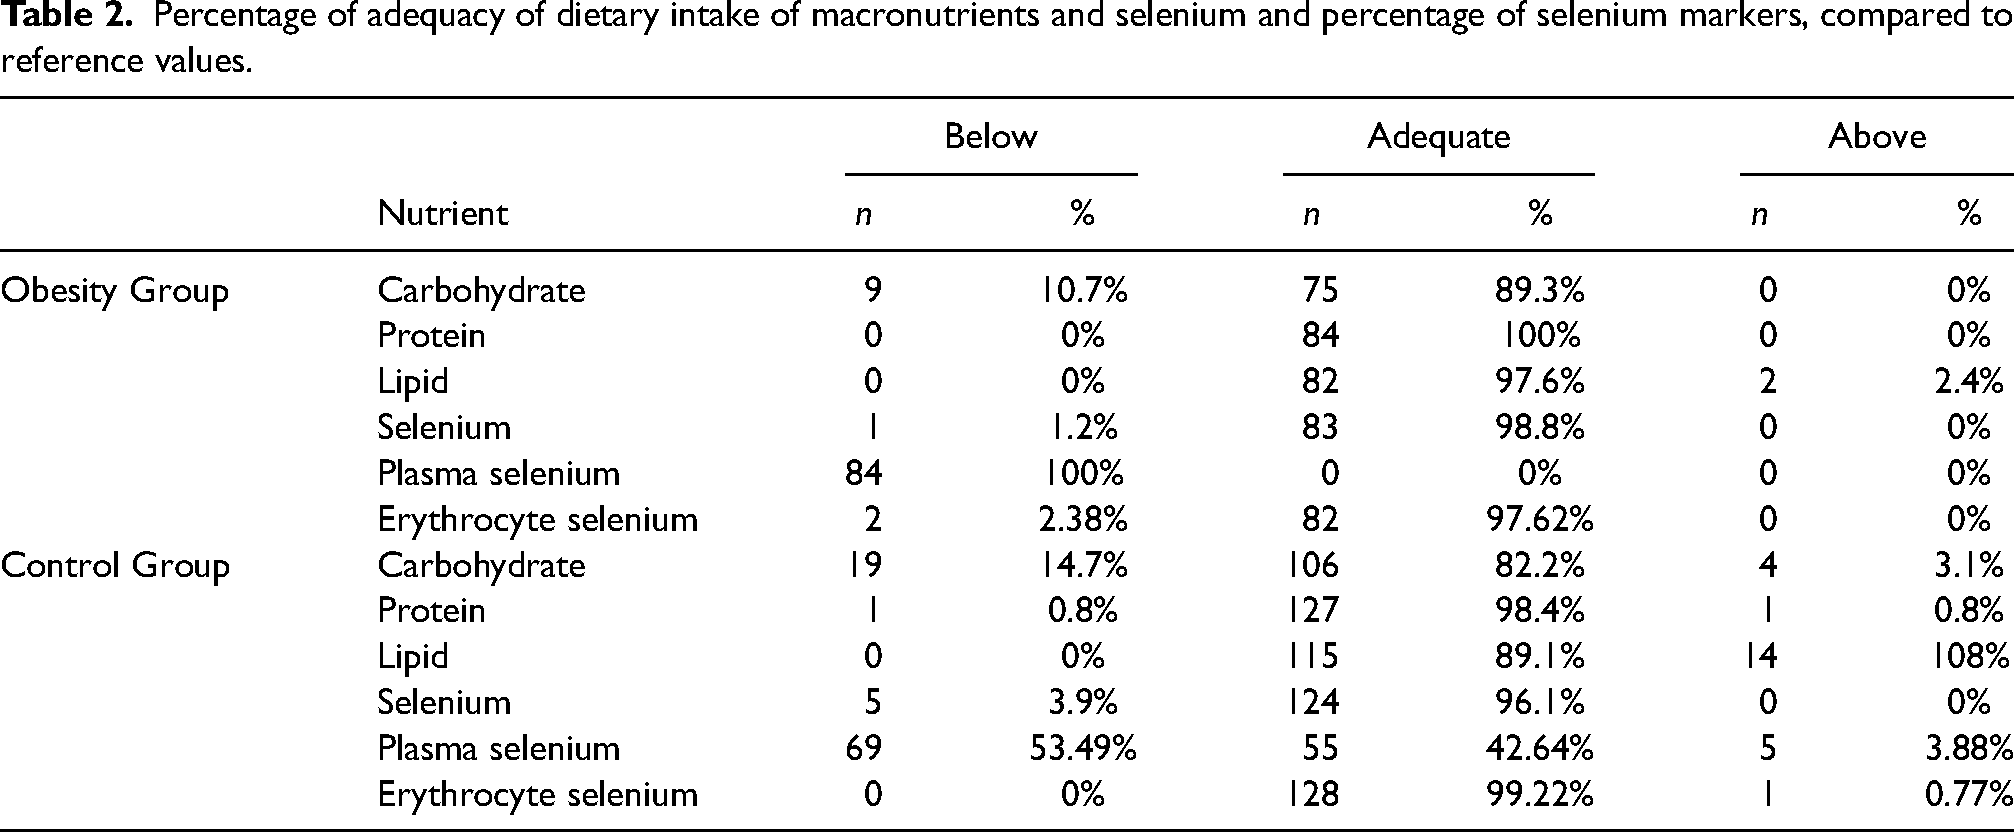
The mean values and SDs of energy, macronutrients, and selenium intake found in the diets consumed by the study participants are described in Table 1. Regarding energy and macronutrient intake, there was no statistical difference between the groups (p > 0.05), although obese participants were not on a restrictive diet. The diets of both groups presented adequate distribution of carbohydrates, proteins, lipids, and selenium considering the recommendation of the Institute of Medicine (2000, 2005). Furthermore, it was verified that women with obesity had higher intake of selenium when compared to the control group (p < 0.001). The percentage of adequacy of dietary consumption of macronutrients, selenium, as well as biochemical markers of the mineral are shown in Table 2.
Percentage of adequacy of dietary intake of macronutrients and selenium and percentage of selenium markers, compared to reference values.
Selenium-related biochemical and glycemic control parameters
Table 1 describes the plasma, erythrocyte, and urinary selenium concentrations, as well as the mineral clearance found in the women with obesity and control group, with a statistically significant difference between the groups for all parameters (p < 0.001). Table 1 also show that was no statistically significant difference between the women with obesity and the control group regarding the glycemic control parameters assessed (p > 0.05).
Correlation between selenium biomarkers and glycemic control parameters
Table 3 shows the results of the correlation analysis between parameters of glycemic control and selenium biomarkers of the participants with obesity and control group. Total selenium intake was positively associated with HOMA-β in both groups, while plasma selenium was positively associated with HOMA-β in the control group only. In the group with obesity, selenium intake was also positively associated with insulin concentration and HbA1c. In the control group, urine selenium was negatively associated with glucose, insulin, and HOMA-IR, while a negative association was also observed between selenium clearance and insulin and HOMA-IR.
Simple linear correlation analysis between selenium and glycemic control parameters in women with obesity and control group.
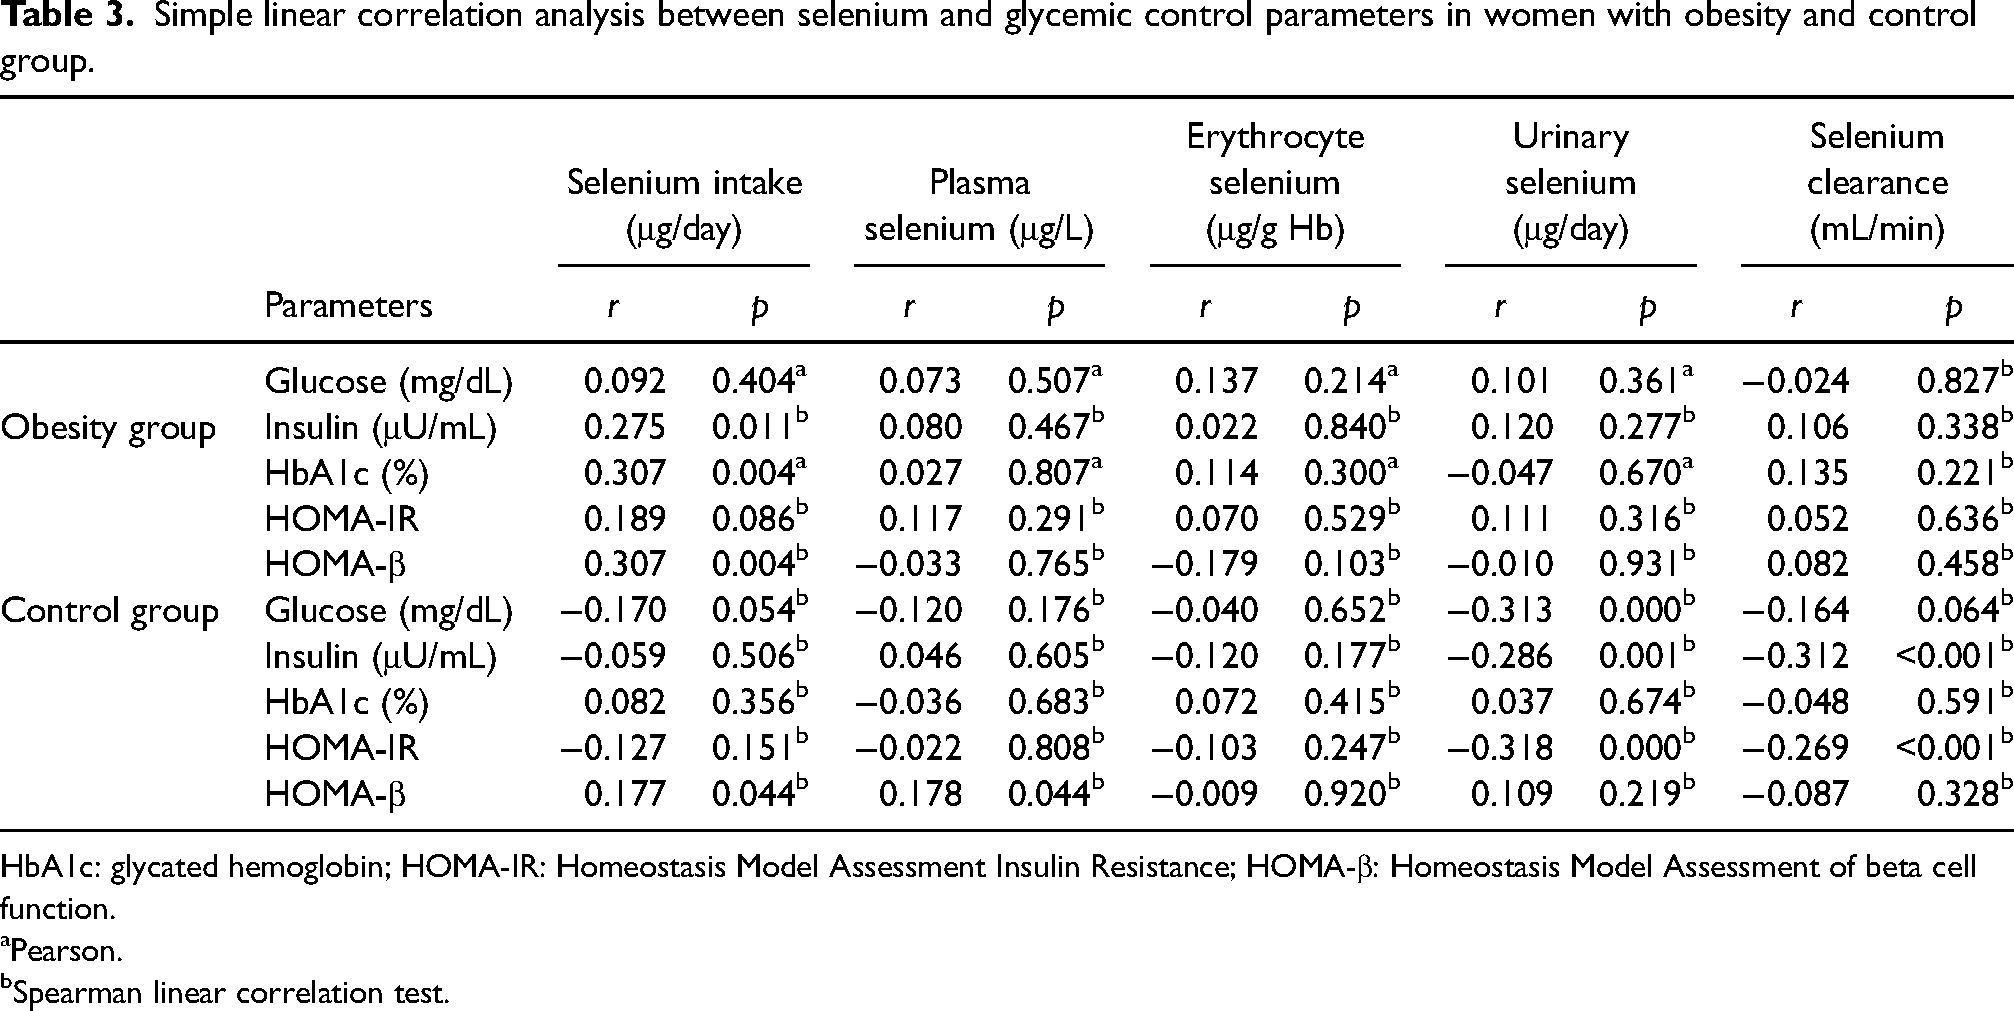
HbA1c: glycated hemoglobin; HOMA-IR: Homeostasis Model Assessment Insulin Resistance; HOMA-β: Homeostasis Model Assessment of beta cell function.
aPearson.
bSpearman linear correlation test.
Discussion
Previous research has demonstrated that high selenium intake is associated with an increased risk of type 2 diabetes, and markers of insulin resistance such as insulin concentration and HOMA-IR were reported to be associated with mineral blood concentrations in a selenium-replete population (Cardoso et al., 2021; Pyrzynska and Sentkowska, 2023). This case–control study was designed to investigate whether the association between selenium markers and insulin resistance parameters between women with and without obesity. Our findings reveal that women with obesity presented with lower selenium concentration in plasma and erythrocytes and higher urinary excretion of the mineral in comparison to women with healthy BMI, even though their dietary selenium intake was higher. Further, HOMA-β was positively associated with dietary selenium in both study groups, while the association between HOMA-β and plasma selenium was only seen in controls. In women with obesity, selenium intake was also positively associated with insulin and HbA1c, while in the controls the clearance of selenium was negatively associated with insulin and HbA1c.
The results do not reveal a significant statistical difference between the groups studied in relation to the consumption of energy, macronutrients, and selenium, which is probably due to the inconsistency in filling out the food record by the participants, underestimation of the amount of food consumed and embarrassment in reporting food intake of inadequate quality. These results are in line with previous studies carried out in a similar population (Feitosa et al., 2017; Fontenelle et al., 2023).
It was observed that both groups presented with adequate selenium dietary intake according to the EAR, with significant higher concentration in the diets of women with obesity. Women in the obesity group presented with lower circulating concentrations and higher selenium excretion via urine. These findings were also observed in two previous studies that assessed selenium status in women with obesity from Teresina-Piauí, Brazil (Fontenelle et al., 2021, 2023). In that study, case group presented with lower selenium status in comparison to women with healthy weight despite presenting similar selenium intake (Fontenelle et al., 2021, 2023). Although some previous studies reported lower selenium status in people with obesity, findings from a meta-analysis revealed unclear results, since only men with obesity were seen to present with higher selenium concentrations in plasma in comparison to men with healthy weight (Fontenelle et al., 2021, 2022; Oliveira et al., 2021). This study adds important information regarding the comparison of selenium concentration in erythrocytes between women with and without obesity, with similar findings reported in previous studies (Feitosa et al., 2017; Fontenelle et al., 2023; Oliveira et al., 2021).
Different hypothesis can explain the lower selenium status in women with obesity observed in our findings. First, the excessive production of reactive oxygen species observed in obesity results in increased selenium requirements for the synthesis of selenoproteins with redox activity, which may result in a reduced concentration of this nutrient in plasma and erythrocytes (Lay et al., 2014; Savini et al., 2013). Second, studies have shown that the excessive production of pro-inflammatory cytokines by the adipose tissue, oxidative stress, and adipogenesis are associated with reduced selenoproteins, such as SELENOP, the main enzyme involved in selenium transport in plasma (Larvie et al., 2019; Tinkov et al., 2020). Thus, although analysis of inflammatory markers was not conducted in the women of the present study, can be hypothesizing that low-grade inflammation commonly seen in obesity may impair selenium metabolism (Larvie et al., 2019; Tinkov et al., 2020). Further, along with lower selenium concentrations in plasma and erythrocytes, women with obesity presented with higher excretion of this mineral, indicating lower retention of this element in the body as reported in previous studies by our group, developed in a population with characteristics similar to those of the present study (Fontenelle et al., 2023; Oliveira et al., 2021). It is noteworthy that chronic low-grade inflammation in obesity reduces hepatic SELENOP synthesis, this aspect explains the greater availability of selenium compounds to urinary excretion, that are fundamental for the synthesis of this selenoprotein, promoting greater clearance of this nutrient in people with obesity and compromising the availability of the mineral for the synthesis of selenoproteins (Jäger et al., 2016).
In our study population, no differences were observed for markers of glycemic control between women with and without obesity, with all participants presenting with values within the range for fasting glucose and insulin, HbA1c, HOMA-IR, and HOMA-β. Although obesity is a disease that constitutes a risk for the development of metabolic disorders, about 30% of individuals with obesity have a healthy metabolic profile with insulin sensitivity similar to eutrophic individuals, possibly due to the distribution of body adiposity with low visceral fat (Patel and Abate, 2013).
Selenium intake was associated with worse glycemic control in both groups, but stronger association was seen in women with obesity. However, plasma selenium was positively associated with HOMA-β, and selenium urinary excretion was negatively associated with glycemic control markers in controls only. Previous research has reported that moderate to high selenium intake is associated with disturbance in glycemic control (Cardoso et al., 2021; Steinbrenner et al., 2022). A meta-analysis of seven studies indicated a linear association between selenium intake and risk of type 2 diabetes, with stronger association arising at consumption of 80 μg/day, which is similar to the intake observed in the obesity group (Vinceti et al., 2021). In the same meta-analysis, data pulled from 19 studies indicated a J-shaped association between selenium concentration in blood and diabetes incidence, with a threshold at 120 µg/L (Vinceti et al., 2021). In the obesity group, selenium concentration in plasma and erythrocytes may sit within the range where no adverse effect is observed, while the higher concentration observed in the control group seems to be at a level where selenium adversely affects glucose homeostasis. The negative association between selenium urinary excretion and glucose markers seen in the control group diverges from previous literature reporting a positive association between urinary selenium and fasting plasma glucose, observed in a study conducted with adult and elderly individuals with different BMI classifications (Urbano et al., 2021). Such negative association reflects the adequate selenium intake presented by the group which has not reached a threshold that compromises the glucose metabolism, while the lack of association observed in the obesity group may be due to the selenium metabolism impairment associated with obesity. Nonetheless, further investigation using this parameter is necessary to identify its reliability regarding the association with insulin resistance and diabetes.
The participation of selenium in the action of insulin occurs through mechanisms, among which its insulin-mimetic activity, and its action in the expression and phosphorylation of key enzymes of the insulin signaling cascade, such as the insulin receptor, IRS-1, IRS-2, PI3K, Akt, and GLUT-4. Furthermore, both selenium deficiency and excess have been associated with reduced expression of enzymes involved in the insulin signaling cascade, which compromises glycemic control. The main hypothesis considers that high selenium intake enhances the expression and activity of GPX1, a selenium-dependent protein (Lubos et al., 2011). Glutathione peroxidase 1 maintains cellular redox homeostasis by degrading hydrogen peroxide (H2O2), however, its enhanced activity seems to potentiate the action of protein tyrosine phosphatase 1B and phosphatase and tensin homologue, which dephosphorylate the insulin receptor and IRS-1, making the translocation of GLUT-4 and cellular influx of glucose unfeasible, which favors the manifestation of insulin resistance (Rayman, 2020; Steinbrenner et al., 2006a, 2006b, 2011, 2022).
This study has some limitations that are worth mentioning. Our study included women only, and given that selenium metabolism diverges between males and females caution should be taken when extrapolating the findings to men. Further, our strict eligibility criteria may have resulted in a relatively healthy population, which can explain the lack of difference in glucose markers between groups (Seale et al., 2018). Dietary selenium assessment has important limitations related to misreporting and variation in selenium concentration in foods depending on soil selenium concentration, which may reduce accuracy when using food composition tables for analysis (Thiry et al., 2012). To minimize these issues, it was used a reliable dietary assessment method and Brazilian food composition tables as resources to determine selenium concentration in the diet. For future studies, we recommend assessing inflammatory markers to explore a potential mechanism for the link between selenium and glucose metabolism, as well as the development randomized clinical trials that investigate molecular aspects of the effect of this nutrient on glycemic homeostasis and longitudinal studies that can evaluate the effect of selenium supplementation on insulin resistance.
Conclusion
Our findings indicate that women with obesity present with impaired selenium metabolism. Further, we observed an association between dietary selenium and markers of insulin resistance, which may reflect the possible negative action of selenium on insulin signaling. Thus, it is evident the need for advances in research that may contribute to the knowledge about the different ways selenium acts on insulin signaling, particularly in the population with obesity. Moreover, it is suggested that further analyses be made on the role of selenium in the secretion and action of this hormone by using molecular parameters, such as the expression of proteins involved in the signaling cascade of this hormone.
Supplemental Material
sj-docx-1-nah-10.1177_02601060241296004 - Supplemental material for Association between selenium biomarkers and insulin resistance in women with obesity: A case–control study
Supplemental material, sj-docx-1-nah-10.1177_02601060241296004 for Association between selenium biomarkers and insulin resistance in women with obesity: A case–control study by Tamires da Cunha Soares, Bruna Emanuele Pereira Cardoso, Thaline Milany da Silva Dias, Jennifer Beatriz Silva Morais, Larissa Cristina Fontenelle, Stéfany Rodrigues de Sousa Melo, Loanne Rocha dos Santos, Thayanne Gabryelle Visgueira de Sousa, Mickael de Paiva Sousa, Francisco Erasmo Oliveira, Gilberto Simeone Henriques, Barbara Rita Cardoso and Dilina do Nascimento Marreiro in Nutrition and Health
Footnotes
List of abbreviations
Acknowledgment
The authors are grateful to all the volunteers who took part in the research and to the Federal University of Piauí for their support.
Authors’ contributions
TCS and DNM carried out the project conceptualization process. TCS, BEPC, TMSD, and DNM designed the methodology. TCS, BEPC, TMSD, JBSM, LCF, SRSM, LRS, TGVS, and MPS collected the data. TCS, FEO, and GSH carried out the formal analysis and interpreted the data. TCS and BRC participated in writing original draft. TCS, BRC, and DNM participated in writing review and editing. DNM was responsible for project administration and supervision. All authors approved the final version to be submitted.
Availability of data and materials
Data are available upon request to the authors.
Declaration of conflicting interests
The authors declared no potential conflicts of interest with respect to the research, authorship, and/or publication of this article.
Ethics statement
This study was conducted according to the guidelines laid down in the Declaration of Helsinki III and all procedures involving human participants were approved by the ethical standards of the Research Ethics Committee of the Federal University of Piauí (no 3.276.485). All participants signed a written informed consent prior to the start of the study.
Funding
This research did not receive any specific grant from funding agencies in the public, commercial, or not-for-profit sectors.
Supplemental material
Supplemental material for this article is available online.
References
Supplementary Material
Please find the following supplemental material available below.
For Open Access articles published under a Creative Commons License, all supplemental material carries the same license as the article it is associated with.
For non-Open Access articles published, all supplemental material carries a non-exclusive license, and permission requests for re-use of supplemental material or any part of supplemental material shall be sent directly to the copyright owner as specified in the copyright notice associated with the article.