
Abstract
Background
Existing tools for assessing mindful eating tend to be too long to use in many settings.
Aims/Objective
We assessed if a Shortened Mindful Eating Inventory (sMEI) would perform similarly to a previously developed longer inventory.
Methods/Methodology
The sMEI was constructed by selecting the items with the highest factor loading from each subscale of the original Peitz Mindful Eating Inventory (MEI) study. Participants (n = 224) completed the sMEI first and the MEI a month later to examine test-retest reliability. The Spearman's correlation coefficient was computed for sMEI and MEI scores overall and for demographic subgroups. Cronbach's alpha was computed to assess internal reliability and exploratory factor analysis was used to verify sMEI items loaded highly on MEI subscales.
Results/Findings
The mean age of the participants was 31.0 (SD 13.0) with 85.7% females. Overall, the sMEI and MEI were correlated (Spearman r = 0.73, p < 0.001). Among demographic subgroups, the correlation remained moderate to strong and similar (r = 0.62–0.76), but most highly correlated for females (r = 0.75, p < 0.001), and individuals 18–30y (r = 0.76, p < 0.001). Each sMEI item agreed closely (+/- 1-point) with its corresponding MEI item. The items also ranked high on factor loadings in their respective subscale, indicating their appropriateness as representing dimensions of mindful eating.
Conclusion
The sMEI showed acceptable internal validity, good correlation with MEI, and sMEI items sufficiently represent each MEI subscale in our sample of mainly white female adults =< age 30. Therefore, in this population the sMEI may be a reasonable alternative when a longer measurement tool is not feasible.
Introduction
Mindful eating is a practice of having full awareness, both mentally and physically, of food that is being consumed (Fung et al., 2016; Monroe, 2015). Studies have shown that mindful eating promotes improved eating rate, better awareness of hunger and satiety cues, and allows for a better relationship with food (Monroe, 2015). Findings from observational studies have shown an association between mindful eating habits and healthier eating patterns, lower weight status, and favorable cardiovascular biomarkers (Van Beekum et al., 2024). Additionally, mindful eating has been tested as part of the treatment for binge eating disorder (Grohmann and Laws, 2021; Warren et al., 2017) showing that incorporating mindful eating practices improved anthropometric data, episodes of binge eating, body image dissatisfaction, eating habits, and quality of life in participants with obesity and binge eating disorder (Minari et al., 2024). Therefore, mindful eating practices have the potential to improve diet quality and health outcomes (Abbaspoor et al., 2018; Monroe, 2015).
In order to understand the effects of mindful eating, it is essential to have a valid and reliable tool to accurately measure mindful eating status. In addition, the tool needs to be easy and quick to administer to be successfully deployed in both research and clinical practice. Currently, there are a number of mindful eating scales that have been developed and tested for validity and reliability (Abbaspoor et al., 2018; Framson et al., 2009; Kearns et al., 2014; Monroe, 2015; Peitz et al., 2021). However, most of the scales contained at least 20 questions. While there were efforts to shorten the questionnaires, a shorter version was not substantially shorter (Clementi et al., 2017). In both research and clinical practice settings, time constraints also precluded the use of long questionnaires. Therefore, a valid and short questionnaire is critical for widespread utilization.
In this study we aimed to develop and test a shorter questionnaire that would reduce participant burden while still sufficiently assess the level of mindful eating.
Methods
Design
This longitudinal study utilized two anonymous self-administered questionnaires 4 weeks apart to the same group of participants.
Participants
We recruited adults aged 18 and older, able to read English, and who have access to the internet and an email. Those who were in active treatment for an eating disorder at the time of data collection were not eligible. This study was approved by the Simmons University Institutional Review Board and consent was obtained from each participant.
Convenience sampling was used to recruit participants. We collaborated with a multi-location retail store, a medical technology firm in a major metropolitan area in the Northeast which an email blast was sent to employees via contacts of the companies. Researchers also sent the recruitment email to their contacts. In addition, a recruitment invitation was posted on Instagram by a colleague with a large following. A link to the survey was included in the email and Instagram post.
The sample size was calculated based on the correlation between sMEI and MEI, assuming 80% power to detect a substantial correlation (Ha: r = 0.6) over a poor correlation (Ho: r = 0.4), and an alpha level of 0.05. The resulting sample size was 112 participants (Ristl).
Measures
As there are a number of mindful eating questionnaire already available, we developed a shortened version based on an existing questionnaire. We reviewed the existing questionnaire for the number of mindful eating domains measured, the testing performed for reliability for construct and content validity. The Mindful Eating Inventory (MEI) by Peitz in 2021 (Peitz et al., 2021) was chosen as the basis for the shortened questionnaire. The Mindful Eating Inventory (MEI) has strong psychometric properties including content validity, criterion validity, test-retest reliability, and internal consistency reliability. It has 30 questions arranged into 7 subscales: accepting and non-attached attitude (ANA) towards one's own eating experience, awareness of senses while eating (ASE), eating in response to awareness of fullness (ERF), awareness of eating triggers and motives (ATM), connectedness (CON), non-reactive stance (NRS), and focused attention on eating (FAE). To develop the sMEI, the original validation study results were used (Peitz et al., 2021). The question with the highest factor loading from each of these seven subscales was selected. Each of the seven questions was ranked on the same 6-point likert scale as on the MEI, ranging from almost never to almost always (Supplemental Table 1). The sMEI was then compared with the MEI.
Each question in the Shortened Mindful Eating Inventory (sMEI) and the Mindful Eating Inventory (MEI) was designated points. Points were assigned using the 6-point Likert scale for each question and converted into a score of 0–5 (0 indicating not mindful and 5 indicating very mindful). Zero points were given for unanswered questions. Participants missing more than 3 questions were excluded from the study. Total points were summed up for the sMEI and summed up for the MEI. The possible range of scores for the sMEI was 0–35 and for the MEI the possible range was 0–150.
Procedure
Data were collected from participants through two web-based questionnaires. The shortened Mindful Eating Inventory launched in the early months of 2024. The original Peitz MEI was administered one month after the sMEI to assess validity and test-retest reliability.
Demographic information was collected along with the sMEI in the first questionniare only. This information included age, sex, race/ethnicity, exercise habits, level of interest in food and nutrition, area of work/study, and highest education level. The variables age and area of work/study were open responses. Participants were given the following choices for sex: male, female, or other. Race and ethnicity were assessed through U.S. Census categories (Jensen, 2022). Exercise habits were measured using the Behavioral Risk Factor Surveillance System (BRFSS) categories from the CDC (National Center for Chronic Disease Prevention and Health Promotion). Level of interest in food and nutrition was measured on a 6-point Likert scale of interest ranging from “not interested” to “very interested”. Highest level of education was measured using the U.S. Census categories.
Area of work/study was categorized into nine groups based on the open response given by the individuals. The categories were healthcare, legal, student, retired/unemployed, business, service, teacher, engineer, and administration.
Statistical analysis
We obtained 395 respondents for the first questionnaire and 224 respondents for the second questionnaire, corresponding to 56.7% follow-up response. Of the 395 participants who completed the sMEI there were 0 respondents missing an answer and of the 224 participants who completed the second questionnaire there were 7 respondents missing an answer but no participant omitted more than 3 questions. Therefore, the final analytic sample size was 224.
To assess if there were differences in mindful eating scores or differences in correlation to either MEI or sMEI in specific subgroups, some of the demographic categories were combined due to small numbers for statistical analysis. The area of work/study was combined into two healthcare and not-healthcare. The interest in nutrition scale was combined into interested and not interested. The category of those interested in nutrition included those who chose “interested” and “very interested.” The not interested category included those who responded “neutral,” “somewhat interested,” and “not interested.” Exercise habits were combined into two categories based on meeting or not meeting CDC physical activity guidelines of at least 150 min of moderate intensity activity or at least 75 min of intense activity.
We compared mean sMEI and MEI scores among the entire sample and among participant subgroups with one-way ANOVA (multiple categories), and independent t-test for age which was classified into two categories of 18–30 and 31 and older. To examine the extent that the sMEI measures the level of mindful eating similar to the MEI, Spearman's correlation coefficient was computed between the sMEI and original MEI, for all participants and by participant characteristics. As the MEI and sMEI were administered 4 weeks part, we assessed test-retest reliability was assessed by comparing the response selected by each participant in same items on the MEI. We defined exact agreement as participants picking the same Likert scale value for both items (e.g., “rarely”). We defined partial agreement as participants picking a response on one survey that was one point above or below the value of the other survey (e.g., “rarely” on one survey and “almost never” or “occasionally” on the other). Cronbach's alpha was used to assess the internal reliability of the MEI and sMEI. To assess the representativeness of the sMEI items for domains of the MEI, we conducted exploratory factor analysis on the items in the MEI among our participants. We compared the factors identified in our sample with the ones by Peitz (Peitz et al., 2021) to assess similarity of subscales identified. As sMEI items were the highest loading items in each subscale in the Peitz study, we identify the factor loading rankings of the sMEI items in our analysis to assess representativeness of each sMEI items for their respective subscale. Statistical analysis was performed using IBM SPSS statistics software version 29.0.2.0.
Results
Among the 224 participants who completed both the sMEI and MEI the mean age was 31.0 (SD 13.0) years (range 18–75) (Table 1). The study primarily consisted of females (85.7%) and non-Hispanic white individuals (82.1%). Among the participants, 76.3% had a Bachelor's degree or higher and 30.8% trained or worked the healthcare related fields (Table 1).
Participant characteristics.
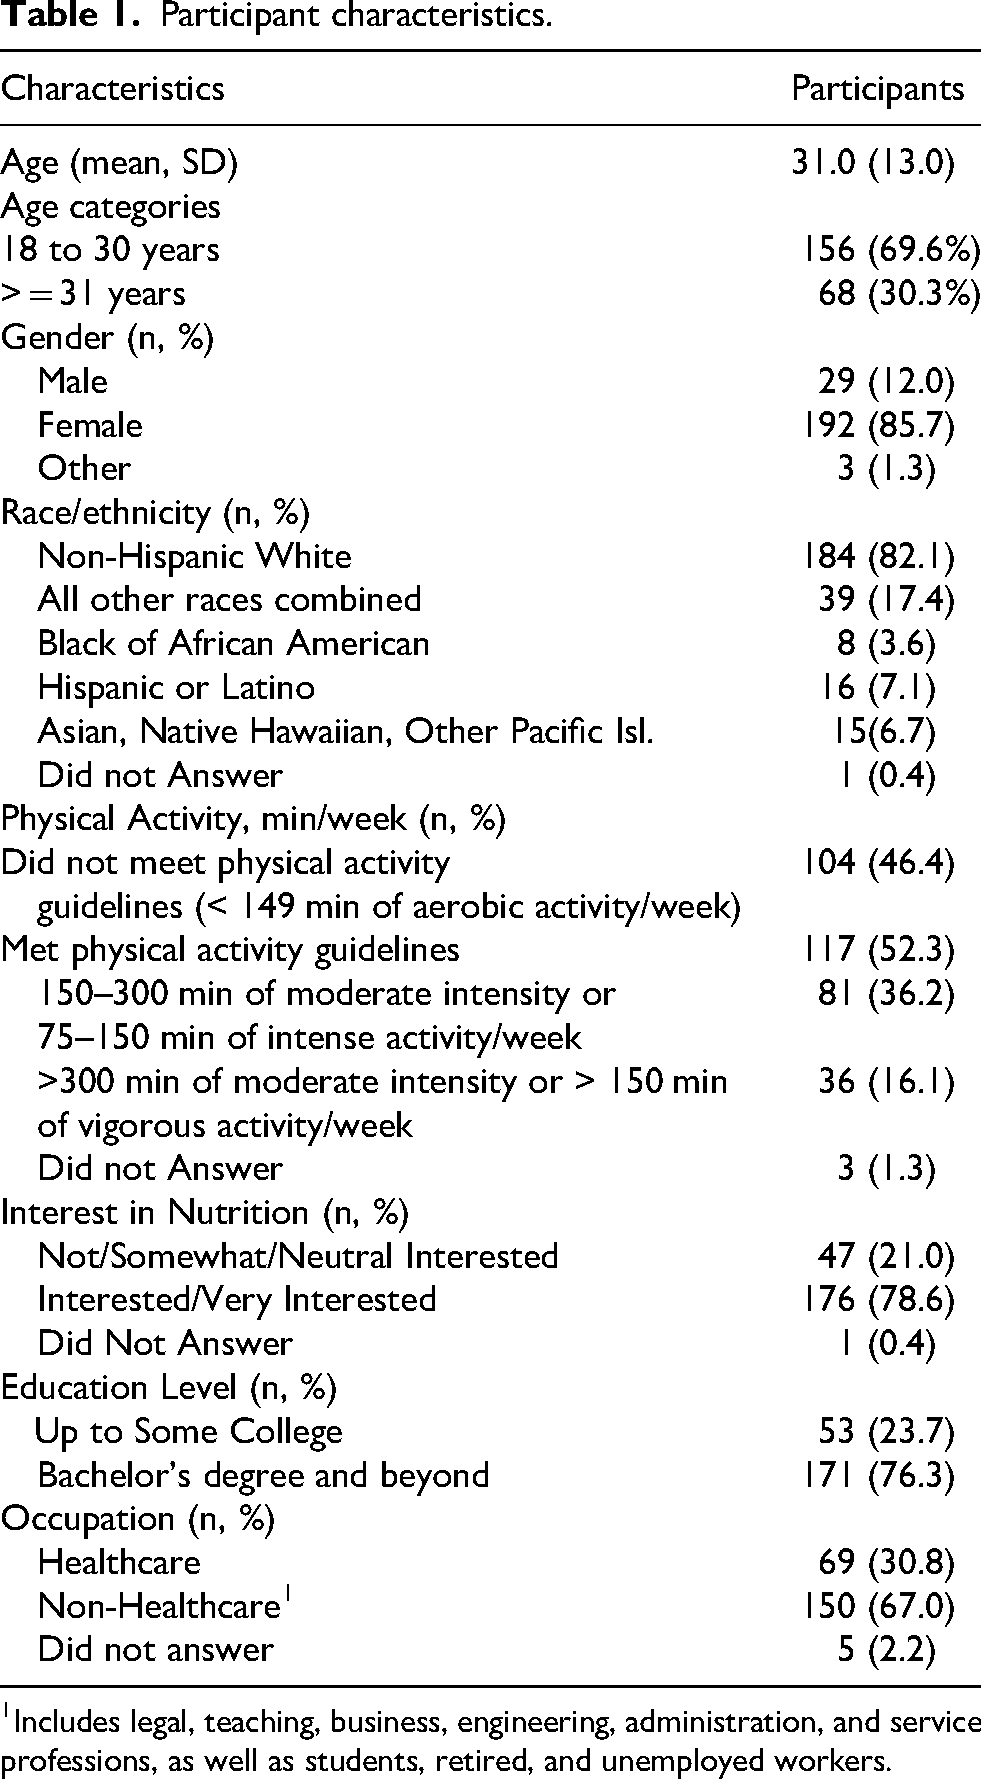
Includes legal, teaching, business, engineering, administration, and service professions, as well as students, retired, and unemployed workers.
Mean MEI and sMEI Score by participant characteristics are shown in Supplemental Table 2. Mean MEI and sMEI scores were higher among those with higher level of exercise (p = 0.002 and 0.03, respectively) and education level subgroups (p-value = 0.02). Individual with higher interest in nutrition also scored higher in the sMEI (p-value =0.03). The MEI score also tended to be higher among those with higher interest in nutrition but the difference did not reach statistical significance (p = 0.14). On the other hand, MEI score was higher (p = 0.01) among participants with higher levels of education but this was not apparent with the sMEI score.
The sMEI and MEI were strongly correlated (Spearman r = 0.73, p < 0.001) (Figure 1). The Spearman's correlation coefficient between sMEI total score and MEI total score were moderate to strong and similar for all demographic subgroups (r = 0.62–0.76), but most highly correlated for females (r = 0.75 p < 0.001), participants aged 18–30 (r = 0.76, p < 0.001), and those in the healthcare field (r = 0.75, p < 0.001) (Table 2).
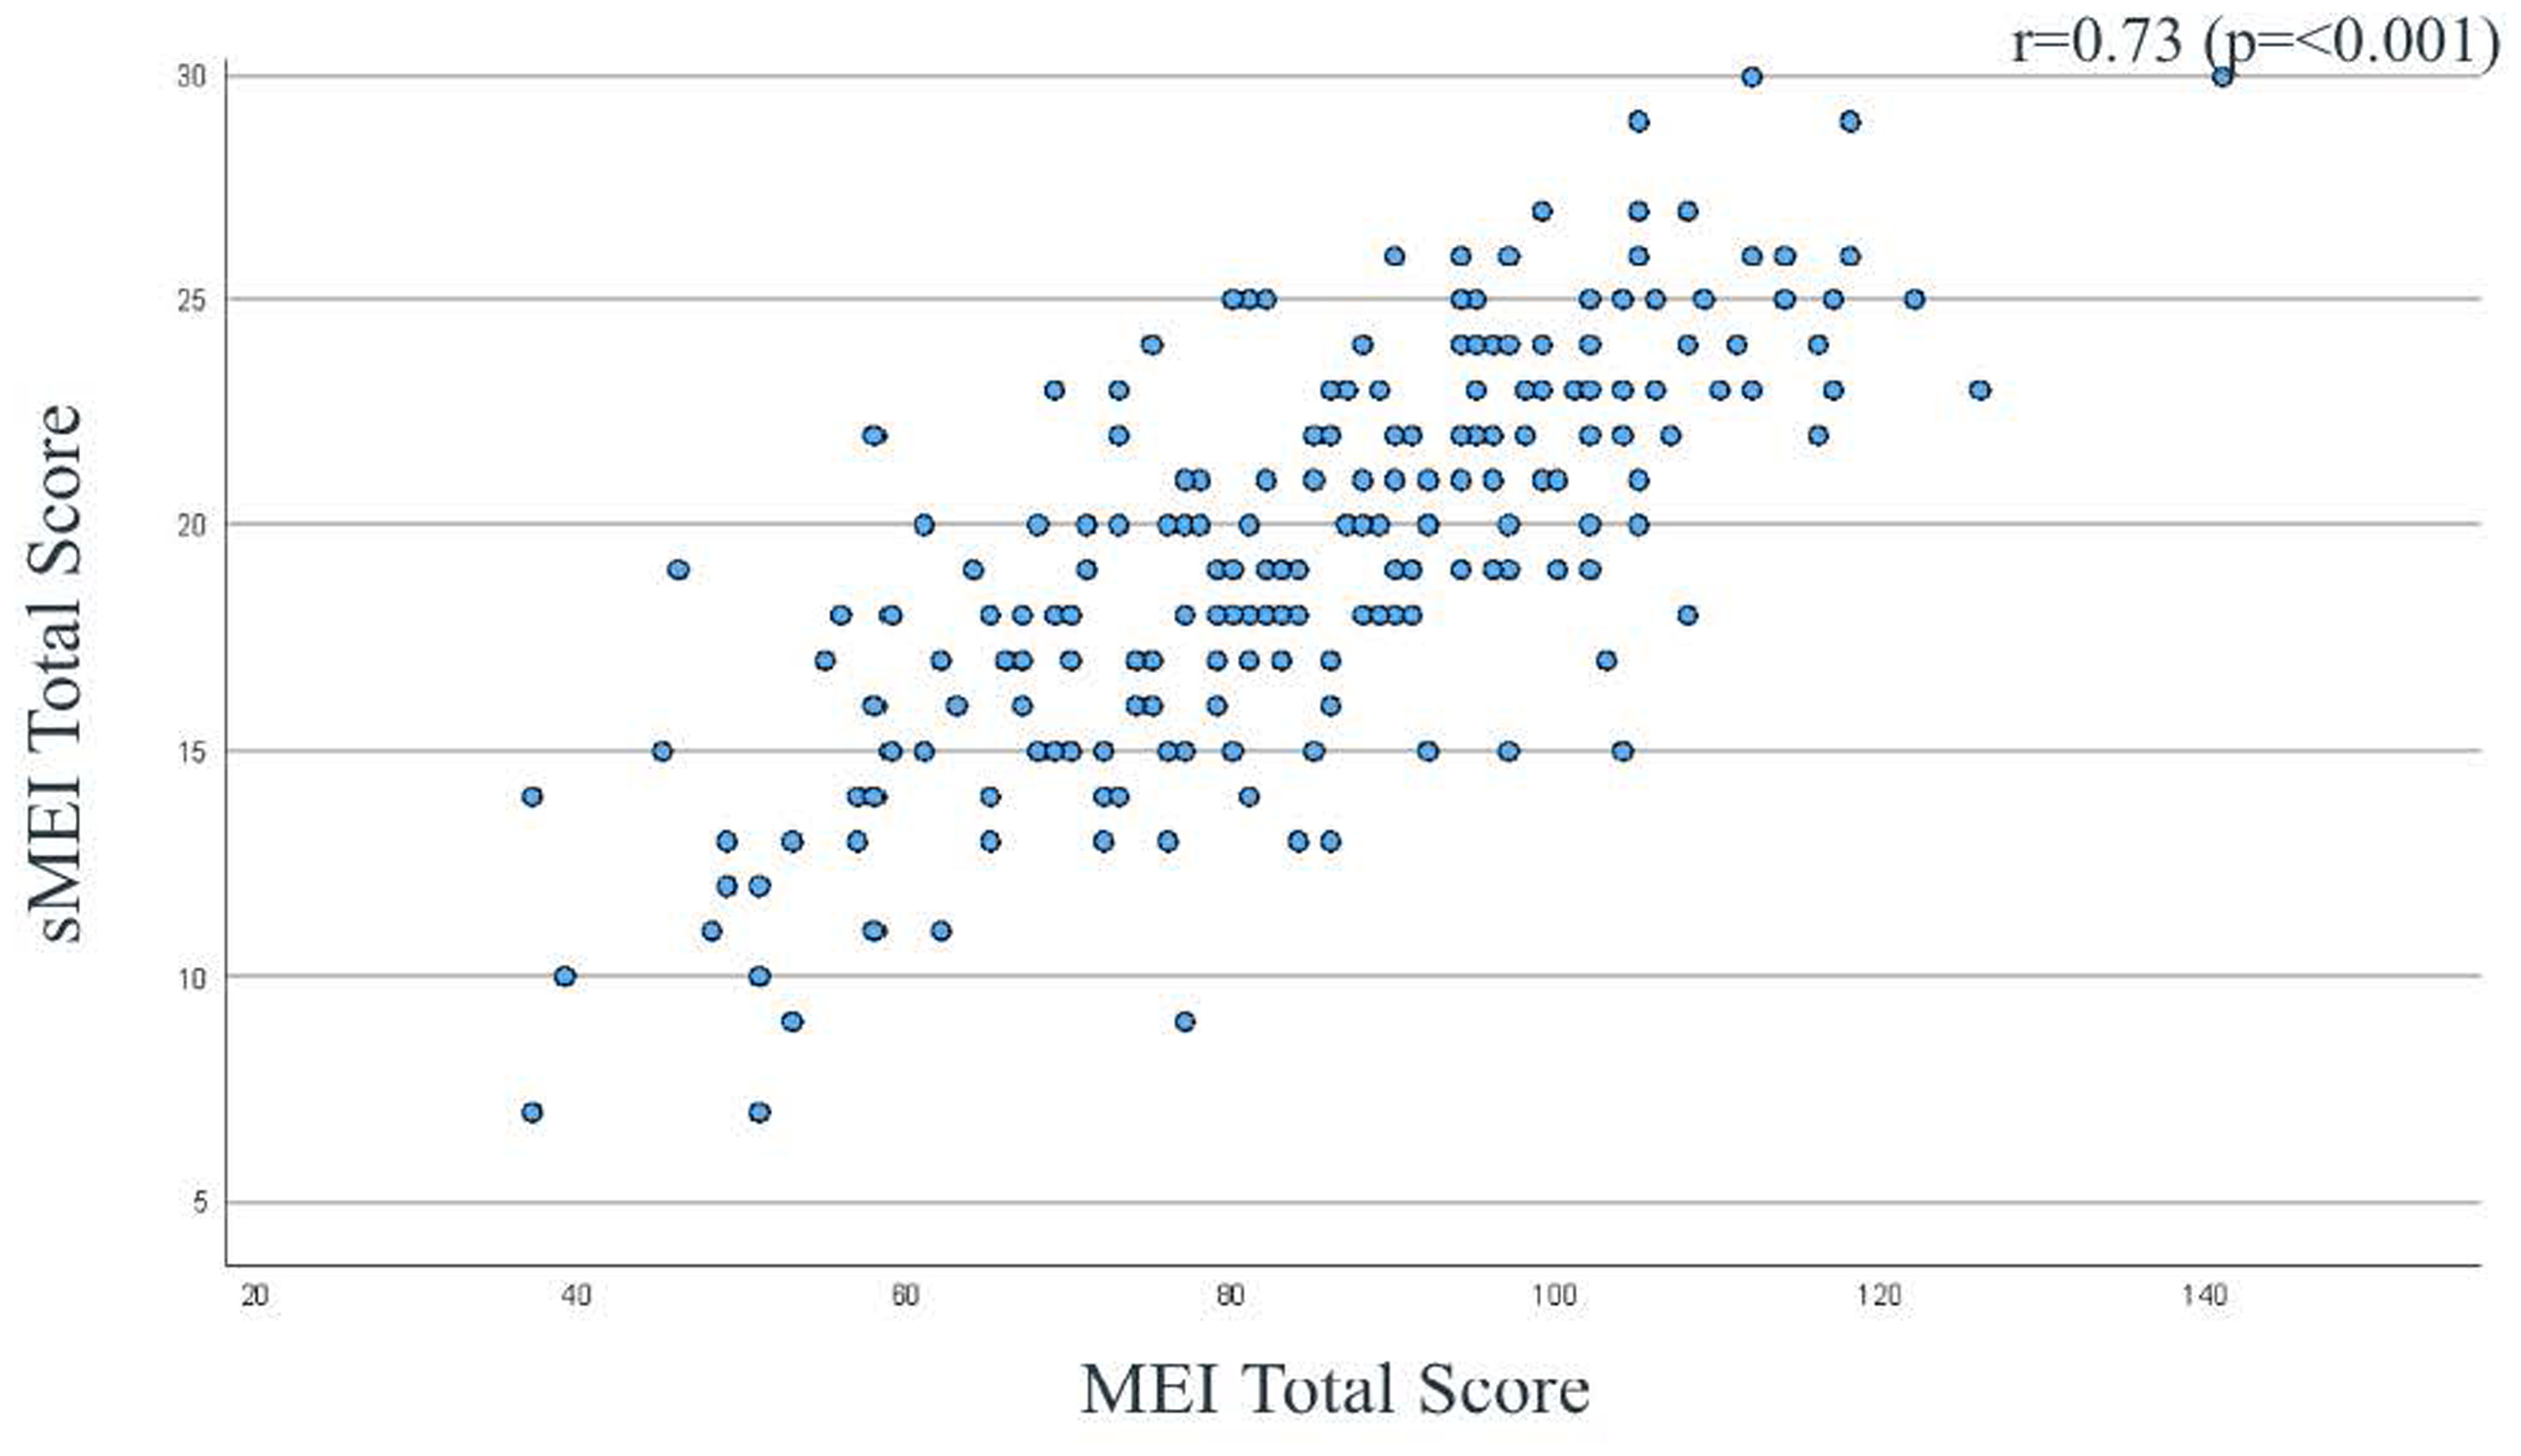
Plot and spearman correlation coefficient of the Mindful Eating Inventory (MEI) total score and Shortened Mindful Eating Inventory (sMEI) total score.
Spearman's correlation coefficient between total score of Mindful Eating Inventory (MEI) and shortened Mindful Eating Inventory (sMEI), stratified by participant characteristic (n = 224).
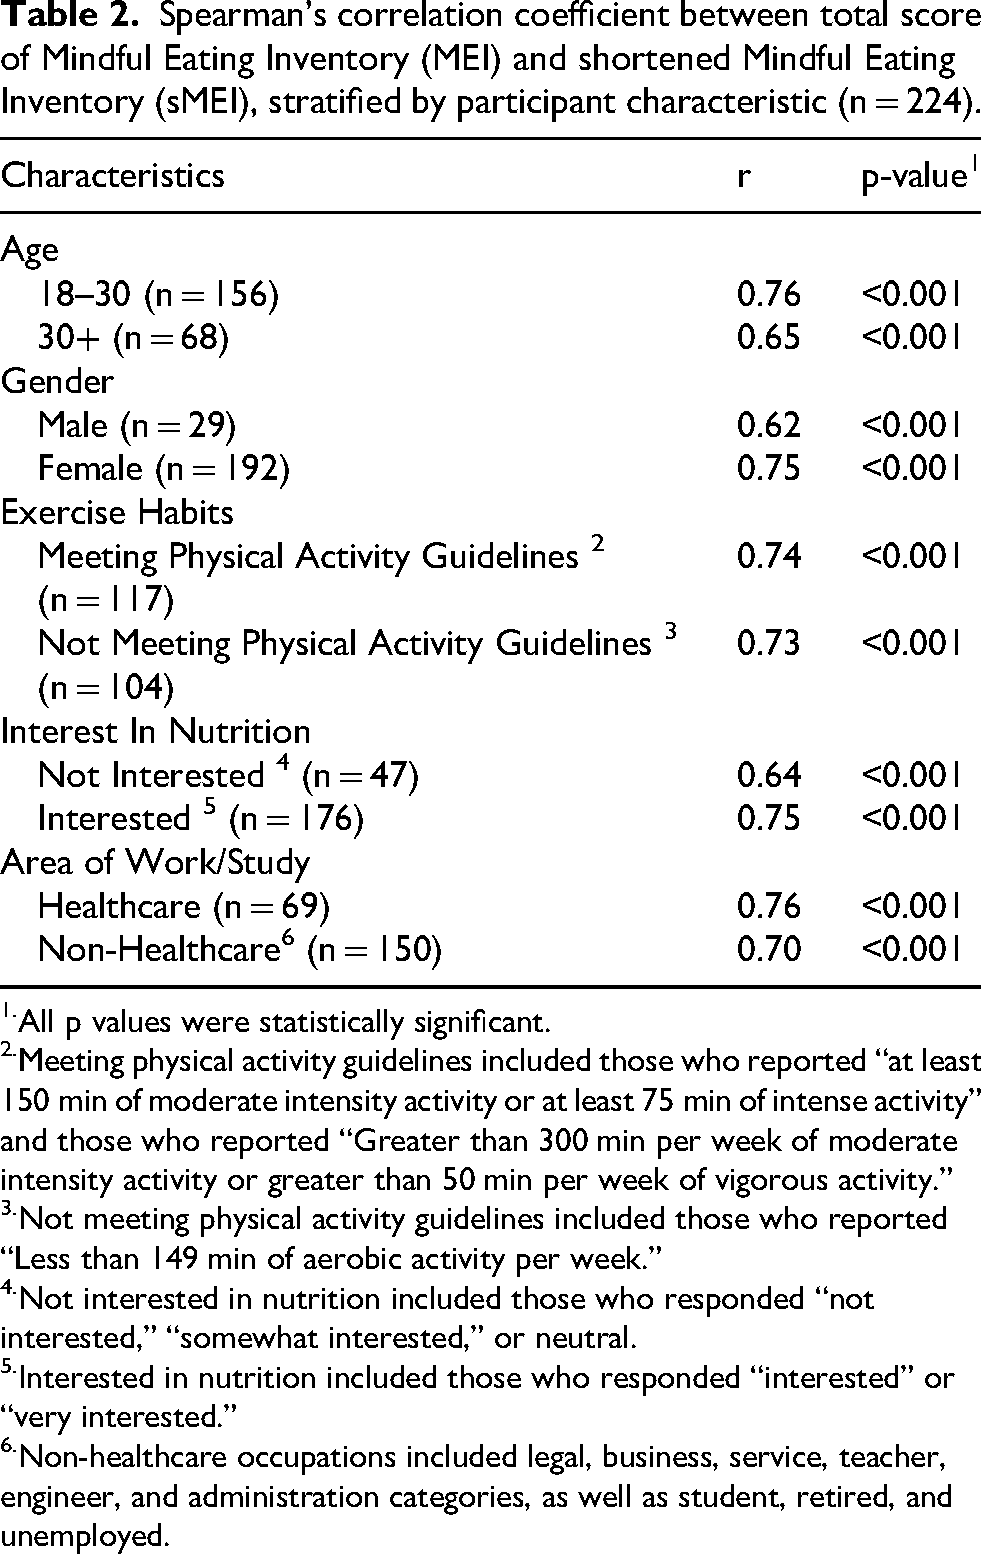
All p values were statistically significant.
Meeting physical activity guidelines included those who reported “at least 150 min of moderate intensity activity or at least 75 min of intense activity” and those who reported “Greater than 300 min per week of moderate intensity activity or greater than 50 min per week of vigorous activity.”
Not meeting physical activity guidelines included those who reported “Less than 149 min of aerobic activity per week.”
Not interested in nutrition included those who responded “not interested,” “somewhat interested,” or neutral.
Interested in nutrition included those who responded “interested” or “very interested.”
Non-healthcare occupations included legal, business, service, teacher, engineer, and administration categories, as well as student, retired, and unemployed.
Test-retest reliability in terms of exact agreement ranged from 36.2% (NRS question in the MEI and sMEI) to 44.2% (ERF question) (Table 3). However, exact and partial (+/-1 category) agreement was over 80% for 5 items (ANA, ATM, ERF, FAE, NRS), and around 75% for 2 items (CON, ASE). Spearman correlations between sMEI and MEI items were moderate. The highest was for the ANA item (r = 0.69) and the ERF item (r = 0.61). The lowest correlation was for the ASE item (r = 0.37); for the other items the correlations were in the 0.42 to 0.49 range.
One-month test-retest reliability of the Shortened Mindful Eating Inventory (sMEI) items versus the same questions on the Mindful Eating Inventory (MEI).
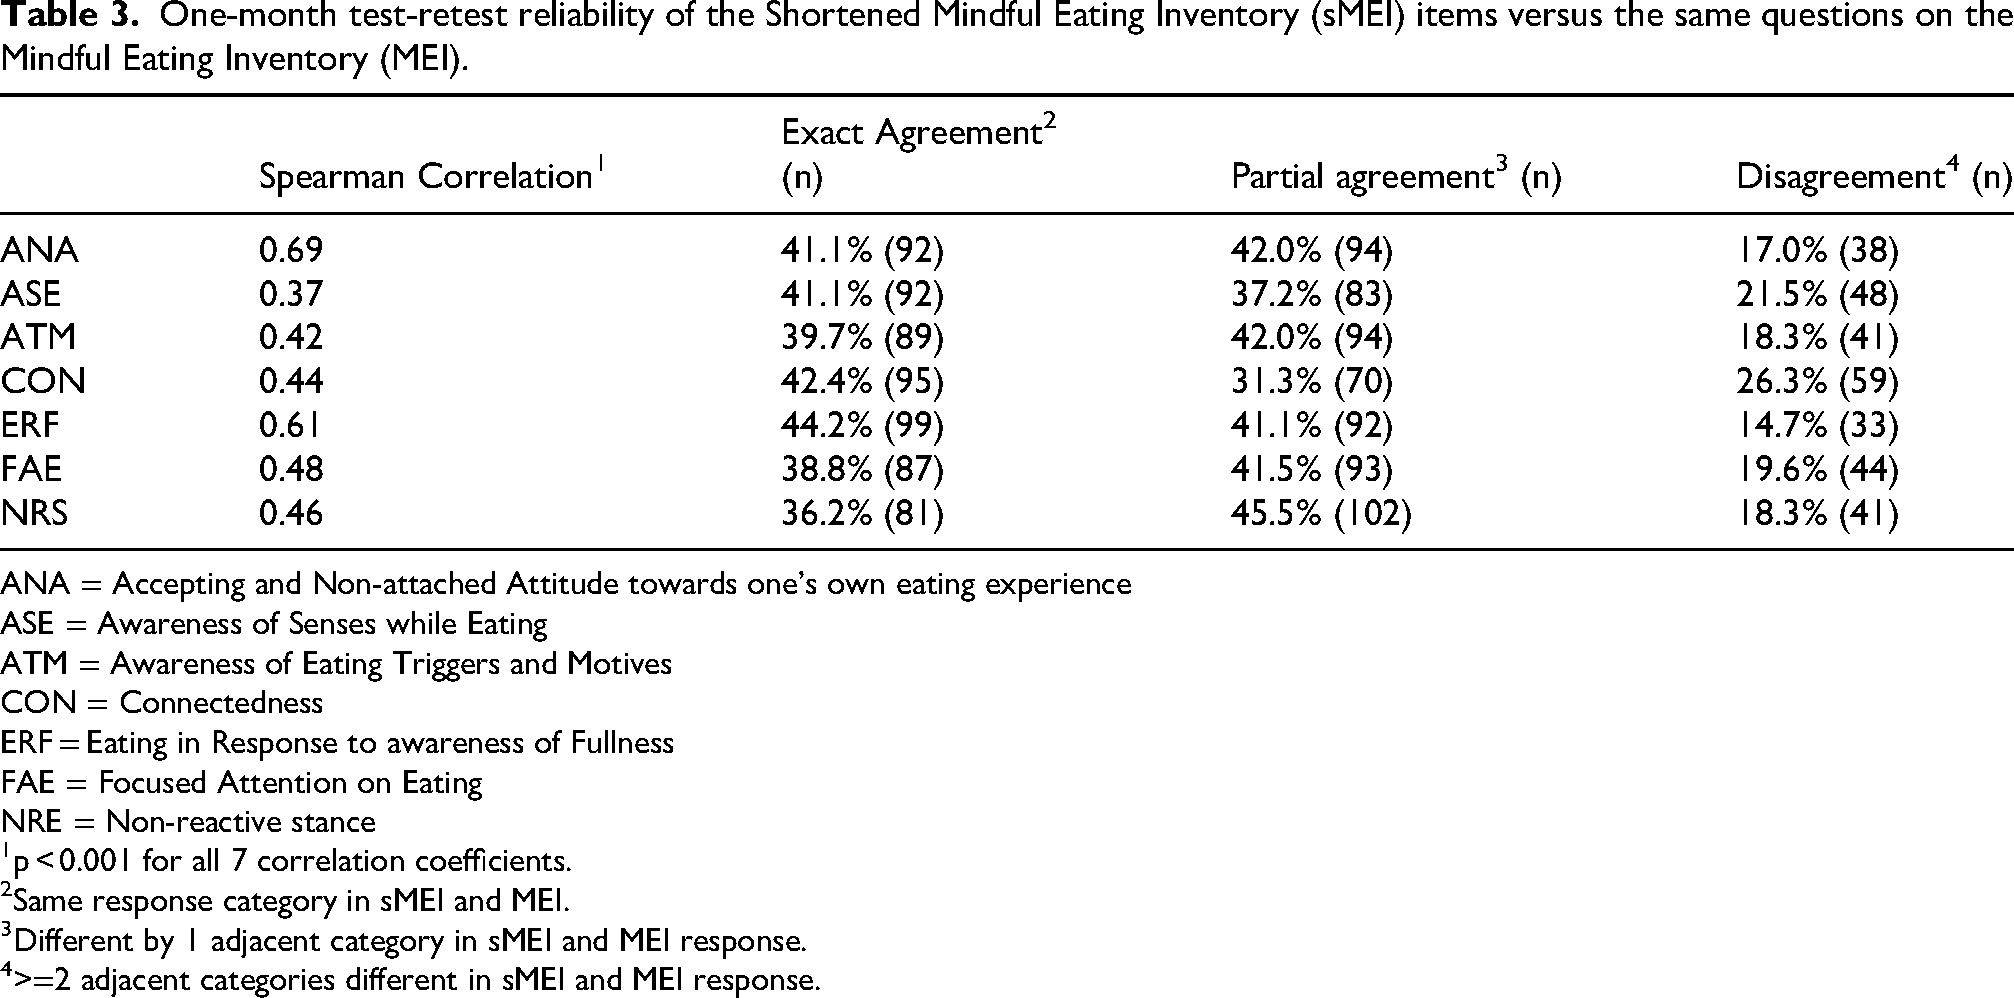
ANA = Accepting and Non-attached Attitude towards one's own eating experience
ASE = Awareness of Senses while Eating
ATM = Awareness of Eating Triggers and Motives
CON = Connectedness
ERF = Eating in Response to awareness of Fullness
FAE = Focused Attention on Eating
NRE = Non-reactive stance
p < 0.001 for all 7 correlation coefficients.
Same response category in sMEI and MEI.
Different by 1 adjacent category in sMEI and MEI response.
>=2 adjacent categories different in sMEI and MEI response.
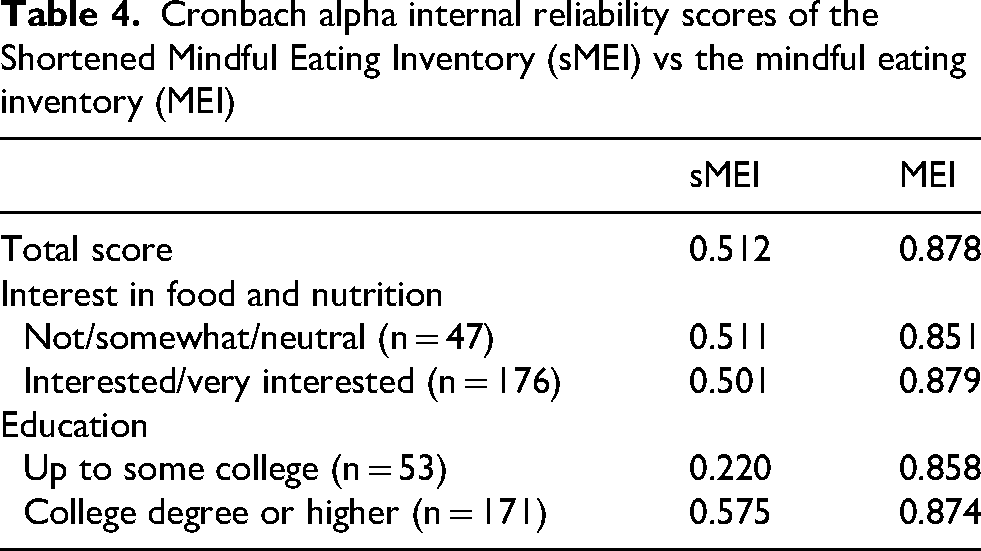
The within scale, or internal, reliability was very high for the MEI (Cronbach's alpha = 0.878), and high but more modest for the sMEI (Cronbach's alpha = 0.512) (Table 4). Internal reliability did not vary substantially by interest in food and nutrition for either scale. The internal reliability of the MEI did not vary by education level. However, the internal reliability of the sMEI was much lower for those with less education (alpha = 0.220 for those with education up to some college versus 0.575 those with bachelor's or higher group).
Cronbach alpha internal reliability scores of the Shortened Mindful Eating Inventory (sMEI) vs the mindful eating inventory (MEI)
Exploratory factor analysis showed the MEI items clustered into the same factors and the same items loaded on each factor (Table 5) as in the original development study (see Measures in the Methods section). For the ANA and CON subscales, the corresponding sMEI items achieved concordance with Peitz (Peitz et al, 2021) as the highest loading items in those subscales. In the ATM and ASE subscales, the corresponding sMEI items had the second highest loading rankings in those subscale. For the remaining subscales (ERF, NRS, FAE), their corresponding sMEI items ranked third.
Factor loadings for the Mindful Eating Inventory (MEI) and loading ranking for the Shortened Mindful Eating Inventory (sMEI) items
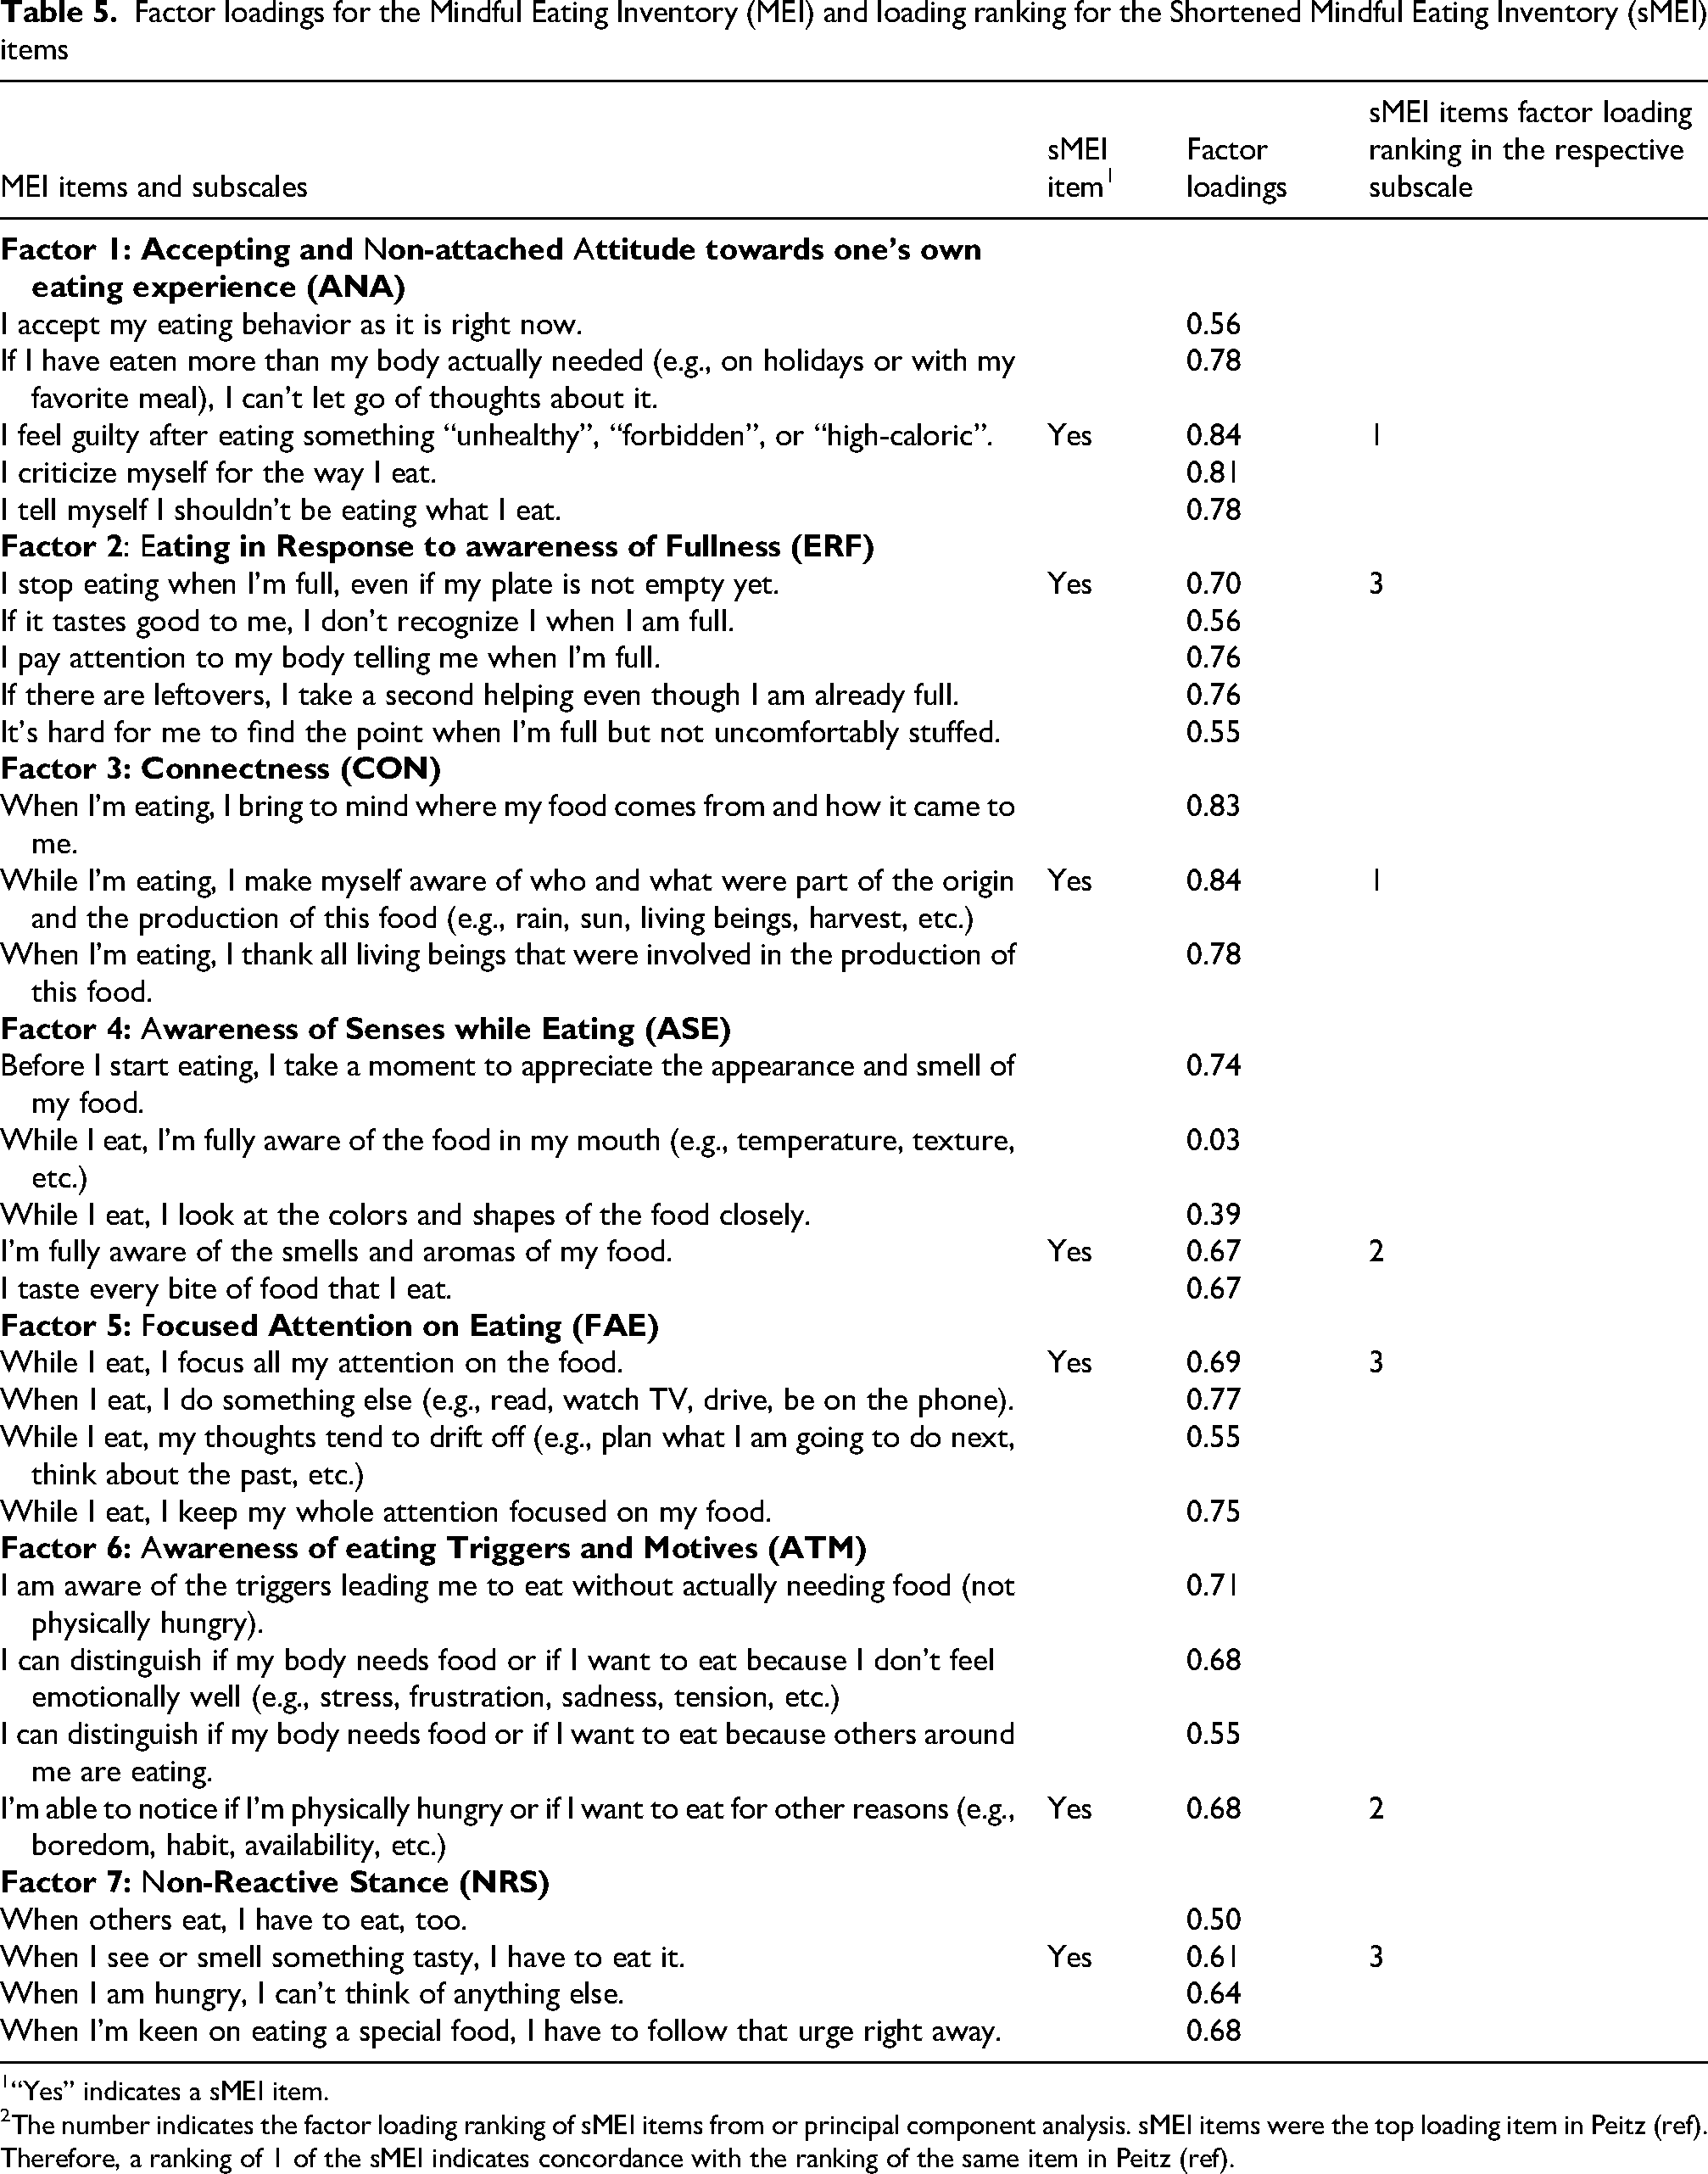
“Yes” indicates a sMEI item.
The number indicates the factor loading ranking of sMEI items from or principal component analysis. sMEI items were the top loading item in Peitz (ref). Therefore, a ranking of 1 of the sMEI indicates concordance with the ranking of the same item in Peitz (ref).
Discussion
In this study, we found the sMEI measured mindful eating similarly to the MEI. Results of the study showed a moderate to strong correlation between the original and shortened inventory, and these correlations remained strong among demographic subgroups. Mean sMEI scores varied by participant characteristics in similar ways as mean MEI scores. A caveat to this finding is that our sample had low power to detect differences in some subgroups, such as gender, age, and race.
Our test-retest analysis, comparing the responses on the sMEI survey to the same items on the MEI survey one month later, found good agreement (within 1 category of the Likert scales) among 80% of participants. Our study also produced additional information about the 30-item MEI. Our exploratory factor analysis found the same items forming the same 7 domains of mindful eating as the original German validation sample. (Peitz et al., 2021).
These findings lend credence to creating a shorter instrument by selecting one item from each MEI domain. However, our study findings also provide insight into the limitations of this approach. The internal consistency of the sMEI items was low, especially compared to the MEI. This is somewhat expected, since the sMEI has far fewer items, and those items were specifically chosen to represent different domains of mindful eating. A risk of choosing one item per dimension is if that item is poorly understood or less relevant to those completing the inventory, results could be inaccurate. In our sample, the sMEI had very poor internal consistency among people with less education.
Short dietary questionnaires are less time consuming and more feasible to use. Yaroch et al. conducted a validation and reliability study examining three shortened surveys on fruit and vegetable intake and showed that the shortened surveys were more cost efficient and less burdensome on both the clinician and patient compared to the longer survey. At the same time, a shortened survey allowed for an easier way to obtain gross estimates to rank individuals (Yaroch et al., 2012). Additionally, Cook et al. compared single questions and a brief 5-item questionnaire with a longer validated food frequency questionnaire to assess fruit and vegetable intake (Cook et al., 2015). Findings showed the shorter versions were suitable replacements for the longer FFQ in detecting inadequate intake and assessing population mean intake. Based on these studies findings, well designed shortened surveys have the ability to measure fruit and vegetable intake similar to the long surveys. These findings are consistent with our study findings and demonstrated that shortened tools are well suited to use within the constraints of practice settings to obtain diet related data.
To our knowledge, the 7-item sMEI developed in this study is the shortest available, but other abbreviated MEIs have been developed including a 20-item questionnaire (Clementi et al., 2017). Although this tool was shortened from the original 28-item Mindful Eating Questionnaire, the length may still be challenging to use in both clinical and research settings which other health data also needed to be collected. Therefore, our 7-item sMEI could further reduce burden and time constraints and increase feasibility to use. While the shortened MEI tool by Clementi (Clementi et al., 2017) had higher internal consistency (Cronbach's alpha 0.75–0.83) than ours, their longer questionnaire could contribute to this difference. While we reduced the number of questions, none of the original 7 domains of mindful eating was eliminated, therefore the sMEI remained comprehensive in assessing different aspects of mindful eating. However, a truncated questionnaire will not capture in detailed information that specific clinical and research settings would need (for example, to track treatment outcomes over time). Moreover, the most relevant question item in each subscale might be different among different populations. Cronbach's alpha did indicate good internal reliability with our sample. And when compared the Peitz questionnaire that was developed with a German participants, concordance of the factor loading rankings of the sMEI items was good (Peitz et al., 2021) as well although some difference was note. This could in part due to cultural difference in interpreting the questions. Nevertheless the choice of a mindful eating assessment tools should be carefully considered to for circumstance and needs of each setting.
A strength of this study was the sample size which is large for validation studies. Our sample was varied in lifestyle characteristics and this allowed us to validate the sMEI among these subgroups for use in a broad spectrum of the general population. However, we used convenience sampling that limited to health and technology workplaces as well as social media to recruit participants. This may result in some level of sampling bias and may only capture a specific segment of the general adult population. In particular, our study was limited in the range of age, gender, and ethnicity of the participants, as the majority was young, white, and female. Therefore, the results of the study may not be generalizable beyond individuals of those demographic characteristics. Our results did demonstrate that the sMEI was a reasonable in assessing mindful eating in this segment of the population. Additional validation studies in more diverse populations, in particular males, older adults, and different racial/ethnic groups are needed to better understand the performance of the sMEI. This promising instrument could be used like a screening tool in clinical settings, followed by the longer MEI instrument as needed. It could be used in panel survey research, where surveys must be brief to ensure good response; such data could be used for descriptive analyses of the prevalence and correlates of aspects of mindful eating, but not for causal analysis.
Conclusion
The 7-item sMEI showed acceptable internal validity, good correlation with MEI, and sMEI items were among the top three loading items in their respective subscales in our sample of mainly white female adults younger than age 30. Therefore, the sMEI may be a reasonable alternative when a longer mindful eating measurement tool is not feasible.
Supplemental Material
sj-docx-1-nah-10.1177_02601060251413113 - Supplemental material for Development and validation of a shortened mindful eating inventory in U.S. Adults
Supplemental material, sj-docx-1-nah-10.1177_02601060251413113 for Development and validation of a shortened mindful eating inventory in U.S. Adults by Julie Gallotto, Casey Thomas, Eugenie Coakley and Teresa T. Fung in Nutrition and Health
Footnotes
Acknowledgement
We thank Dr Frank Hu of the Harvard T.H. Chan School of Public Health for providing ideas on shortening the Mindful Eating Inventory.
Authors contributions
TF, JG, and CT designed the study and drafted the manuscript. JG and CT collected data. JG, CT, and EC conducted statistical analysis. All authors interpreted study results, edited, and approved the manuscript. All authors agreed to be accountable for all aspects of the work and resolved any issues related to its accuracy or integrity.
Ethics
This study was approved by the Simmons University Institutional Review Board in January 2024
Informed consent was obtained from each participant.
Consent for publication
Not applicable
Funding
The authors received no financial support for the research, authorship, and/or publication of this article.
Declaration of conflicting interests
The authors declared no potential conflicts of interest with respect to the research, authorship, and/or publication of this article.
Data availability
The participant of this study did not provide written consent for their data to be shared publicly, therefore data supporting this research is not available.
Supplemental material
Supplemental material for this article is available online.
References
Supplementary Material
Please find the following supplemental material available below.
For Open Access articles published under a Creative Commons License, all supplemental material carries the same license as the article it is associated with.
For non-Open Access articles published, all supplemental material carries a non-exclusive license, and permission requests for re-use of supplemental material or any part of supplemental material shall be sent directly to the copyright owner as specified in the copyright notice associated with the article.