
Abstract
Background
In older inpatients, a higher malnutrition risk (MR) at the time of post-acute hospital admission has been associated with increased intramuscular adipose tissue (IMAT) of the quadriceps. However, it remains unclear whether changes in MR during hospitalization are related to changes in IMAT in this population.
Aim
This study was to examine the longitudinal association of MR with IMAT of the quadriceps in older inpatients.
Methods
One hundred ninety-six older inpatients (aged ≥ 65 years) participated in this longitudinal study. The Geriatric Nutritional Risk Index (GNRI) score was used to evaluate MR. IMAT of the quadriceps was assessed based on echo intensity (EI). The changes in GNRI score and quadriceps EI were calculated by subtracting these baseline values from the values at discharge. Multiple linear regression analysis, adjusted for confounding factors, was used to determine whether the change in GNRI score was significantly related to the change in quadriceps EI.
Results
The means of the changes in quadriceps EI and GNRI score were −2.5 ± 15.4 (a.u.) and −0.4 ± 6.0, respectively. The change in GNRI score (β = −0.16, p = 0.015) was significantly and independently associated with the change in quadriceps EI.
Conclusion
The results of this study indicate that an increase in MR in older inpatients is related to an increase in IMAT of the quadriceps, and an improvement in MR is associated with a decrease in IMAT of the quadriceps.
Introduction
Aging has been reported to be related to a loss of muscle mass and an increase in intramuscular adipose tissue (IMAT) (i.e. fat infiltration within muscle fibers) (Akazawa et al., 2021a), and the European Working Group on Sarcopenia in Older People 2 has emphasized that assessing muscle quality, such as myosteatosis, which includes IMAT, as well as muscle mass, is important (Cruz-Jentoft et al., 2019). Additionally, it has been suggested that appendicular lean mass measured by dual-energy X-ray absorptiometry is not a strong predictor of prognosis in older adults (Bhasin et al., 2020). Recent studies reported that IMAT of the quadriceps in older inpatients is more strongly associated with gait independence (Akazawa et al., 2023), swallowing ability (Akazawa et al., 2022a), activities of daily living (ADL) (Akazawa et al., 2021b), and hospital-associated complications (Nagae et al., 2021) than with muscle mass. Furthermore, an increase in IMAT has been reported to be related to metabolic dysfunction, inflammation, and reduced muscle contractility (Addison et al., 2014a; Frank-Wilson et al., 2018; Goodpaster et al., 2001). These findings highlight the need to recognize the increase in IMAT as a serious concern in older individuals.
Recent studies (Englund et al., 2017; Honaga et al., 2022; Kitajima et al., 2018; Peng et al., 2021) have reported associations between IMAT and nutritional status. A decrease in IMAT of the lumbar muscles in liver cirrhosis patients was confirmed in those whose nutritional status improved following supplementation of essential amino acids (Kitajima et al., 2018). Nutritional interventions using whey protein and vitamin D or β-hydroxy-β-methylbutyrate have been shown to reduce IMAT in the thigh muscles among community-dwelling frail older adults and patients with stroke (Englund et al., 2017; Honaga et al., 2022; Peng et al., 2021). These interventions may reduce IMAT by promoting anabolic signaling, inhibiting muscle protein breakdown, and attenuating inflammation, thereby improving muscle remodeling and limiting fat infiltration (Nissen et al., 1996; Prado et al., 2022; Rathmacher et al., 2025; Rittig et al., 2017).
In older inpatients, including those with stroke, fracture, pneumonia, and others, a higher malnutrition risk (MR) at the time of subacute and convalescent rehabilitation hospital admission has been associated with increased IMAT of the quadriceps (Akazawa et al., 2022b). However, it remains unclear whether changes in MR during hospitalization are associated with changes in IMAT of the quadriceps in this population. Previous studies have reported that a considerable proportion of older inpatients are at risk of malnutrition (Inoue et al., 2019; Nishioka et al., 2017) and that MR is associated with declines in ADL (Kokura et al., 2016). Furthermore, it has been reported that the nutritional status of older inpatients worsens during hospital stay (Bellanti et al., 2022). Given these findings, investigating the association between changes in MR and changes in IMAT of the quadriceps is warranted. Therefore, this study aimed to examine the longitudinal relationship between MR and IMAT of the quadriceps in older inpatients.
Materials and methods
Participants and study design
Older patients referred to the Department of Rehabilitation at Kasei Tamura Hospital between 1 January 2017 and 31 March 2020 participated in this longitudinal study. This study employed convenience sampling. Patients aged < 65 years or those who died during a hospital stay, who underwent thigh amputation, and who had a lack of data were excluded from the study. We initially enrolled a total of 240 patients; of these, 34 patients younger than 65 years of age and 10 patients with insufficient data (i.e. missing tracking ultrasound data) were excluded. Ultimately, this study included 196 patients. All participants received rehabilitation therapy, including physical therapy, occupational therapy, and speech and swallowing therapy, during their hospital stay. Each participant received nutrition management (i.e. adjustments to nutritional intake) tailored to their disease condition and changes in rehabilitation therapy load. This study was approved by the ethics committee of Tokushima Bunri University and was conducted in accordance with the principles of the Declaration of Helsinki. All participants or their guardians provided written informed consent prior to the study.
Outcome measures
The primary outcomes were a change in MR and a change in IMAT of the quadriceps. We measured the characteristics of the participants at admission including, age, sex, disease, MR, IMAT and muscle mass of the quadriceps, subcutaneous fat mass in the thigh, body weight (BW), height, body mass index, swallowing ability, comorbidities, inflammatory status, nutritional (protein and energy) intake, number of medications, serum albumin, number of units of rehabilitation therapy (1 unit of rehabilitation therapy = 20 min), and ADL. MR, IMAT and muscle mass of the quadriceps, BW, nutritional intake (protein and energy), serum albumin level, number of rehabilitation therapy units, and ADL were assessed at both admission and discharge. The length of hospital stay (days) and the number of days from the onset of the disease were determined at discharge. The hospitalization period at Kasei Tamura hospital was used to evaluate the length of the hospital stay. The majority of older inpatients at our hospital had been transferred from other acute-phase hospitals. For these patients, the total length of stay, combining the duration at both the acute-phase hospital and our hospital, was used to calculate the number of days since disease onset.
MR assessment
We used the Geriatric Nutritional Risk Index (GNRI) score (Bouillanne et al., 2005) to assess the MR. The GNRI score was calculated using the following formula: GNRI = (14.89 × serum albumin [g/dL]) + (41.7 × actual BW [kg]/ideal BW [kg]). A body mass index of 22.0 kg/m2 was defined as the ideal BW (Yamada et al., 2008). If the ratio of actual BW to ideal BW was ≥ 1.0, it was recorded as 1 (Bouillanne et al., 2005). The change in the GNRI score was calculated by subtracting the baseline value from the discharge value. A GNRI score of 98 or lower is classified as at risk of malnutrition (Bouillanne et al., 2005).
Measurements of the IMAT and muscle mass of the quadriceps A B-mode ultrasound system (NanoMaxx; SonoSite Japan, Tokyo, Japan) with a linear array probe (L25n/13–6 MHz; NanoMaxx; SonoSite Japan) was used to capture transverse ultrasound images. IMAT and muscle mass of the rectus femoris and vastus intermedius were assessed based on echo intensity (EI) and muscle thickness (MT) (Akazawa et al., 2021a, 2021b, 2022a, 2022b, 2023). The validity of ultrasound measurements for IMAT and muscle mass has been demonstrated in previous studies using magnetic resonance imaging (MRI) (Akima et al., 2016; Miyatani et al., 2004). The probe width used in this study was too narrow to capture the left and right ends of the rectus femoris, making it impossible to calculate the cross-sectional area. Therefore, we used MT to assess muscle mass in this study.
Ultrasound images of the rectus femoris and vastus intermedius were obtained at 30% of the distance from the anterior superior iliac spine to the proximal border of the patella. Participants were positioned supine with their lower limbs fully relaxed (Akazawa et al., 2021a, 2021b, 2022a, 2022b, 2023). A water-soluble transmission gel was applied to the anterior thigh, and the probe was placed lightly on the skin to minimize muscle deformation. The same experienced investigator acquired all ultrasound images. EI was measured within regions of interest that encompassed as much muscle tissue as possible while carefully excluding bone and surrounding fascia (Akazawa et al., 2021a, 2021b, 2022a, 2022b, 2023). To ensure consistency, the gain settings were kept constant using the default system parameters, and the imaging depth was standardized at 60 mm for all measurements (Akazawa et al., 2021a, 2021b, 2022a, 2022b, 2023). MT of the rectus femoris was defined as the distance between the superficial adipose tissue–muscle interface and the deep muscle–muscle interface (Akazawa et al., 2021a, 2021b, 2022a, 2022b, 2023). For the vastus intermedius, MT was defined as the distance between the superficial muscle–muscle interface and the bone–muscle interface (Akazawa et al., 2021a, 2021b, 2022a, 2022b, 2023).
EI and MT were analyzed using ImageJ (version 1.49, National Institutes of Health, Bethesda, MD, USA). EI was quantified using an 8-bit grayscale analysis, with mean values ranging from 0 (black) to 255 (white). Higher EI values indicated greater IMAT (Pillen et al., 2006). Subcutaneous fat mass in the thigh was assessed using subcutaneous fat thickness (SFT) (Akazawa et al., 2021a, 2021b, 2022a, 2022b, 2023). The blinded assessors analyzed ultrasound images.
The mean EI values of the rectus femoris and vastus intermedius were used to represent quadriceps EI in this study. For analysis, we used the average EI values of the right and left quadriceps. Quadriceps thickness was defined as the sum of the thicknesses of the rectus femoris and vastus intermedius, and the mean thicknesses of the right and left quadriceps were used for analysis. Changes in quadriceps EI and thickness were calculated by subtracting baseline values from those measured at discharge. The mean SFT of the right and left thighs was used for analysis.
Other characteristic measurements
The Food Intake Level Scale (Kunieda et al., 2013), a 10-point observer-rated scale, was used to evaluate swallowing ability, with higher scores indicating better swallowing ability. Inflammatory status was assessed using the C-reactive protein level. Comorbidities were evaluated using the updated Charlson Comorbidity Index score (Quan et al., 2011). Protein and energy intakes were estimated by nurses or dietitians based on a visual assessment of the proportion of the meal consumed by each patient. Protein intake (g/kg/day) and energy intake (kcal/kg/day) were calculated based on data from the first week after admission and the final week before discharge, using the actual BW. ADL was assessed using the Barthel Index (BI) (Mahoney and Barthel, 1965), an ordinal scale ranging from 0 to 100 points, with lower scores indicating greater dependence in ADL.
Statistical analysis
SPSS version 28 software (IBM SPSS Japan, Tokyo, Japan) was used for all statistical analyses. The normality of the variables was assessed using the Shapiro-Wilk test. Parametric and nonparametric data were presented as mean ± standard deviation and median (interquartile range [IQR]), respectively. Nominal data were expressed as numbers and percentages.
Paired t-test was used for comparing the quadriceps EI and thickness, GNRI score, and serum albumin at admission and discharge. The BI score, BW, number of units of rehabilitation therapy, protein intake, and energy intake at admission and discharge were compared using the Wilcoxon signed-rank test.
Multiple linear regression analysis (forced entry method) was used to determine whether the change in GNRI score was independently and significantly related to the change in quadriceps EI or thickness. For the change in quadriceps EI, the independent variables were age, sex (male = 1 and female = 0), length of the hospital stay, disease (stroke, fracture, pneumonia, and others: reference = stroke), change in GNRI score, and GNRI score, BI score, quadriceps EI, and SFT of the thigh at admission. The SFT affects EI (Ryan et al., 2016). Therefore, the SFT of the thigh was treated as a covariate. For the change in quadriceps thickness, the independent variables were age, sex (male = 1 and female = 0), length of the hospital stay, disease (stroke, fracture, pneumonia, and others: reference = stroke), change in GNRI score, and GNRI score, BI score, and quadriceps thickness at admission. If the variance inflation factor was more than 10, then multicollinearity was considered. A p-value of < 0.05 was considered to indicate statistical significance. In addition, the effect size (f2) of the multiple regression analysis was calculated by the following equation: R2/(1−R2). The statistical power of the multiple linear regression analysis was calculated based on f2, an alpha error of 0.05, the total sample size, and the number of predictor variables. G* Power version 3.1.9.2 (Heinrich-Heine-Universität Düsseldorf, Düsseldorf, Germany) was used for statistical power calculation. In addition, to determine the influence of change in physical activity (i.e. changes in BI score and number of rehabilitation therapy units) on changes in BW and quadriceps EI and thickness, we used partial correlation analysis. Changes in the BI score and number of rehabilitation therapy units were calculated by subtracting the baseline value from the discharge value. Quadriceps EI and thickness, BW, BI score, and number of rehabilitation therapy units at admission were used as control variables in partial correlation analysis. In the analysis of the relationship between changes in physical activity and changes in quadriceps EI, SFT at admission was also used as a control variable.
Sample size calculation
A recent study (Akazawa et al., 2022b) reported that the effect size (f2) of the multiple linear regression analysis for change in quadriceps EI was 0.721. In that analysis, the GNRI score at admission and three additional variables were independently and significantly associated with the change in quadriceps EI among older inpatients. Based on the expectation of a similar effect size in our study, we conducted an a priori sample size calculation using an effect size (f2) of 0.721, a power of 0.95, an alpha error of 0.05, and 15 predictors. The calculation indicated that a minimum of 53 participants would be required. We used G*Power version 3.1.9.2 to perform this analysis.
Results
The means of the changes in quadriceps EI and thickness and GNRI score were −2.5 ± 15.4 (a.u.), 0.1 ± 0.4 (cm), and −0.4 ± 6.0, respectively. The number of patients whose GNRI score remained stable or improved and those whose GNRI score worsened during hospitalisation were 101 (51.5%) and 95 (48.5%), respectively. The medians (IQR) of the days from the onset of disease and length of hospital stay were 88.5 (62.3–118.5) days and 70.5 (48.0–97.8) days, respectively.
Table 1 shows the characteristics of the participants at admission. The median (IQR) of the age was 83.0 (77.0–88.0) years. A total of 166 out of 196 patients (84.7%) were classified as at risk of malnutrition (i.e. GNRI score of 98 or lower). The results of comparative analysis for the quadriceps EI and thickness, GNRI score, serum albumin, BI score, BW, number of units of rehabilitation therapy, and protein and energy intakes at admission and discharge are shown in Table 2. Quadriceps EI and BW at discharge were significantly lower than at admission. Quadriceps thickness, BI score, number of units of rehabilitation therapy, and protein and energy intakes at discharge were significantly higher than at admission. There were no significant differences between admission and discharge in GNRI scores and serum albumin.
Characteristics of participants at hospital admission (n = 196).
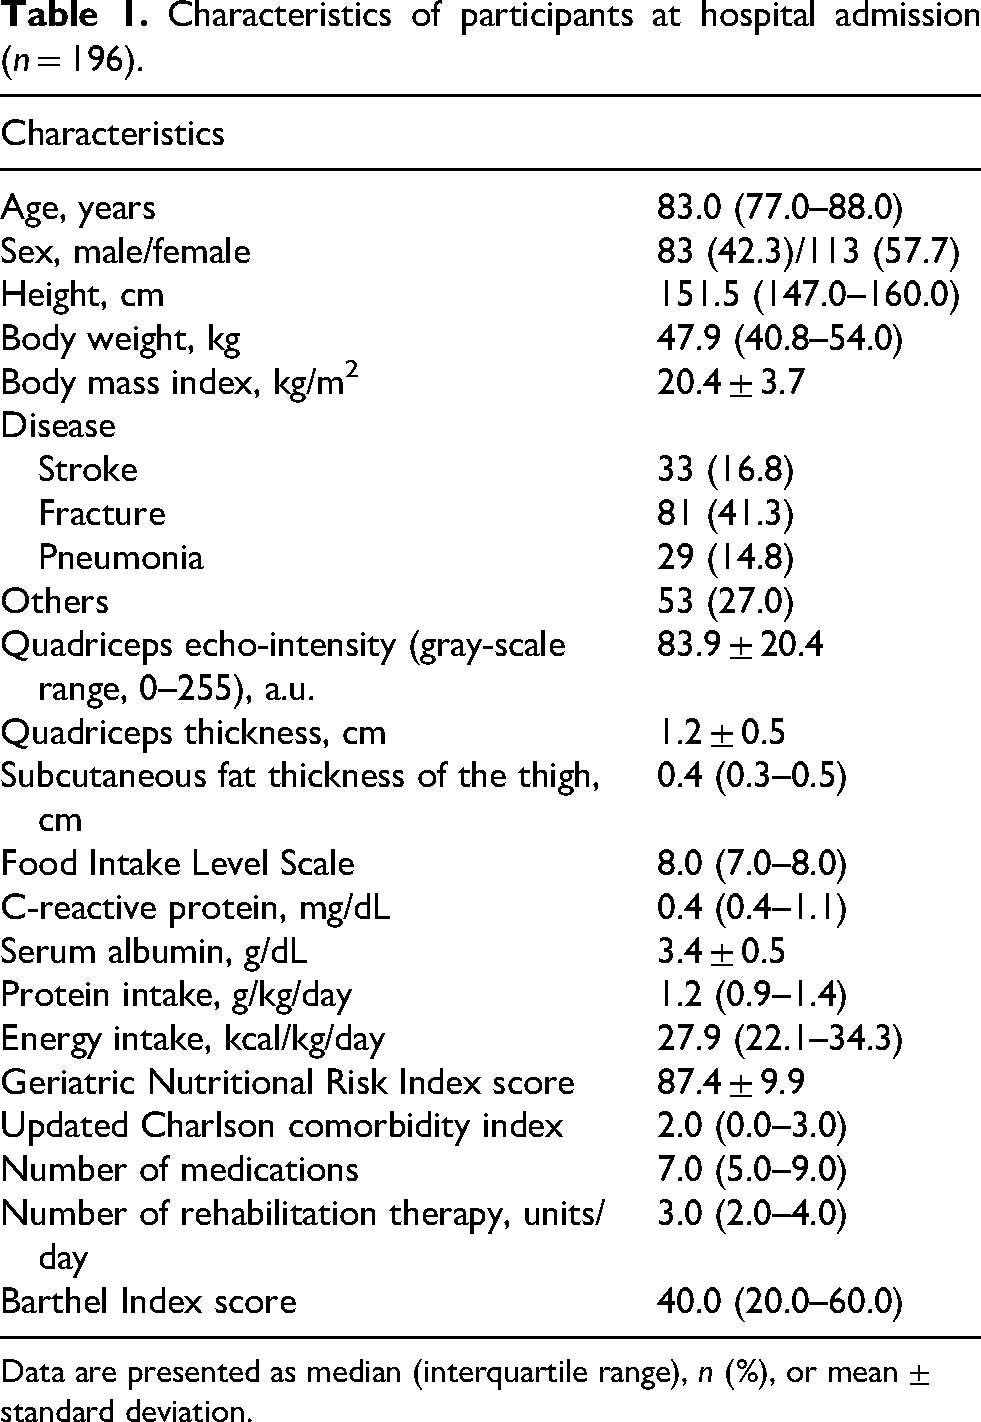
Data are presented as median (interquartile range), n (%), or mean ± standard deviation.
Comparisons in quadriceps echo intensity and thickness, geriatric nutritional risk Index score, body weight, serum albumin, protein and energy intakes, number of units of rehabilitation therapy, and Barthel Index score at admission and discharge.
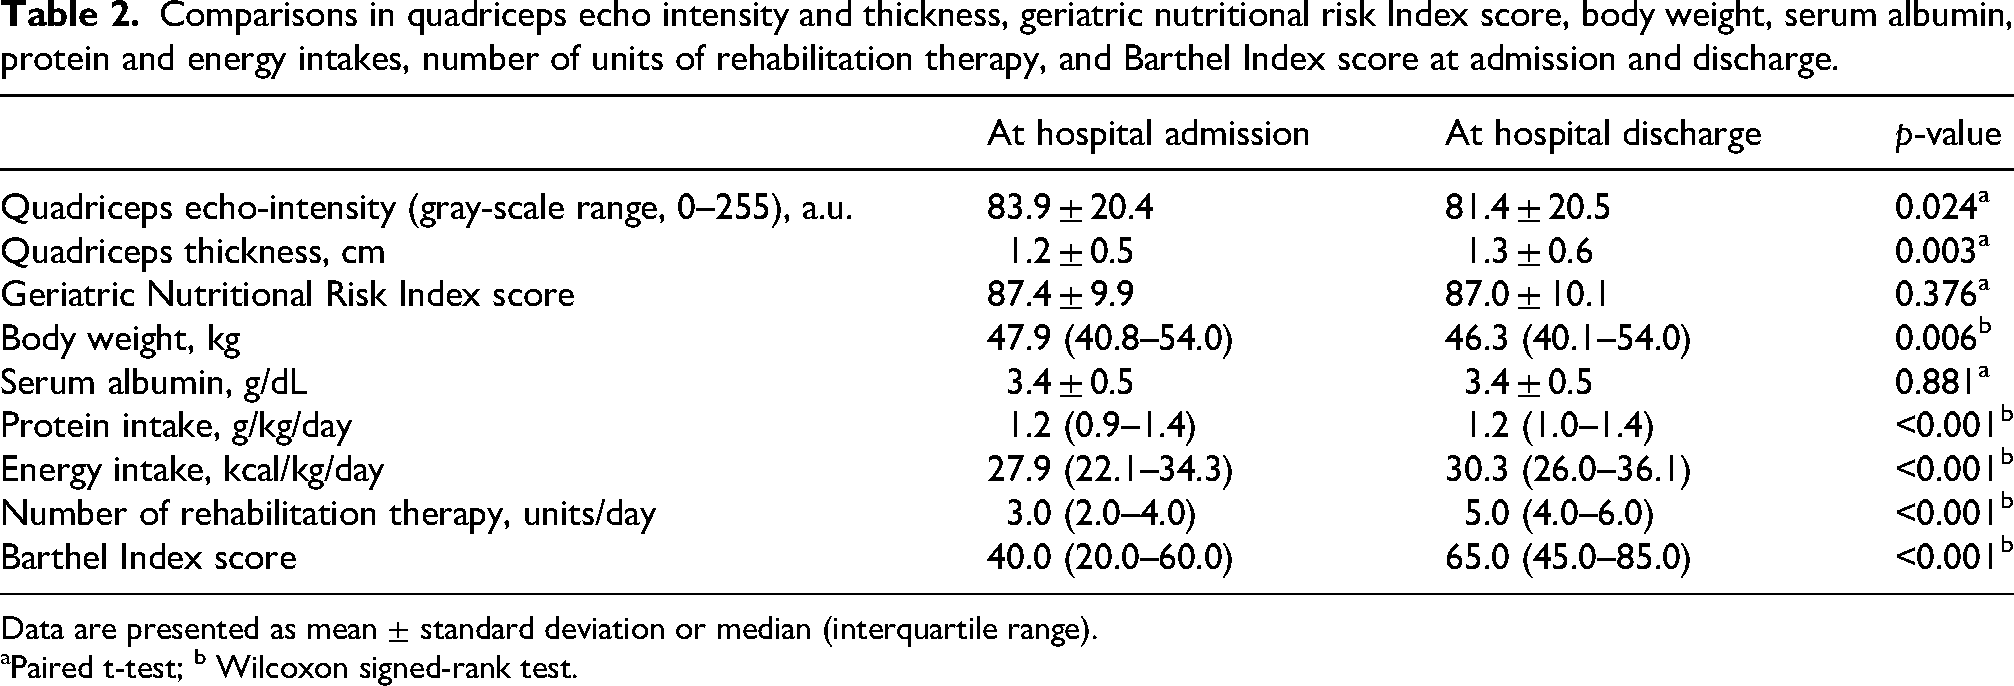
Data are presented as mean ± standard deviation or median (interquartile range).
Paired t-test; b Wilcoxon signed-rank test.
Tables 3 and 4 show the results of multiple linear regression analysis for changes in quadriceps EI and thickness. There was no multicollinearity among the independent variables. Change in GNRI score (β = −0.16), age (β = 0.15), and GNRI score (β = −0.20), quadriceps EI (β = −0.60), and SFT of the thigh (β = −0.16) at admission were significantly related to change in quadriceps EI (R2 = 0.319, f2 = 0.468, power = 1.000). Change in GNRI score (β = 0.15) was significantly associated with change in quadriceps thickness (R2 = 0.078, f2 = 0.085, power = 0.788). Based on the standardized partial regression coefficient, the change in GNRI score explained a slightly larger proportion of the change in quadriceps EI than changes in quadriceps thickness.
Multiple linear regression analysis for change in quadriceps echo intensity.
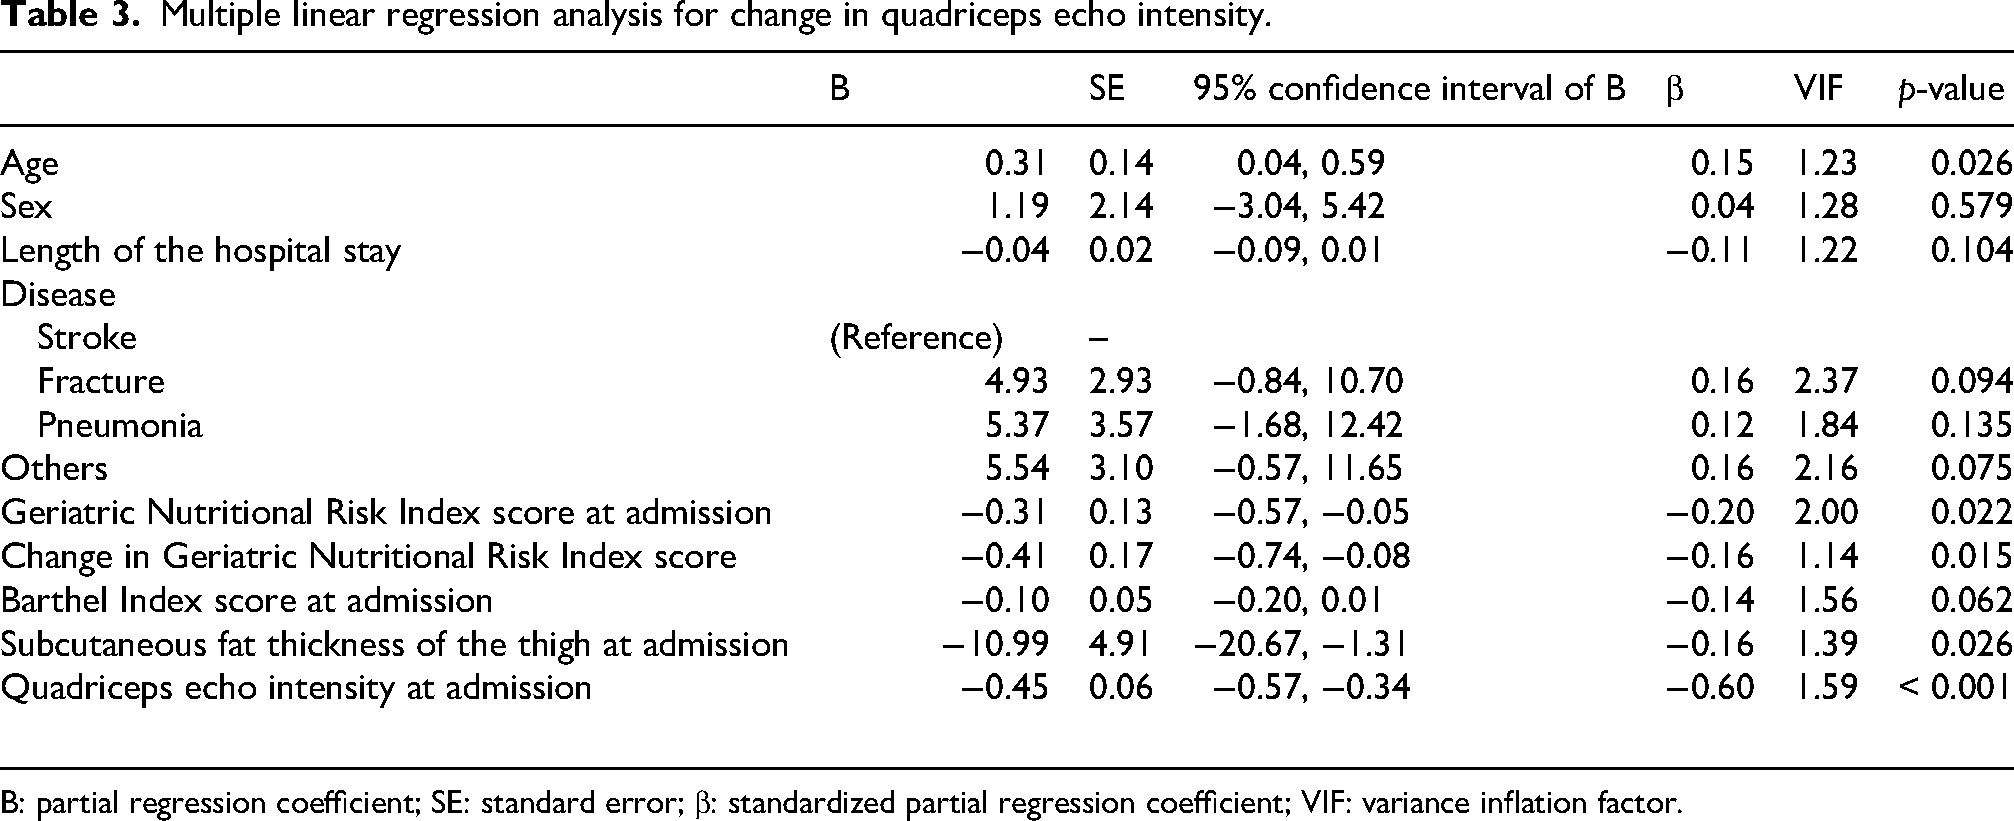
B: partial regression coefficient; SE: standard error; β: standardized partial regression coefficient; VIF: variance inflation factor.
Multiple linear regression analysis for change in quadriceps thickness.
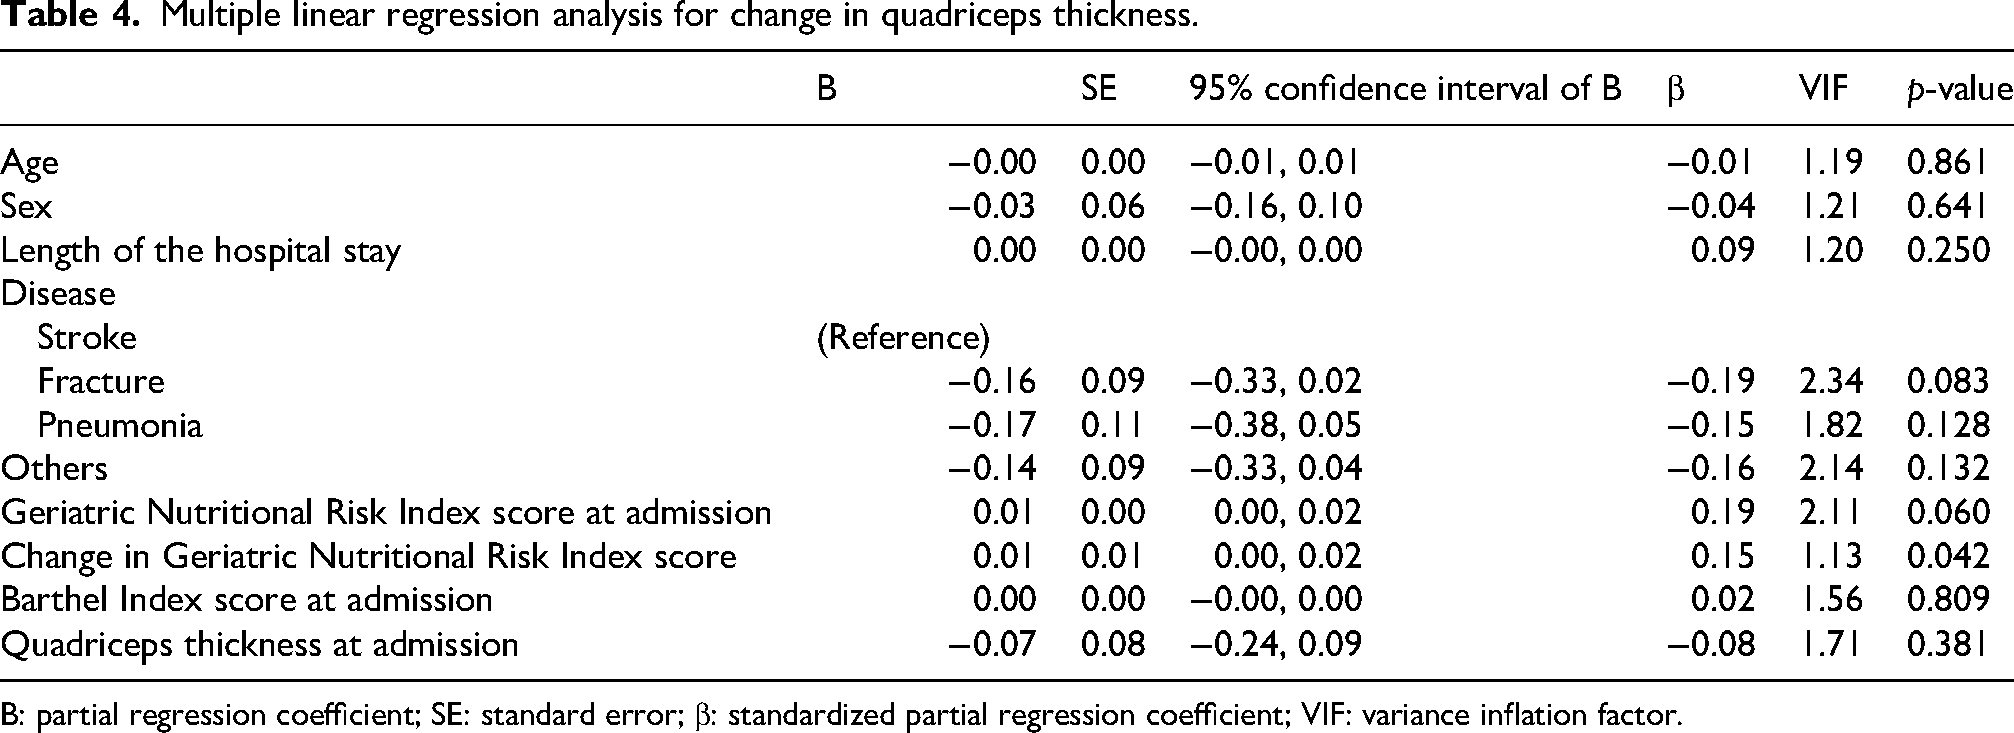
B: partial regression coefficient; SE: standard error; β: standardized partial regression coefficient; VIF: variance inflation factor.
Table 5 shows the results of partial correlation analysis. The change in BI score was significantly related to the changes in quadriceps EI (partial correlation coefficient = −0.22, p = 0.002) and thickness (partial correlation coefficient = 0.16, p = 0.027). The change in the number of rehabilitation therapy units was significantly related to the change in quadriceps thickness (partial correlation coefficient = 0.22, p = 0.002) and tended to be related to the change in quadriceps EI (partial correlation coefficient = −0.14, p = 0.051). There were no relationships between the changes in BW, BI score, and the number of rehabilitation therapy units.
Relationships between the changes in Barthel Index score, number of rehabilitation therapy units, body weight, and echo intensity and thickness of the quadriceps.
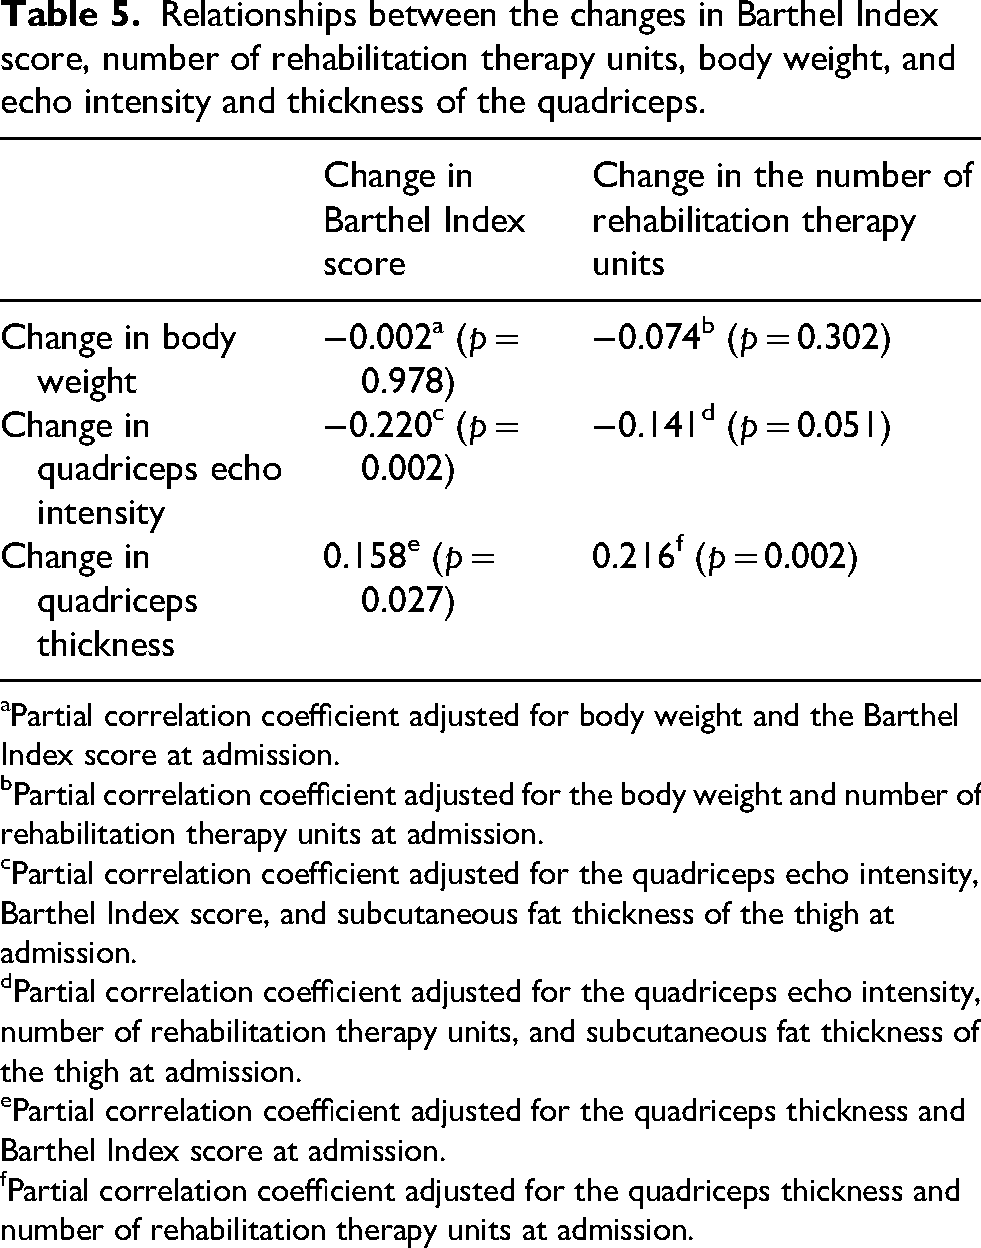
Partial correlation coefficient adjusted for body weight and the Barthel Index score at admission.
Partial correlation coefficient adjusted for the body weight and number of rehabilitation therapy units at admission.
Partial correlation coefficient adjusted for the quadriceps echo intensity, Barthel Index score, and subcutaneous fat thickness of the thigh at admission.
Partial correlation coefficient adjusted for the quadriceps echo intensity, number of rehabilitation therapy units, and subcutaneous fat thickness of the thigh at admission.
Partial correlation coefficient adjusted for the quadriceps thickness and Barthel Index score at admission.
Partial correlation coefficient adjusted for the quadriceps thickness and number of rehabilitation therapy units at admission.
Discussion
We examined the longitudinal relationship between MR and IMAT of the quadriceps in older inpatients. The results of this study indicate that an increase in MR in older inpatients is related to an increase in IMAT of the quadriceps, and an improvement in MR is associated with a decrease in IMAT of the quadriceps.
Malnutrition may promote IMAT accumulation through multiple interrelated mechanisms. Chronic low-grade inflammation suppresses myogenic factors (e.g. MyoD) while enhancing adipogenic regulators such as PPARγ (Roubenoff, 2003; Tisdale, 2009). In addition, oxidative stress impairs mitochondrial function, favoring adipogenic differentiation (Marzetti et al., 2013). Hormonal alterations, including reduced insulin-like growth factor-1 and elevated cortisol, further contribute to anabolic resistance and decreased muscle protein synthesis (Wolfe, 2006). Collectively, these changes may shift muscle progenitor cell fate toward adipogenesis, leading to IMAT accumulation and deterioration of muscle quality (Addison et al., 2014b).
Our results are consistent with those of a recent study (Akazawa et al., 2022b), demonstrating that a higher MR at admission is associated with an increase in IMAT of the quadriceps during hospitalization. Furthermore, our findings suggest the possibility that nutritional intervention in older inpatients may reduce IMAT of the quadriceps. Given our findings, together with previous evidence indicating that quadriceps IMAT in older inpatients is more strongly associated with gait independence (Akazawa et al., 2023), swallowing ability (Akazawa et al., 2022a), ADL (Akazawa et al., 2021b), and hospital-associated complications (Nagae et al., 2021) than muscle mass, improving MR may contribute to the reduction of IMAT and is considered crucial for enhancing clinical outcomes in this population.
The mean GNRI score at admission in this study was 87.4 ± 9.9, and 166 out of 196 patients (84.7%) were classified as at risk of malnutrition. This prevalence is consistent with previous studies (Nishioka et al., 2017; Inoue et al., 2019). In other words, the majority of older patients are considered to be at risk of malnutrition. Furthermore, the GNRI score at admission was treated as a covariate in the multiple regression analysis. Since the relationship between changes in GNRI score and changes in quadriceps EI remained significant after adjusting for the baseline GNRI score, this relationship appears to be independent of the initial nutritional status at admission. This suggests that even patients with good nutritional status at admission may be at risk of an increase in IMAT if their nutritional status deteriorates during hospitalization. Even for patients with good nutritional status at admission, it may be necessary to monitor the GNRI score routinely or periodically during hospitalization to detect early deterioration in nutritional status before IMAT accumulates. Although this study was conducted during a hospital stay of 70.5 (48.0–97.8) days, we believe it is necessary to investigate the longitudinal association between nutritional status and IMAT at shorter intervals to determine an appropriate monitoring frequency.
At the group level, no statistically significant difference was observed between GNRI scores at admission and discharge. However, the proportions of patients whose GNRI score remained stable or improved versus those whose GNRI score worsened during hospitalization were 51.5% and 48.5%, respectively. Although no significant change in the mean GNRI score was observed during hospitalization, the results of multiple linear regression analysis indicated that changes in individual-level GNRI score still predicted changes in individual-level quadriceps EI.
Although the statistical power was below the conventional threshold of 0.800, changes in GNRI score were also associated with changes in quadriceps thickness, in addition to changes in quadriceps EI. These findings suggest that a decline in GNRI score may contribute to both a reduction in muscle mass and an increase in IMAT. Given that quadriceps muscle mass and IMAT are closely associated with motor function (Akima et al., 2017; Akazawa et al., 2023; Berger et al., 2015; Yamauchi et al., 2023) and ADL (Akazawa et al., 2021b), nutritional intervention in older inpatients is considered essential for maintaining functional outcomes.
A previous study (Sato et al., 2019) has reported that GNRI scores in stroke patients tend to decline (i.e. MR increases) during rehabilitation periods. However, in our study, the GNRI scores of participants did not change significantly during hospitalization. The GNRI score is evaluated with serum albumin levels and BW (Bouillanne et al., 2005). In our cohort, although serum albumin levels remained stable throughout the hospital stay, BW decreased significantly. On the other hand, energy and protein intake increased, IMAT decreased, and muscle mass increased during hospitalization. The decrease in IMAT and the increase in muscle mass were favorable changes in body composition. Based on improvements in IMAT and muscle mass, and the stability of serum albumin, the decrease in BW may be attributed to the favorable effects of rehabilitation rather than to deterioration in nutritional status. Although physical activity (i.e. BI score and number of rehabilitation therapy units) was significantly increased during hospitalization, and these changes were not associated with the change in BW, the increase in BI score was significantly related to the improvement in IMAT, and the increase in the number of rehabilitation therapy units showed a tendency to be related to the improvement in IMAT. In addition, the increases in BI score and number of rehabilitation therapy units were significantly related to the increase in muscle mass. In other words, the increase of physical activity through rehabilitation may be considered to contribute to improvements in IMAT and muscle mass.
This study has several limitations. First, although sex was included as a covariate in the multiple regression analysis, we were unable to investigate the association of changes in GNRI with changes in quadriceps EI separately for each sex. Further studies are needed to examine the influence of sex on this relationship. Second, this study was conducted in a post-acute hospital setting. It will be necessary to examine whether similar relationships exist in acute and chronic care settings. Third, we used an ultrasound to assess IMAT. However, the accuracy for assessing IMAT using ultrasound is lower than that of using MRI, which is the gold standard method (Akima et al., 2016). Fourth, this study did not exclude patients who had edema. Therefore, edema may influence BW and quadriceps EI. We think that the influence of subcutaneous edema on the GNRI score and quadriceps EI was controlled to some extent because the multiple linear regression analysis included SFT as a covariate. However, we were unable to exclude the influence of muscle edema on BW and quadriceps EI. Fifth, in this study, protein and energy intakes were estimated visually and subjectively. Although this approach is commonly used in clinical practice, it may be associated with measurement inaccuracies. Finally, the median BI score at admission among participants was 40.0 (interquartile range: 20.0–60.0), which indicates a severely dependent status, as a BI score of 60 or below is generally considered to reflect severe dependency (Granger et al., 1979). Therefore, the functional status of participants in this study was predominantly severely impaired. Different results may be observed in older inpatients with moderate or mild ADL dependency.
Conclusions
Our results indicate that an increase in MR leads to an increase in IMAT of the quadriceps, and an improvement in MR is associated with a decrease in IMAT of the quadriceps. We recommend that MR monitoring be integrated into the rehabilitation program for all older inpatients, regardless of nutritional status at admission. This would help bridge the gap between nutrition and rehabilitation services. In addition, further intervention studies are needed to determine whether specific nutritional strategies (such as high-protein diets or targeted nutritional support) can effectively prevent or improve IMAT accumulation.
Footnotes
List of abbreviations
Acknowledgements
We thank the participants and staff members who helped with this study.
Ethical approval and informed consent statements
The study was approved by the Ethics Committee of the Tokushima Bunri University (approval numbers H28-7, H31-2, and R3-29). All participants or their guardians provided written informed consent prior to the study.
Consent for publication
Not applicable.
Author contributions
AN, FK, HT, TW, HA, and UY: The conception and design of the study, acquisition of data, or analysis and interpretation of data. AN, FK, HT, TW, HA, and UY: Drafting the article. AN, FK, HT, TW, HA, and UY: Final approval of the version to be submitted.
Funding
The authors disclosed receipt of the following financial support for the research, authorship, and/or publication of this article: This work was supported by JSPS KAKENHI Grant Numbers JP17K18294 and JP20K19661.
Declaration of conflicting interests
The authors declared no potential conflicts of interest with respect to the research, authorship, and/or publication of this article.
Data availability statement
The data that support the findings of this study are available from the corresponding author, NA, upon reasonable request.