






Abstract
Introduction
Addressing diet-related health conditions remains a critical global public health priority. Non-communicable diseases (NCDs), including diabetes, cancers, chronic respiratory diseases, and mental health disorders, are the leading cause of death, accounting for over 75% of all deaths globally and in the World Health Organization (WHO) European Region. It is known that lifestyle choices such as unhealthy diets, physical inactivity, excess body weight, and tobacco and alcohol use are a major cause of these conditions (WHO, 2025). Overweight and obesity are the fourth most prevalent risk factors for NCDs in the region, following high blood pressure, dietary risks, and tobacco use (WHO, 2025). According to the WHO almost 60% of adults live with overweight or obesity, which substantially increases the risk of chronic diseases, including type 2 diabetes, cardiovascular conditions, and certain cancers in 2022 (WHO, 2021, 2024).
The burden of nutrition-related health problems is particularly high in Türkiye. Recent global health reports indicate that the country has the highest prevalence of obesity in Europe. As of 2024, 66.8% of adults were classified as overweight, and 32.1% were considered obese (WHO, 2022; World Population Review, 2024). Furthermore, it is estimated that around 9.6 million adults in Türkiye are living with diabetes, with nearly half of these cases remaining undiagnosed. Projections suggest that the number will rise to approximately 14.1 million by 2050, with prevalence increasing to 18.6%, positioning the country among those with the highest rates in Europe (Anakök et al., 2022; International Diabetes Federation, 2025). This highlights the urgent necessity for effective and scalable approaches to prevent and manage diet-related conditions. Reliable evaluation of food intake and eating behaviours plays a key role in prevention, treatment, and the promotion of healthy and sustainable dietary habits. To support targeted interventions, health professionals rely on dietary assessment instruments that help identify behavioural patterns. The success of such approaches largely depends on the accuracy and ease of use of these tools (Zhang et al., 2010).
The rising impact of this problem is being tackled more and more through mobile health (mHealth) solutions. Nutrition- and diet-focused mHealth applications are now being used extensively by both the public and healthcare providers (Chen et al., 2017; Vasiloglu et al., 2020, 2021). These tools contribute to several stages of the nutrition care process, including assessment, education, behaviour modification, and monitoring (Chen et al., 2018; El Khoury et al., 2019). Research has suggested that when integrated with conventional clinical practices, such applications can yield significant improvements in health outcomes, especially in the management of chronic diseases and weight control (El Khoury et al., 2019; Ghelani et al., 2020; Paramastri et al., 2020; Villinger et al., 2019). Additionally, their use has been associated with enhanced dietary quality across diverse populations (Scarry et al., 2022).
Recent advances in artificial intelligence (AI) have been incorporated into nutrition-oriented mHealth applications; however, the extent to which these features are implemented and contribute to app performance remains unclear (Li et al., 2024; Samad et al., 2022). Despite growing interest in these technologies, there is still a scarcity of research assessing the effectiveness of nutrition-focused mHealth applications in driving behavioural change, maintaining long-term user engagement, and delivering accurate dietary assessments (Chen et al., 2015; Ferrara et al., 2019; Franco et al., 2016). Most existing evaluations were conducted before the rapid integration of AI technologies. In a recent study, the features, quality, and potential to change behaviour of popular nutrition applications were assessed, while nutrition outcomes obtained through manual food logging and AI-supported image recognition methods were also compared (Li et al., 2024). The study was valuable, but its limited scope focused on a small number of apps and overlooked country-specific considerations such as language, dietary guidelines, and app availability in local markets.
mHealth apps related to nutrition represent broader socio-technical and systemic transformations toward digital, data-driven, and preventive healthcare models, going beyond their role as individual self-monitoring tools. Current research emphasizes that technological innovations alone are insufficient to trigger meaningful change; rather, transformations emerge through the interaction of technologies with organizational structures, governance mechanisms, and user behaviour. For example, transformation-focused literature highlights that structural factors, such as institutional quality and policy environments, play a critical role in shaping the effectiveness of technological solutions and enabling system-wide change (Barra et al., 2026). Similarly, it was observed that the need to integrate technological advancements into broader socio-economic systems in order to achieve improvements in health, well-being, and long-term sustainability (Rahman et al., 2026). At the same time, the debates surrounding the energy and sustainability transitions highlight the importance of equity, accessibility, and governance in determining whether technological innovations will yield inclusive and effective outcomes (Falcone and Errichiello, 2025). Within this framework, m-health applications related to nutrition can be viewed as components of a broader transformation toward personalized, preventive, and digitally delivered healthcare systems. However, the contribution of such tools to these transformations depends largely on the reliability and validity of the data they generate. Inaccurate nutrition predictions not only affect individual decision-making processes but may also limit the integration of these applications into clinical practice and public health strategies. Therefore, evaluating the accuracy and functional performance of these applications is of great importance not only from a methodological perspective but also in terms of their roles within the broader health system transformation and sustainability-focused change.
However, there is currently no comprehensive study that simultaneously evaluates the quality, functional features, and nutritional accuracy of nutrition-related mHealth applications within a country-specific context. In particular, the integration of AI features alongside validated dietary assessment methods has not been systematically examined, especially in local app markets such as Türkiye. Therefore, this study aimed to provide a comprehensive evaluation of nutrition-related mHealth apps available in Türkiye by assessing their quality, functional characteristics, including AI-functionalities, and the accuracy of their nutritional outputs using a standardized dietary reference model.
Methods
Study design
The selection and evaluation of applications in the study consisted of three stages: (1) complementary evaluation framework, integrating app characteristics (meta-data and feature extraction); (2) quality assessment (using the Mobile Application Rating Scale (MARS)); (3) objective validation of dietary outputs (comparison of the energy and macronutrient content of a 2000kcal diet prepared in accordance with the Turkish Nutrition Guide). This approach enables a multidimensional assessment of mHealth applications by linking structural features and usability with their actual performance in estimating dietary intake.
Metadata were extracted on 16 July 2025, from the App Store in Türkiye under the ‘Health and Fitness’ category, and using the search terms ‘diet’ and ‘food’. These keywords were intentionally chosen to capture applications that are most likely to be identified by end-users in routine searches, thereby enhancing the ecological validity of the app selection process. This process was guided by the WHO's classification of digital health interventions (WHO, 2018). Extracted information included app name, country of origin, user rating, number of ratings, number of downloads, ranking, description, and evidence of health professional involvement. Additional variables recorded were pricing (free, paid, or subscription-based), app functionalities, availability of preview images or videos, and any indication of AI use. Each app's primary focus (e.g. dietary guidance, disease management) and alignment with stages of the nutrition care process were also documented.
A total of 200 free and 200 paid applications listed under the ‘Health and Fitness’ category were identified, along with 252 apps retrieved using the keyword diet and 155 using the keyword food. Apps were identified exclusively from the Apple App Store as a pragmatic and operational decision: the App Store provides a single, centralized metadata structure with standardized ranking algorithms, uniform category taxonomy, and consistent listing fields, which facilitated systematic retrieval and reproducible screening within the available research resources. Restricting identification to one storefront also minimized cross-platform duplication and avoided confounding from divergent app versions and update cycles between iOS and Android releases. It is acknowledged that this approach does not constitute a representative sample of the global mobile ecosystem and that broader cross-platform evaluation would be desirable. Eligibility criteria for inclusion and exclusion at each stage are summarized in Supplementary Table 1.
Mobile Application Rating Scale
The quality of the applications was evaluated using the MARS. MARS is a standardized, multidimensional tool developed to assess the quality of mobile health (mHealth) applications across several domains (Stoyanov et al., 2015). It provides an objective framework to evaluate app quality based on both technical and content-related aspects. The validity and reliability of the Turkish version were established by Mendi et al. (2022), ensuring its appropriateness for use in Turkish-language app evaluations. The scale is structured into three main sections. The first section gathers general descriptive and technical details about the mobile applications. The second section includes a total of 23 items distributed across five subscales: four assessing objective quality – engagement (5 items), functionality (4 items), aesthetics (3 items), and information (7 items) – and one evaluating subjective quality (4 items). The third assesses perceived impacts on awareness, knowledge, attitudes, and other factors related to health behaviour change. Each subscale score was calculated as the average of item scores, and the overall MARS score was the mean of the four objective subscales (engagement, functionality, aesthetics, and information). Higher scores reflect better app quality.
In this study, two trained researchers evaluated the apps using MARS tool. Inter-rater reliability was assessed using the intraclass correlation coefficient (ICC), demonstrating good agreement between evaluators (ICC = 0.760), indicating a satisfactory level of consistency between raters.
Assessment of dietary intake accuracy using manual food-logging apps
The dietary assessment procedure was designed as a controlled simulation rather than real-life dietary recording. Three sustainable menus of 2000kcal each were created by a registered dietitian according to the Turkish Nutrition Guide (Republic of Türkiye, Ministry of Health, 2022), and they were used to ensure consistency across apps and to isolate differences attributable to app performance rather than user-related variability. Culturally specific Turkish dishes were excluded to ensure compatibility with the predominantly English-based food databases of the apps and to minimize discrepancies arising from translation, food matching, and database limitations. All menu entries were performed by a single trained researcher to ensure consistency in data entry procedures and reduce variability related to user input. Nutrient composition of the menus was calculated using the Nutrition Information System (BEBIS, Version 9.0), which served as the reference standard. App-generated outputs for energy and macronutrients (protein, carbohydrates, and total fat) were then extracted and recorded for analysis.
Among the 17 apps included in the final sample, only 13 supported standardized manual food entry and provided sufficiently detailed and quantifiable outputs for energy and macronutrients. Therefore, only these apps were eligible for inclusion in the nutrient accuracy analysis. The remaining applications were evaluated in terms of quality and features (MARS), but were not suitable for dietary intake comparison due to limitations in data entry standardization, insufficient nutrient detail, or lack of comparable quantitative outputs.
Statistical analysis
Statistical analyses were conducted using SPSS Version 24.0. The normality of distributions was assessed with the Kolmogorov–Smirnov test. As the macronutrient and energy intake data did not meet normality assumptions, non-parametric methods were applied. To evaluate overall differences among the 13 manual food-logging apps, and MARS scores Friedman tests were performed. For nutrients showing significant results, pairwise comparisons between each application and the reference 3-day food records (3D-FRs, calculated using BEBIS) were conducted using the Wilcoxon signed-rank test. In addition to comparative statistical tests, agreement between applications and reference values was further evaluated using Bland–Altman analysis. Mean absolute error (MAE) was also calculated to quantify the magnitude of estimation errors for energy and macronutrients. To minimize the risk of type I error due to multiple comparisons, Bonferroni-adjusted p-values were reported. Results are presented as mean ± SD, and 95% confidence intervals (CIs) are provided for the mean differences, in line with best practices for dietary assessment validation studies.
Results
The Health and Fitness category of the Apple App Store in Türkiye was the starting point for the identification of 807 apps, which were found using the keywords diet and food. After screening, 733 apps were excluded for not meeting the inclusion criteria. Metadata from the remaining 74 apps were extracted, and 57 were excluded at later stages. Ultimately, 17 apps were included in the final analysis (Supplementary Figure 1).
Table 1 summarizes the metadata characteristics of the 74 evaluated nutrition-related apps. Most apps originated from countries other than Türkiye (n: 57) and were either free to use (n: 29) or offered limited free access (n: 37). Only a minority involved healthcare professionals in their development (n: 12), whereas the majority lacked professional input (n: 58). The most common app purpose/category was food or nutrient tracking (n: 28), followed by personalized/AI-based diet planning (n: 11). In terms of the nutrition care process, more than half supported nutritional assessment (n: 36), and many addressed dietary intervention (n: 32).
Metadata of the nutrition-related apps evaluated (n: 74).
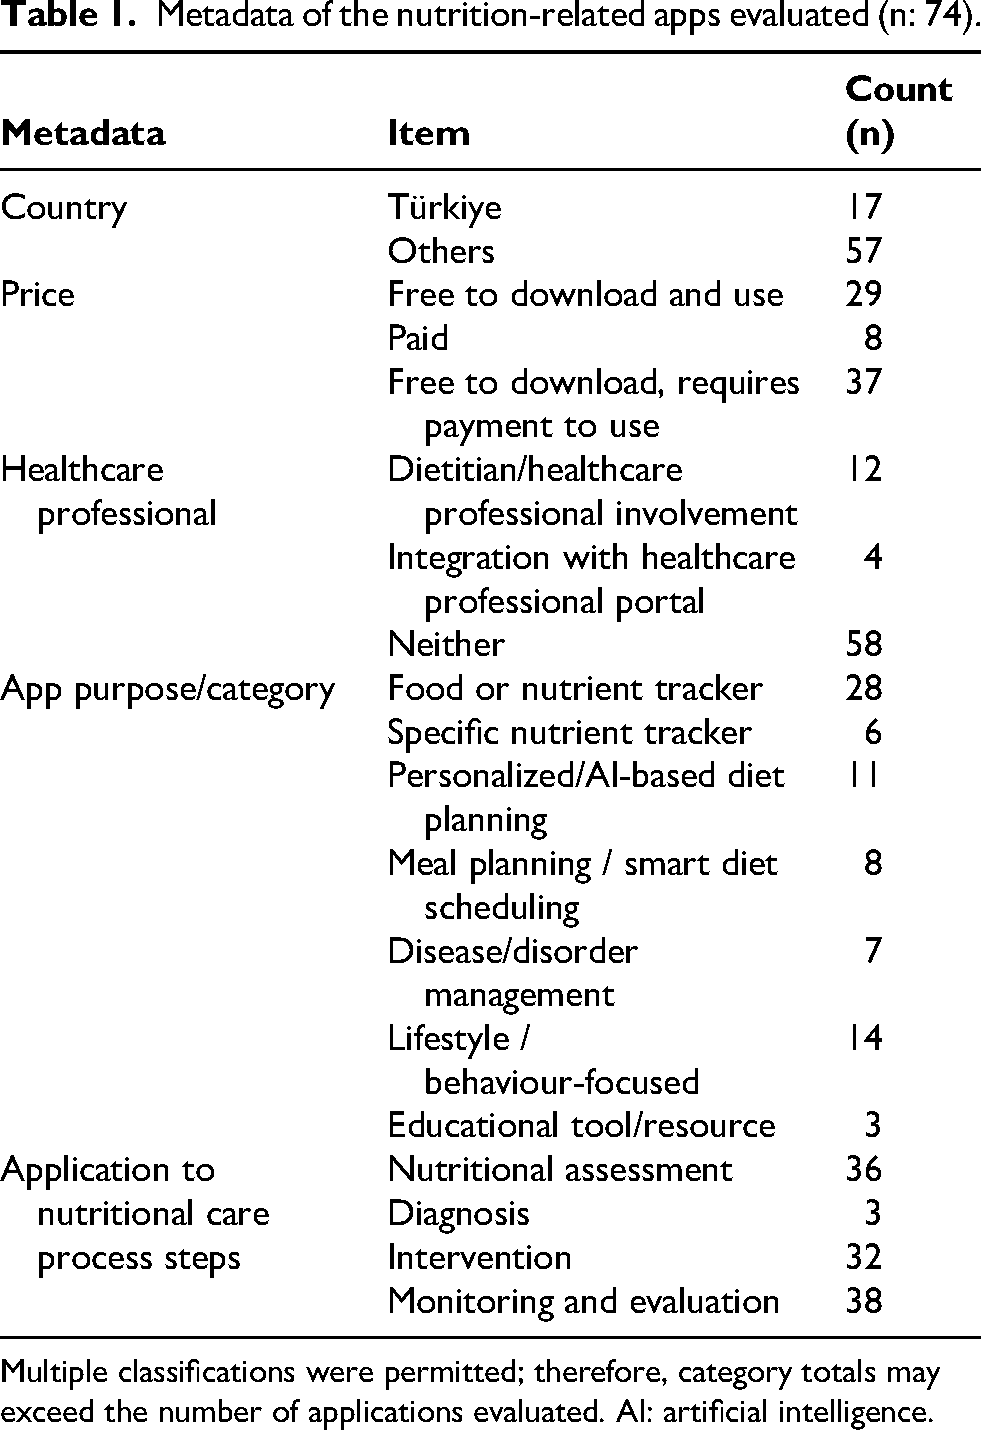
Multiple classifications were permitted; therefore, category totals may exceed the number of applications evaluated. AI: artificial intelligence.
Table 2 presents the classification of app features across seven categories: dietary, tracking, insights, technical, education, social, and AI. Dietary features included manual or barcode-based food entry, macronutrient breakdowns, and meal planning options. Tracking features involved monitoring water intake, body weight, fasting, physical activity, and other health indicators. Insight-related functions focused on goal setting, nutrient analysis, and progress tracking. Technical features supported integration with other apps and export functions. Educational and social categories covered recipe access, support communities, and peer interaction. Finally, AI-based features included automated food recognition, chatbots, and algorithm-driven nutrient estimations or planning.
App features classification.
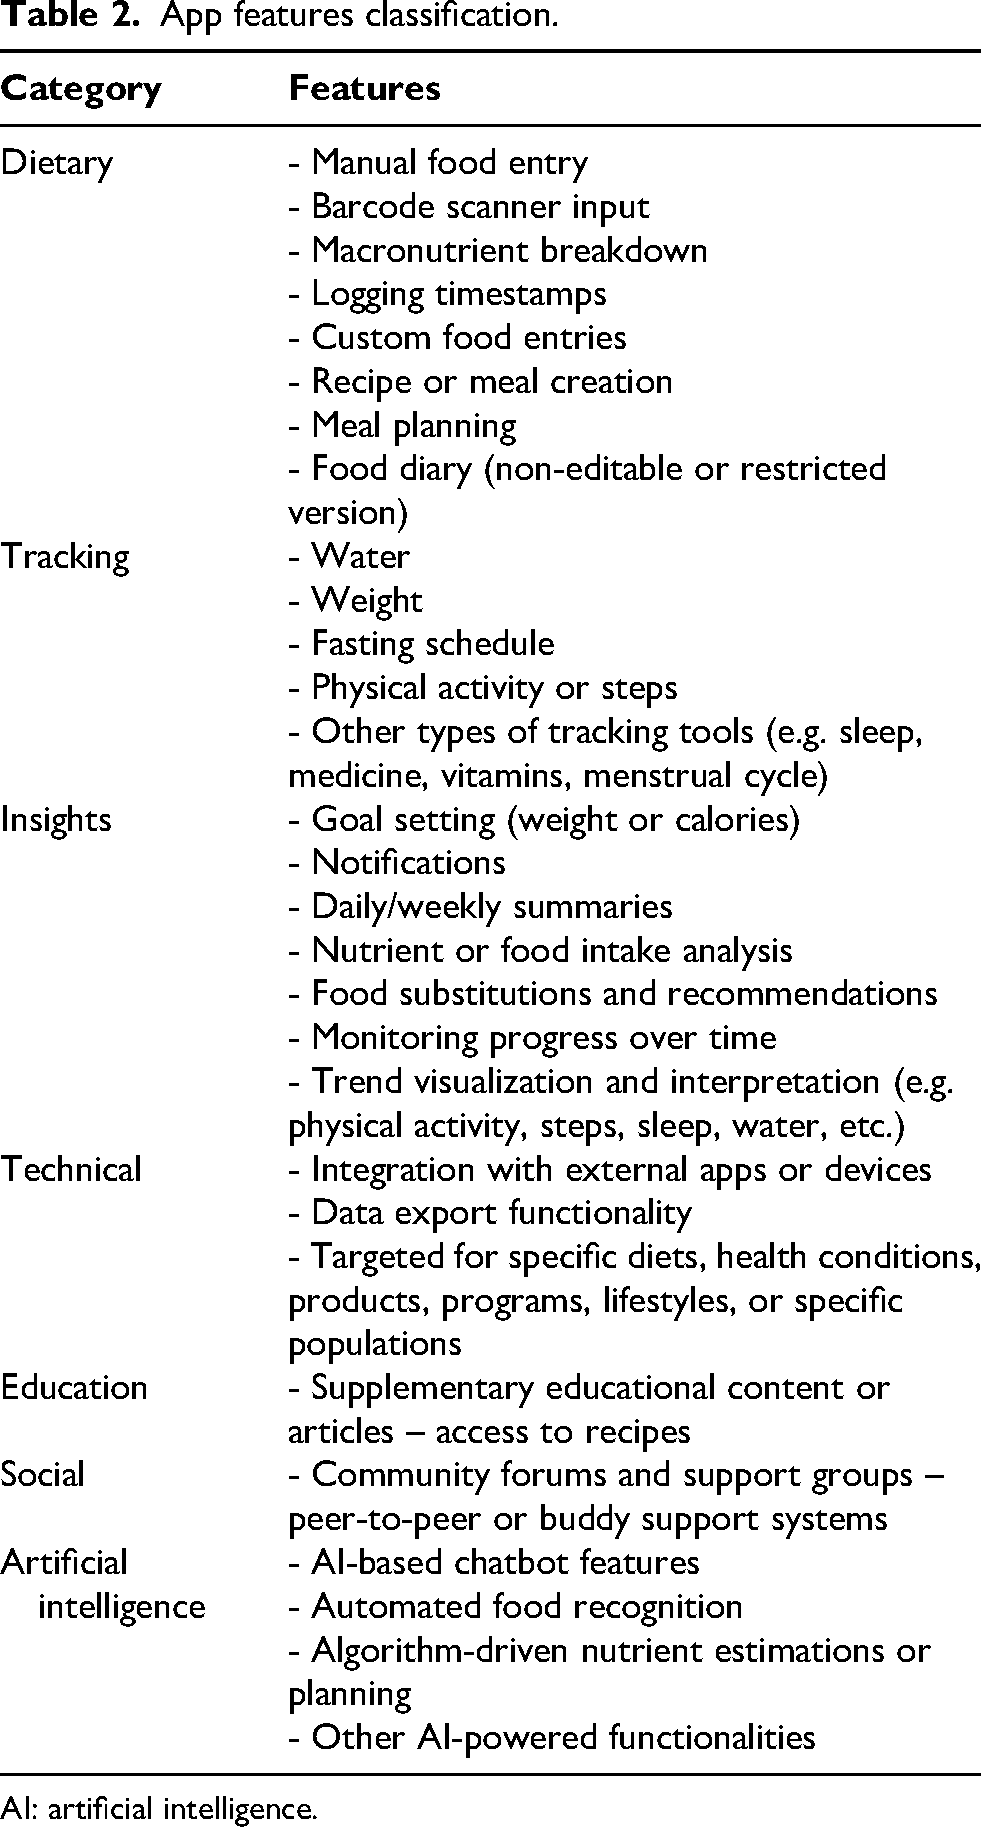
AI: artificial intelligence.
Table 3 displays the number of features identified in each of the 17 selected nutrition-related apps across seven categories. The most comprehensive apps in terms of total features were MyNetDiary (n: 24), Fitatu (n: 22), and HealthifyMe (n: 21). While dietary and tracking functions were found in all apps, educational and social components were less frequent. AI-based features were identified in only five apps, with Fastic, HealthifyMe, YamFit, Formula, and Fitatu among those integrating at least one AI-powered functionality.
Number of features in the applications included in the study (n: 17).
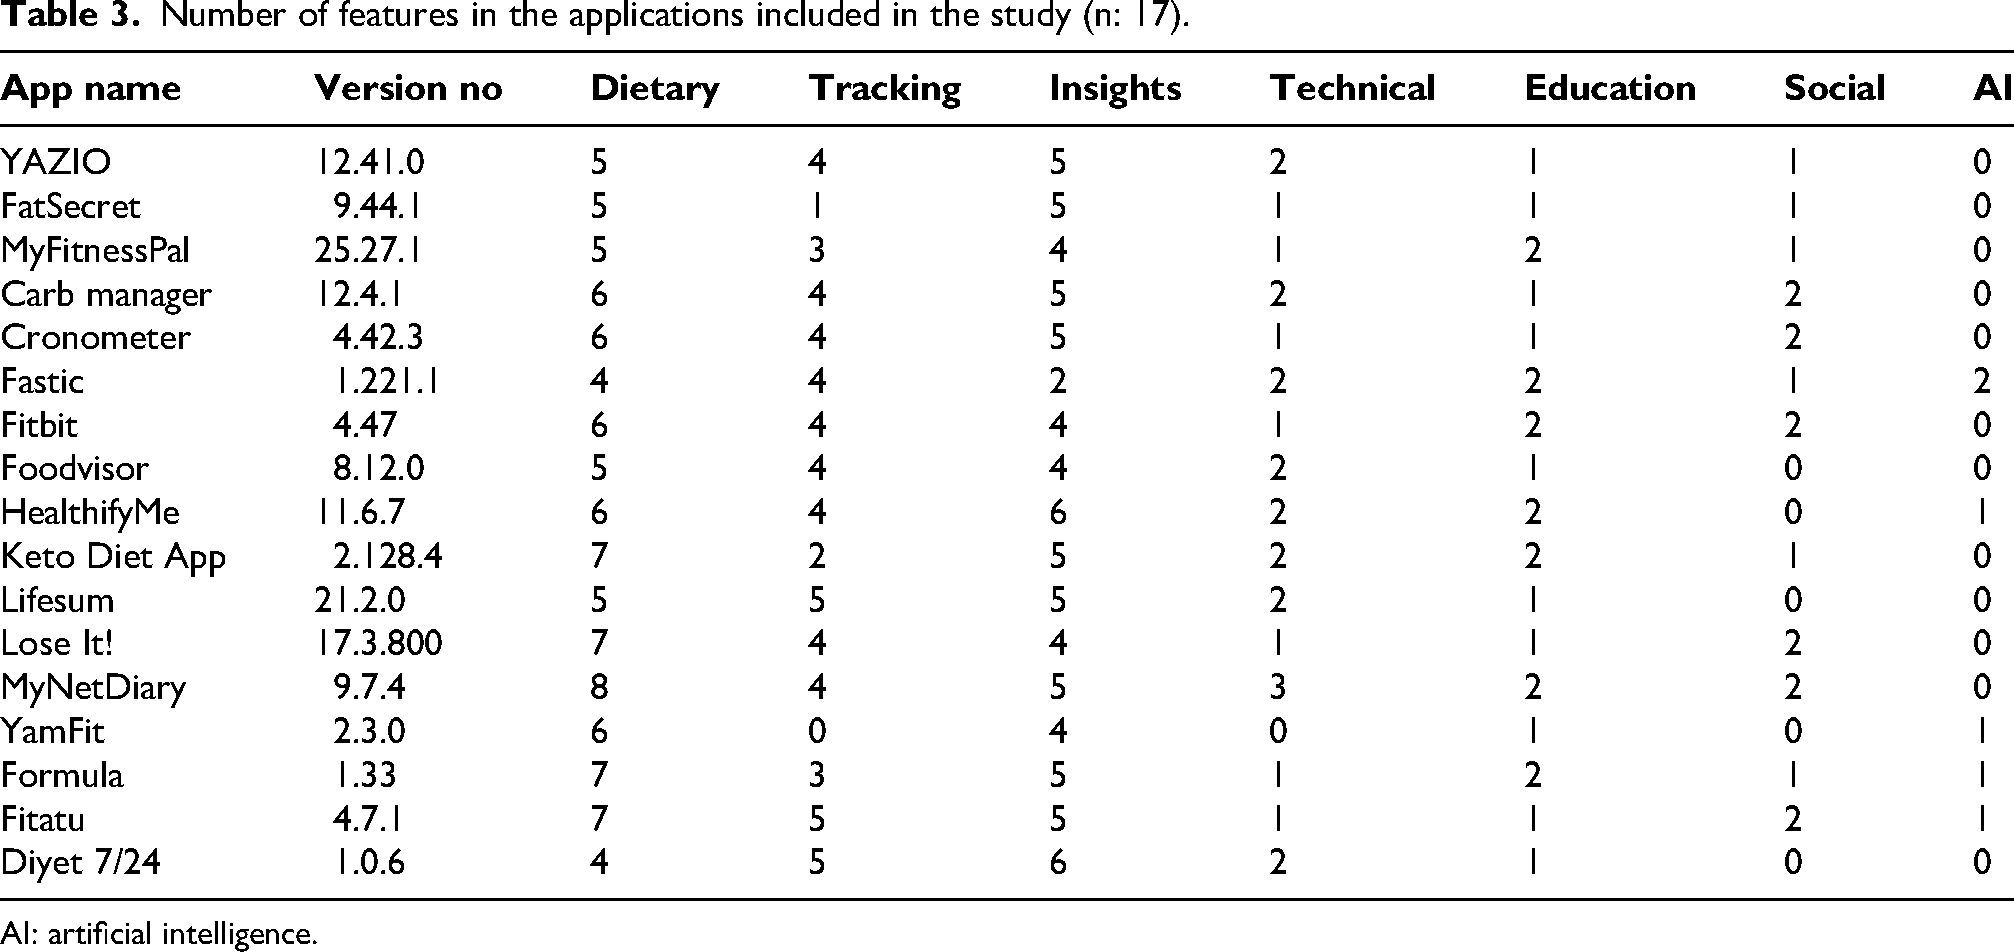
AI: artificial intelligence.
Figure 1 illustrates the MARS scores of the 17 evaluated nutrition-related apps, ranked from highest to lowest overall quality. The mean MARS score for all applications was 3.61, with ‘functionality’ having the highest average at 4.03. This was followed by ‘aesthetics’ at 3.85. ‘Information’ and ‘engagement’ were the lowest MARS domain at 3.29 and 3.27, respectively. MyNetDiary received the highest mean MARS score (4.39), followed by HealthifyMe (4.21) and Lose It! and YAZIO (4.19), indicating strong performance in engagement, functionality, aesthetics, and information. In contrast, Fastic and Carb manager had the lowest overall scores (2.78, and 2.73). A Friedman test revealed a statistically significant difference between MARS domain scores (p: 0.029).
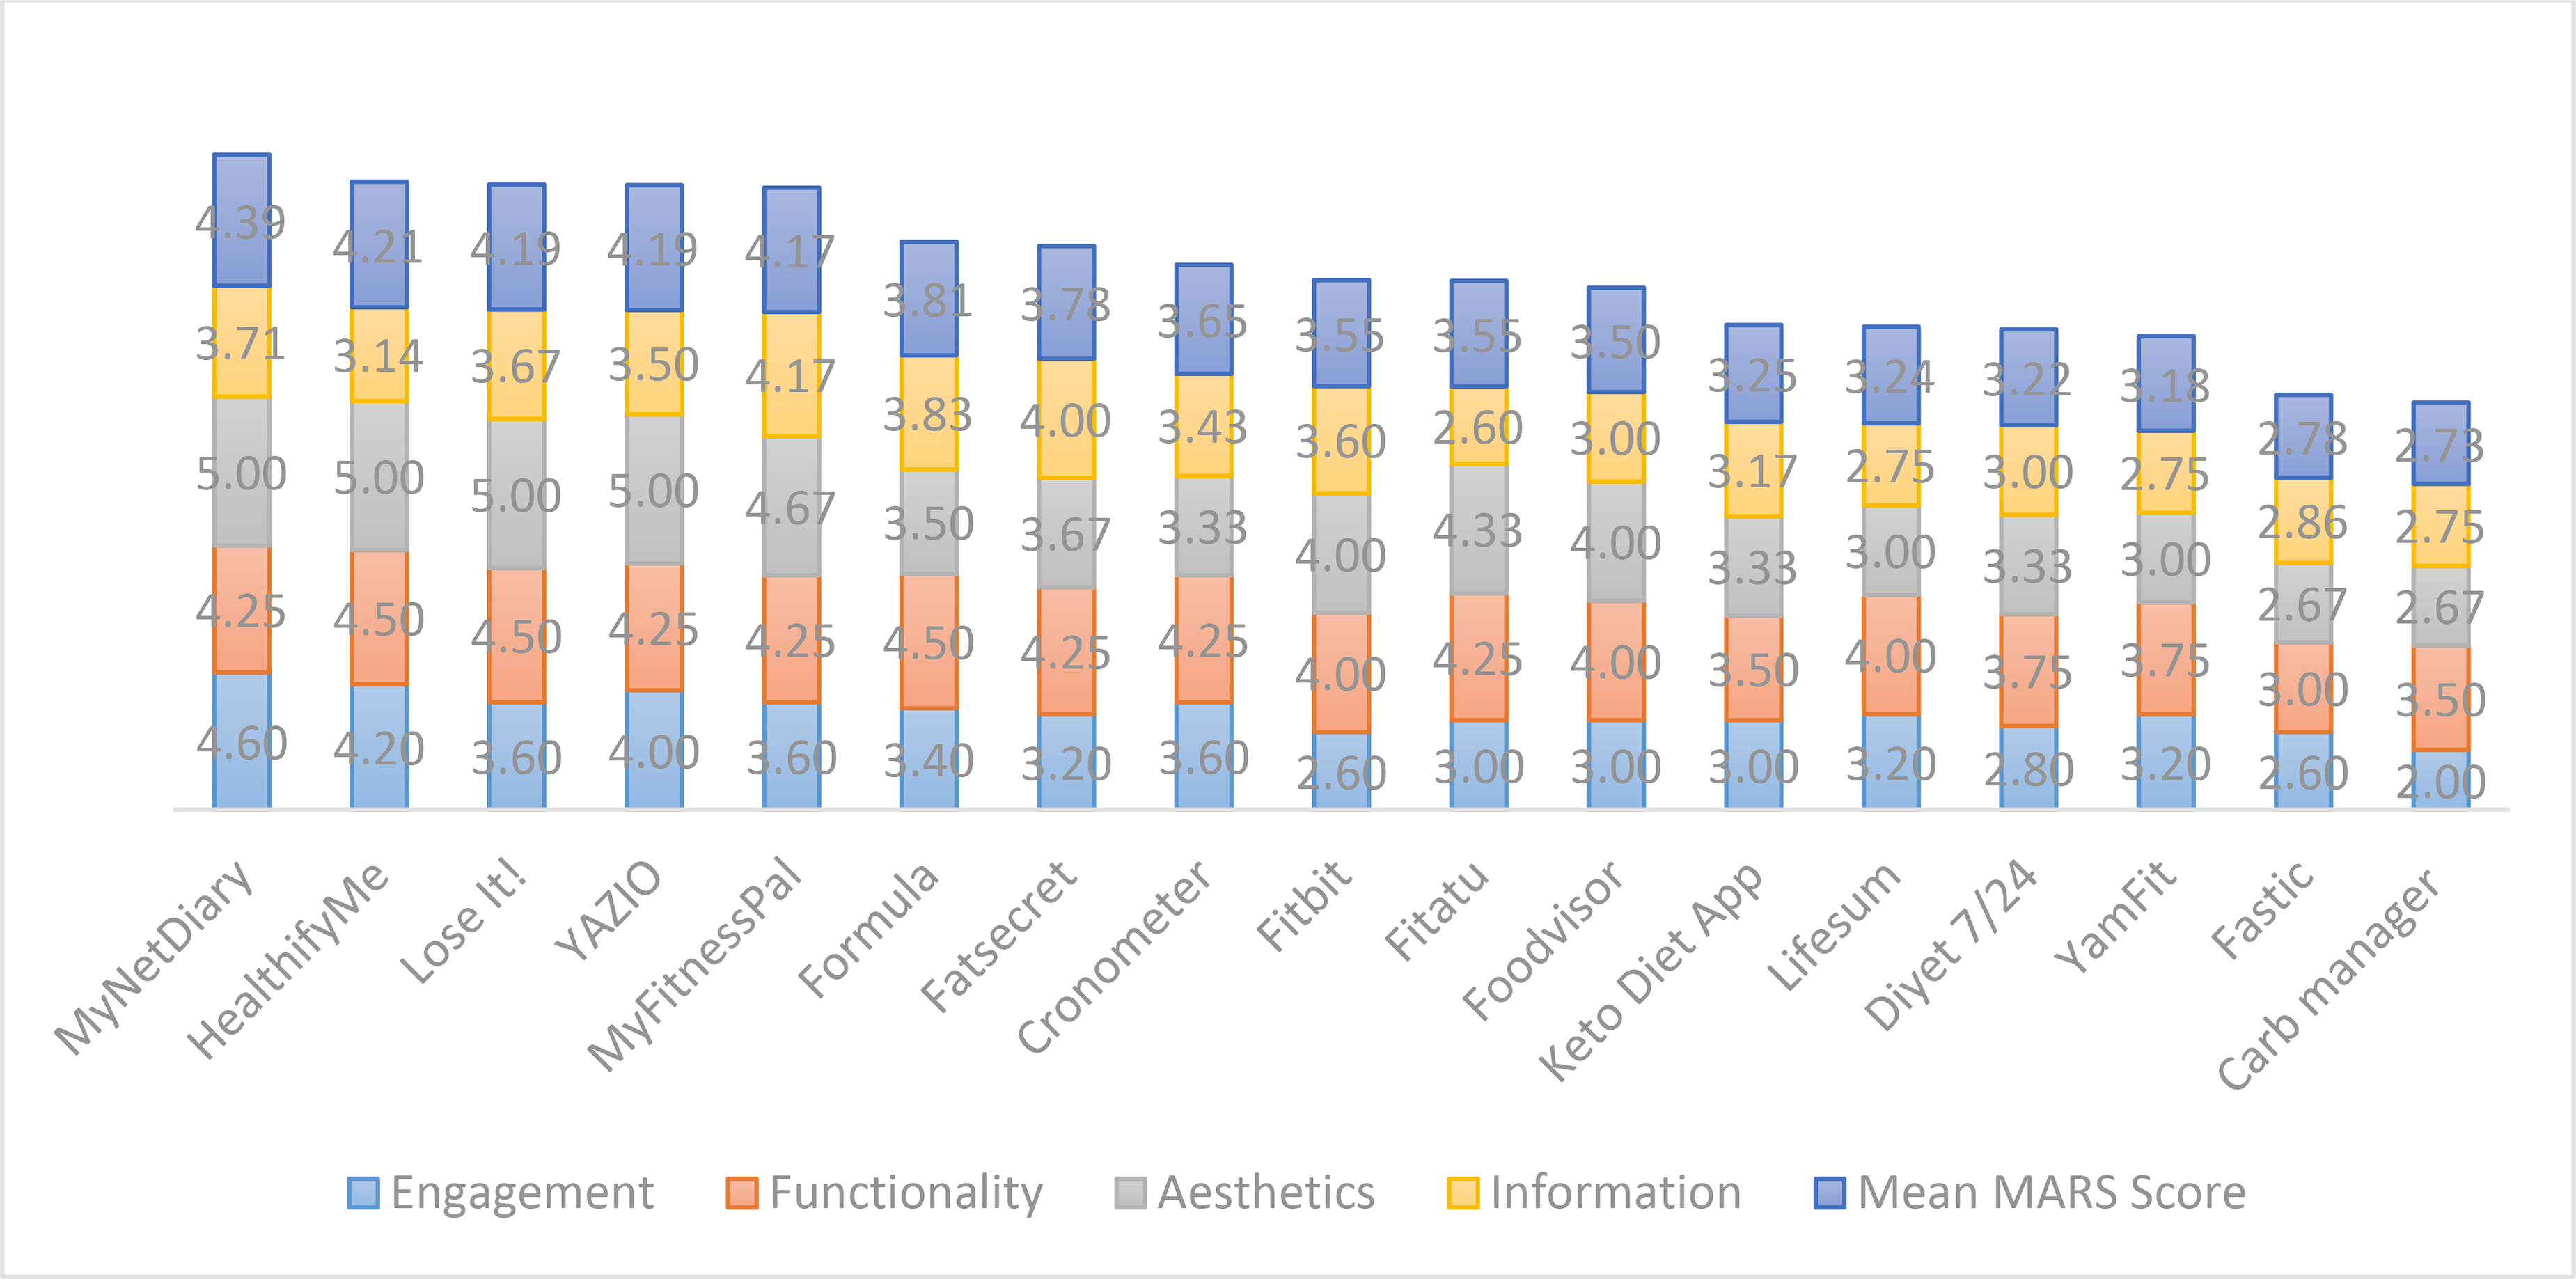
Evaluation of apps according to MARS section (n: 17). Ranked from highest to lowest overall MARS score. MARS: mobile application rating scale.
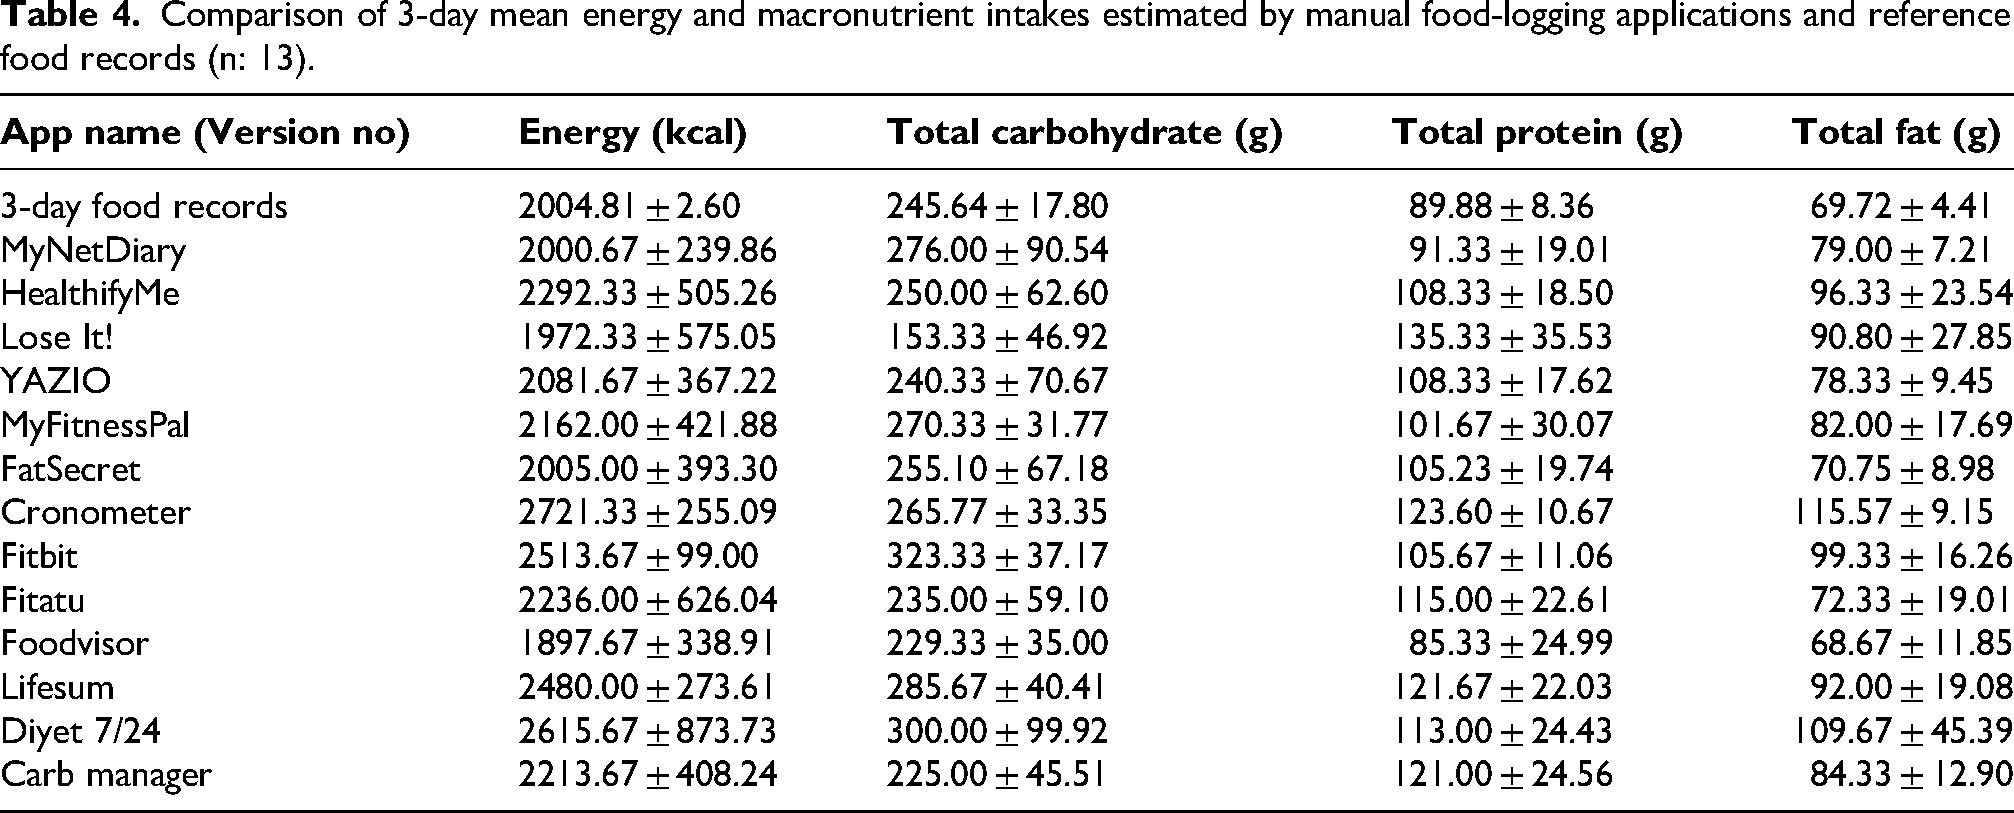
Table 4 presents the mean 3-day energy and macronutrient estimates from 13 manual food-logging apps compared with the reference 3D-FRs. Overall, 10 of the 13 apps overestimated energy intake relative to the 3D-FRs (2005kcal). Energy estimates ranged from 1897.67 to 2721.33 kcal, with Cronometer and Diyet 7/24 showing the largest deviations, while MyNetDiary and FatSecret demonstrated the closest agreement with the reference. Similar patterns were observed for macronutrients, with considerable variability across applications. Carbohydrate estimates ranged from 153.33 to 323.33 g, protein from 85.33 to 135.33 g, and fat from 68.67 to 115.57 g. Overall, a consistent tendency toward overestimation was observed across most applications, although the magnitude of deviation varied substantially between apps.
Comparison of 3-day mean energy and macronutrient intakes estimated by manual food-logging applications and reference food records (n: 13).
Among the 13 evaluated manual food-logging apps, 10 overestimated mean energy intake compared with the 3D-FRs, with differences ranging from −107 to +717 kcal. The 95% CIs were wide, spanning approximately from −1846 to +3067 kcal acros applications. Carbohydrate estimates ranged from −92 to +78 g (95% CI: −237 to +286 g), while protein intake was generally overestimated, ranging from −5 to +45 g (95% CI: −48 to +107 g). Total fat estimates ranged from −1 to +46 g (95% CI: −87 to +167 g), with substantial variability across applications (Figure 2).
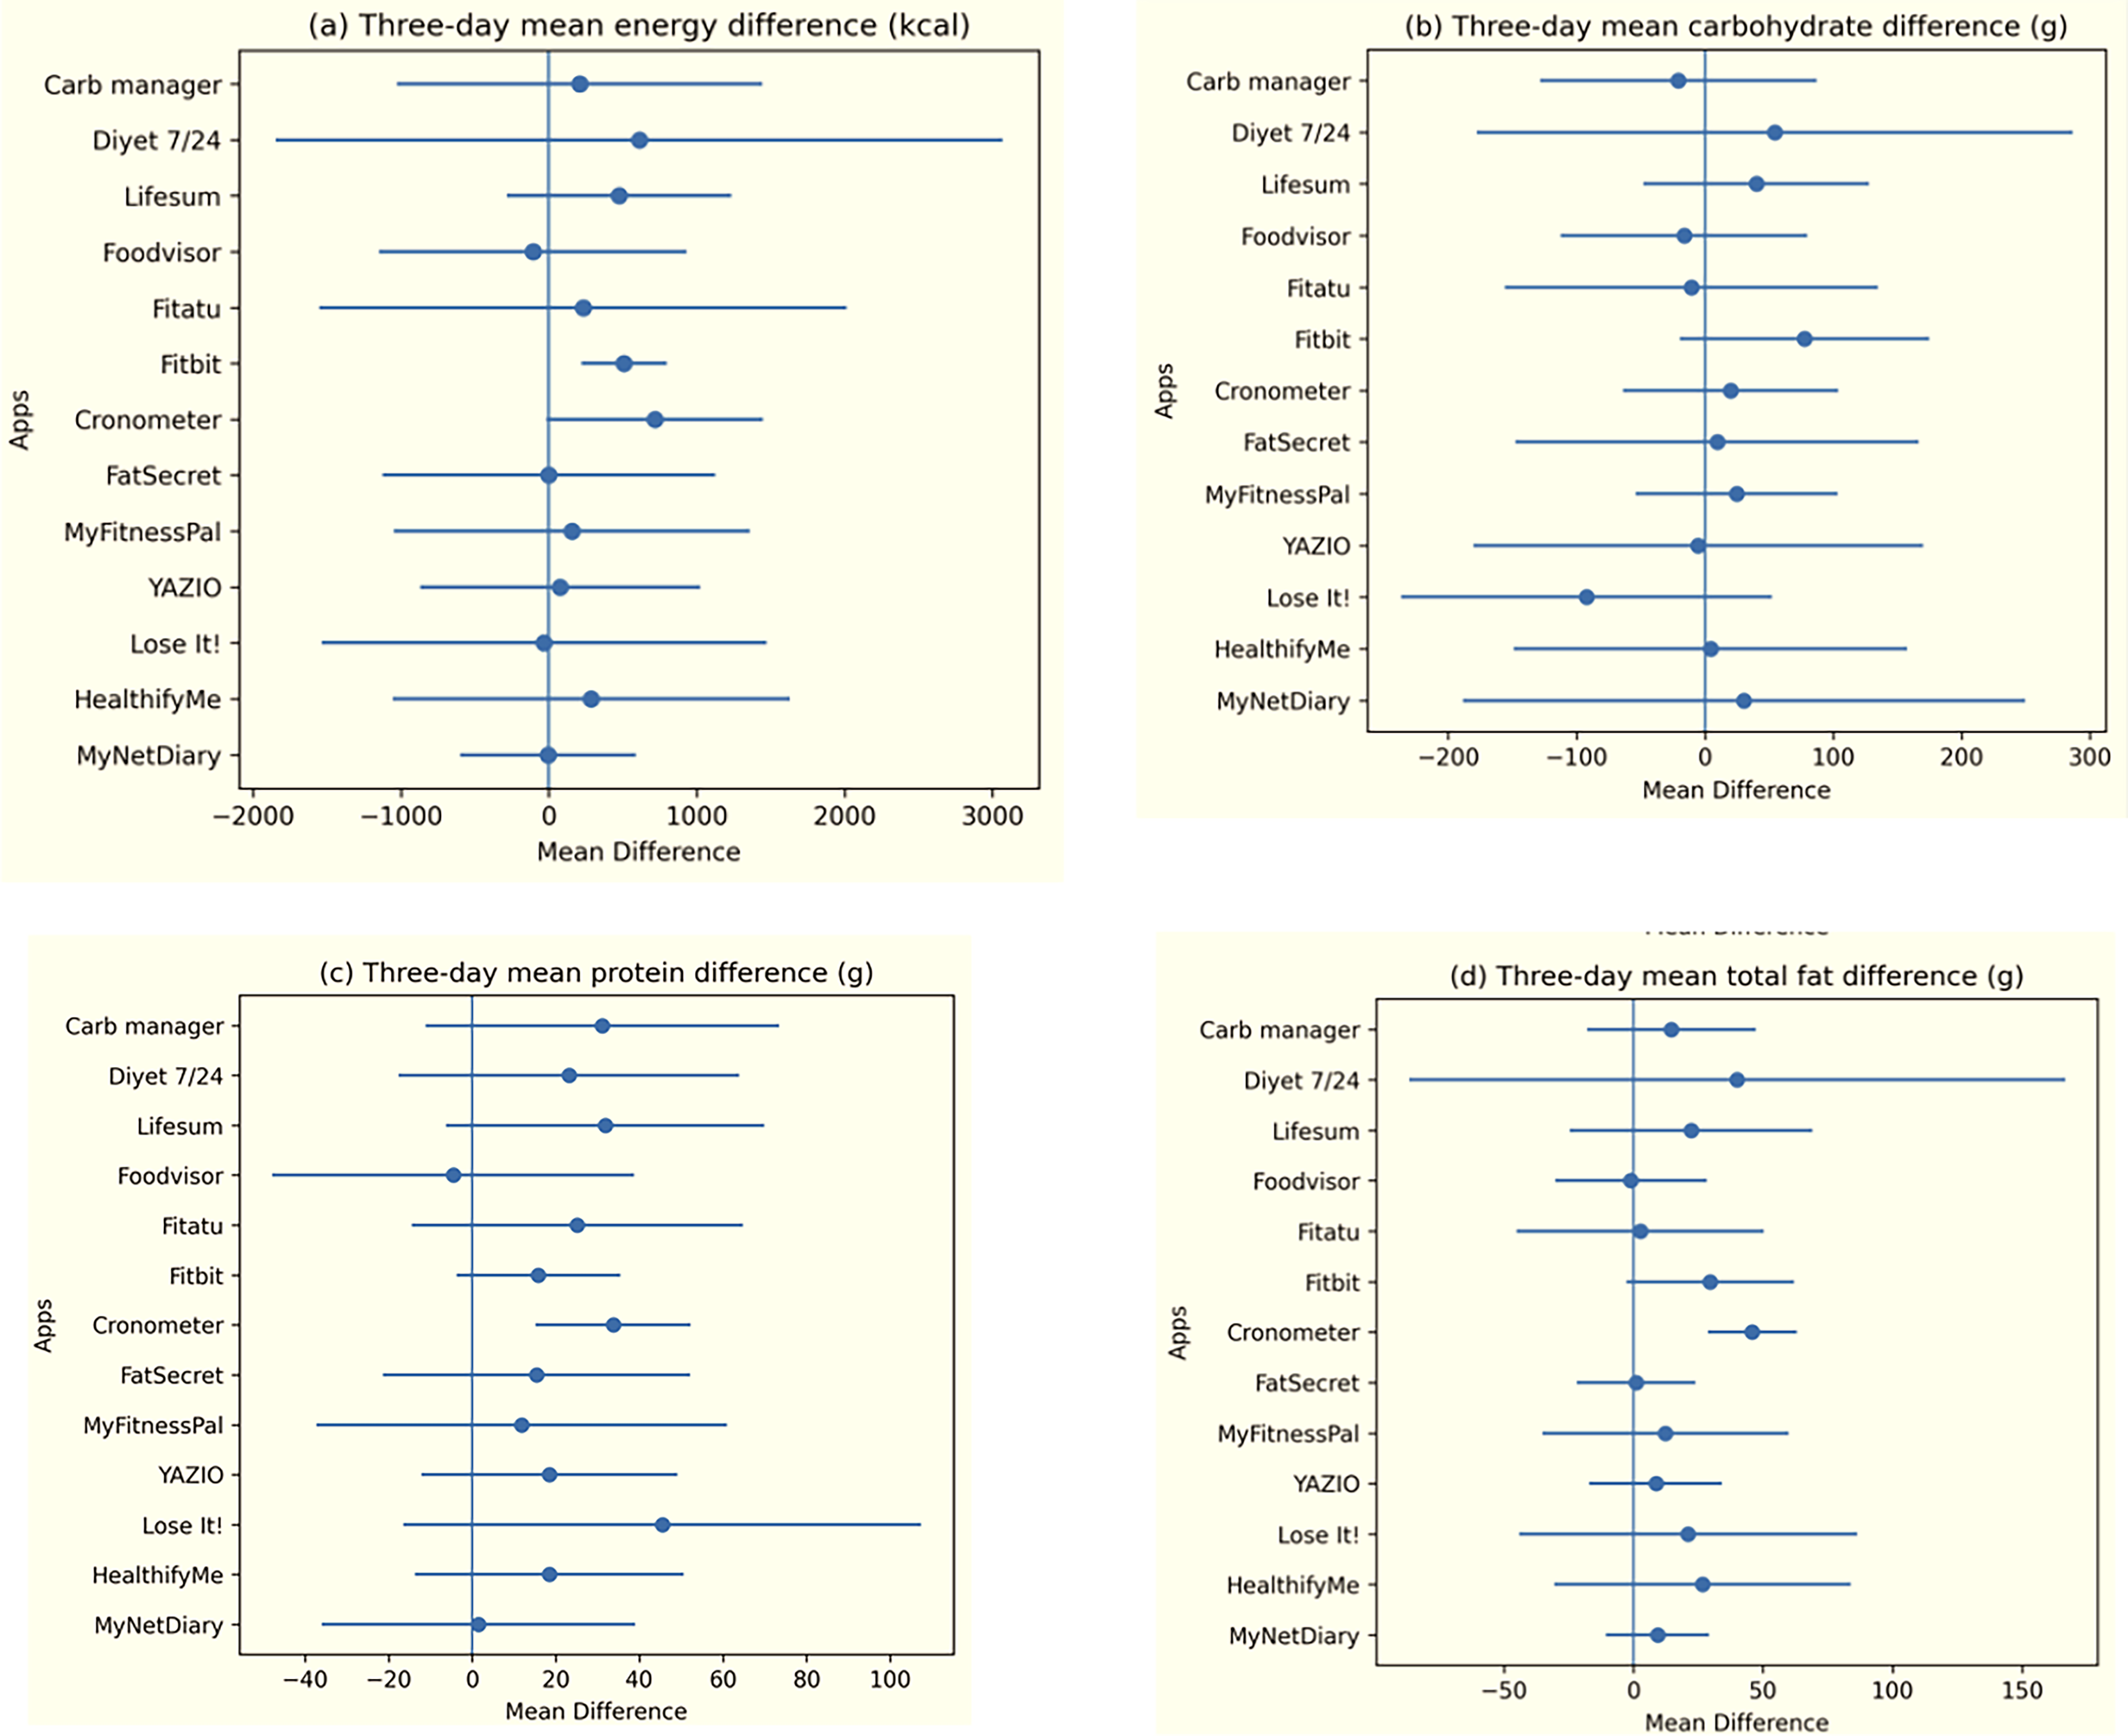
Three-day mean energy (kcal), CHO (g), protein (g), total fat (g) differences between manual food-logging applications (n: 13) and the reference 3-day food records, presented with 95% confidence intervals.
Bland–Altman analysis showed a mean bias for carbohydrate of +8.91 g (limits of agreement [LoA]: −73.00 to +90.83 g), whereas protein and fat showed positive biases of +20.55 g (LoA: −5.92 to +47.02 g) and +17.90 g (LoA: −10.89 to +46.70 g), respectively. For energy, Bland–Altman analysis showed a positive mean bias of +240.73 kcal, with limits of agreement ranging from −278.10 to +759.56 kcal. Percentage deviation analysis indicated the greatest deviations for Cronometer and Diyet 7/24, while MyNetDiary and FatSecret were closest to the reference (Figure 3).
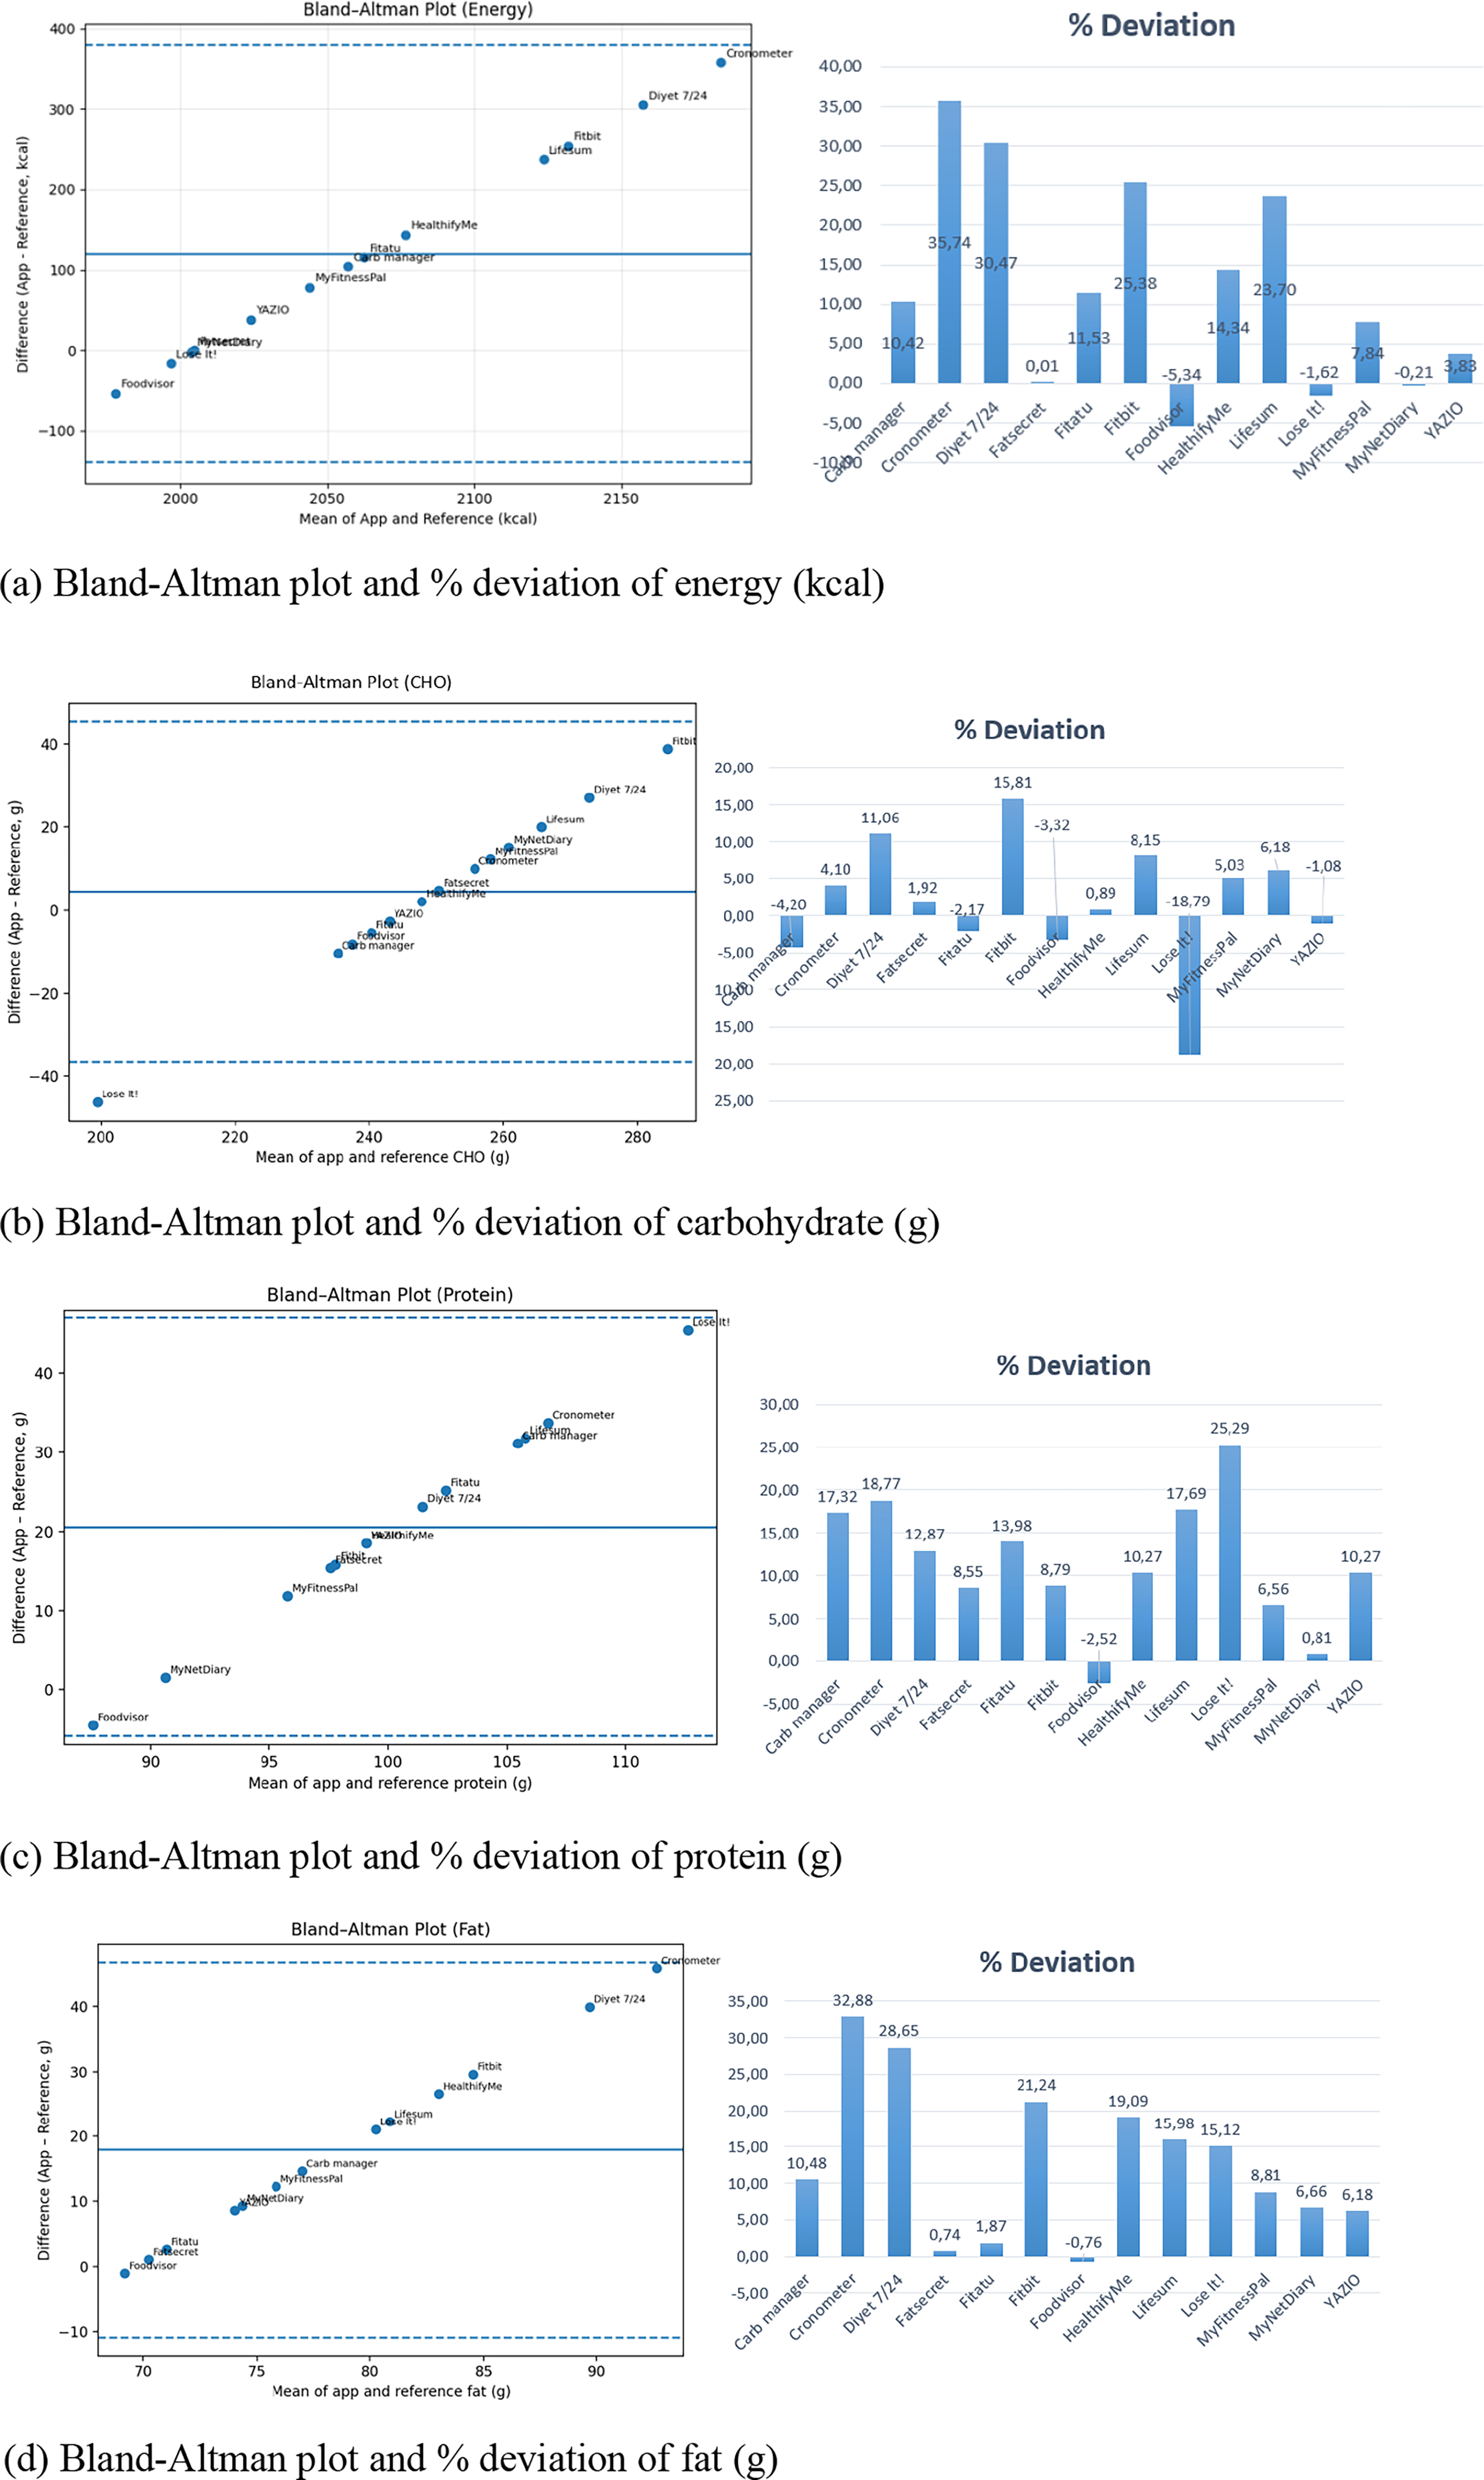
Bland–Altman plots and percentage deviation of energy and macronutrient estimates across applications. (a) Bland–Altman plot and percentage deviation of energy (kcal), (b) Bland–Altman plot and percentage deviation of carbohydrate (g), (c) Bland–Altman plot and percentage deviation of protein (g), and (d) Bland–Altman plot and percentage deviation of total fat (g).
Table 5 presents the association between app features, AI presence, MARS scores, and dietary accuracy. No consistent association was observed between feature count or AI integration and app performance. The MAE across applications was 262.85 kcal for energy. Corresponding MAE values were 31.25 g for carbohydrates, 21.24 g for protein, and 18.07 g for fat.
Association between app features, AI presence, MARS scores, and dietary accuracy.
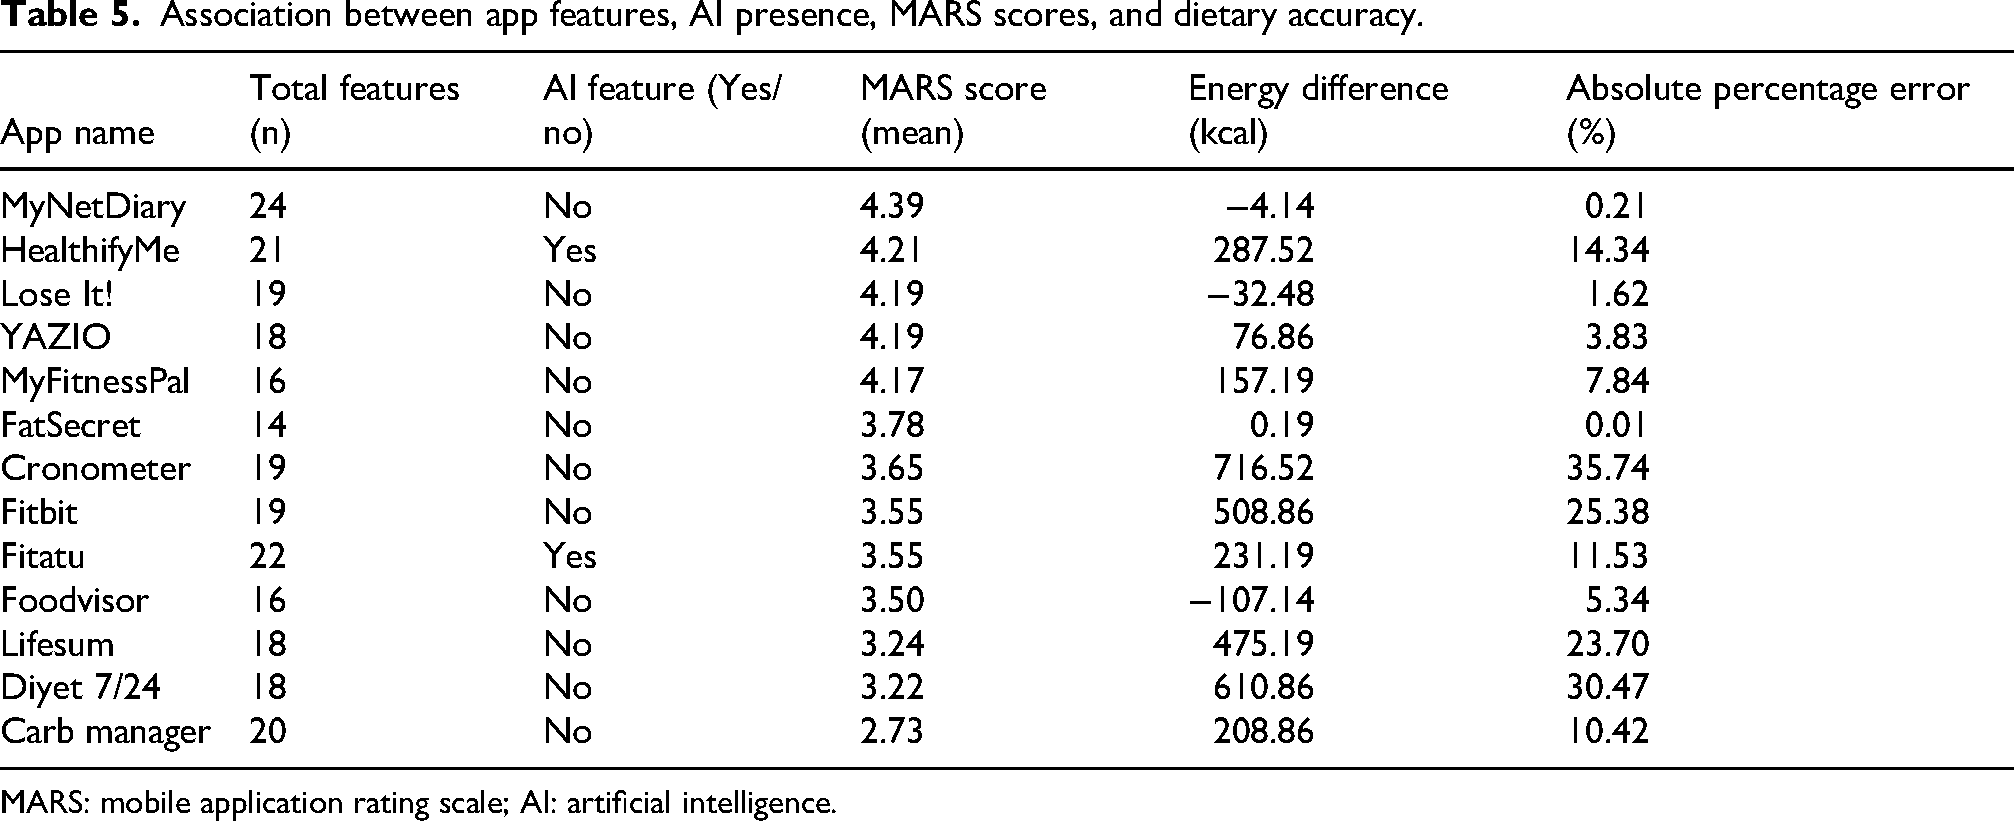
MARS: mobile application rating scale; AI: artificial intelligence.
Discussion
Our findings reveal striking discrepancies between manual food-logging applications and reference dietary records, underscoring significant concerns regarding the accuracy of these widely used digital tools. Among the 13 evaluated apps, 10 systematically overestimated daily energy values, with a mean deviation of approximately +327 kcal among these overestimating apps compared to the 3D-FRs. Importantly, these differences are of a magnitude that is clinically meaningful, as such deviations in daily energy intake may substantially influence weight management and chronic disease outcomes. Macronutrient estimates showed a similar pattern: carbohydrates were overestimated by a mean of 33 g, and protein by 23 g, while total fat values varied considerably across apps. Notably, some popular apps such as Cronometer and Diyet 7/24 produced the highest deviations, whereas MyNetDiary, and FatSecret consistently provided the closest alignment with the reference values. These results highlight a critical limitation: despite their popularity and convenience, most food-logging apps fail to deliver reliable dietary estimates, potentially leading to misguided nutrition decisions and undermining their utility in clinical and public health contexts. Importantly, this study represents the first systematic evaluation of nutrition-related mobile apps available in Türkiye, providing context-specific evidence that had previously been lacking in the literature. Beyond statistical differences, these findings have important practical implications. A mean overestimation of approximately 327 kcal per day may lead to substantial cumulative errors in dietary monitoring, potentially resulting in inappropriate dietary adjustments, misinformed self-management, or ineffective clinical guidance. This is particularly critical in weight management and chronic disease contexts, where even modest deviations in energy and macronutrient intake can influence clinical outcomes. Therefore, the observed discrepancies are not only methodological concerns but may also have clinically relevant implications for the potential use of these tools. Importantly, these findings reflect app performance under controlled data-entry conditions rather than real-world usage. The results primarily represent database-driven nutrient estimation accuracy and should not be directly generalized to user-based, real-life settings.
Given the growing popularity of mHealth applications for dietary monitoring, concerns persist regarding their accuracy, comprehensiveness, and integration of evidence-based features (Khazen et al., 2020; Ribaut et al., 2024). Our feature analysis revealed notable variability across applications in terms of dietary, tracking, insights, technical, educational, social, and AI-related functionalities. While all apps included basic dietary and tracking features, more advanced components – such as educational resources, social support, and AI-driven functionalities – were limited. MyNetDiary, Fitatu, and HealthifyMe were the most comprehensive, offering the broadest range of features, particularly in dietary monitoring, tracking, and insights. However, AI integration was observed in only a minority of apps, with Fastic, HealthifyMe, YamFit, Formula, and Fitatu incorporating at least one AI-based feature. This limited adoption of AI is noteworthy, given its potential to enhance personalization, automate food recognition, and reduce user burden, as highlighted in recent studies (Li et al., 2024; Samad et al., 2022). Despite the presence of technically advanced features in certain apps, the educational and social domains remained underdeveloped in most cases, echoing previous research that identified insufficient provision of evidence-based content and peer support (Bzikowska-Jura et al., 2021; Ribaut et al., 2024). Furthermore, our findings demonstrated that the presence of AI features did not correspond to improved nutritional accuracy, as no consistent association was observed between AI integration and app performance. This may be attributed to inherent limitations of current AI systems, which rely heavily on food composition databases, portion size estimation algorithms, and training datasets that may not adequately reflect real-world dietary diversity (Li et al., 2024; Samad et al., 2022). In particular, image-based recognition and automated estimation tools are prone to misclassification of mixed dishes and portion size inaccuracies, which can lead to systematic deviations in energy and macronutrient calculations. Taken together, these findings suggest that, despite their technological potential, current AI implementations in mHealth nutrition apps remain insufficient to ensure analytical accuracy and require further validation and context-specific adaptation.
Despite the increasing number of nutrition-related apps available in health and fitness categories, evaluating their scientific validity remains a major challenge for both researchers and practitioners (Khazen et al., 2020). It is also vital that healthcare professionals have clear guidance on how to review and assess health-related apps so that they can recommend the most suitable ones to their patients (Ribaut et al., 2024). However, to date, no framework or evaluation tool has been developed that fully fulfils this purpose. Although a recent study has proposed a comprehensive framework with extensive criteria, it still lacks sufficient clarity and practicality for routine use (Ribaut et al., 2024). Consequently, the MARS is still primarily used in most studies to evaluate engagement, functionality, aesthetics and information quality rather than clinical accuracy or evidence-based content. For example, a study found that 19 out of 23 popular apps (83%) had behaviour tracking features and addressed weight control, diet, and physical activity. On a 5-point MARS scale, the apps were rated as average in terms of quality, with ‘functionality’ being the highest and ‘information’ being the lowest (Bardus et al., 2016). In another study evaluating 29 apps, the average MARS score was 2.95 out of 5. ‘Aesthetics’ and ‘information’ received the highest average scores, while ‘subjective quality’ received the lowest score (Choi et al., 2021). Similarly, in a more recent study of 18 apps, ‘aesthetics’ and ‘functionality’ achieved the highest average scores, whereas ‘engagement’ and ‘information’ were rated the lowest (Li et al., 2024). In our analysis of 17 apps, the mean MARS score was 3.61, with the highest average (4.03) in the ‘functionality’ domain and the lowest (3.27) in ‘engagement’. Interestingly, while Bardus et al. (2016) reported ‘functionality’ as the highest and ‘information’ as the lowest scoring domain, later studies such as Choi et al. (2021) and Li et al. (2024) found ‘aesthetics’ and ‘functionality’ to score highest, with ‘engagement’ and ‘information’ consistently rated lower. Compared with these findings, our results align more closely with the latter studies, suggesting that recent apps may place a stronger emphasis on visual appeal in addition to functionality. This divergence highlights the evolving design priorities of health apps, yet it also underlines a persistent shortcoming: the insufficient provision of evidence-based information and meaningful user engagement. Additionally, an important finding of this study is that high MARS scores did not correspond to higher nutritional accuracy. Several apps with strong performance in functionality and aesthetics still showed substantial deviations in energy and macronutrient estimates. This suggests that commonly used app quality metrics primarily capture user experience and design features rather than scientific validity. Therefore, app quality and nutritional accuracy should be considered as distinct dimensions, highlighting the need for evaluation frameworks that integrate both usability and evidence-based accuracy.
While users choose health apps based on their perceived design quality and ease of use (Kim et al., 2024; Peng et al., 2016; Xie and Or, 2023), very few studies have evaluated the scientific parameters of apps in terms of their evidence-based and theoretical principles. Chen et al. (2015) reported that, of the 23 applications calculating energy intake, the average absolute difference compared with 3-day weighed food records was 127 kJ (95% CI: −45 to 299), with the greatest inconsistencies observed in FatSecret, and Points Calculator & Weekly Weight Loss apps (Chen et al., 2015). In another study, LifeSum demonstrated the highest deviation in energy values, overestimating calorie intake by 7.29% compared with the United States Department of Agriculture (USDA) Food Composition Databases. On average, apps slightly overestimated carbohydrate intake by 1.0% relative to the USDA reference. Except for Lose It!, which slightly underestimated protein intake, most apps substantially overestimated protein, with a mean difference of 10.4%. In contrast, fat intake was underestimated by an average of 6.5%. Among the evaluated apps, MyFitnessPal demonstrated the highest accuracy in coding calories and macronutrients against the USDA reference, whereas LifeSum was the least accurate (Ferrara et al., 2019). Similarly, Bzikowska-Jura et al. (2021) found substantial variation in macronutrient accuracy across apps. For carbohydrates, FatSecret and Fitatu showed the best agreement with reference values, while Dine4Fit was the most accurate for protein. Conversely, YAZIO displayed the largest discrepancy, underestimating protein intake. Regarding fat, Fitatu reported the smallest bias, whereas FatSecret exhibited the greatest underestimation. Importantly, none of the evaluated apps consistently achieved accurate estimates across all macronutrients, with only 20% to 40% of outputs falling within the clinically acceptable ±5% margin (Bzikowska-Jura et al., 2021). Li et al. (2024) reported that manual logging apps estimated energy intake differently depending on diet type – overestimating Western diets by approximately 1040 kJ and underestimating Asian diets by about −1520 kJ. For the Recommended diet, all apps underestimated energy intake, with a mean difference of −944 kJ compared with 3D-FRs. For both the Asian and Recommended diets, Cronometer showed the closest alignment with reference macronutrient percentages, while MyFitnessPal also performed relatively well. In contrast, Fastic showed the greatest discrepancies. According to our findings, 10 of the 13 applications overestimated mean energy intake compared with the 3D-FRs, with a mean difference of +327 kcal. FatSecret and MyNetDiary provided values closest to the reference, with minimal deviation. Carbohydrate intake was overestimated by 8 of the 13 apps (mean difference +33 g), with Fitbit and Diyet 7/24 yielding the highest estimates, while Lose It! substantially underestimated carbohydrate intake. Protein values were also generally overestimated, with 12 of the 13 apps reporting higher intakes than the 3D-FRs, resulting in a mean difference of +23 g. The largest overestimations occurred in Lose it!, whereas MyNetDiary provided the most consistent estimates. Total fat intake estimates varied widely: 12 of the 13 apps overestimated fat intake, with a mean difference of +19 g. Cronometer and Diyet 7/24 produced the greatest positive deviations, while FatSecret and Foodvisor yielded values closest to the reference. Taken together, these findings highlight a recurring pattern across the literature: while certain apps often provide relatively accurate estimates, significant variability persists across platforms, with systematic overestimation of carbohydrates and protein and inconsistent accuracy for fat. Our results, in line with previous research, emphasize the need for greater standardization and validation of nutrition apps to ensure their reliability for both clinical and public health use.
These discrepancies can be explained by several underlying mechanisms of error reported in previous validation studies. One major source is the variability in food composition databases across applications, including differences in nutrient values, food definitions, and update frequency (Bzikowska-Jura et al., 2021; Ferrara et al., 2019). In addition, portion size estimation represents a critical challenge, as both user-reported entries and automated estimations may lead to systematic overestimation or underestimation of intake. Errors in food matching and classification, particularly for mixed or composite dishes, further contribute to inconsistencies between app-based and reference values. These factors may also explain why certain applications, such as Foodvisor and FatSecret, demonstrated closer agreement with reference values in our study, whereas others like Cronometer and Diyet 7/24 showed larger deviations. Previous research similarly suggests that apps with more standardized databases and simpler input structures tend to yield more accurate results, while greater database complexity and user-generated entries may increase variability (Ferrara et al., 2019). Taken together, these findings indicate that differences in database quality and estimation methods, rather than the number of features alone, are key determinants of nutritional accuracy, with potential downstream implications for clinical use and dietary decision-making.
From a clinical perspective, the observed average daily energy surplus of approximately +327 kcal is not an inconsequential estimate. It has been demonstrated that a sustained positive energy imbalance of this extent contributes to gradual weight gain over time; no matter how small the daily energy surplus may be, it leads to significant increases in body weight in the long term (Hall et al., 2012). It is estimated that a chronic excess of approximately 100–300 kcal/day could lead to an annual weight gain, depending on individual metabolic adaptations (Martins et al., 2021). Such unintended energy surplus is clinically relevant, as excess body weight is a major risk factor for cardiometabolic diseases, including type 2 diabetes, hypertension, and cardiovascular disease (WHO, 2021). In clinical settings where precise nutritional monitoring is critical – such as obesity management, diabetes care, and the reduction of cardiovascular risk – the systematic overestimation of energy values can lead to inappropriate dietary recommendations, reduced intervention effectiveness, and impaired metabolic control. Therefore, such errors should be considered not only as methodological limitations but also as clinically significant risks.
This study has several limitations. First, the evaluation was restricted to iOS-based applications available in the Turkish Apple App Store, which may introduce platform-selection bias and limit the generalizability of the findings to Android applications and other markets. This limitation is particularly relevant given that Android currently dominates the global mobile operating system market, meaning that the apps evaluated here may not reflect the nutrition-related apps most widely used by the global majority of smartphone users. Moreover, differences in app catalogues, regional availability, feature parity, food composition databases, pricing models, and update cycles between iOS and Android ecosystems may influence both app quality and nutritional accuracy. Therefore, the present findings should be interpreted as platform-specific evidence rather than a comprehensive evaluation of the broader mHealth nutrition app landscape. Second, only free-to-download apps with functional food-logging features were included, excluding fully paid apps that might offer more comprehensive functionalities. Third, dietary intake validation was based on a limited number of standardized menus rather than real-life dietary records, which may not fully capture user variability and diverse eating patterns. Fourth, while the MARS tool provides a standardized approach to app quality assessment, it relies partly on subjective judgments that may introduce evaluator bias. Finally, although a large number of apps were initially identified (n: 807), only a small subset (n: 17) met the predefined inclusion criteria and were suitable for detailed evaluation. This substantial reduction reflects the high heterogeneity of nutrition-related mobile applications, many of which lacked sufficient functionality, relevance to dietary assessment, or the ability to generate analysable #outputs. Therefore, the final sample should be interpreted as representing a functionally eligible subset rather than the entire app market.
Despite these limitations, the study has several strengths. It represents the first systematic evaluation of nutrition-related mobile applications in Türkiye, addressing an important gap in the literature by incorporating both quality assessment and dietary intake validation. The use of the validated Turkish version of the MARS tool enhances the reliability of app quality ratings in this context. Moreover, the comparison of app-generated dietary estimates with standardized 3D-FRs provides robust evidence regarding the accuracy of these digital tools. The study also highlights the current state of AI integration in nutrition apps, offering insights into future directions for improving personalization, engagement, and accuracy.
Conclusion
This study provides the first systematic evaluation of nutrition-related mobile apps available in Türkiye, offering critical insights into their quality, functionalities, and accuracy in estimating dietary intake. While many apps demonstrated strong performance in engagement and usability according to the MARS, the accuracy of energy and macronutrient estimates varied considerably across applications when compared with standardized food records. These findings highlight the necessity of cautious use of nutrition-related mobile apps in both clinical practice and public health contexts, as inaccuracies may contribute to misguided dietary decisions. Future app development should prioritize improving accuracy, ensuring alignment with national dietary guidelines, and integrating advanced AI-driven features to enhance personalization, user engagement, and overall effectiveness. By addressing these gaps, digital nutrition tools can better support evidence-based dietary assessment and intervention strategies in Türkiye and beyond.
Moreover, these findings have important relevance for public health policy, clinical nutrition practice, and digital health governance in Türkiye. Given the observed variability in nutritional accuracy, greater attention may be needed regarding the validation and oversight of widely used nutrition applications, particularly those used for weight management and chronic disease monitoring. From a clinical perspective, healthcare professionals should exercise caution when recommending such tools, as usability and design quality may not reflect analytical accuracy. At a broader level, these findings suggest the need for more structured evaluation frameworks and potential integration of validated digital tools into preventive health strategies. In this context, digital nutrition applications may be considered as emerging components of a wider transition toward data-driven and preventive healthcare systems, where their effectiveness depends on both technological performance and regulatory alignment.
Supplemental Material
sj-docx-1-nah-10.1177_02601060261469016 - Supplemental material for Quality and nutritional accuracy of mHealth nutrition apps in Türkiye: A validation study using food records
Supplemental material, sj-docx-1-nah-10.1177_02601060261469016 for Quality and nutritional accuracy of mHealth nutrition apps in Türkiye: A validation study using food records by Hatice Merve Bayram and Arda Ozturkcan in Nutrition and Health
Footnotes

Ethical approval and informed consent
Not necessary.
Consent for publication
The authors give permission for the Journal to publish this work.
Authors’ contributions
HMB contributed to conceptualization, methodology, data curation, software, and writing – reviewing and editing; AO contributed to conceptualization, methodology, and reviewing and editing. All authors critically revised the manuscript and approved the final version of the paper.
Funding
The authors received no financial support for the research, authorship, and/or publication of this article.
Declaration of conflicting interests
The authors declared no potential conflicts of interest with respect to the research, authorship, and/or publication of this article.
Data availability
Provision of data on request to the corresponding author.
Supplemental material
Supplemental material for this article is available online.
References
Supplementary Material
Please find the following supplemental material available below.
For Open Access articles published under a Creative Commons License, all supplemental material carries the same license as the article it is associated with.
For non-Open Access articles published, all supplemental material carries a non-exclusive license, and permission requests for re-use of supplemental material or any part of supplemental material shall be sent directly to the copyright owner as specified in the copyright notice associated with the article.
