
Abstract
Liver cell lines obtained from hepatomas, for example, HepG2 cells, are commonly used in drug toxicity studies. However, functional hepatocyte-like cells derived from mesenchymal stem cells (MSCs) could be a better option for use in the study of drug metabolism and toxicity. Overdose of acetaminophen (APAP) and excess alcohol consumption are common causes of liver damage. The objective of the present study was to investigate the use of MSC-derived hepatocyte-like cells (MSCdH) in the assessment of drug-induced liver injury (by using APAP and ethanol), and to compare the toxic effects observed in the MSCdH with those exhibited by HepG2 cells. MSCs were isolated from umbilical cord and their functionality confirmed by their ability to differentiate into adipocytes, osteocytes and hepatocyte-like cells. It was shown that the MSCs successfully differentiated into hepatocyte-like cells, and these cells were further characterised by using various enzyme assays and by assessing albumin secretion and urea synthesis. Cytotoxicity was evaluated in the HepG2 and MSCdH after exposure to ethanol and APAP, with cell viability being determined by using the MTT assay. After exposure to ethanol and to APAP, cell viability decreased in a concentration-dependent manner for both types of hepatocytes. The respective EC50 values of ethanol-induced toxicity for HepG2 and MSCdH cells were 2.5% and 1.3% v/v (p < 0.001); for APAP-induced toxicity they were 19.1 mM and 12.6 mM (p < 0.001). These findings show that there is a distinct difference between the two types of hepatocytes in terms of APAP-induced and ethanol-induced liver injury.
Keywords
Introduction
The liver is the principal organ involved in xenobiotic metabolism. Acute liver failure can occur through toxins, drugs or pathogenic infections. 1 Excess alcohol consumption 2 and acetaminophen (APAP) overdose 3 are common causes of liver damage. In such cases, oxidative stress caused by reactive oxygen species (ROS) and reactive nitrogen species (RNS) leads to the oxidation of cellular macromolecules, causing liver damage.4,5 Chronic alcoholism produces ROS as a result of the induction of cytochrome P450 (CYP) 2E1 enzyme (CYP2E1), and RNS are generated by the induction of inducible nitric oxide synthase (iNOS). 6 N-acetyl-p-benzoquinone imine (NAPQI), which is a toxic metabolic product of APAP, is generated by the action of CYP2E1, CYP1A2 and CYP2D6. 7 Excessive NAPQI formation, as a result of APAP overdose, depletes cellular glutathione (GSH) which affects the antioxidant mechanisms in the cell. 8
Variation in the expression of drug-metabolising enzymes and transporters has been observed between hepatic cancer cell lines and primary hepatocytes. 9 HepG2 is a cancer cell line commonly used as in vitro model in pharmacological, toxicological and drug discovery studies.9,10 Medine et al. 11 reported that human hepatic tumour-derived cell lines contain low levels of drug-metabolising enzymes, and do not possess normal or stable karyotypes.11,12
In the current study, we compared the use of two hepatocyte models, HepG2 cells and mesenchymal stem cell-derived hepatocyte-like cells (MSCdH), in the evaluation of ethanol-induced and APAP-induced liver injury.
Materials and methods
Reagents
Recombinant human hepatocyte growth factor (HGF; Cat. No. PHG0324), recombinant human fibroblast growth factor-basic (bFGF; Cat. No. PHG0266), epidermal growth factor (EGF; Cat. No. G5021), and mesenchymal stem cell-qualified fetal bovine serum (FBS-MSC; Cat. No. 12664025) were purchased from Invitrogen (Australia). Human oncostatin M (209aa; Cat. No. SRP3130), dexamethasone (Cat. No. D4902), Dulbecco’s Modified Eagle’s Medium, high glucose (DMEM-HG; Cat. No. D5648), Dulbecco’s Modified Eagle’s Medium, low glucose (DMEM-LG; Cat. No. D2902), Minimum Essential Medium Eagle, Alpha Modification (Alpha-MEM; Cat. No. M0644), Periodic Acid-Schiff (PAS) Staining Kit (Cat. No. 395B),
Equipment
An Olympus (1X70-S1F2) inverted fluorescence microscope (Olympus Optical Co. Ltd, Tokyo, Japan) was used to observe cell morphology; the images were captured with a digital camera (MDC 200, USB 2.0, 2 M pixels with CCD chip). An ESCO Class II biosafety cabinet (BSC) (AirStream, CenEN 124469, ULPA filter, protected by ISOCIDE Tm, green product) and ESCO cell culture CO2 incubator were used for the cell culture work.
Isolation of mesenchymal stem cells
The protocol for the study was approved (No. EC/14/167) by the Ethical and Scientific Committee, Faculty of Medicine, Colombo, Sri Lanka. Mesenchymal stem cells (MSCs) were isolated according to the explant method, as described previously. 13 A segment of umbilical cord was transported to the laboratory and cut into small pieces, which were then transferred into T75 tissue culture flasks (UltraCruz® Cell Culture Flasks with Vented Caps; Cat. No. sc-200263; Santa Cruz Biotechnology, Dallas, TX, USA) containing 15–20 ml of DMEM-HG. The flasks were incubated at 37°C in a humidified atmosphere with 5% v/v CO2. Spent medium was replaced with fresh medium every 3–4 days, until the appearance of fibroblast-like cells at 70–80% confluence. All the above steps were carried out under sterile cell culture conditions.
Functional characterisation of the mesenchymal stem cells
Functional characterisation of the MSCs, with regard to their multipotency, was carried out by assessing their ability to differentiate into adipocytes, osteocytes and hepatocyte-like cells. 14
Adipogenic differentiation
The MSCs were cultured in adipogenic differentiation medium (Alpha-MEM supplemented with 10% v/v FBS, 1 mM dexamethasone, 10 mg/ml insulin and 100 mM indomethacin) for a total of 21 days, with the medium replaced every 3–4 days. Cells were washed three times with 1× phosphate-buffered saline (PBS) solution and then fixed for 5 minutes in 10% formaldehyde. Oil Red O stock solution (0.5% v/v in isopropanol) was diluted with deionised water (3:2) and filtered through a 0.22 μm filter. Cells were incubated with 300 μl of Oil O Red solution, for 1 hour at room temperature. Cells were rinsed four times with deionised water to remove the excess stain. 15
Osteogenic differentiation
The MSCs were cultured in osteogenic differentiation medium (Alpha-MEM supplemented with 10% FBS, 0.1 mM dexamethasone, 10 mM glycerol-2-phosphate, 2 mM
Hepatic differentiation
Hepatic differentiation was carried out as described previously, with slight modifications.17,18 Serum depletion was firstly carried out by culturing the MSCs for 2 days in DMEM-LG medium only, and then for two more days in DMEM-LG supplemented with epidermal growth factor (EGF; 30 ng/ml) and basic fibroblast growth factor (bFGF; 20 ng/ml). Hepatic differentiation was then carried out as a two-step protocol.
In the first step, the cells were cultured in differentiation medium, consisting of DMEM-LG supplemented with 40 ng/ml hepatocyte growth factor (HGF), 20 ng/ml bFGF and 0.61 g/l nicotinamide, for 10 days. In the second step (after the initial 10-day culture period), the differentiation medium was replaced with hepatic maturation medium, consisting of DMEM-LG supplemented with 20 ng/ml oncostatin M, 5 ng/ml HGF, 1 mM dexamethasone, 1 mg/ml insulin and 100 mM sodium pyruvate. The differentiation of MSCs into hepatocyte-like cells was confirmed by assessing the levels of albumin and urea, and the activity of the hepatic enzyme markers, alanine aminotransferase (ALT) and γ-glutamyltransferase (γ-GT), in the spent culture medium at the following time points: 2, 7, 14, 21, 28 and 35 days, by using commercially available kits (from HUMAN Gesellschaft für Biochemica und Diagnostica mbH, Wiesbaden, Germany) according to the manufacturer’s instructions.
Periodic Acid-Schiff (PAS) staining was also carried out at the final stage (i.e. after 35 days in culture), to detect glycogen accumulation. Briefly, cells were fixed with 4% paraformaldehyde solution and incubated in periodic acid for 5 minutes at room temperature. Cells were washed with distilled water and incubated in Schiff’s reagent for 15 minutes; haematoxylin counterstaining was performed for 90 seconds. The cells were used for the cytotoxicity experiments after this final confirmation of hepatic differentiation after 35 days in culture.
HepG2 cell culture
The HepG2 (human liver hepatoma) cell line was donated by Dr Panjwani Center for Molecular Medicine and Drug Research (PCMD), University Karachi, Pakistan. The cells were cultured in standard Minimum Essential Medium Eagle, supplemented with 10% (v/v) FBS, 3% (v/v)
The toxicity of ethanol and APAP to HepG2 cells and MSC-derived hepatocyte-like cells
Both cell types were trypsinised by using 0.25% (w/v) trypsin solution (1–2 ml per flask) for 2–3 minutes at 37°C. The flask was tapped gently to detach the cells and observed under the inverted microscope to confirm the detachment. Cells were seeded at 2 × 10⁵ cells per well in 24-well plates (Nunc™ Nunclon Cell Culture-treated Multiwell Dish [with round wells and lid]; Cat. No. 142475; Thermo Fisher Scientific, Waltham, MA, USA), and allowed to form a confluent monolayer by incubating overnight in 37°C in a 5% CO2 atmosphere. Cells were treated with different concentrations of ethanol (0.5–4% v/v) for 24 hours 19 or with different concentrations of APAP (5 mM–30 mM) for 24 hours. Untreated cells, cultured in standard medium, were classed as the negative controls. The APAP and ethanol experiments were carried out separately, to discount any potential interference caused by ethanol evaporation within the culture environment. Cell viability was determined by using the 3-(4,5-dimethyl-2-thiazolyl)-2,5-diphenyl-2H-tetrazolium bromide (MTT) colorimetric assay, as described by Mosmann, 20 with modifications described by Perera et al. 21 The percentage cell viability, relative to the negative control, was calculated by using the following formula:
% Cell viability = (Absorbance of the sample/Absorbance of the negative control) × 100
Calculations and statistics
All experiments were carried out with triplicate samples, unless otherwise stated. The calibration curves were considered linear if R 2 > 0.99. The EC50 values were calculated from either linear or non-linear dose–response curves, where R 2 > 0.95 was considered as the best fit. The Student’s t-test was used to evaluate the level of significance, and p < 0.05 was considered statistically significant. All mathematical calculations were carried out with Microsoft Excel® 2010.
Results
Isolation and characterisation of MSCs
The multipotent nature of MSCs was evaluated by assessing their ability to differentiate into osteocytes and adipocytes, which was confirmed by using the relevant dyes (Figure 1). Cells cultured in the standard MSC maintenance medium (DMEM-HG) exhibited a fibroblast-like spindle shape, which is an indicator of undifferentiated MSCs (Figure 1(a) and (b)). Osteogenic differentiation of the MSCs was evident by the characteristic staining of calcium deposits in the cytoplasm with Alizarin Red after 21 days of culture in osteogenic differentiation medium (Figure 1(c)); undifferentiated MSCs (Figure 1(a)) exhibited no Alizarin Red staining. Adipogenesis was assessed with Oil Red O staining after culturing the MSCs in adipogenic differentiation medium for 21 days, with results showing that the umbilical cord-derived MSCs were positive for stained lipid droplets in the cytoplasm after this culture period (Figure 1(d)); no Oil Red O-stained areas were observed in cells cultured in the standard MSC maintenance medium (DMEM-HG) (Figure 1(b)). The morphological appearance of differentiated mesenchymal stem cells. (a) and (c) show the differentiation of mesenchymal stem cells (MSCs) into osteocytes, detected with Alizarin Red staining; (b) and (d) show adipogenesis, detected with Oil Red O staining. The arrows highlight the characteristic calcium accumulation and lipid droplets, respectively. The images in (a) and (b) show undifferentiated MSCs cultured in standard maintenance medium. The images were taken at 20× magnification (scale bar = 50 μm).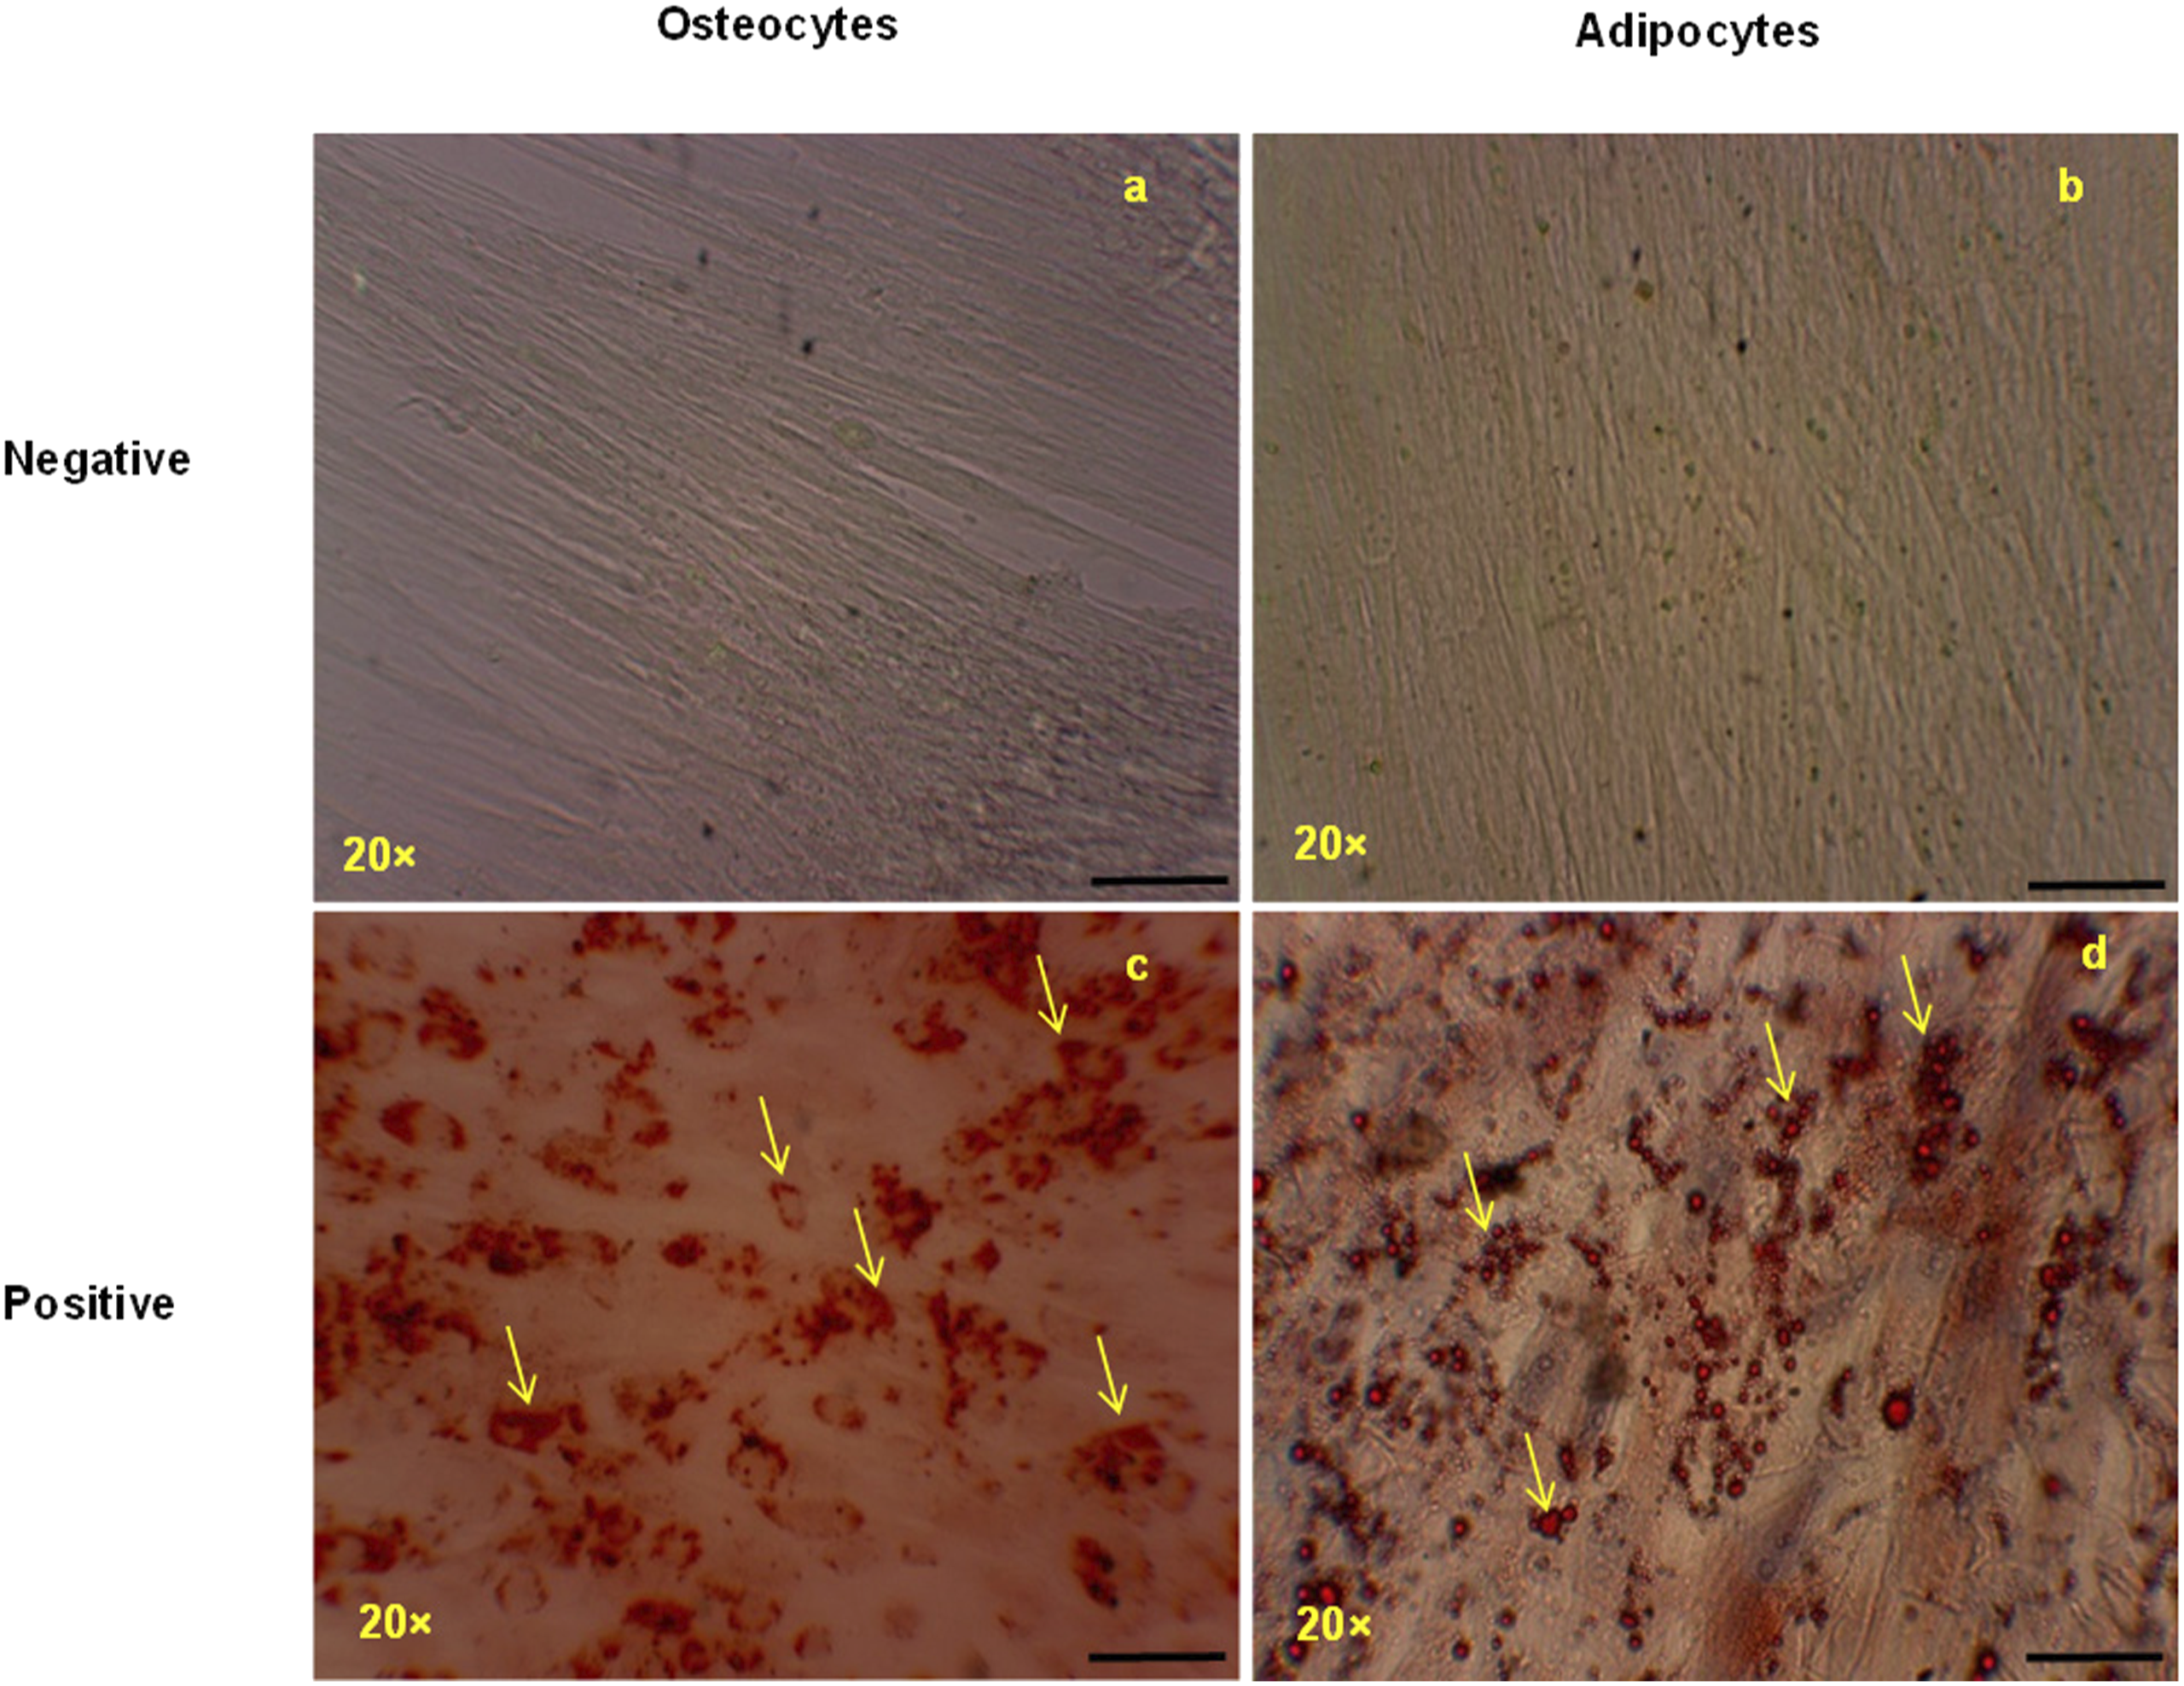
Hepatic differentiation of mesenchymal stem cells
To induce the differentiation of MSCs into hepatocyte-like cells, the MSCs were cultured in hepatic differentiation medium for 35 days. Additional hepatic markers (albumin secretion, urea synthesis, ALT activity and γ-GT activity) were confirmed at significantly higher levels compared to the undifferentiated cells (p < 0.01) after 28 days of culture in hepatic differentiation medium (Figure 2). Assessment of the hepatic differentiation of mesenchymal stem cells. Several markers indicative of hepatic differentiation were assessed: (a) albumin secretion; (b) urea synthesis; (c) ALT activity; and (d) γ-GT activity. The two cell types tested were undifferentiated mesenchymal stem cells (MSCs) cultured in standard medium (DMEM-LG) and MSC-derived hepatocyte-like cells (MSCdH) cultured in hepatic differentiation medium. The values shown represent the mean ± SD of three independent experiments; *p < 0.05, **p < 0.01 or ***p < 0.001 indicates a significant difference between the differentiated and undifferentiated groups.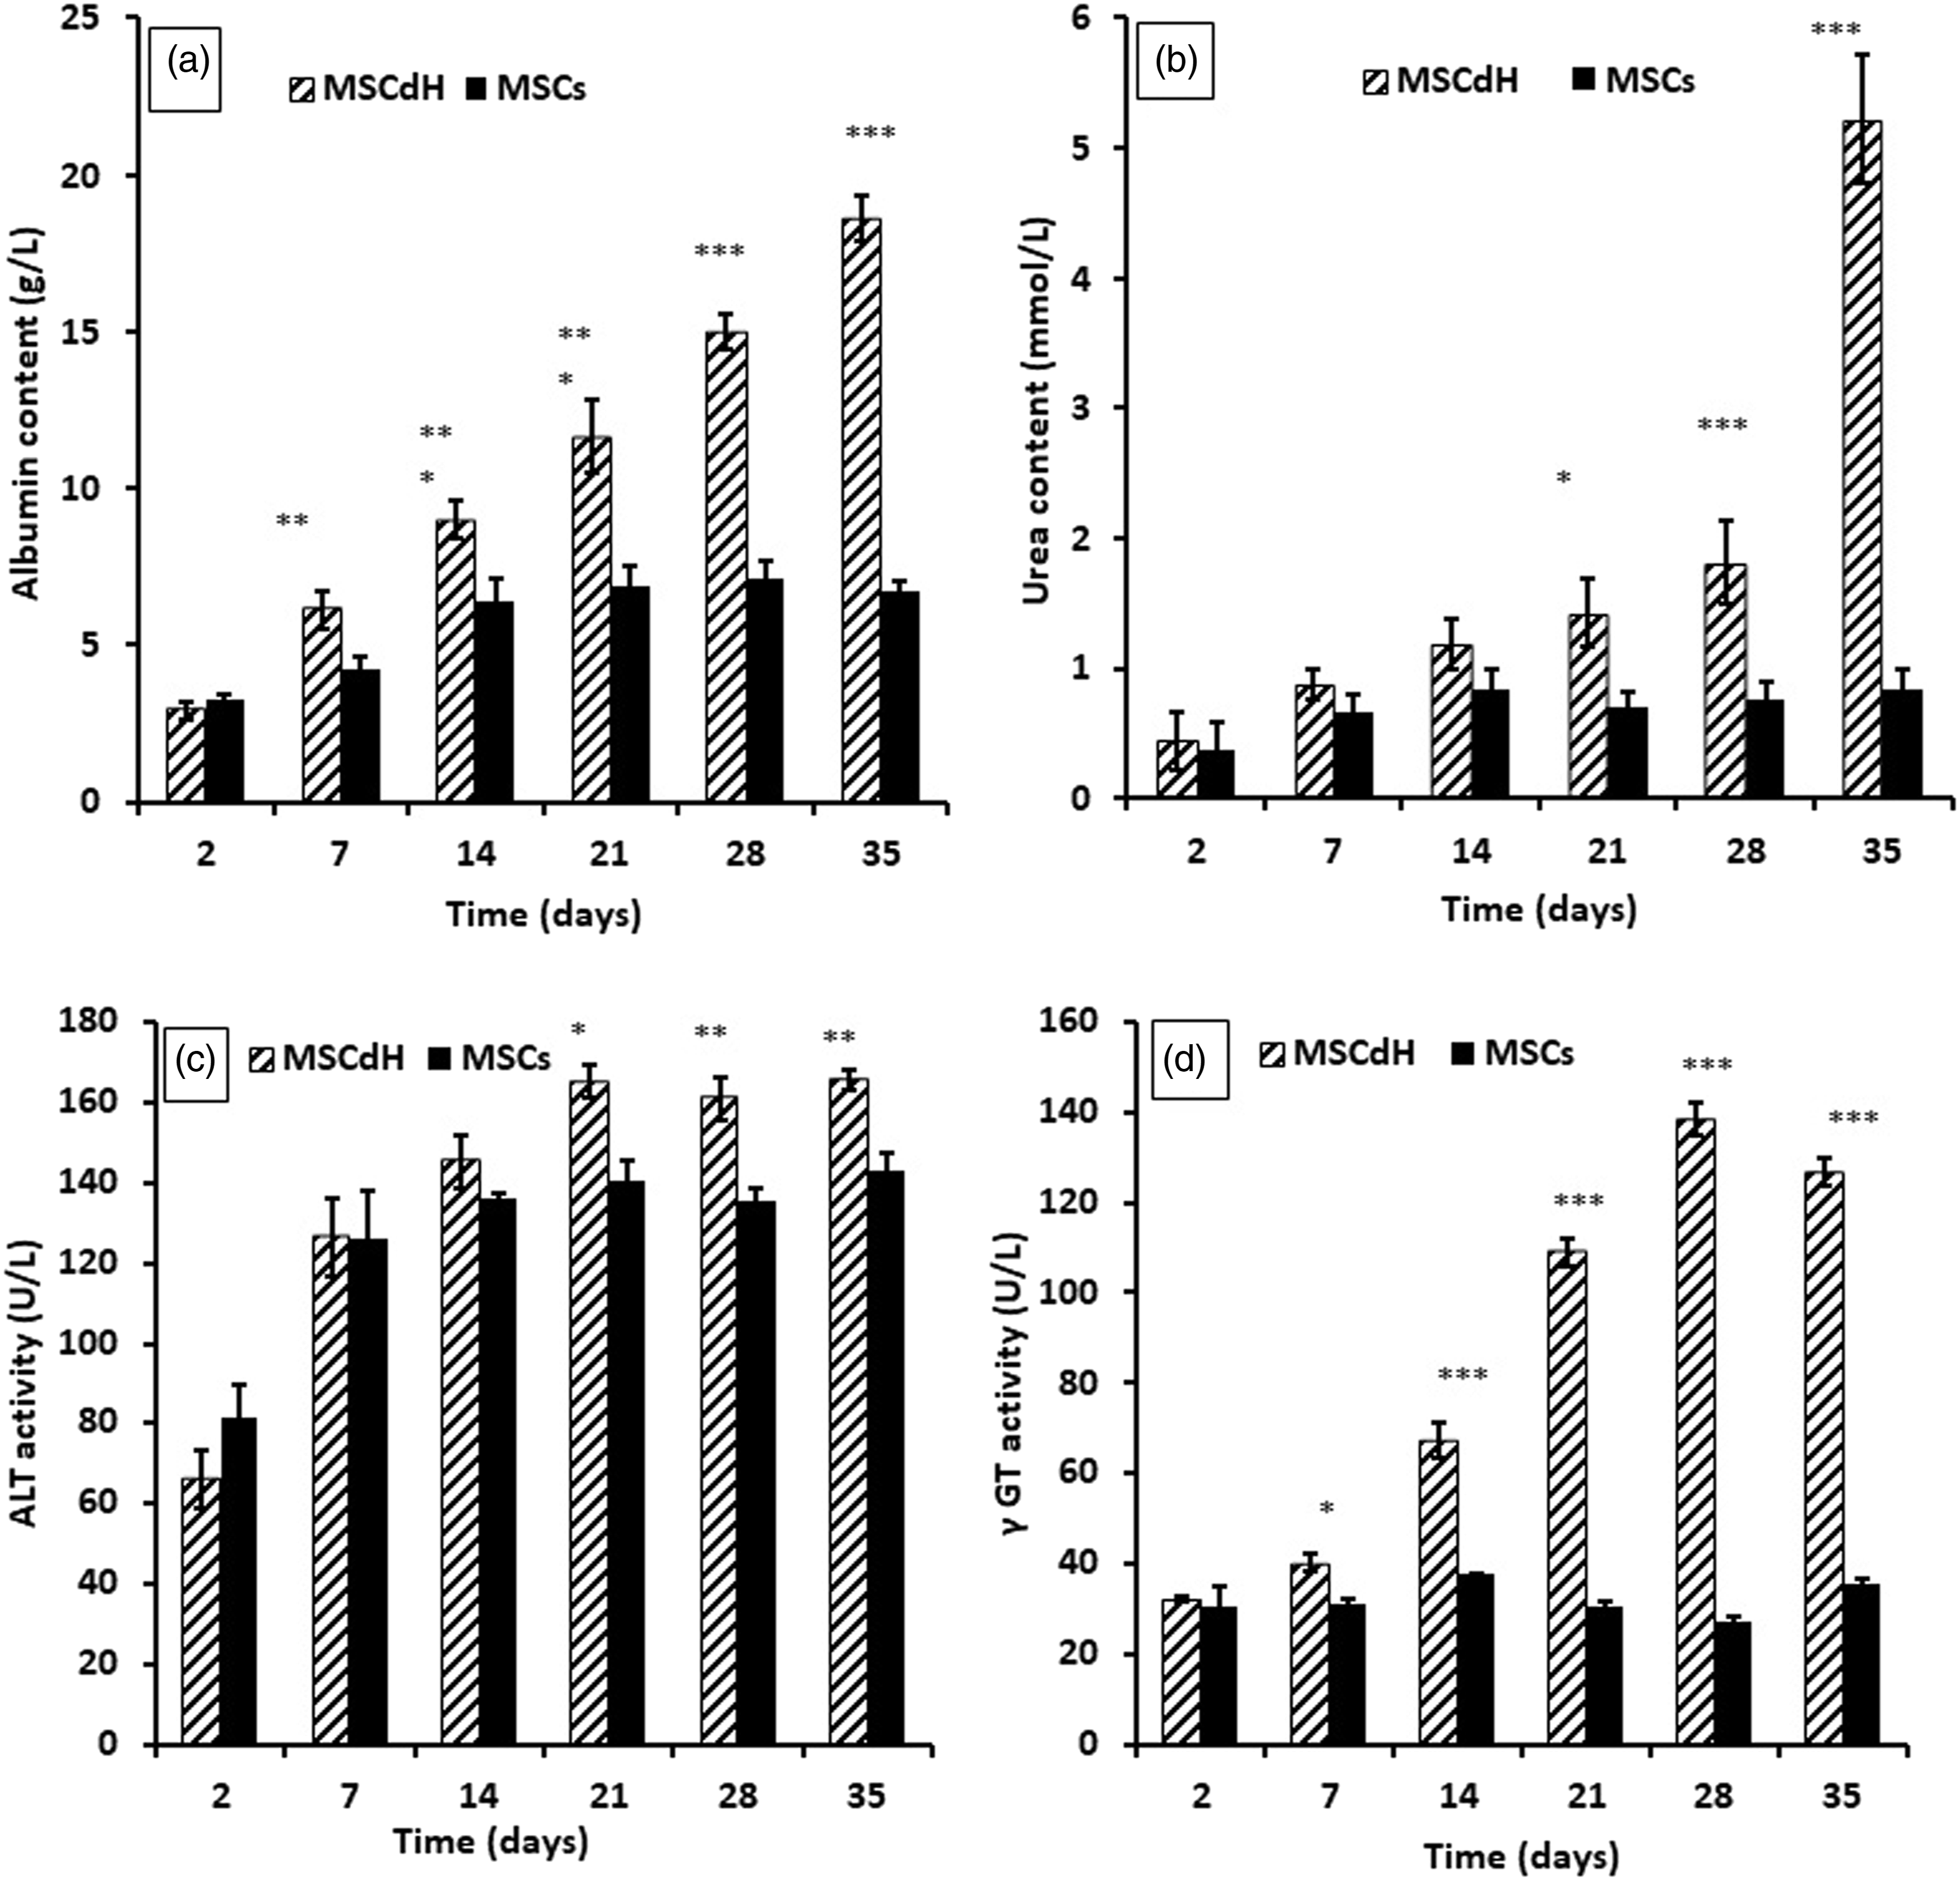
The ability of MSCs to differentiate into hepatocyte-like cells was determined at different time intervals by quantifying albumin content, urea content, ALT activity and γ-GT activity in the spent cell culture medium. All of these parameters increased with time in culture, as depicted in Figure 2. Furthermore, the differentiated MSCs showed a broadened, flattened morphology, consistent with that of mature hepatocytes (see Figure 3). Glycogen accumulation, as determined by PAS staining, after 24 days of culture in hepatic differentiation medium. The images show: (a) the negative control, which consisted of undifferentiated mesenchymal stem cells (MSCs) cultured in normal growth medium (DMEM-LG); and (b) and (c) MSC-derived hepatocyte-like cells (MSCdH), which were cultured in hepatic differentiation medium. The images were taken at 20× and 40× magnification (scale bar = 50 μm).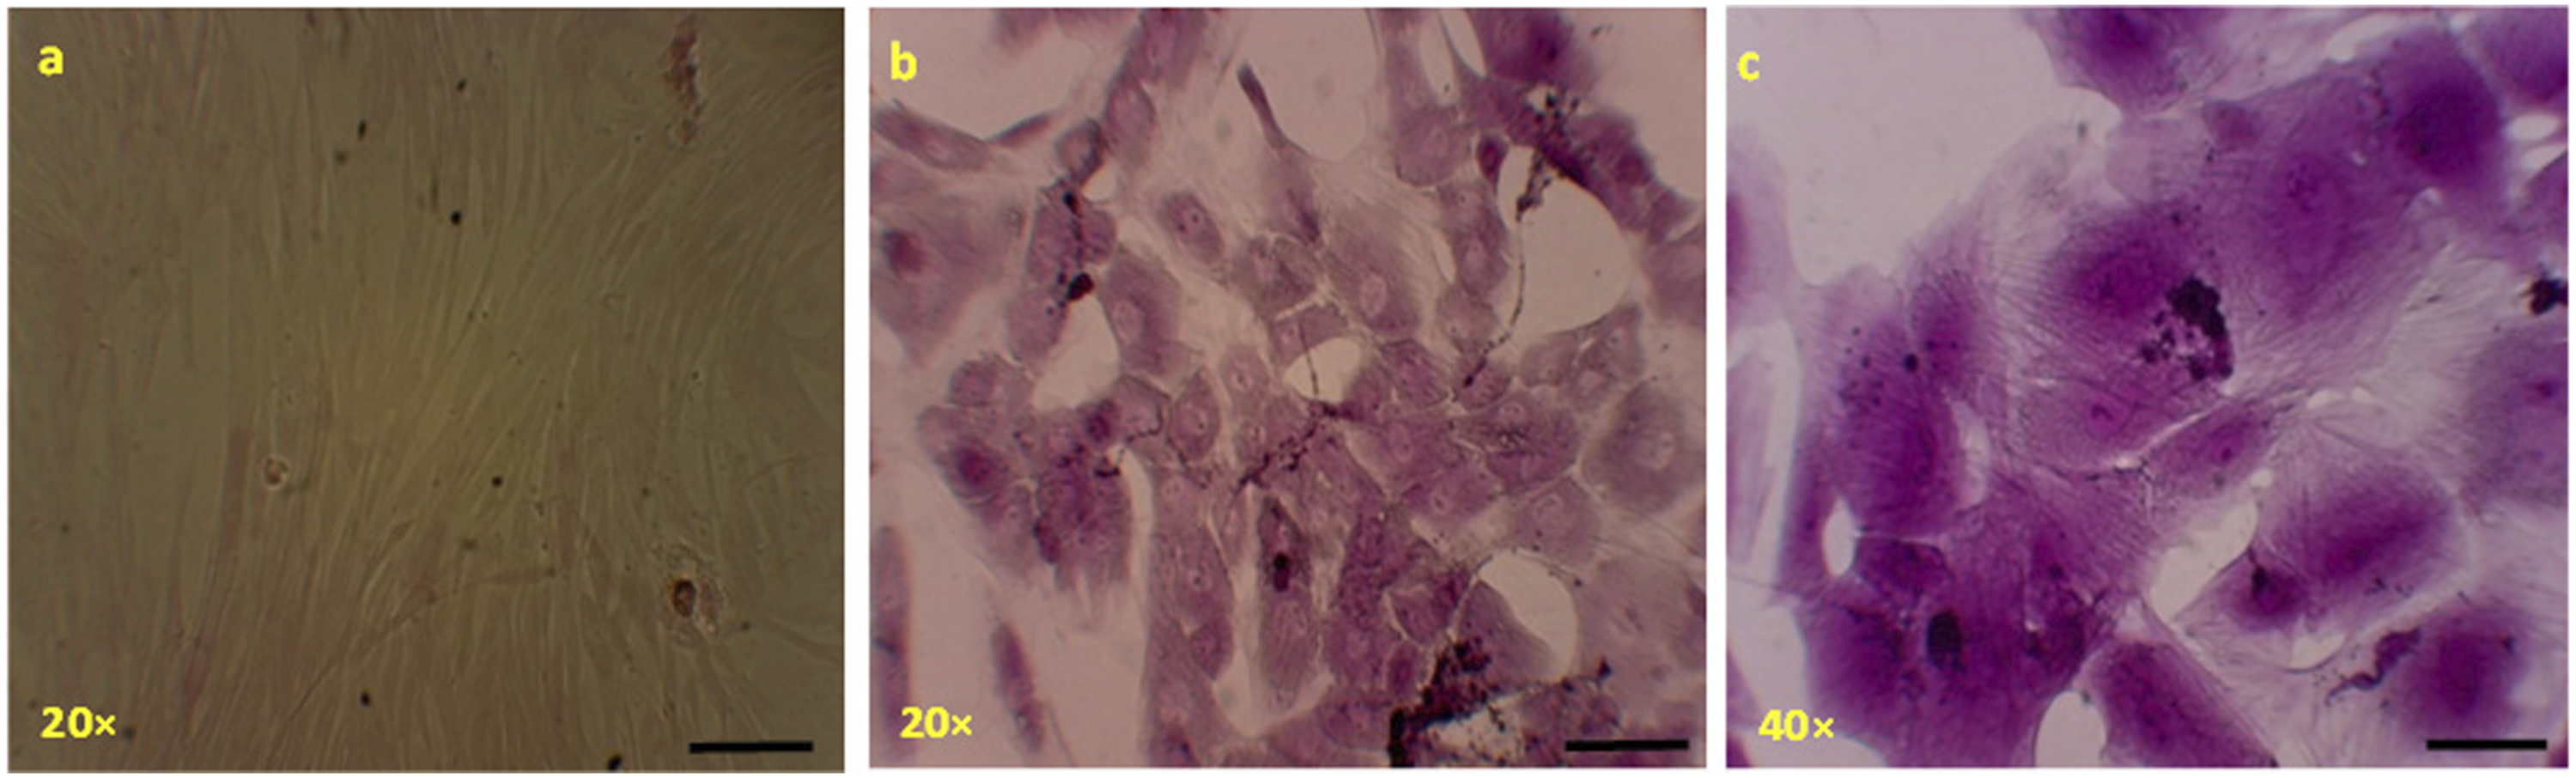
The differentiation of umbilical cord–derived MSCs into hepatocyte-like cells was further confirmed by using PAS stain, which is a commonly used method to detect the presence of glycogen. As Figure 3 shows, the fibroblastic morphology of MSCs disappeared and the cells acquired a broadened, flattened morphology. The irregular morphology of differentiated cells was observed over time (Figure 3(b) and (c)).
Cell viability after exposure to APAP and ethanol
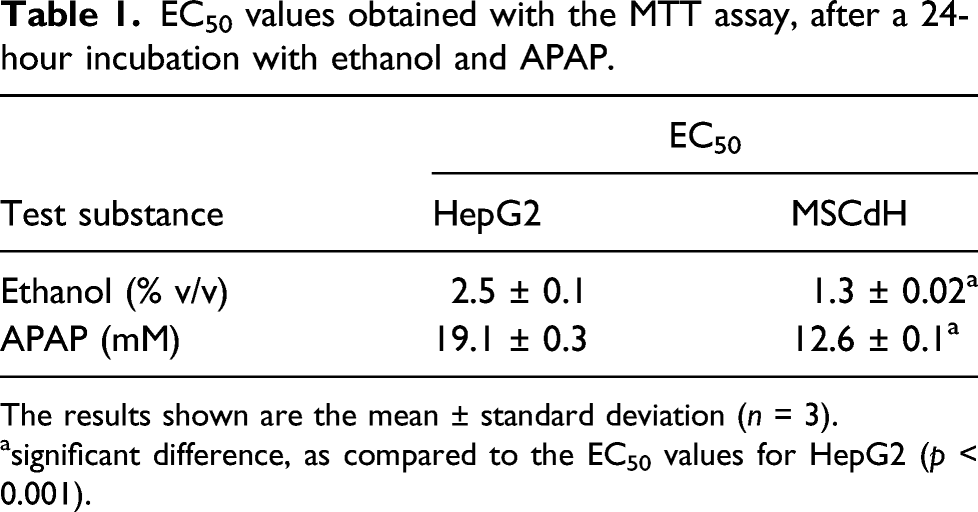
Figure 4 depicts the relative cell viability (as a percentage of the untreated control cell viability) of HepG2 and MSCdH cells after a 24-hours exposure to a range of concentrations of APAP and ethanol. Light microscopy showed that both HepG2 and MSCdH cells retained their characteristic morphology in the negative control cultures (i.e. medium only) (Figures 5 and 6, top panels). The cell density of HepG2 cells decreased in a dose-dependent manner, in the case of both ethanol and APAP (Figures 5 and 6). Cell viability was higher for HepG2 cells compared to MSCdH at concentrations over 1% v/v ethanol (Figure 4(a)). Similar observations in terms of cell viability and morphology were found for cells treated with APAP at concentrations higher than 10 mM (Figure 4(b) and Figure 6). Morphological analysis revealed that the flattened spindle shape of HepG2 cells and the irregular broadened shape of MSCdH transformed to an elongated appearance at low concentrations and became rounded and shrunk at higher concentrations of both ethanol and APAP (Figures 5 and 6). The EC50 values calculated for MSCdH were lower than those for HepG2 cells, for both ethanol and APAP (p < 0.001) (Table 1). Relative cell viability after a 24-hour treatment with different concentrations of ethanol and APAP. The relative cell viability (as a percentage of the untreated control cell viability) was assessed by using the MTT assay, after a 24-hour treatment with different concentrations of (a) ethanol and (b) APAP. Data from HepG2 cells and MSC-derived hepatocyte-like cells (MSCdH) are compared in each graph. The data are presented as the mean ± SD of three independent experiments. Light microscopy images of HepG2 and MSC-derived hepatocyte-like cells (MSCdH), after a 24-hour exposure to different concentrations of ethanol. The images were taken at 20× magnification. Negative control shows cells cultured in standard medium without ethanol treatment. Scale bar = 50 μm. Light microscopy images of HepG2 and MSC-derived hepatocyte-like cells (MSCdH), after a 24-hour exposure to different concentrations of APAP. The images were taken at 20× magnification. Negative control shows cells cultured in standard medium without APAP treatment. Scale bar = 50 μm. EC50 values obtained with the MTT assay, after a 24-hour incubation with ethanol and APAP. The results shown are the mean ± standard deviation (n = 3). asignificant difference, as compared to the EC50 values for HepG2 (p < 0.001).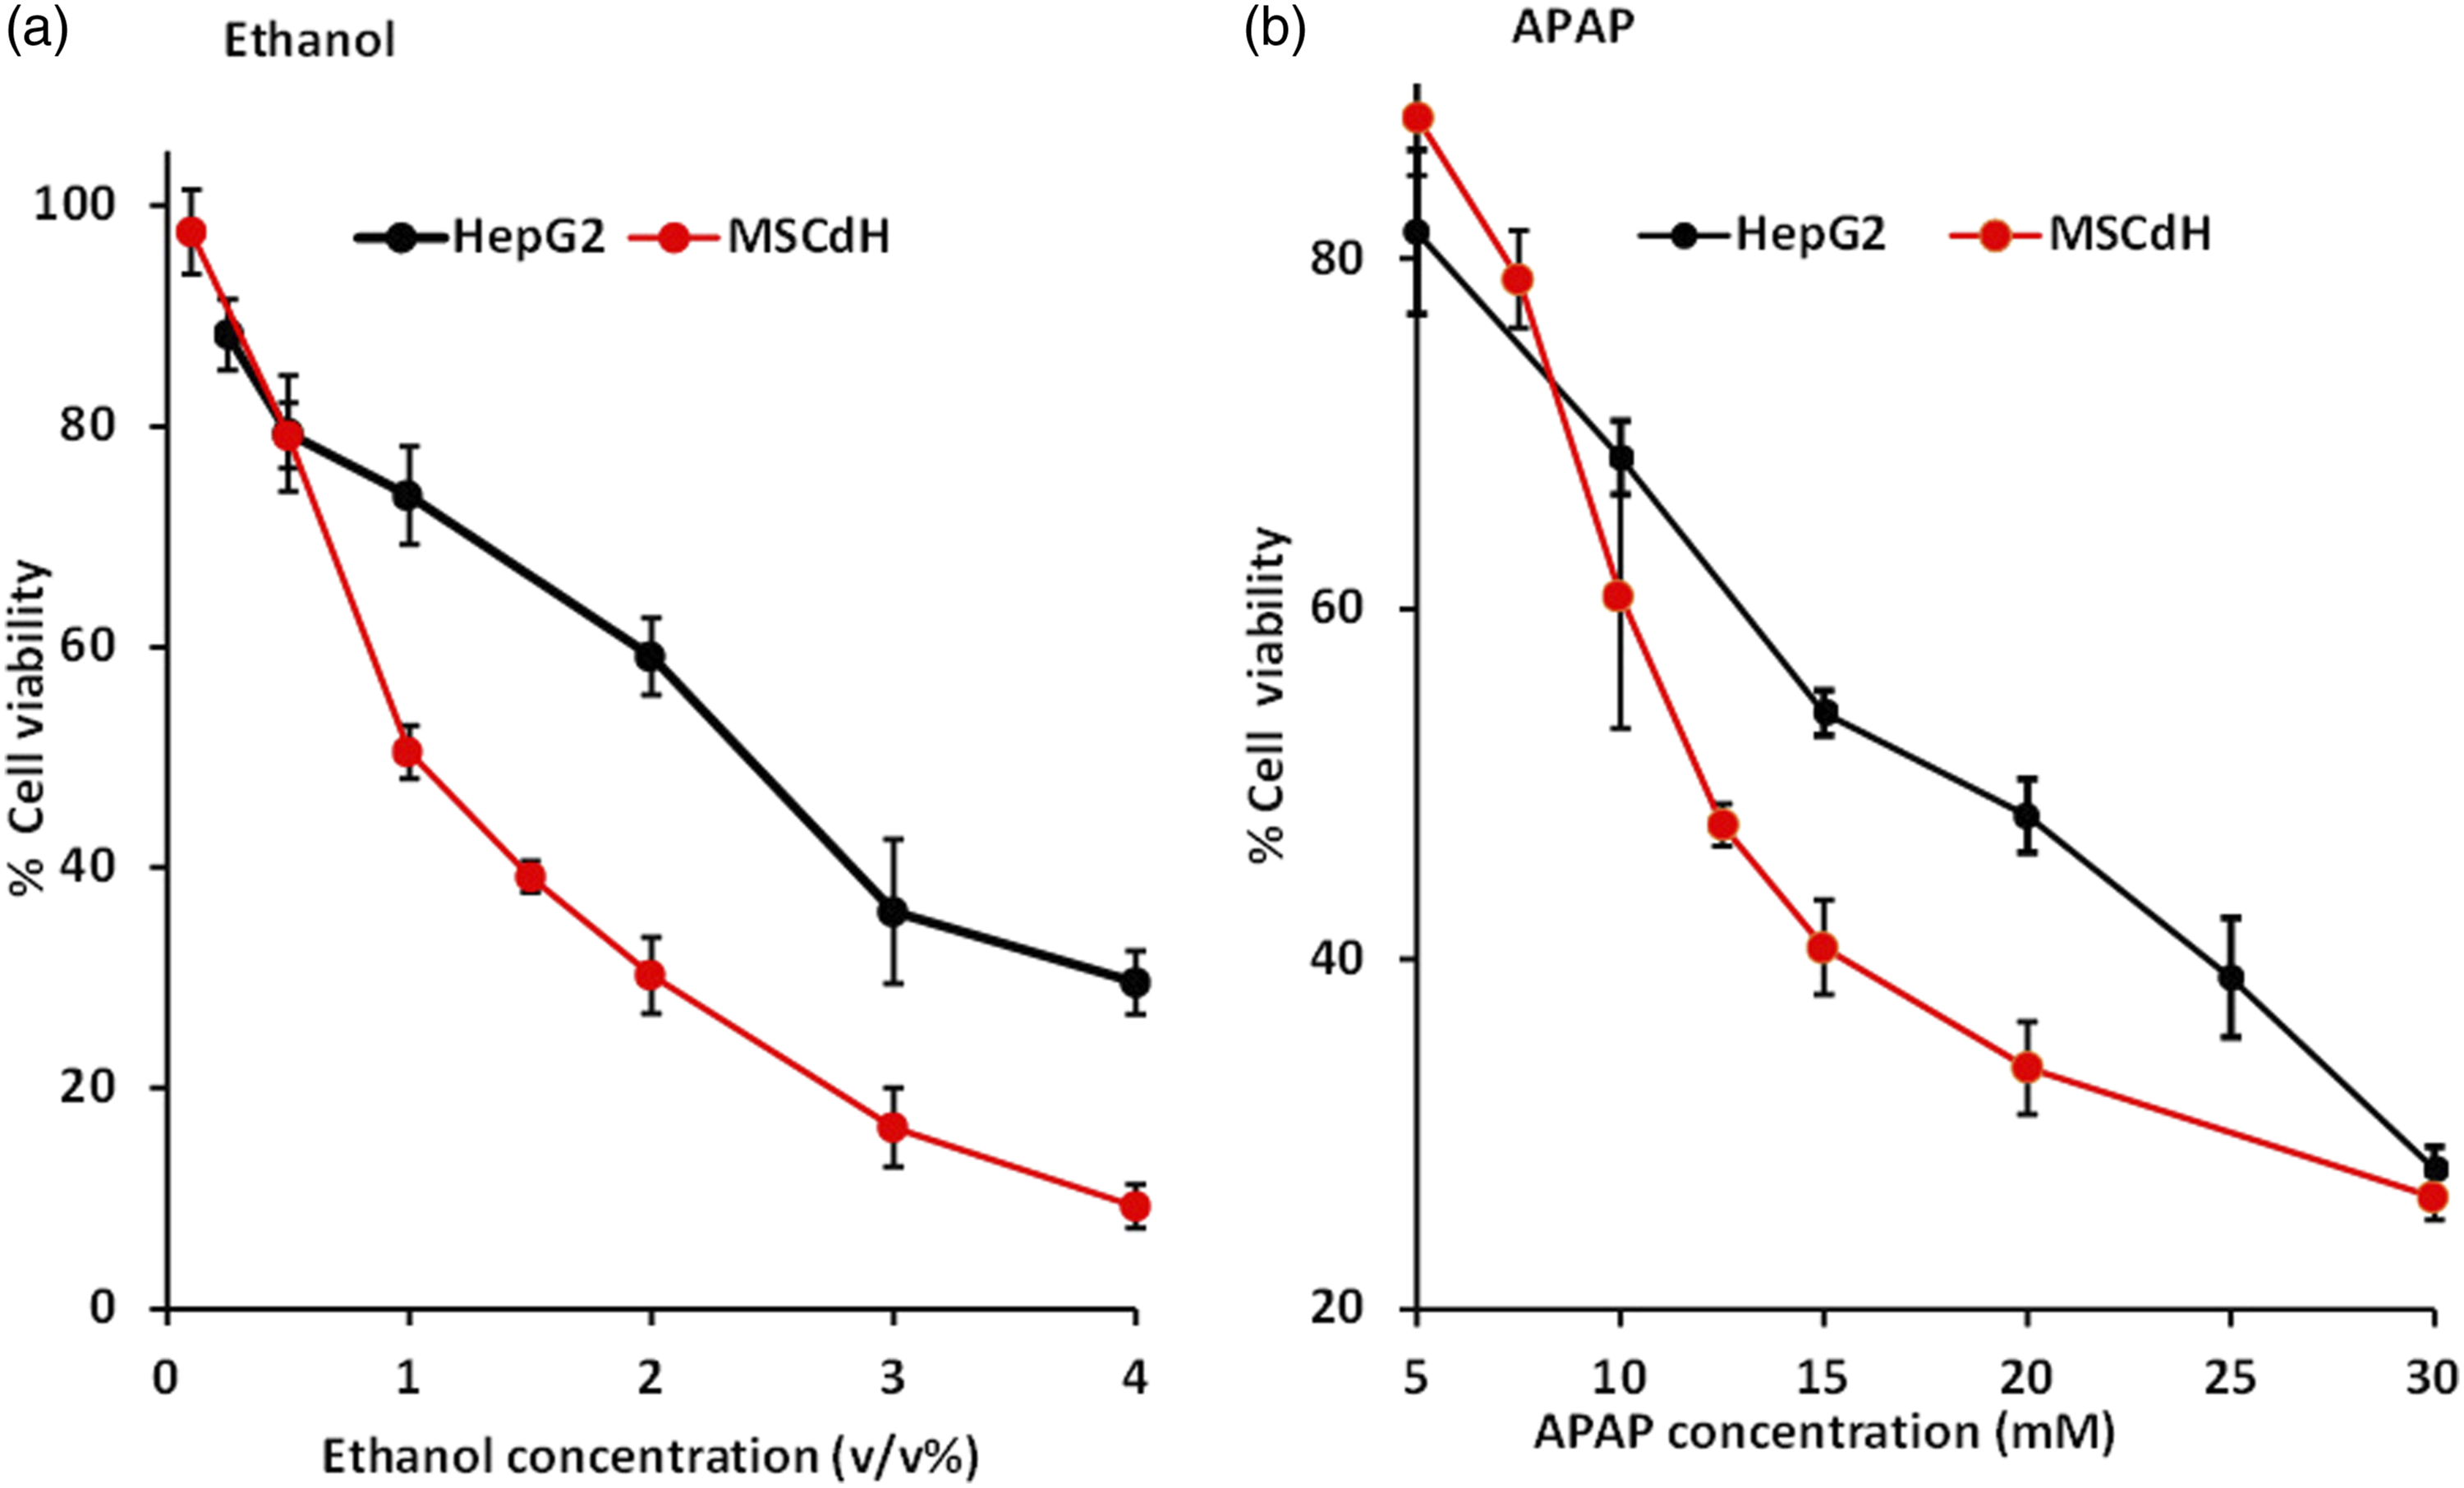


Discussion
A number of models representing the human liver have been used to study xenobiotic metabolism and drug toxicity in vitro.22,23 In the field of drug discovery, functionally active in vitro hepatic models are vital to ensure the accurate prediction of drug toxicity.9,11 Primary human hepatocytes are one of the excellent options for drug screening purposes, but their limitations include ethical considerations, limited availability and life span, and poor reproducibility of results. 24 To overcome these challenges associated with human primary hepatocytes, several immortal cell lines are commercially available that can be used for toxicological screening. For example, HepG2 is a cancer cell line that has been used extensively in toxicological and drug discovery studies in vitro. 10 However, gene expression in cancer cells differs from that in normal cells. The in vitro models currently available for early drug screening present several limitations which can lead to failures further down the line in drug development.
Previous studies have reported that poor expression of CYP enzymes, phase II enzymes and transporters are the main functional differences found in HepG2 cells, as compared to hepatocyte-like cells such as MSCdH.25,26 To mitigate this poor expression, cell lines transfected with the sub-optimally expressed genes are sometimes used, but up to a limited number of passages and at high monetary cost.
Induced pluripotent stem cell (iPSC)-derived hepatocytes 27 and MSCdH are the next best choices to overcome some of these challenges. The current study compared the toxicity of ethanol and APAP to HepG2 cells and MSCdH, prepared by the in vitro differentiation of MSCs derived from human umbilical cord. The multipotent differentiating potential of these spindle-shaped fibroblast-like cells isolated from human umbilical cord was confirmed by their successful differentiation into mesodermal lineage (osteocytes and adipocytes) and endodermal lineage (hepatocytes). 28 Specifically, the differentiated hepatocyte-like cells were evaluated by measuring urea synthesis, albumin secretion, glycogen accumulation and hepatic enzyme activities (ALT and γ-GT). 17
Ethanol is mainly metabolised by alcohol dehydrogenase (ADH) and aldehyde dehydrogenase (ALDH). CYP2E1 is an enzyme in the microsomal ethanol oxidising system, which is induced in chronic alcoholism and modifies ethanol to form more-reactive, toxic products. 29 The present study revealed that the EC50 values of ethanol and APAP were lower for MSCdH than for HepG2 cells, which suggests that both compounds are more toxic to MSCdH. The reduced toxicity of both substances toward HepG2 cells might be explained by the differences in the expression of CYP2E1 in each type of hepatocytes. HepG2 cells express very low, or non-detectable, levels of the CYP2E1 enzyme, as is the case for other immortalised hepatoma cells (THLE2, Hep3B, Huh7). 9 In contrast, Lu et al. 30 demonstrated that iPSC-derived hepatocytes have transcriptional profiles for CYP isoform genes (including CYP2E1) that are more comparable to primary hepatocytes. Moreover, they have found that iPSC-derived hepatocytes are more similar to neonatal and adult hepatocytes than hepatocytes from fetal liver, and that they can be successfully used in drug toxicity testing. 30 These findings further support the validity of using MSCdH in drug metabolism and hepatotoxicity studies. Studies carried out on HepG2 cells transfected with the CYP2E1 gene have demonstrated a substantial increase in ethanol-induced cytotoxicity, as compared to parental HepG2 cells which lack CYP2E1 expression. 31 As explained previously, MSCdH have the ability to express CYP2E1 and generate free radicals via ethanol metabolism, whereas HepG2 cells do not.26,29 Consequently, an increase in ROS causes oxidative stress, and this would lead to greater toxic effects in MSCdH. At concentrations of ≥ 1% v/v ethanol, HepG2 cells showed significantly higher cell viability than MSCdH (EC50 values of 2.5% and 1.3%, respectively).
The present study also showed that APAP-induced cytotoxicity was significantly higher in MSCdH (an EC50 value of 12.6 ± 0.1 mM) compared to HepG2 cells (an EC50 value of 19.1 ± 0.3 mM). In contrast to ethanol, with APAP there was not a significant difference in cell viability between MSCdH and HepG2 cells at the highest concentration tested (30 mM). Cytochrome P450 enzymes play a vital role in xenobiotic metabolism. Among CYP family enzymes, CYP2E1 plays a major role in the formation of NAPQI in APAP metabolism. CYP 1A2, 2A6, 2D6 and 3A4 are also key CYP enzymes in APAP overdoses.32–34 Furthermore, hepatocyte-like cells derived from human iPSCs generated from an embryonic lung fibroblast cell line have been shown to express CYP 2C9, 2E1 and UGT1A1. 35 Thus, cytotoxic reactive species can be generated as a result of NAPQI formation in MSCdH, via the expression of the relevant CYP enzymes, leading to cell death at concentrations greater than 10 mM of APAP (Figure 4(b)).
Conclusions
The EC50 values of ethanol and APAP were lower for MSCdH than for HepG2 cells, which suggests that both compounds are more toxic to MSCdH. Hence, mesenchymal stem cell-derived hepatocytes could be considered as a better alternative model for in vitro toxicological studies compared to HepG2 cells because they are more physiologically relevant in terms of xenobiotic metabolism.
Footnotes
Acknowledgements
The authors acknowledge the University of Colombo, Sri Lanka, for financial assistance by awarding a research grant to Prof. M. Iqbal Choudhary. The authors are grateful to the staff of the Dr Panjwani Center for Molecular Medicine and Drug Research, International Center for Chemical and Biological Sciences, University of Karachi, Karachi, Pakistan, for providing the HepG2 cell line. The staff members of the De Soysa Maternity Hospital, Colombo, are also greatly acknowledged.
Declaration of Conflicting Interests
The author(s) declared no potential conflicts of interest with respect to the research, authorship, and/or publication of this article.
Funding
This study was supported by University of Colombo, Sri Lanka under Research Grant AP/3/2/2014/RG/11.
Ethics approval
This study was approved by the ethical review committee, Faculty of Medicine, University of Colombo, Sri Lanka (Approval No. EC/14/167).
Availability of data and materials
All data and materials in the current study are available from the corresponding author on reasonable written request.