
Abstract
This study examined the relationship between creativity and intelligence in a non-Western sample using linear, nonlinear, and segmented regression approaches. The participants comprised 682 students randomly selected from 30 schools in Oman. After data cleaning procedures, the final analytic sample consisted of 657 participants. The instruments included the Comprehensive Test of Non-Verbal Intelligence (CTONI-2) and Profile of Creative Abilities (PCA). The overall results showed a weak linear association, with some evidence of nonlinear variation across levels of intelligence. For the segmented regression, the correlation inside the interval of the breakpoint IQ = 101 and IQ = 119 was relatively low but statistically significant (r = .110, p = .042), while for the breakpoint (IQ = 119), the correlation was statistically significant and negative (r = −.214, p = .028). For females, the correlation within the breakpoints of IQ = 101 and 119 was relatively low and not statistically significant. For males, the correlation within the breakpoints of IQ = 101 and 119 was statistically significant.
Introduction
Understanding how intelligence and creativity relate to each other has been a long-standing question in psychology, but it is also a very practical issue, especially in education. In many school systems, intelligence is still the main criterion used to identify high-ability students, even though creativity is just as important for real-world problem solving, innovation, and adaptation. The problem is that we still do not have a clear answer about how these two constructs actually work together.
What makes this even more complicated is that the relationship between intelligence and creativity has never been consistent across studies. Some research found only weak associations, while others find stronger links based on how both constructs are measured and analyzed. For example, more recent meta-analytic work suggests a positive but modest relationship between intelligence and divergent thinking, often around r = .25, with large variation depending on the scoring methods and task conditions (Gerwig et al., 2021). At the same time, recent cognitive and neuroscience-based studies suggest that intelligence and creativity may share underlying processes, especially those related to executive control and attention (Frith et al., 2021). Creativity and intelligence seem to overlap in some ways but not in a simple or uniform manner.
Part of the confusion comes from how creativity is defined and measured. In many studies, creativity is reduced to divergent thinking tasks, but this is only one part of a broader construct. Creativity also involves evaluation, domain knowledge, and contextual factors (Runco & Acar, 2012; Sternberg & Lubart, 1995). In fact, recent work shows that even common creativity scores can be strongly influenced by basic factors like fluency known as the number of ideas produced, which may inflate correlations and make interpretation difficult (Forthmann et al., 2018). This means that how we measure creativity can directly shape the conclusions we draw about its relationship with intelligence. These definitional and measurement differences have important implications for how the relationship between intelligence and creativity is interpreted.
Another important point, which has received more attention in recent literature, is that creativity is not a single ability. Different domains of creativity may rely on different cognitive processes. For instance, some evidence shows that intelligence is related to certain types of creativity, such as verbal or narrative creativity, but not necessarily to more visual or figural forms (López-Martínez & Lorca Garrido, 2021). This suggests that if we look at the overall creativity scores, it may hide important differences across domains.
The idea that intelligence is necessary, but it is not sufficient for creativity has often been discussed through the threshold theory, which proposes that intelligence and creativity are related only to a certain IQ level (commonly around 120; Guilford, 1967). However, empirical findings on this theory are mixed. Some studies find threshold-like patterns, while others do not, and recent work suggests that these patterns may depend heavily on the statistical methods used but do not reflect a true psychological boundary (Guignard et al., 2015; Karwowski & Gralewski, 2013). This raises an important methodological issue: traditional linear approaches may not be enough to capture the complexity of the relationship.
Because of this, there has been a growing shift toward using more flexible analytical methods, such as nonlinear and segmented regression models, which allow the relationship between intelligence and creativity to change across different levels of ability (Simonsohn, 2018; Weiss et al., 2020). Such approaches make it possible to test whether patterns like thresholds actually exist in the data, rather than assuming a single linear trend.
In addition to methodological concerns, context also matters. Most of the existing research has been conducted in Western samples, even though both intelligence and creativity are influenced by cultural and educational environments. Recent theoretical work suggests that the relationship between these constructs may vary depending on context, including how problems are framed and how much time or structure is involved in a task (Corazza & Lubart, 2021). This highlights the need to examine these questions in different cultural settings. In particular, creativity in non-Western contexts may place greater emphasis on appropriateness, social harmony, and contextual adaptation, rather than solely on originality and individual expression.
Taking all that together, the relationship between intelligence and creativity should not be expected to be simple, linear, or universal. Instead, it is likely to depend on how creativity is defined, which domain is being measured, the analytical approach used, and the context in which the data are collected.
Analytical Strategies and Threshold
The analytical strategies used by researchers have an influence on the extent to which threshold existed or not (Karwowski & Gralewski, 2013). Studies using segmented regression analyses and correlational analyses yielded results supporting the threshold (e.g., Cho et al., 2010; Jauk et al., 2013). Most of the research studies that explored the threshold hypothesis have focused on three areas: segmented regression analysis, correlation analysis in a spilt sample, and multi-group confirmatory factor analysis. Correlational analysis is the most widely investigated in literature (see Cho et al., 2010). In this analysis, the participants are divided into two groups at a set threshold into a low ability group and high ability group. Correlations between creativity and intelligence are then computed. The threshold theory hypothesis that there will be a threshold if the relationship between the two variables is weak or low in the high ability group versus the low ability group (Karwowski & Gralewski, 2013).
Disadvantages of this method include the lack of solid theoretical rationale for determining the threshold, the unclear theoretical underpinnings of the threshold hypothesis, and lack of empirical support for the used threshold (z = 1.33). Converting intelligence scores from a continuous to a dichotomous variable result in statistical issues such as data loss and underestimation of the strength of the correlation (MacCallum et al., 2002). Also, this kind of analysis lacks measurement precision at the more extreme points as the extremes are assessed using fewer items (Byrne, 2013).
Another analysis strategy is the segmented linear regression which establishes different linear associations across the intelligence continuum. This type of analysis includes estimating several linear models fitted for various sections or segments of the data (Ryan & Porth, 2007). As such, the continuum of intelligence is split several times into two segments and these segments include separately fitted ordinary least squares (OLS) regressions. In this linear regression, the break representing the threshold refers to the point at which the two regression slopes are significantly different. Contrary to the original threshold hypothesis, this method can be used to identify unknown breakpoints rather than determining a set breakpoint (Ryan & Porth, 2007).
Whitehead et al. (2002) pointed out that this method is used if there is an ample theoretical assumption that rationalizes a break in the relation. However, such theoretical assumptions cannot be clearly established in the association between creativity and intelligence. Also, this analysis has assumptions such as normally distributed data and homoscedasticity of the residuals (Ryan & Porth, 2007).
More recent work has emphasized that conclusions about nonlinear relationships may depend strongly on methodological and analytical choices rather than reflecting true underlying psychological mechanisms (Simonsohn, 2018; Weiss et al., 2020). In addition, contemporary research highlights that intelligence and creativity are not independent constructs but overlapping systems whose relationship varies depending on context and measurement approach (Corazza & Lubart, 2021; Frith et al., 2021; Gerwig et al., 2021).
This work may complement the current body of research, which is largely based on samples from North America and Europe. The above review of the extant literature on the relationship between creativity and intelligence highlights the need for further research, particularly in under-investigated populations. However, limited research has directly tested Guilford’s necessary-but-not-sufficient hypothesis using more flexible analytical approaches (see Karwowski et al., 2016; Shi et al., 2017). This hypothesis was later developed into the threshold hypothesis, which proposes that the association between intelligence and creativity changes depending on the level of intellectual functioning. Although multiple theoretical perspectives are discussed, the present study focuses primarily on examining threshold-like and nonlinear patterns using different regression models.
In addition to the main relationship between intelligence and creativity, this study also examines whether this relationship varies across gender. Although previous research has reported inconsistent findings regarding gender differences in creativity, recent studies suggest that the relationship between intelligence and creative performance may vary depending on cognitive processes and sample characteristics (Frith et al., 2021; Gerwig et al., 2021). Therefore, gender was included as an exploratory factor to examine potential differences in the intelligence–creativity relationship across subgroups.
The study is guided by the following questions: (1) What is the relationship between intelligence and creativity across different analytical approaches (linear, nonlinear, and segmented regression)? (2) Does the relationship between intelligence and creativity differ across figural creativity domains (drawing and structured figural tasks)? (3) Does the relationship between intelligence and creativity vary by gender?
Method
Participants
The data for this investigation was collected via a portion of a large-scale national grant. A total of 682 students were randomly selected from 30 governmental schools across five governorates in Oman during the academic year 2018–2019.
The study population comprised an aggregate of 4678 students according to the Ministry of Education’s annual statistical book. The selected students represented three different school levels (elementary, middle, and high school). Cycle 1 included students from Grades 1–4, and Cycle 2 comprised students from Grades 5–10.
The study participants were selected on the basis of their grade levels (1–10), gender (male and female), and governorate (Muscat, Al-Dhahira, Dhofar, Al-Batinah North, and Al-Sharqiyah South). The five selected governorates represented the geographical and cultural distribution of the country. A total of six schools were randomly selected from each governorate: two schools in Cycle 1 and four segregated schools in Cycle 2, two with only male students and two with only female students.
Description of Study Participants Across Grades and Genders
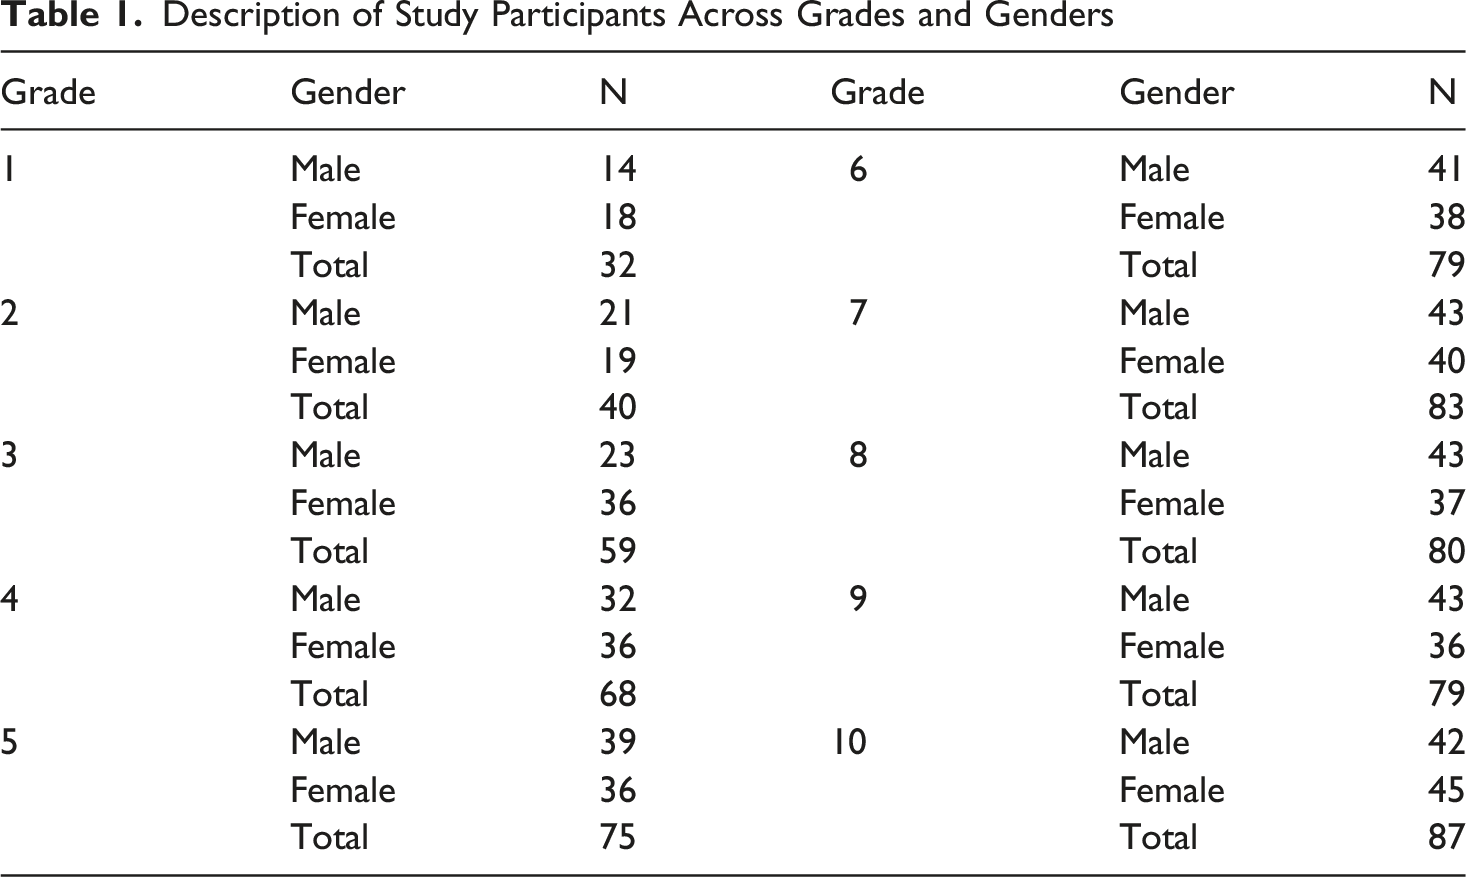
However, after data cleaning procedures, removal of missing values and outliers based on ±3 SD, the final analytic sample used in the statistical analyses consisted of N = 657 participants. The analyses were conducted on the cleaned dataset after the removal of missing values and outliers based on standardized z-scores.
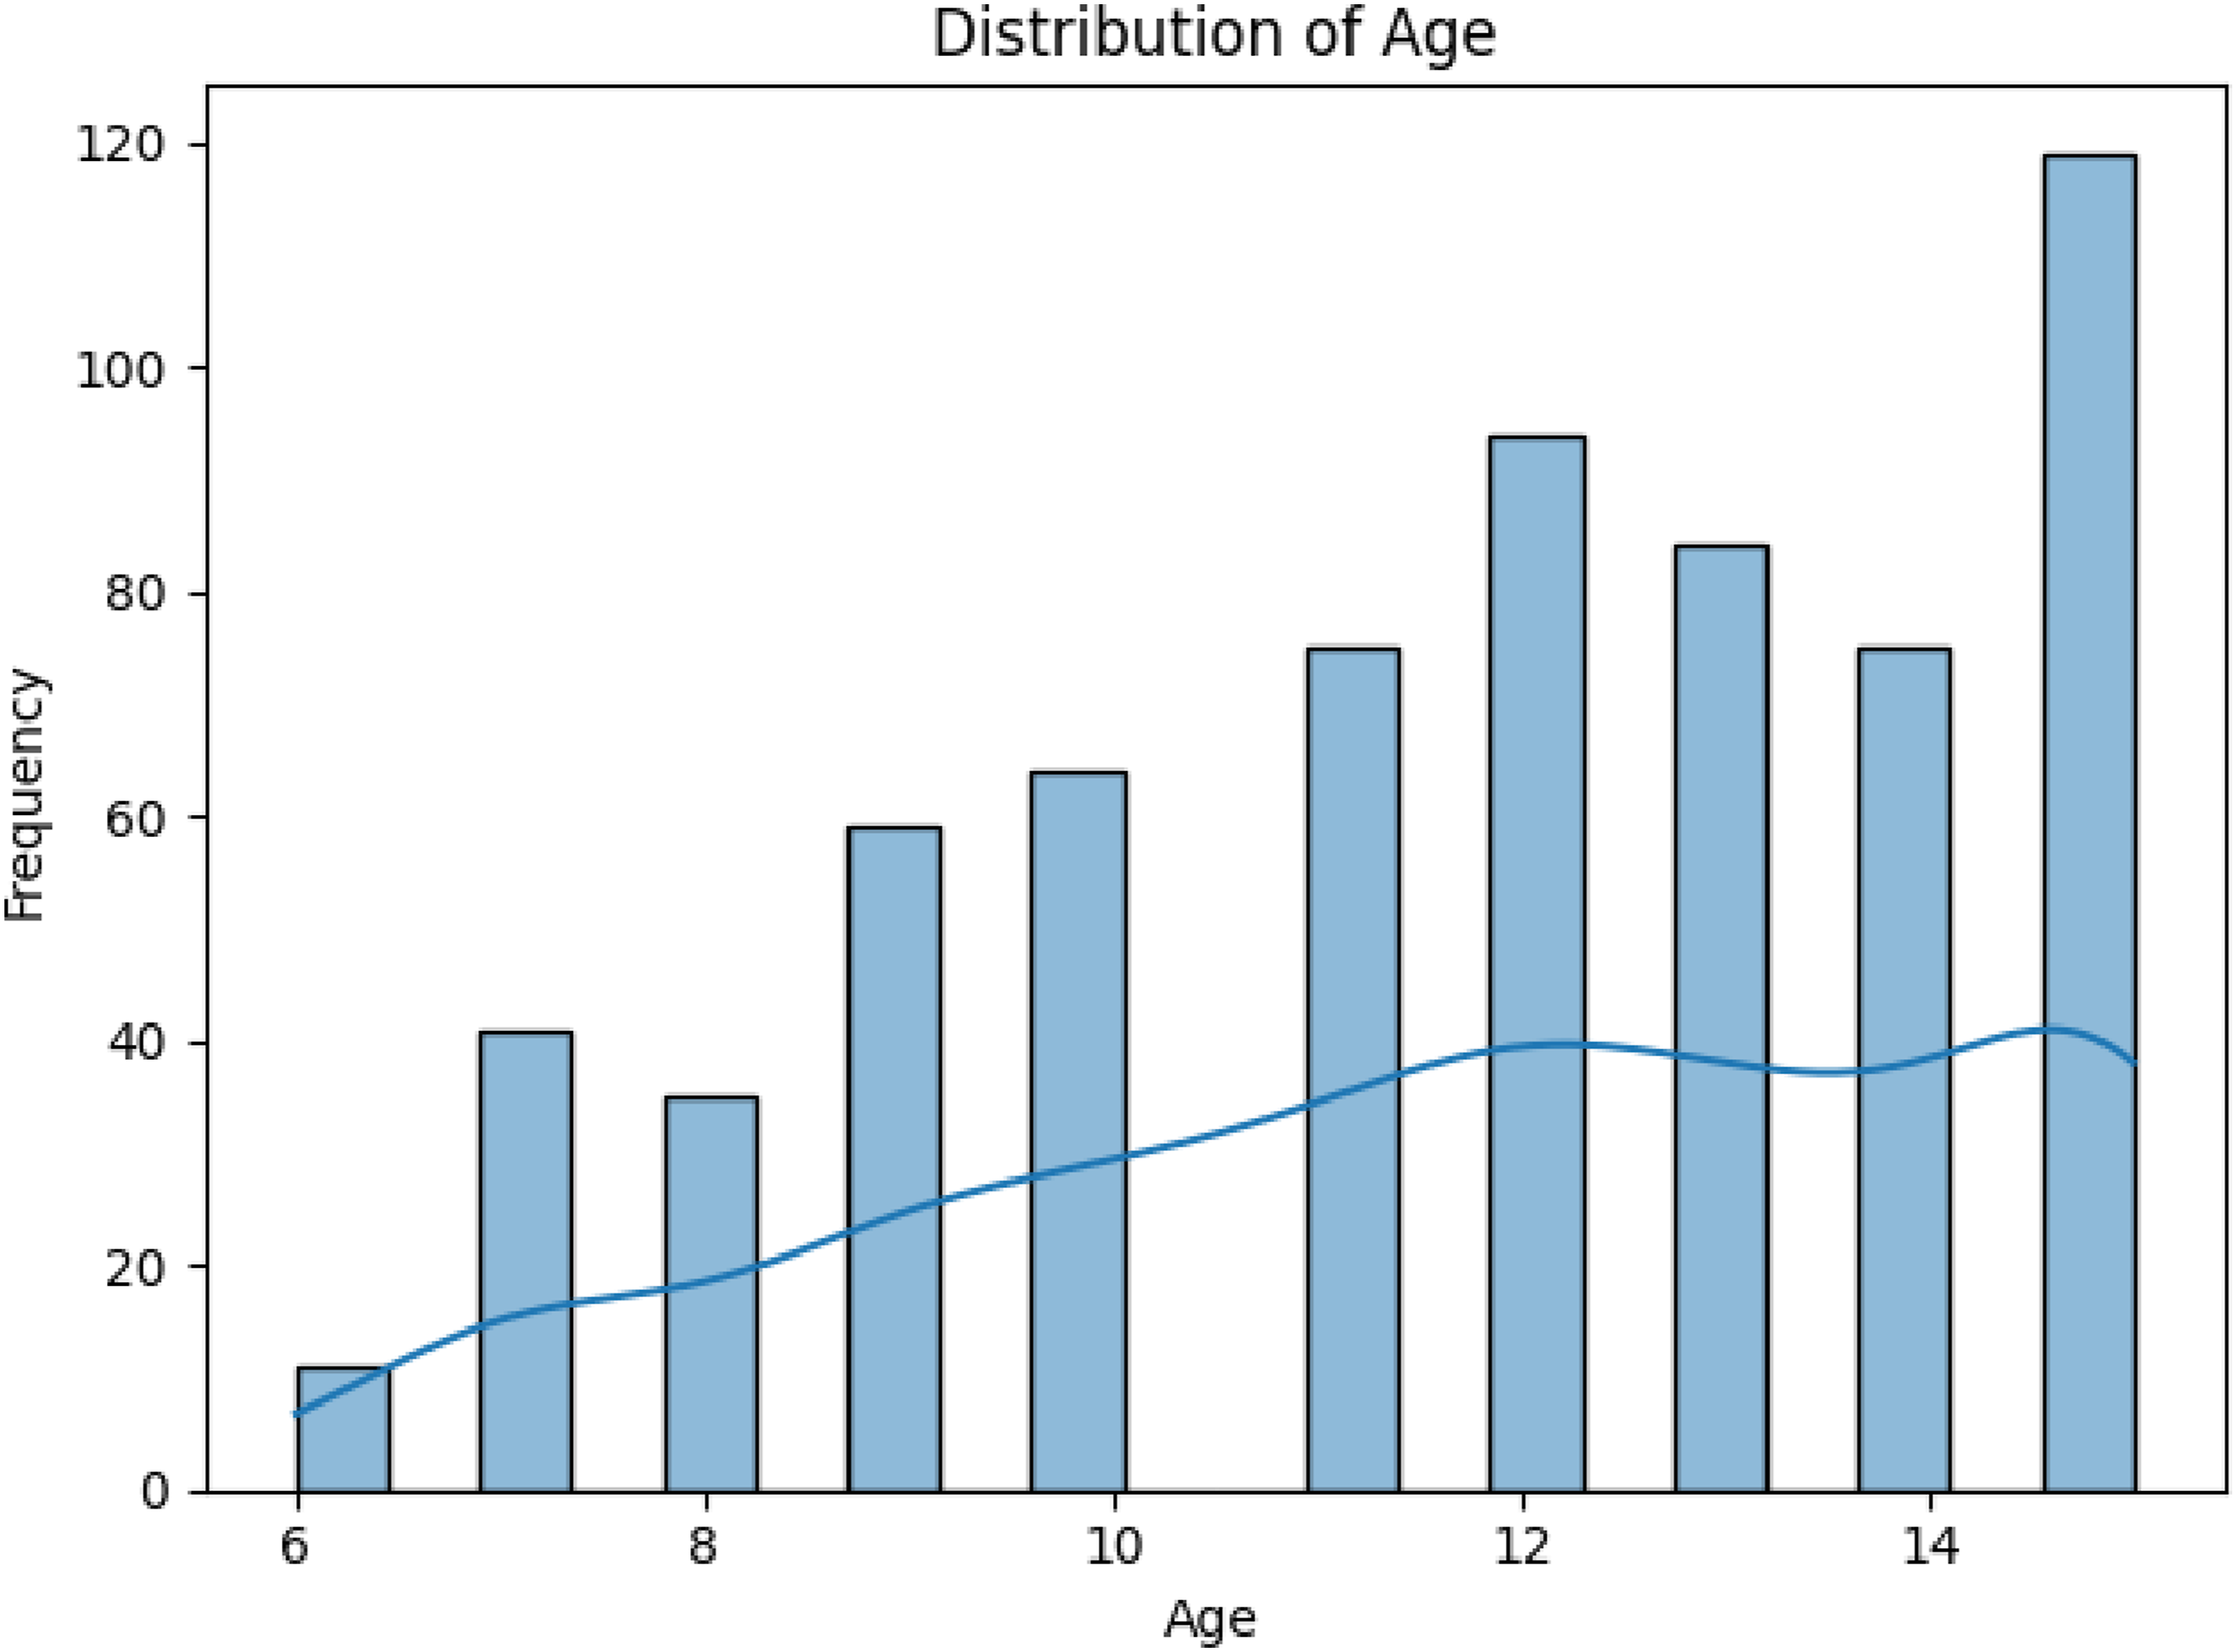
The distribution of participants across age and grade levels was examined. Ages ranged from 6 to 15 years as can be seen in Figure 1, with a higher concentration of participants in the upper age range around 11–15 years as showed in Figure 2. Similarly, the grade distribution included students from Grades 1 to 10, with greater representation in higher grade levels. Distribution of Grade in the sample Distribution of Age in the sample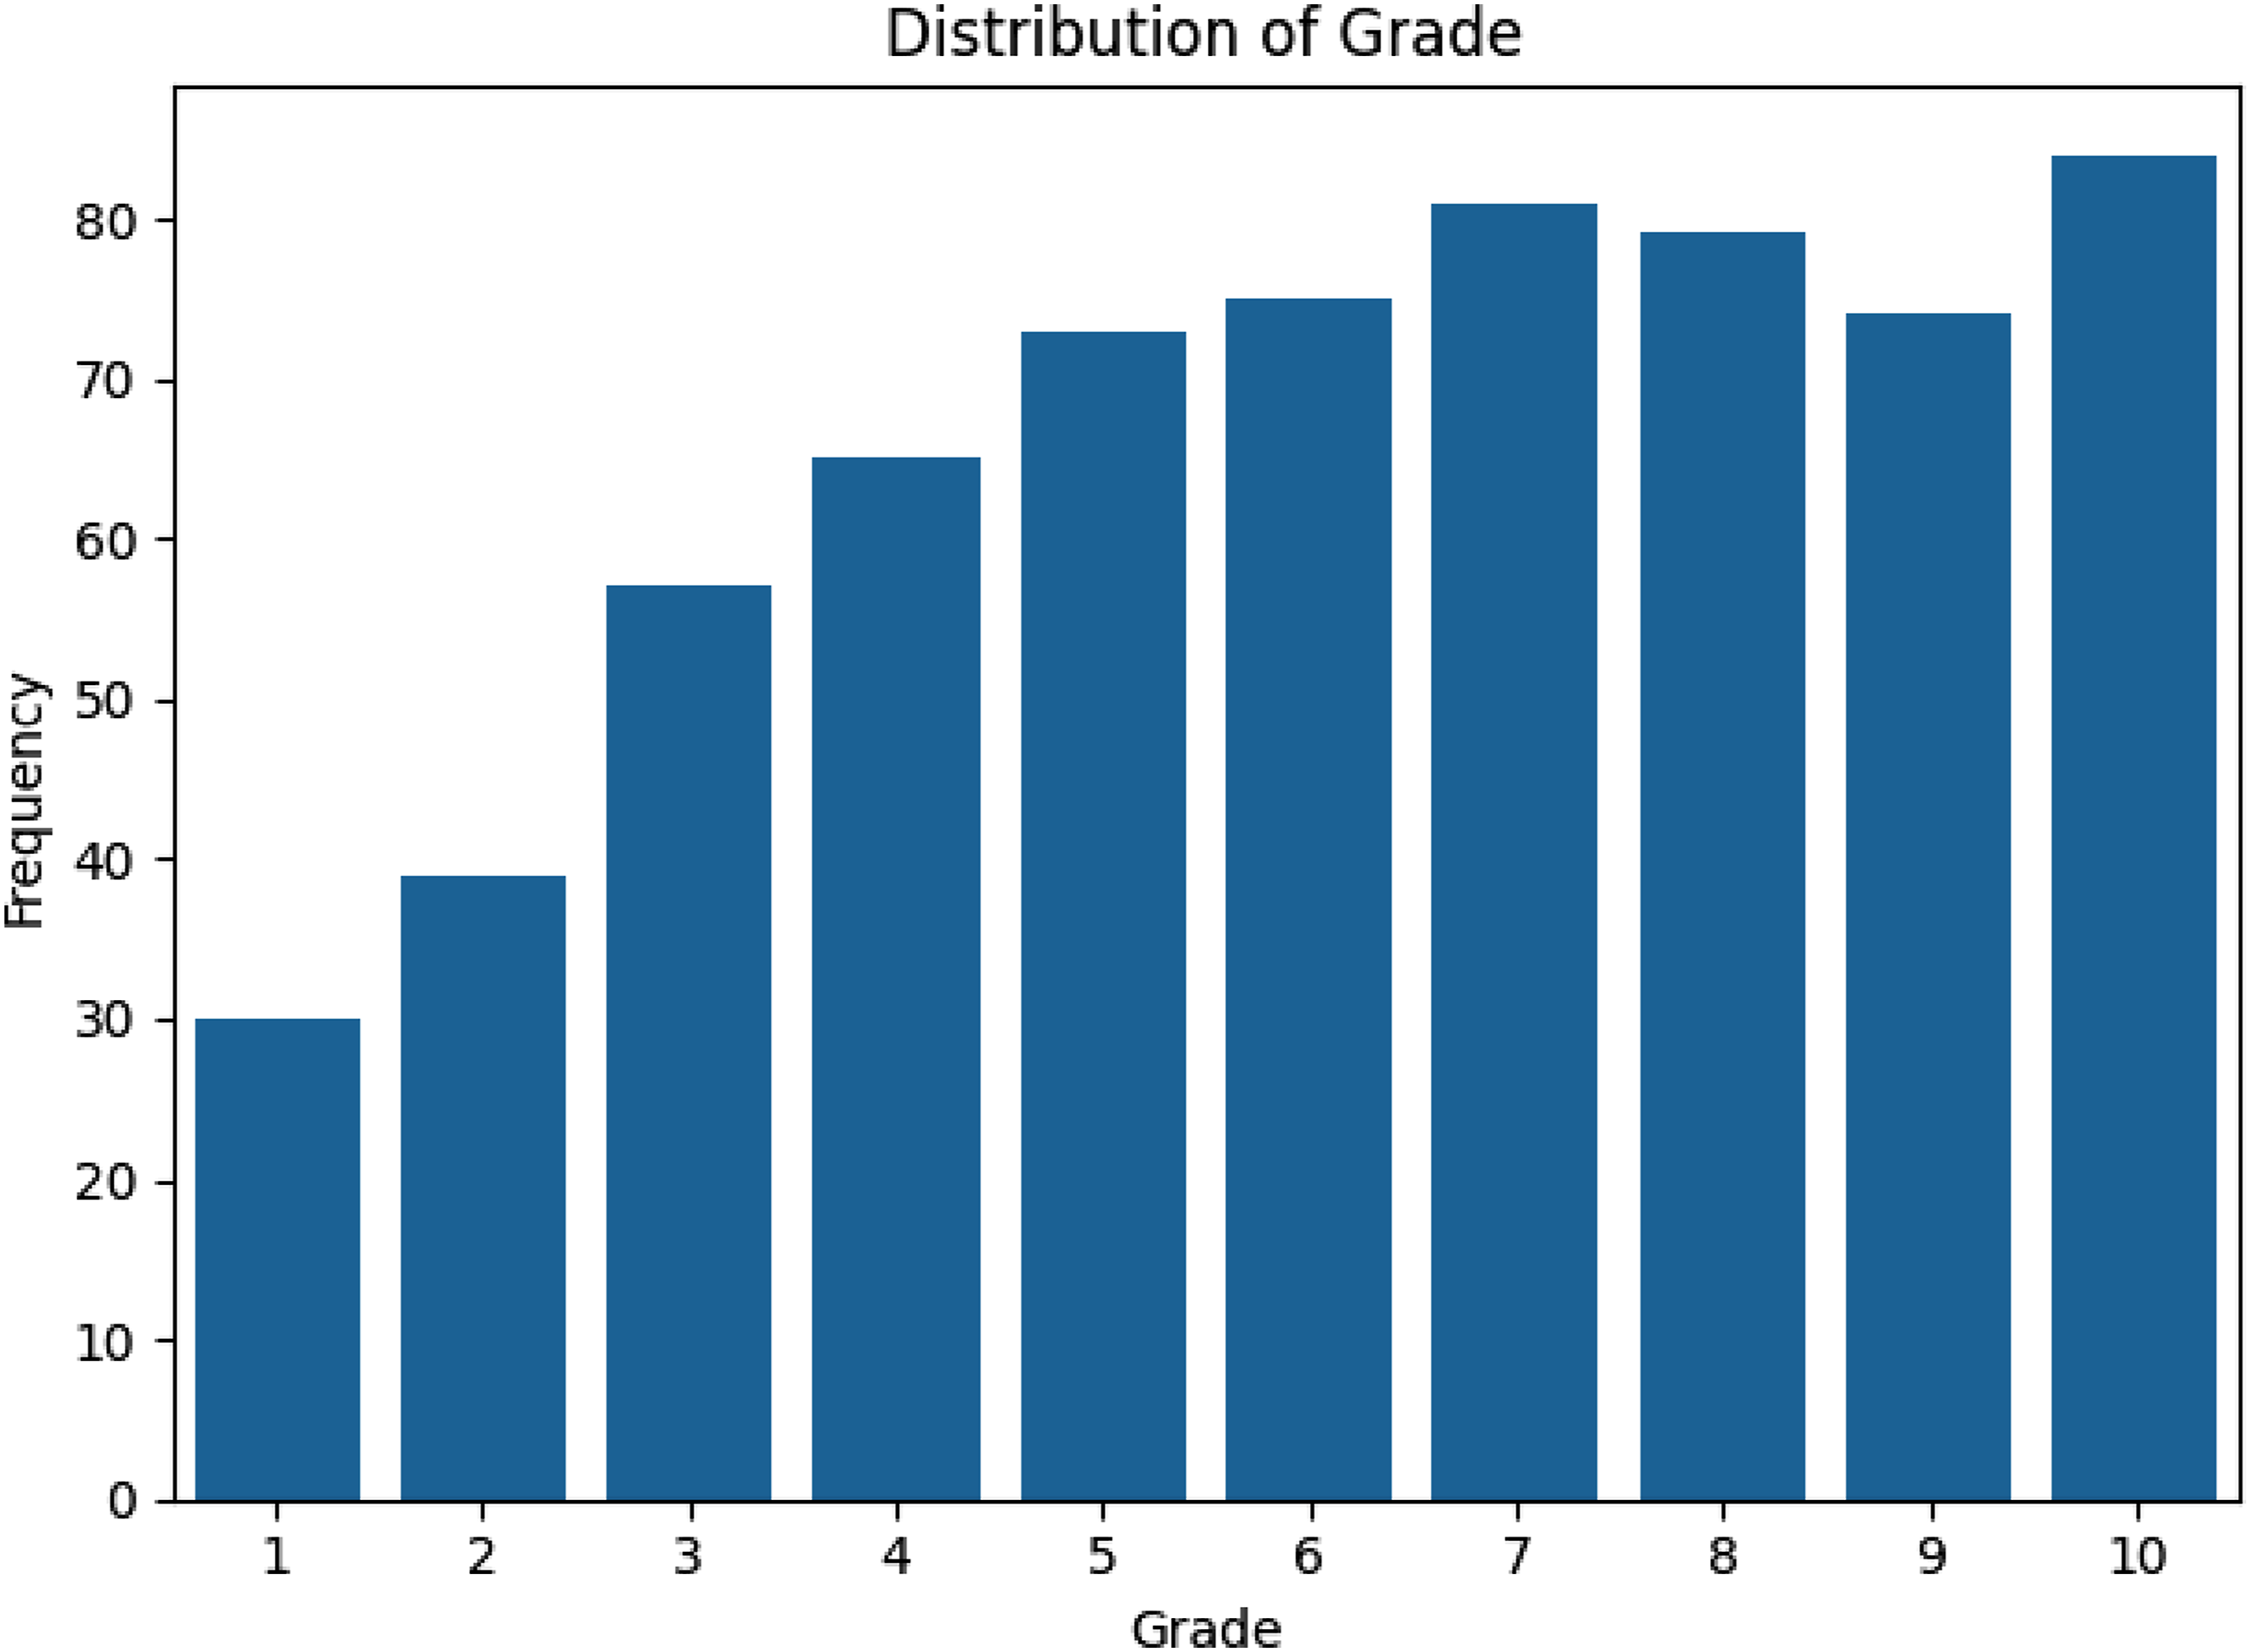
Instruments
Comprehensive Test of Nonverbal Intelligence-2 (CTONI-2). CTONI-2 is a norm-referenced test that utilizes nonverbal stimuli to assess the general intelligence of children and adults. The use of a nonverbal measure of intelligence was considered appropriate for the present sample, as it reduces the influence of language and cultural factors that may affect performance in diverse educational contexts. The test encompasses six subtests. Subtests 1 and 2 (pictorial and geometric analogies) represent stimuli in a 2 × 2 matrix format to assess the cognitive ability of the participants. Respondents must understand the analogy or similarity (e.g., this is to that) indicated by the upper two boxes of the matrix (e.g., as this is to what) to figure out the relationship between the lower boxes of the matrix. Respondents must select one of the five option items to place into the blank box.
Subtests 3 and 4 (pictorial and geometric categories) require respondents to extrapolate the association between two figures and to choose an option that displays the same relationship with the stimulus figures from the presented possibilities. In other words, respondents must deduce which of these is related to those. Subtests 5 and 6 (pictorial and geometric sequences) exhibit a problem-solving sequence format. The respondents are shown a series of boxes incorporating varied progressing in a sequential relationship, and the last box is blank. Participants must select the image that completes the presented sequence from an array of given options (Hammill et al., 2009).
CTONI-2 comprises three composites: the pictorial, the geometric, and the full scales. The full-scale composite represents the overall ability scores on the test. The pictorial scale is aggregated through the scaled scores of the three pictorial subtests of pictorial analogies, categories, and sequences. The geometric scale is constructed by adding the scaled scores of the three geometric subtests of geometric analogies, categories, and sequences. The full-scale index represents the combination of the two scaled scores of all six subtests. It is posited that this index is the best estimate of Spearman’s global factor g (Hammill et al., 2009).
CTONI-2 does not specify a time limit but may take up to 60 min to complete. To score the respondent’s responses, testing is continued until three consecutive incorrect responses are tendered. Each correct item is awarded one point. Four types of standardized scores may be derived from CTONI-2: percentile ranks, scaled scores, age equivalents, and composite scores. The scaled score of each subtest is a standard tally with a mean of 10 and a standard deviation of 3. The scaled scores of the six subtests are used to generate three composite indices: full, pictorial, and geometric scale. Each index displays a mean of 100 and a standard deviation of 15. For example, the pictorial index is calculated by aggregating the scaled scores of the 3 pictorial subtests (analogies, categories, and sequences) to obtain an index with a mean of 100 and a standard deviation of 15. The geometric index is calculated the same way. The full scale (IQ) index is computed by combining the subscales of all six subtests. Exploratory factor analysis was used in the present study to examine whether the underlying structure is consistent within the current sample, given the cultural and contextual differences of the population.
For the present study, an exploratory factor analysis was used to examine the factor structure of the CTONI-2. The direct oblimin rotation yielded one factor with an eigenvalue greater than 1 (3.40), which accounted for 56.76% of the total variance. The factor structure was similar to the original single factor obtained by the test authors. For convergent validity, the full-scale scores attained by the participating students were compared to their assessed IQ on Raven’s Standard Progressive Matrices (Raven, 2000). The results disclosed a medium correlation between the two assessments (r = .48, p < .01). The reliability of the subscales was measured using Cronbach’s alpha. The reliability coefficients for the subtests and composites were pictorial analogies (.91), geometrical analogies (.93), pictorial categories (.87), geometric categories (.88), pictorial sequences (.89), geometric sequences (.91), pictorial scale composite (.86), geometric scale composite (.92), and full scale (.90).
Profile of Creative Abilities (Ryser, 2007). The PCA is used to assess creative ability. The test is designed to identify students who are distinguished in creative thinking, monitor the creative thinking progress of students, and c) help as a research tool. The PCA was developed according to two models: Guilford’s Structure of Intellect (Guilford, 1959), which includes three dimensions that govern discrete types of cognitive abilities such as operation, content, and product; and Amabile’s (1996) Componential Model of Creativity, which encompasses three components of creativity, namely, domain-relevant skills, creativity-related skills, and intrinsic task motivation.
The PCA comprises two subtests that assess divergent production. This use of divergent thinking as an indicator of creative potential is consistent with more recent research in the field (Frith et al., 2021; Gerwig et al., 2021). The first subset of drawing requires students to respond to 10 stimuli in 30 min or less. Participants can use each stimulus to develop a detailed and original picture. The subtest is scored according to four structure-of-intellect, namely, sensitivity to problems, creative abilities, redefinition, originality, and penetration.
Sensitivity to problems denotes the number of new elements added to a drawing by a child in response to a given stimulus. Originality refers to the uniqueness of a drawing as compared to the normative sample. Redefinition alludes to the orientation by which the respondent changes the drawing location or position. Penetration indicates the extent to which a participant can delve beyond the surface image.
The second subtest of categories asks students to generate as many classifications as possible in 3 min. This subtest contains 4 by 5 matrices of 20 figures and animal pictures. The student must develop groups of at least three pictures or figures and must describe in writing how the images belong together. This subtest is scored based on two SOI creativity abilities: flexibility and fluency. Flexibility denotes the number of groups or categories a student can generate from the given pictures of figures. Fluency indicates the number of responses generated by the student (Ryser, 2007).
The reliability of the PCA subtest scores was tested for this study through three methods. First, the split-half technique was used to assess the content sampling of the drawing test. The two scores obtained by the participating students were computed by dividing the subtest into two halves and finding correlations between both. Each drawing stimulus offered in this subtest was scored using four criteria: originality, new elements, perspective, and orientation. The subtest was split to discover the relationship between the sum of scores related to drawing Stimuli 1, 3, 5, and 7 and the sum of scores associated with drawing Stimuli 2, 4, 6, and 8. The Spearman–Brown formula was then employed to calculate the internal consistency of the drawing subset. The results revealed the internal consistency of .82, p < .01 for the subtest. The second reliability method involved the use of the coefficient alpha to explore the internal consistency of the creativity index score (combination of drawing and categories subtests) based on Guilford’s (1954) formula. In this study, Cronbach’s alpha of the drawing subtest stimuli was .84 and .82, p < .01 for the test elements related to categories (two flexibility items and two fluency items). The third reliability method tested inter-rater consistency: two independent raters (trained graduate research assistants) were instructed to score the same tasks, and the interclass correlation between their ratings was .87, p < .01. Almost no disagreements were detected for these independent ratings. The authors of the PCA instrument testified to the validity of its content.
Meeker et al. (1975) developed the SOI Learning Abilities Test based on Guilford’s SOI model. The PCA drawing subtest is similar in its format to the Divergent Production of Figural Units. Additionally, the drawing subtest is similar to the TTCT-figural picture completion (Ryser, 2007). The relationship between the standard scores of the two subtests (drawing and categories) was found to be r = .28, p < .01. This outcome was similar to the results obtained by the original test authors for the norming sample. The relationship between the creativity index of students in the PCA and their IQ score in CTONI-2 was explored to ascertain the discriminant validity. The results evinced a low correlation between the two tests, r = .12, p < .01. It should be noted that the PCA primarily assesses divergent thinking ability, which represents only one aspect of creativity, and does not fully capture broader forms of real-world creative performance.
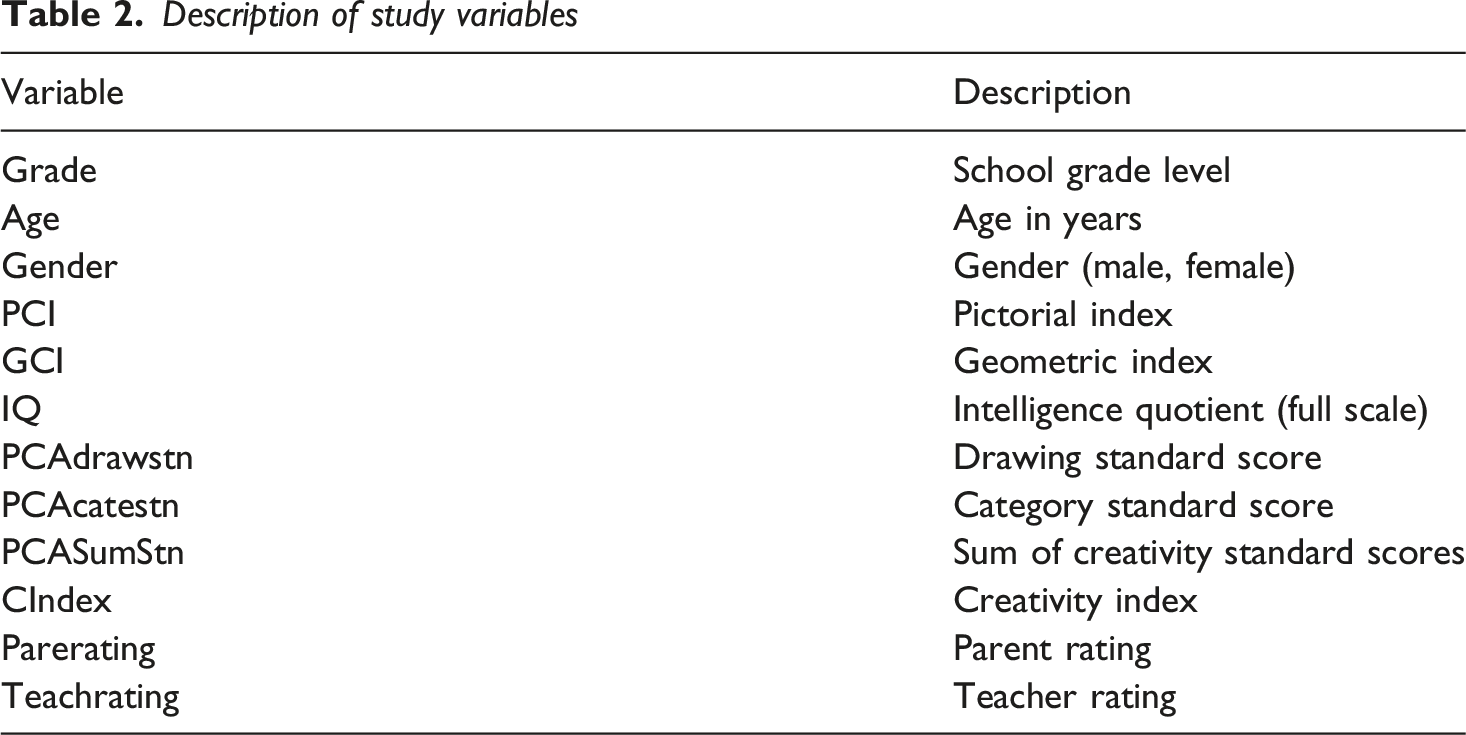
Description of study variables
Procedure
This study was sponsored by a national research grant. It involved 15 research assistants selected from 5 governorates (Muscat, Al-Sharqiyah South, Dhofar, Al-Batinah North, and Al-Dakhiliyah) based on the following criteria: certification in an educational field, experience with data collection and research ethics, and willingness and motivation to participate in the study, and motivation to work with school students.
The grant team conducted an extensive one-day workshop that offered the assistants detailed information about the administration guidelines, the challenges they could expect to encounter during the administration of the study instruments, administrative coordination with schools across the five governorates, and ethical considerations during the administration of the study instruments.
Before the study instruments were administered, ethical approval was obtained from the Technical Office for Research and Development at the Ministry of Education to administer the study instruments to the students at the concerned schools.
A total of 30 schools were selected from the 5 governorates. The research assistants approached these schools to obtain consent forms from students and parents. After securing the consent forms, the research assistants coordinated with each school’s administration to finalize the timing and classroom allotments for the two study instruments to be administered.
The study instruments were administered in a pre-arranged classroom or hall in the schools. The assistants briefed the students on the tests, issued appropriate instructions, and provided clarification when needed to ensure consistency in administration and maintain the integrity of the data collection process.
The data collected through this procedure were later screened and reduced during the data preparation stage, resulting in a final analytic sample of N = 657 participants used in the statistical analyses.
Analytical Approach
To examine the relationship between intelligence and creativity, a series of regression models were estimated including linear, quadratic (nonlinear), and segmented (piecewise) models, using the cleaned dataset (N = 657). The analysis was conducted in stages to allow comparison between different model specifications.
First, a simple linear regression model was estimated to examine the direct relationship between IQ and total creativity (PCASumStn). This model provided a baseline estimate of the association between the two variables.
Second, a nonlinear (quadratic) regression model was estimated by including a squared IQ term (IQ2) in addition to the linear term. This step was included to test whether the relationship departs from linearity. Model fit was compared using R2 as well as information criteria (AIC and BIC), which indicated a slight improvement in fit for the quadratic model compared to the linear model (R2 = .019 vs .009; AIC = 3853.43 vs 3857.53).
Third, a segmented (piecewise) regression model was applied to examine whether the relationship between intelligence and creativity changes across different levels of IQ. Two breakpoint variables (seg1 and seg2) were created at IQ values of 101 and 119, allowing separate slopes to be estimated across three segments of the IQ distribution. In addition, a data-driven breakpoint estimation procedure using segmented (piecewise) regression identified a breakpoint near IQ = 119. This was further evaluated using an F-test comparison between the linear and segmented models (similar to a Davies-type test), which showed a significant improvement over the linear model (F = 11.39, p < .001).
Segment-specific correlations were also computed to examine the direction and strength of the relationship within each IQ range. The results indicated a weak negative association below IQ = 101, a small positive association between IQ = 101 and 119, and a negative association above IQ = 119. The segmented model explained slightly more variance than the linear and quadratic models (R2 = .028).
In addition to the main models, further analyses were conducted to examine subgroup differences. Separate segmented regression models were estimated for male and female students. The results showed some variation in the strength of the relationship across groups, with a slightly higher explanatory power for males (R2 = .060) compared to females (R2 = .012).
Finally, interaction models were estimated including IQ, IQ2, gender, grade, and interaction terms (IQ × Gender and IQ × Grade). These models allowed examination of whether the relationship between intelligence and creativity varies depending on demographic factors. The overall model including interaction terms showed improved explanatory power compared to simpler models (R2 = .099).
Results
In this study, we analyzed the dataset that varied concerning participants’ class ranging from grade 1 to 10, with gender distrbution males = 325, females = 332 using the different regression analysis. The data set included scores of pictorial intelligence and geometric intelligence summarized by IQ scores, and creativity score. The analysis was based on a total sample of (N = 657) after data cleaning and excluding cases based on standardized z-scores (±3 SD).
Assumption Checks and Preliminary Diagnostics
Using scatterplot we have conducted preliminary graphical inspection and residual diagnostic plots. Scatterplots were used to explore the general form of the relationship between IQ and creativity and to inspect potential nonlinear patterns seen in Figure 3. Residual plots and Q–Q plots were also tested to assess regression assumptions, this included homoscedasticity and approximate normality of residuals shown in Figure 5. Visual inspection did not indicate substantial violations of homoscedasticity, and residuals appeared approximately normally distributed with only minor deviations at the tails. Scatterplot showing the relationship between IQ scores and total creativity (Pcasumstn) for the study sample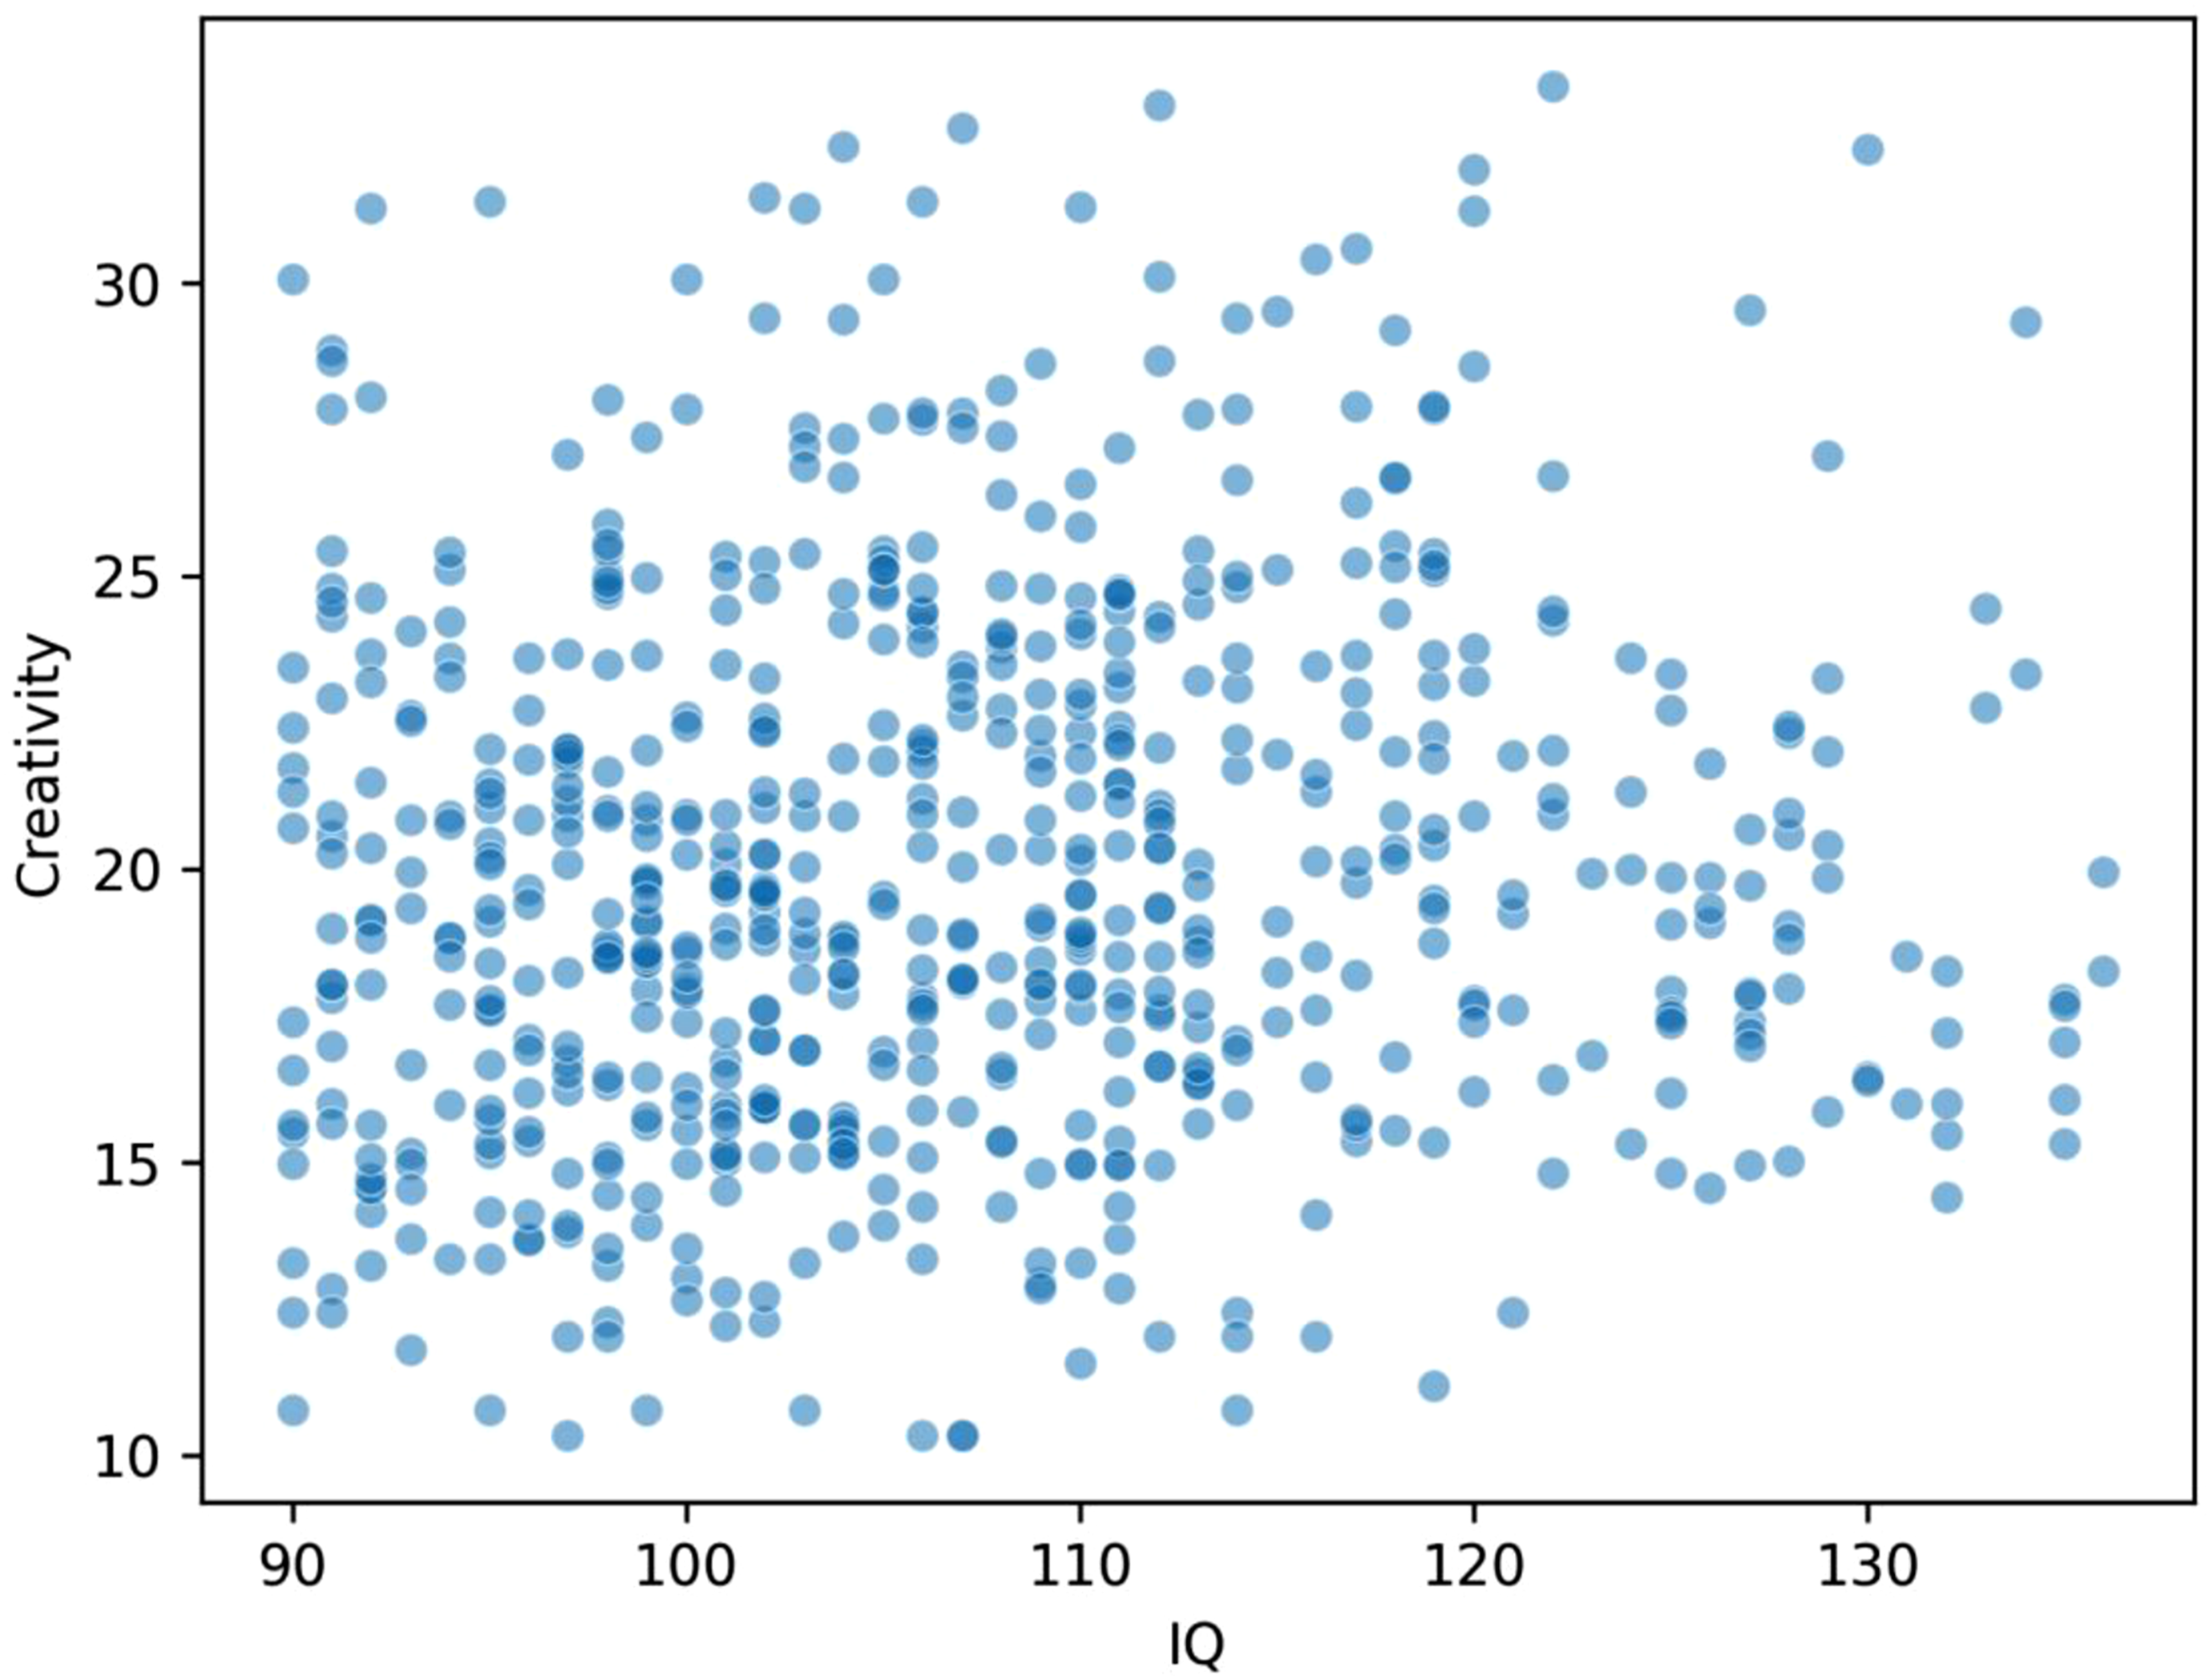
Figure 4 shows that the correlation matrix indicates a weak positive association between IQ and total creativity (r = .10). This finding is consistent with the regression results, which showed that the overall relationship between intelligence and creativity is small. Correlation matrix showing the relationships among intelligence, creativity, and study variables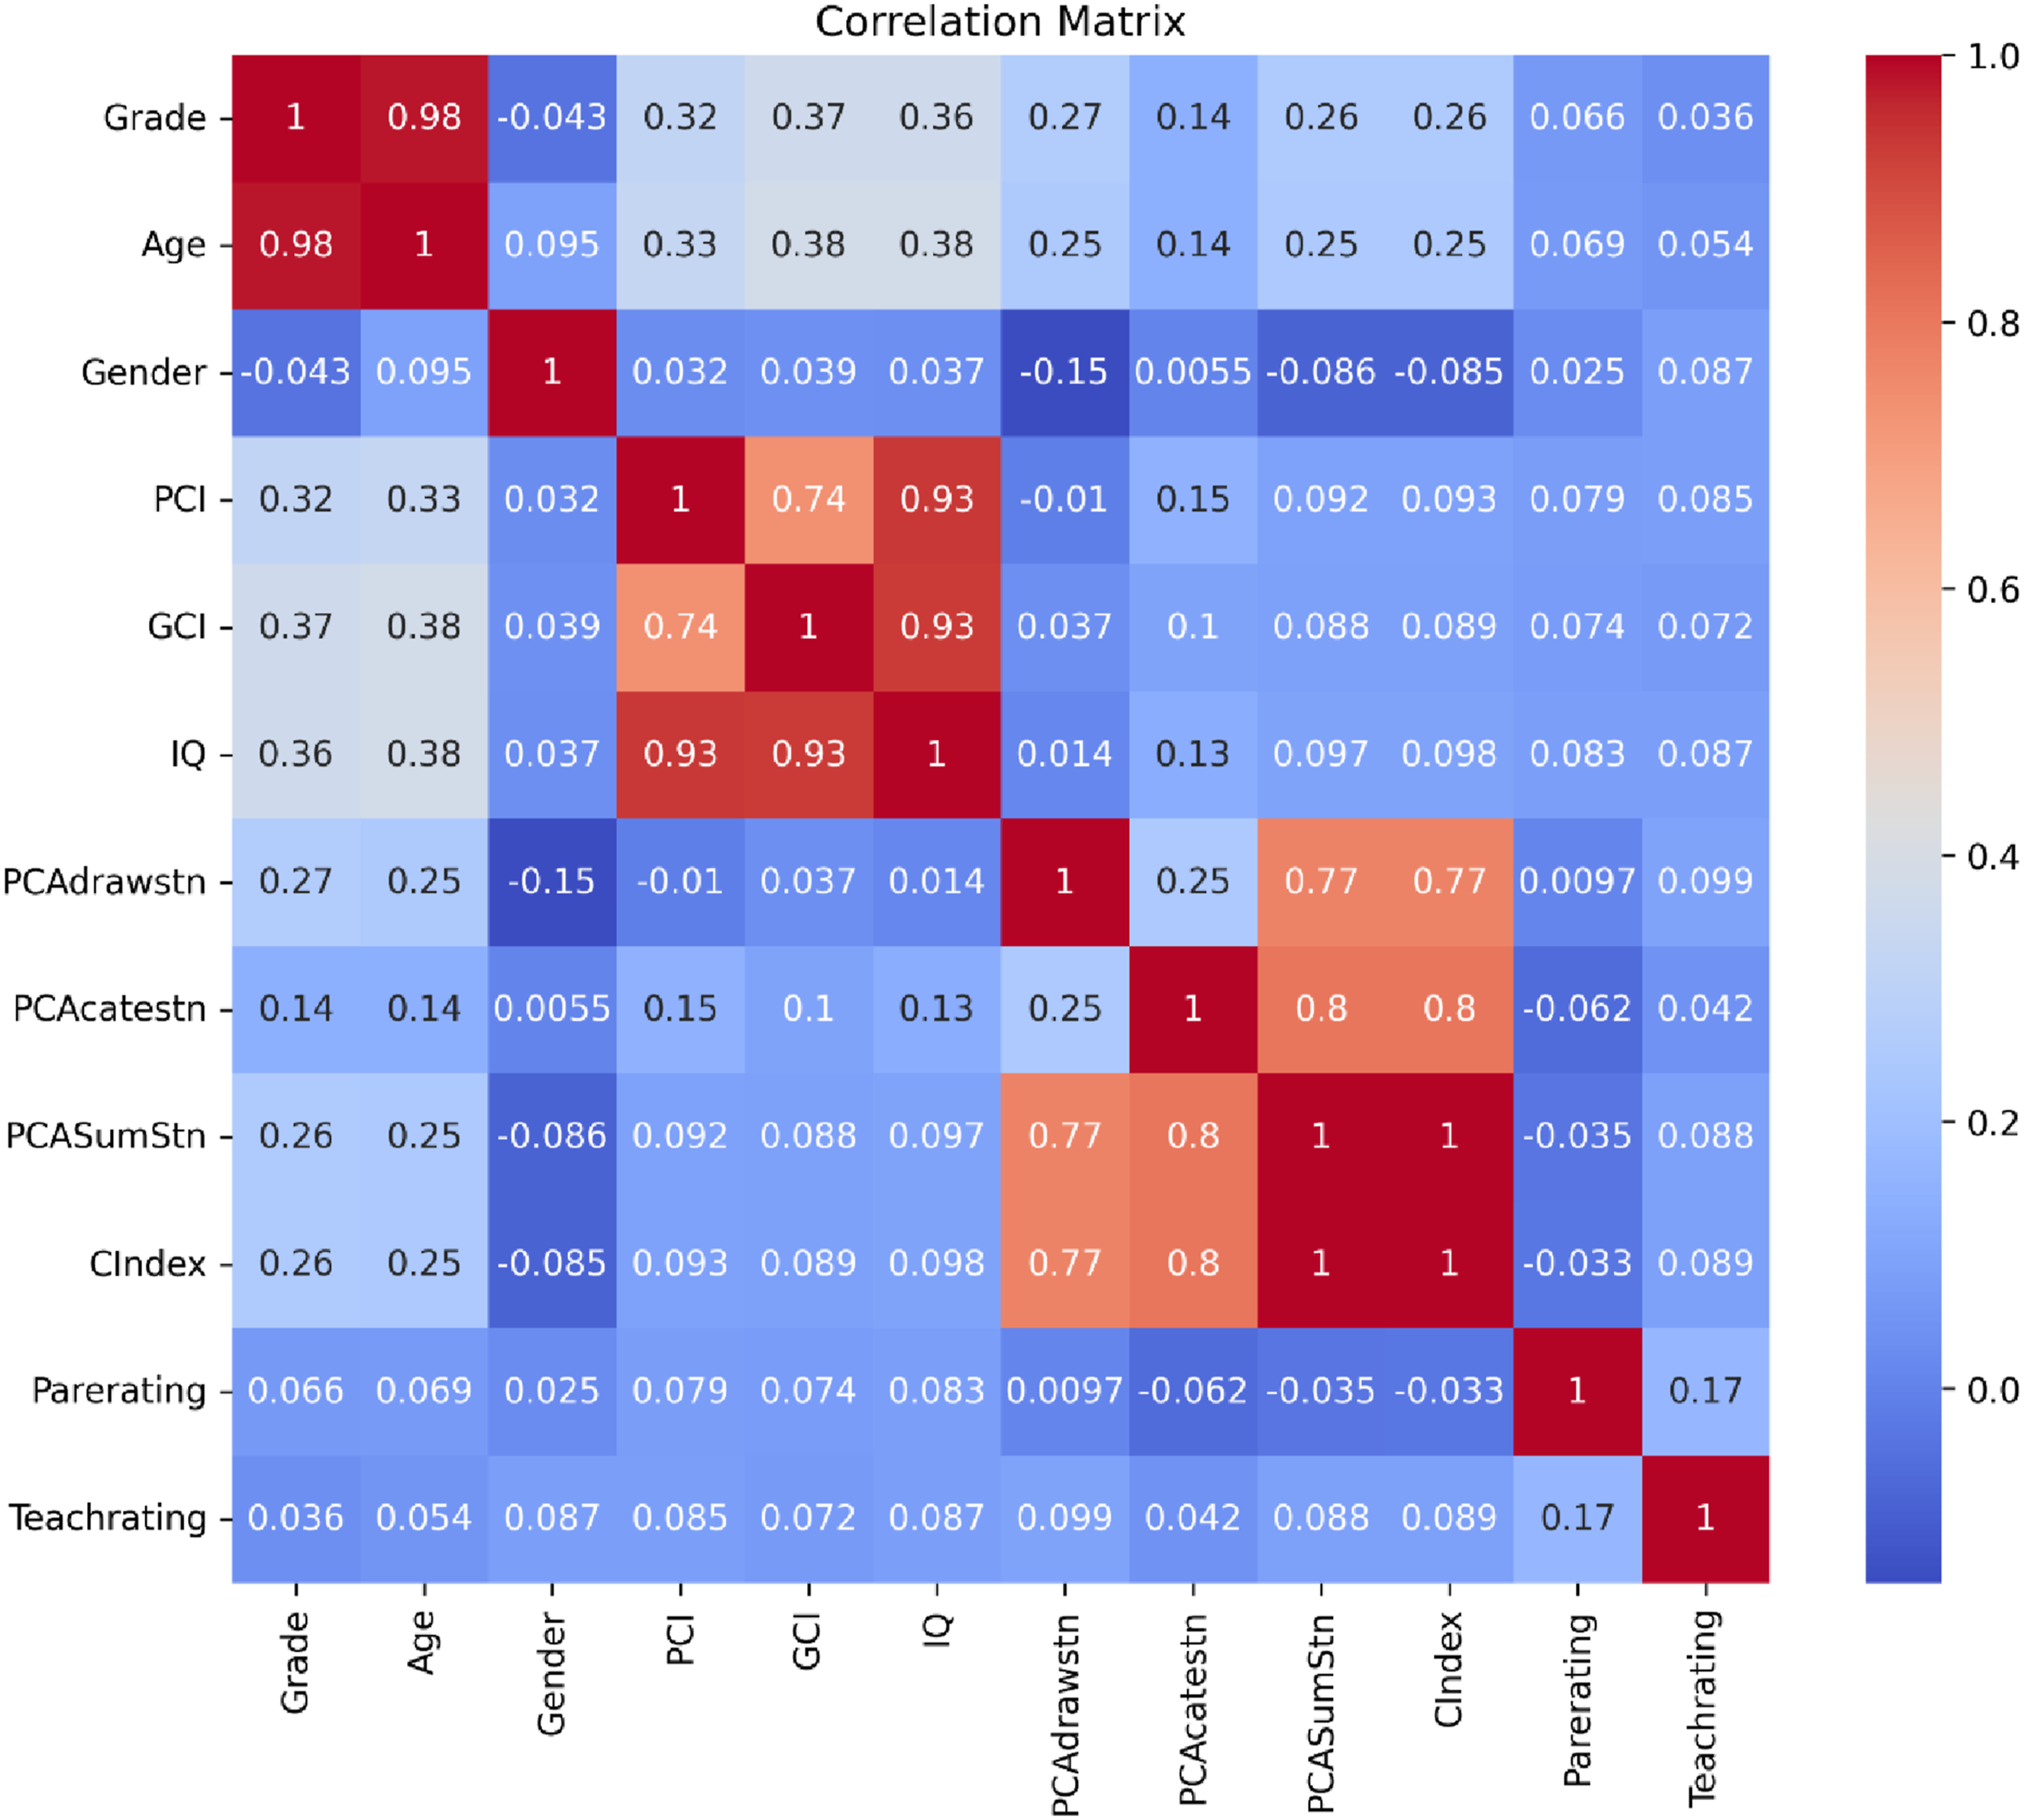
Figure 5 shows that the Q–Q plot indicates that the residuals are approximately normally distributed, with slight deviations at the tails. These minor deviations are acceptable and do not substantially affect the validity of the regression models. Q–Q plot of residuals for total creativity (Pcasumstn)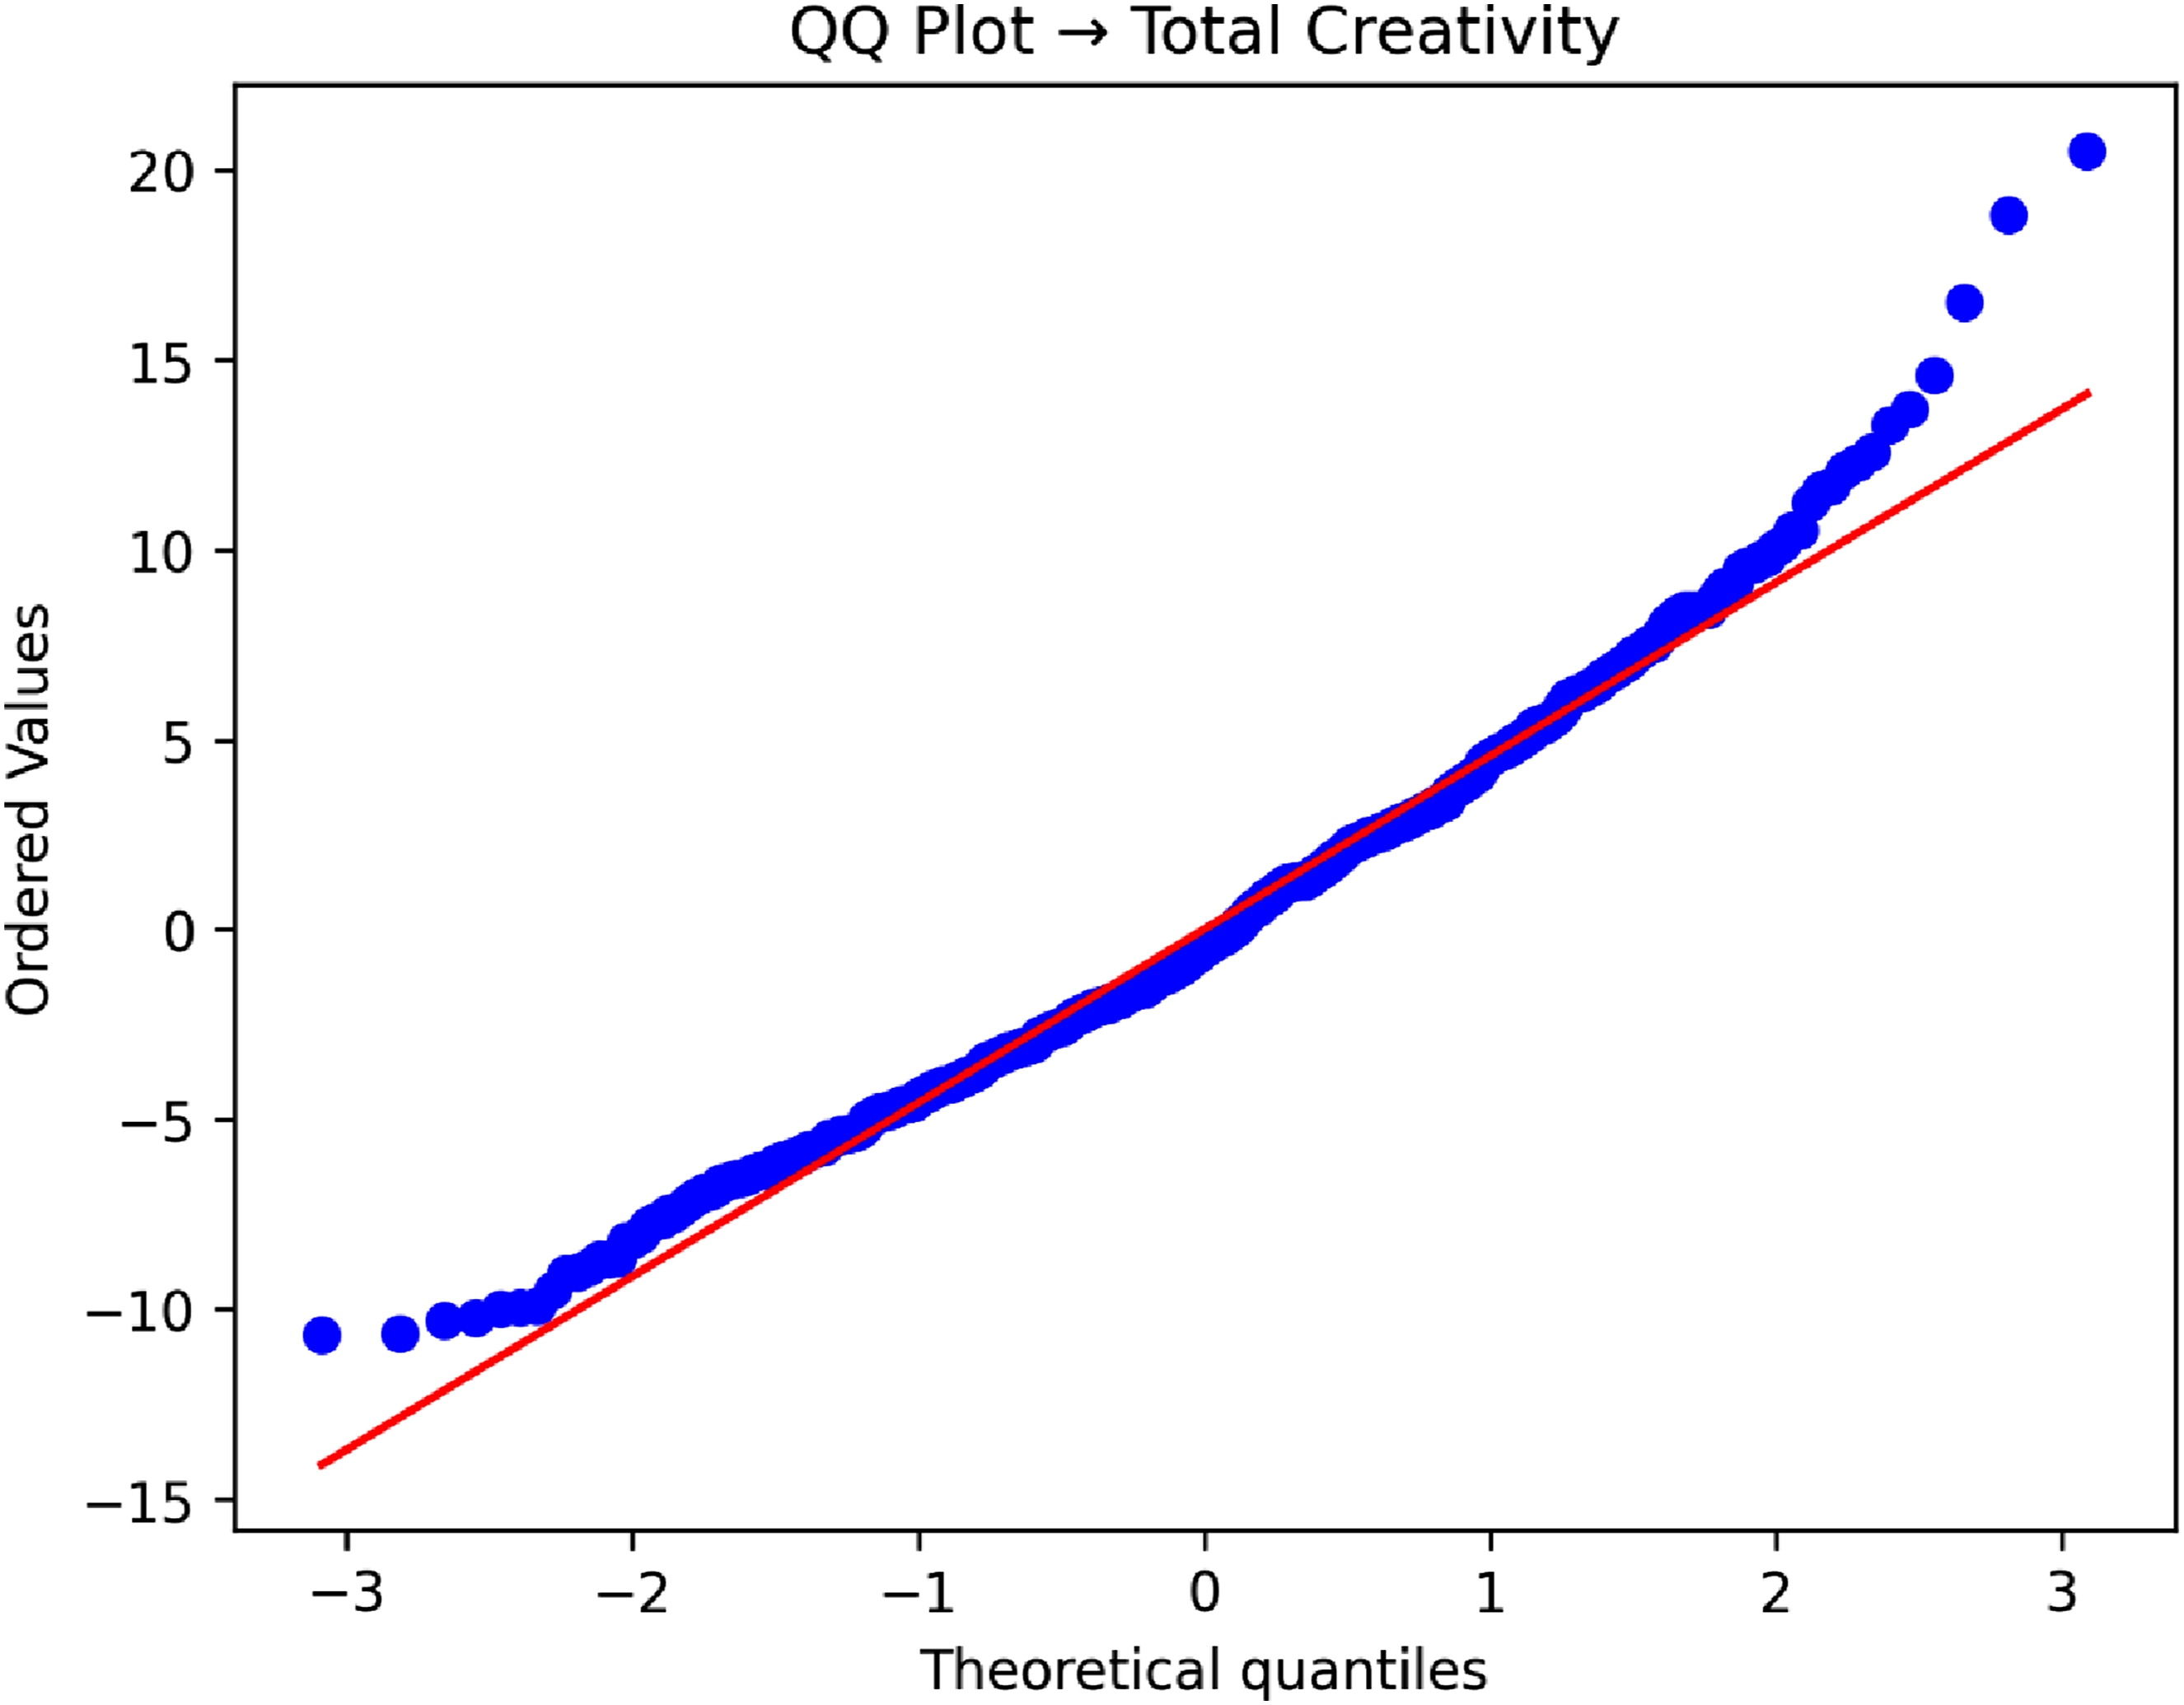
Model Comparison Analyses
Quadratic Model
Since non-linear relationships were observed, quadratic regression was calculated to explore the relationship between creativity and IQ score of students. The result showed a statistically significant relationship (F = 6.17, p = .002).
The combined contribution of the predictors was approximately R2 = .019, indicating about 1.9% of the variance explained as illustrated in Figure 6, the nonlinear plot suggests a slight curvilinear relationship between IQ and creativity. However, the overall pattern remains weak, which is consistent with the low explanatory power of the quadratic model. Nonlinear (quadratic) relationship between IQ and total creativity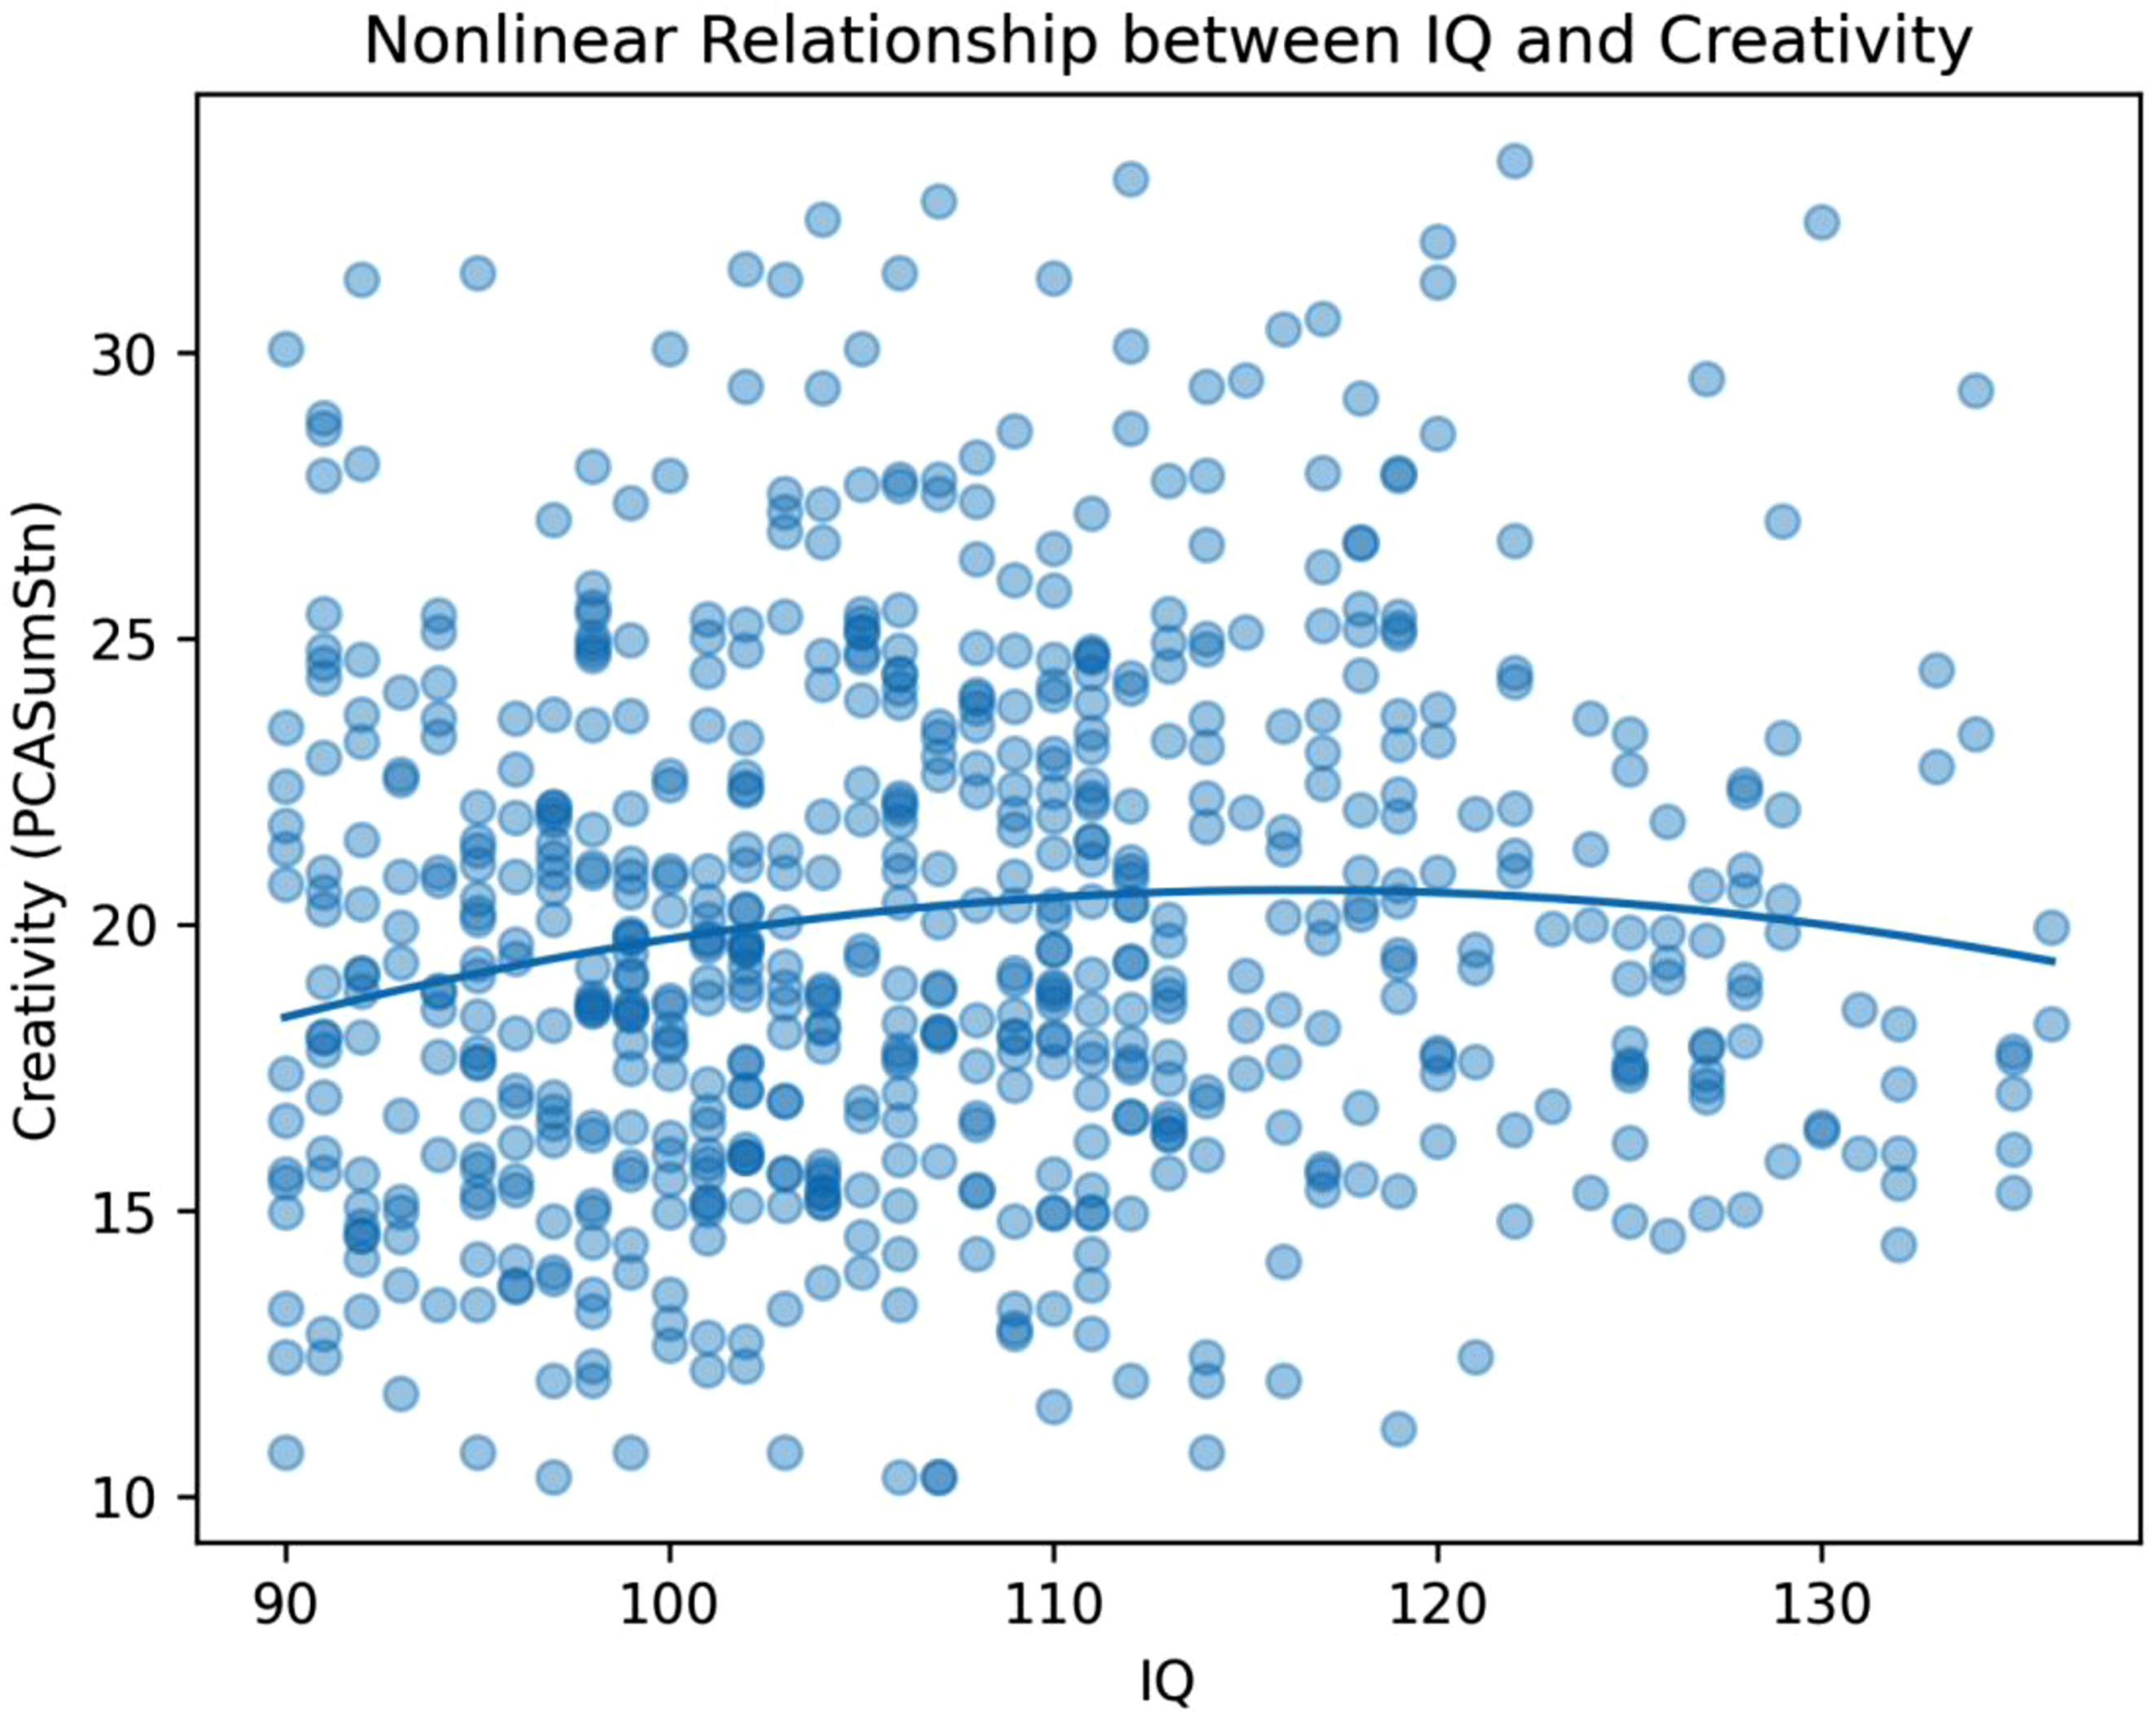
Model comparisons indicated that the two-breakpoint segmented model have provided only a modest improvement using simpler models, while the first breakpoint at IQ = 101 was not statistically significant.
Segmented Regression Analyses
We estimated a segmented regression model for the full sample (N = 657) to examine if the relationship between IQ and creativity differed across levels of intelligence. The model was computed with the assumption of two breakpoints shown in Figure 7. The breakpoint at IQ = 101 was included as part of the predefined segmented model specification; however, the change in slope at this point was not statistically significant and should therefore be interpreted with caution. In contrast, the breakpoint at IQ = 119 showed a statistically significant change in slope and was more strongly supported by the data. Segmented regression plot showing the relationship between IQ and total creativity (Pcasumstn), with breakpoints at IQ = 101 and IQ = 119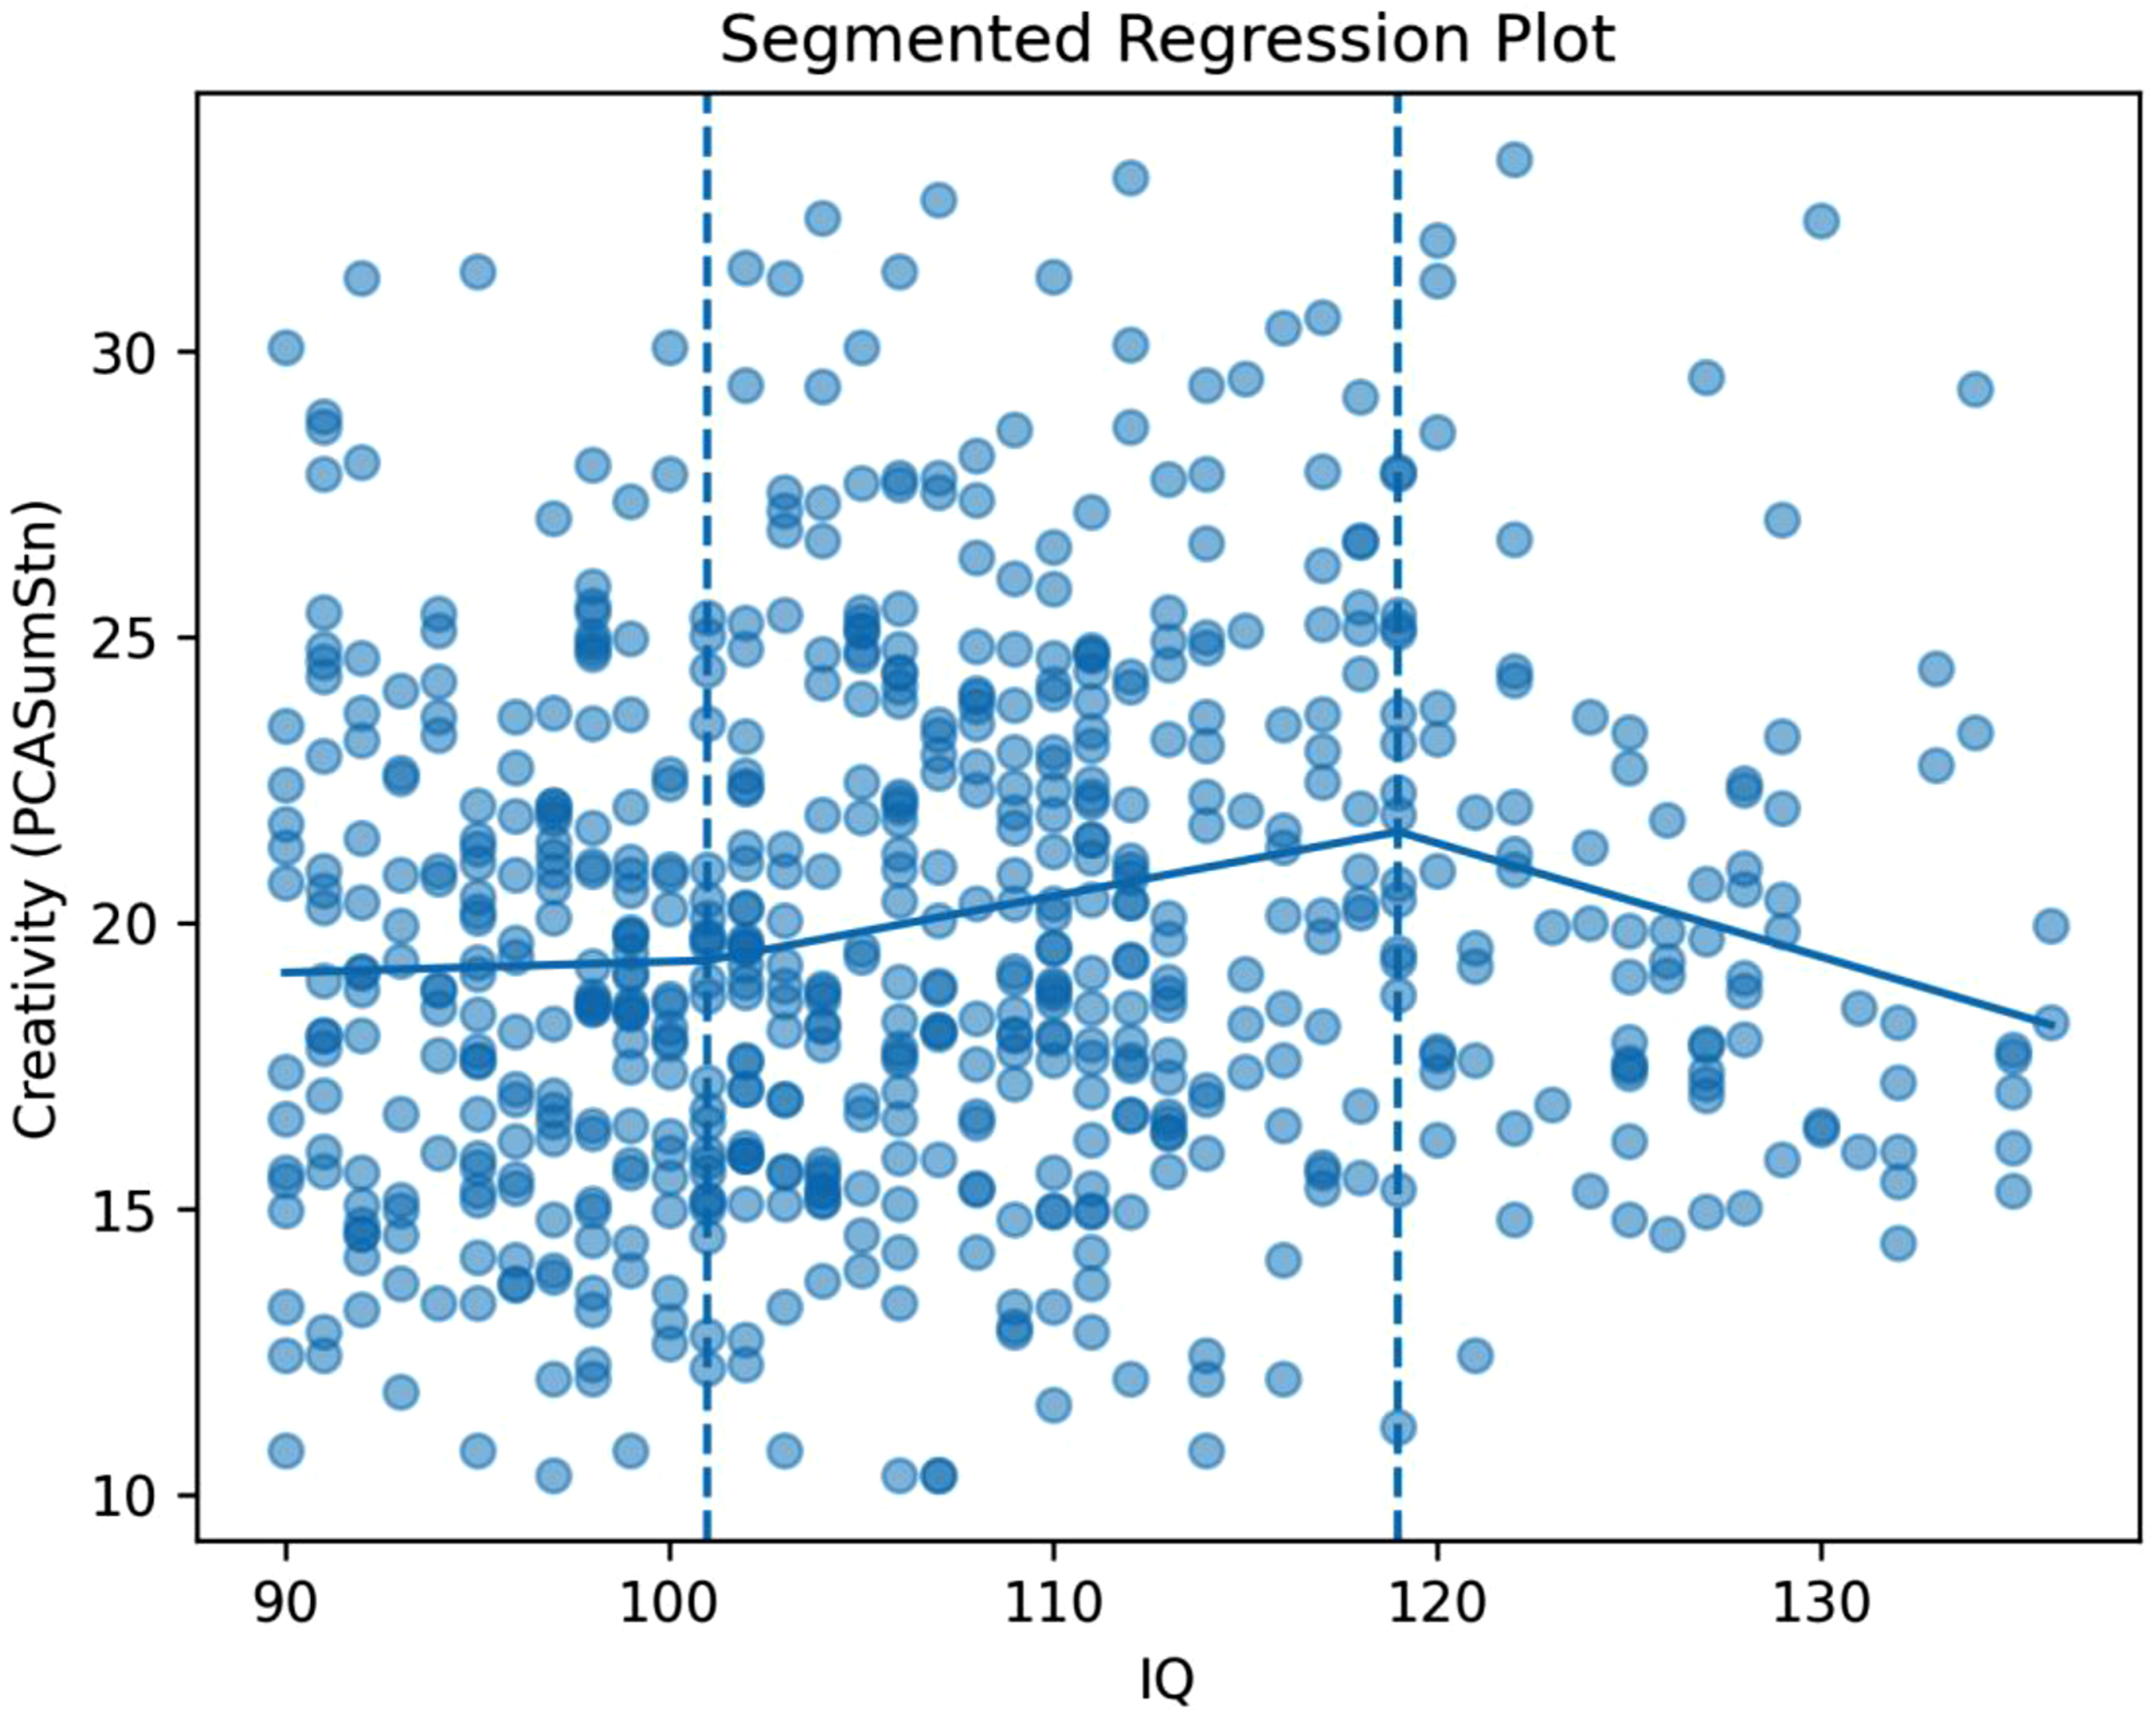
The first breakpoint was noticed at IQ = 101 with an estimated slope change of 0.106, which was not statistically significant. The second breakpoint was detected at IQ = 119 with an estimated slope change of −0.324, which was statistically significant (p < .001).
The bivariate correlation between creativity and IQ below the breakpoint of IQ = 101 was not statistically significant (r = −0.042, p = .544). Between IQ = 101 and IQ = 119, the correlation was weak but statistically significant (r = .110, p = .042). Above IQ = 119, the correlation was statistically significant and negative (r = −0.214, p = .028).
Figure 7 demonstrates that the relationship between IQ and creativity varies across different levels of IQ. A slight positive trend is observed between IQ = 101 and 119, followed by a negative trend above IQ = 119. Hence, the prediction model can be expressed in statistical terms as follows: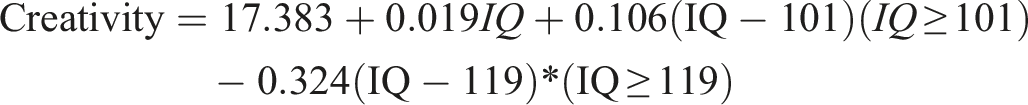
The explained variance by IQ is represented by R-square = .028, indicating that the model explains approximately 2.8% of the variability in creativity. Accordingly, the identified breakpoints should be interpreted as exploratory rather than definitive evidence of a threshold effect.
Exploratory Subgroup and Moderation Analyses
Segmented regression models were also separately estimated for male and female students to explore potential subgroup differences in the relationship between IQ and creativity.
Females (n = 332)
The segmented regression analyses were calculated for the two breakpoints of IQ = 101 and IQ = 119. The estimate change of slope was not significant at IQ = 101, while the second slope change at IQ = 119 was negative and marginal.
The explained variance in the model represented by R-square = .012, indicating that the model explains about 1.2% of the variability in creativity for females.
Males (n = 325)
The segmented regression analyses were calculated for the two breakpoints of IQ = 101 and IQ = 119. The first slope change was not significant, while the second slope change at IQ = 119 was negative and statistically significant. The explained variance in the model represented by R-square = .060, indicating that the model explains about 6.0% of the variability in creativity for males.
Figure 8 suggests that the relationship between IQ and creativity differs across gender groups. A positive trend is observed for males, whereas the relationship for females appears relatively flat. These subgroup patterns should be interpreted cautiously because formal interaction effects were exploratory in nature. Interaction plot showing the relationship between IQ and total creativity (Pcasumstn) across gender groups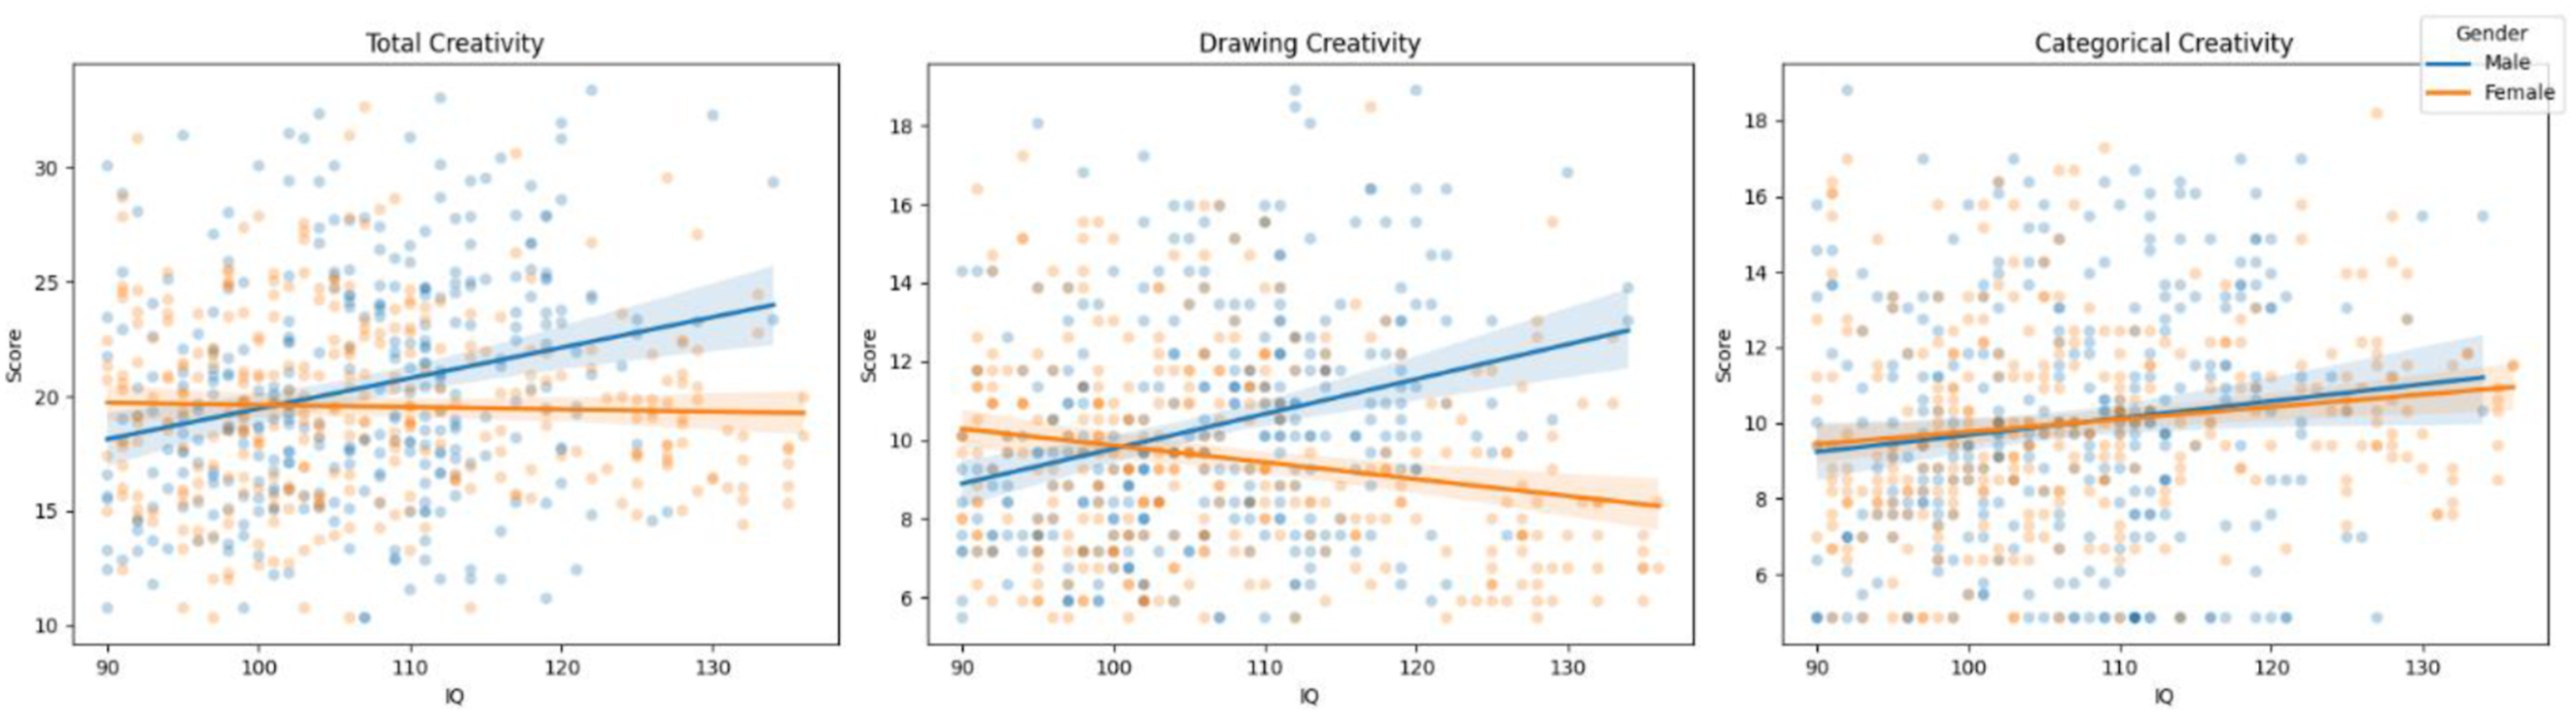
Interaction Model
Gender was added to the quadratic regression model to explore its controlling effect. The combined model showed improved explanatory power, explaining approximately 9.9% of the variance in creativity (R2 = .099), as illustrated in Figure 8.
Discussion
The purpose of this study was to examine the relationship between creativity and intelligence in a non-Western sample using linear, quadratic, and segmented regression analyses. The findings provide limited support for the existence of a stable threshold in the relationship between creativity and intelligence.
Across the models used in the study, the results showed little evidence for a strong or stable threshold between creative thinking and non-verbal intelligence. The linear model showed only a weak positive association, further supporting the overall small relationship between intelligence and creativity. These findings are consistent with studies that did not find strong support for a threshold (e.g., Gerwig et al., 2021; Preckel et al., 2006; Sligh et al., 2005; Weiss et al., 2020).
As illustrated in Figure 9, the relationship between intelligence and creativity varies depending on the analytical model used. While the linear model suggests a weak positive trend, the segmented and quadratic models indicate slight nonlinear variation, although the overall pattern remains modest. Comparison of Linear, Quadratic, and Segmented Regression Models Showing the Relationship between IQ and Total Creativity (PCASumStn)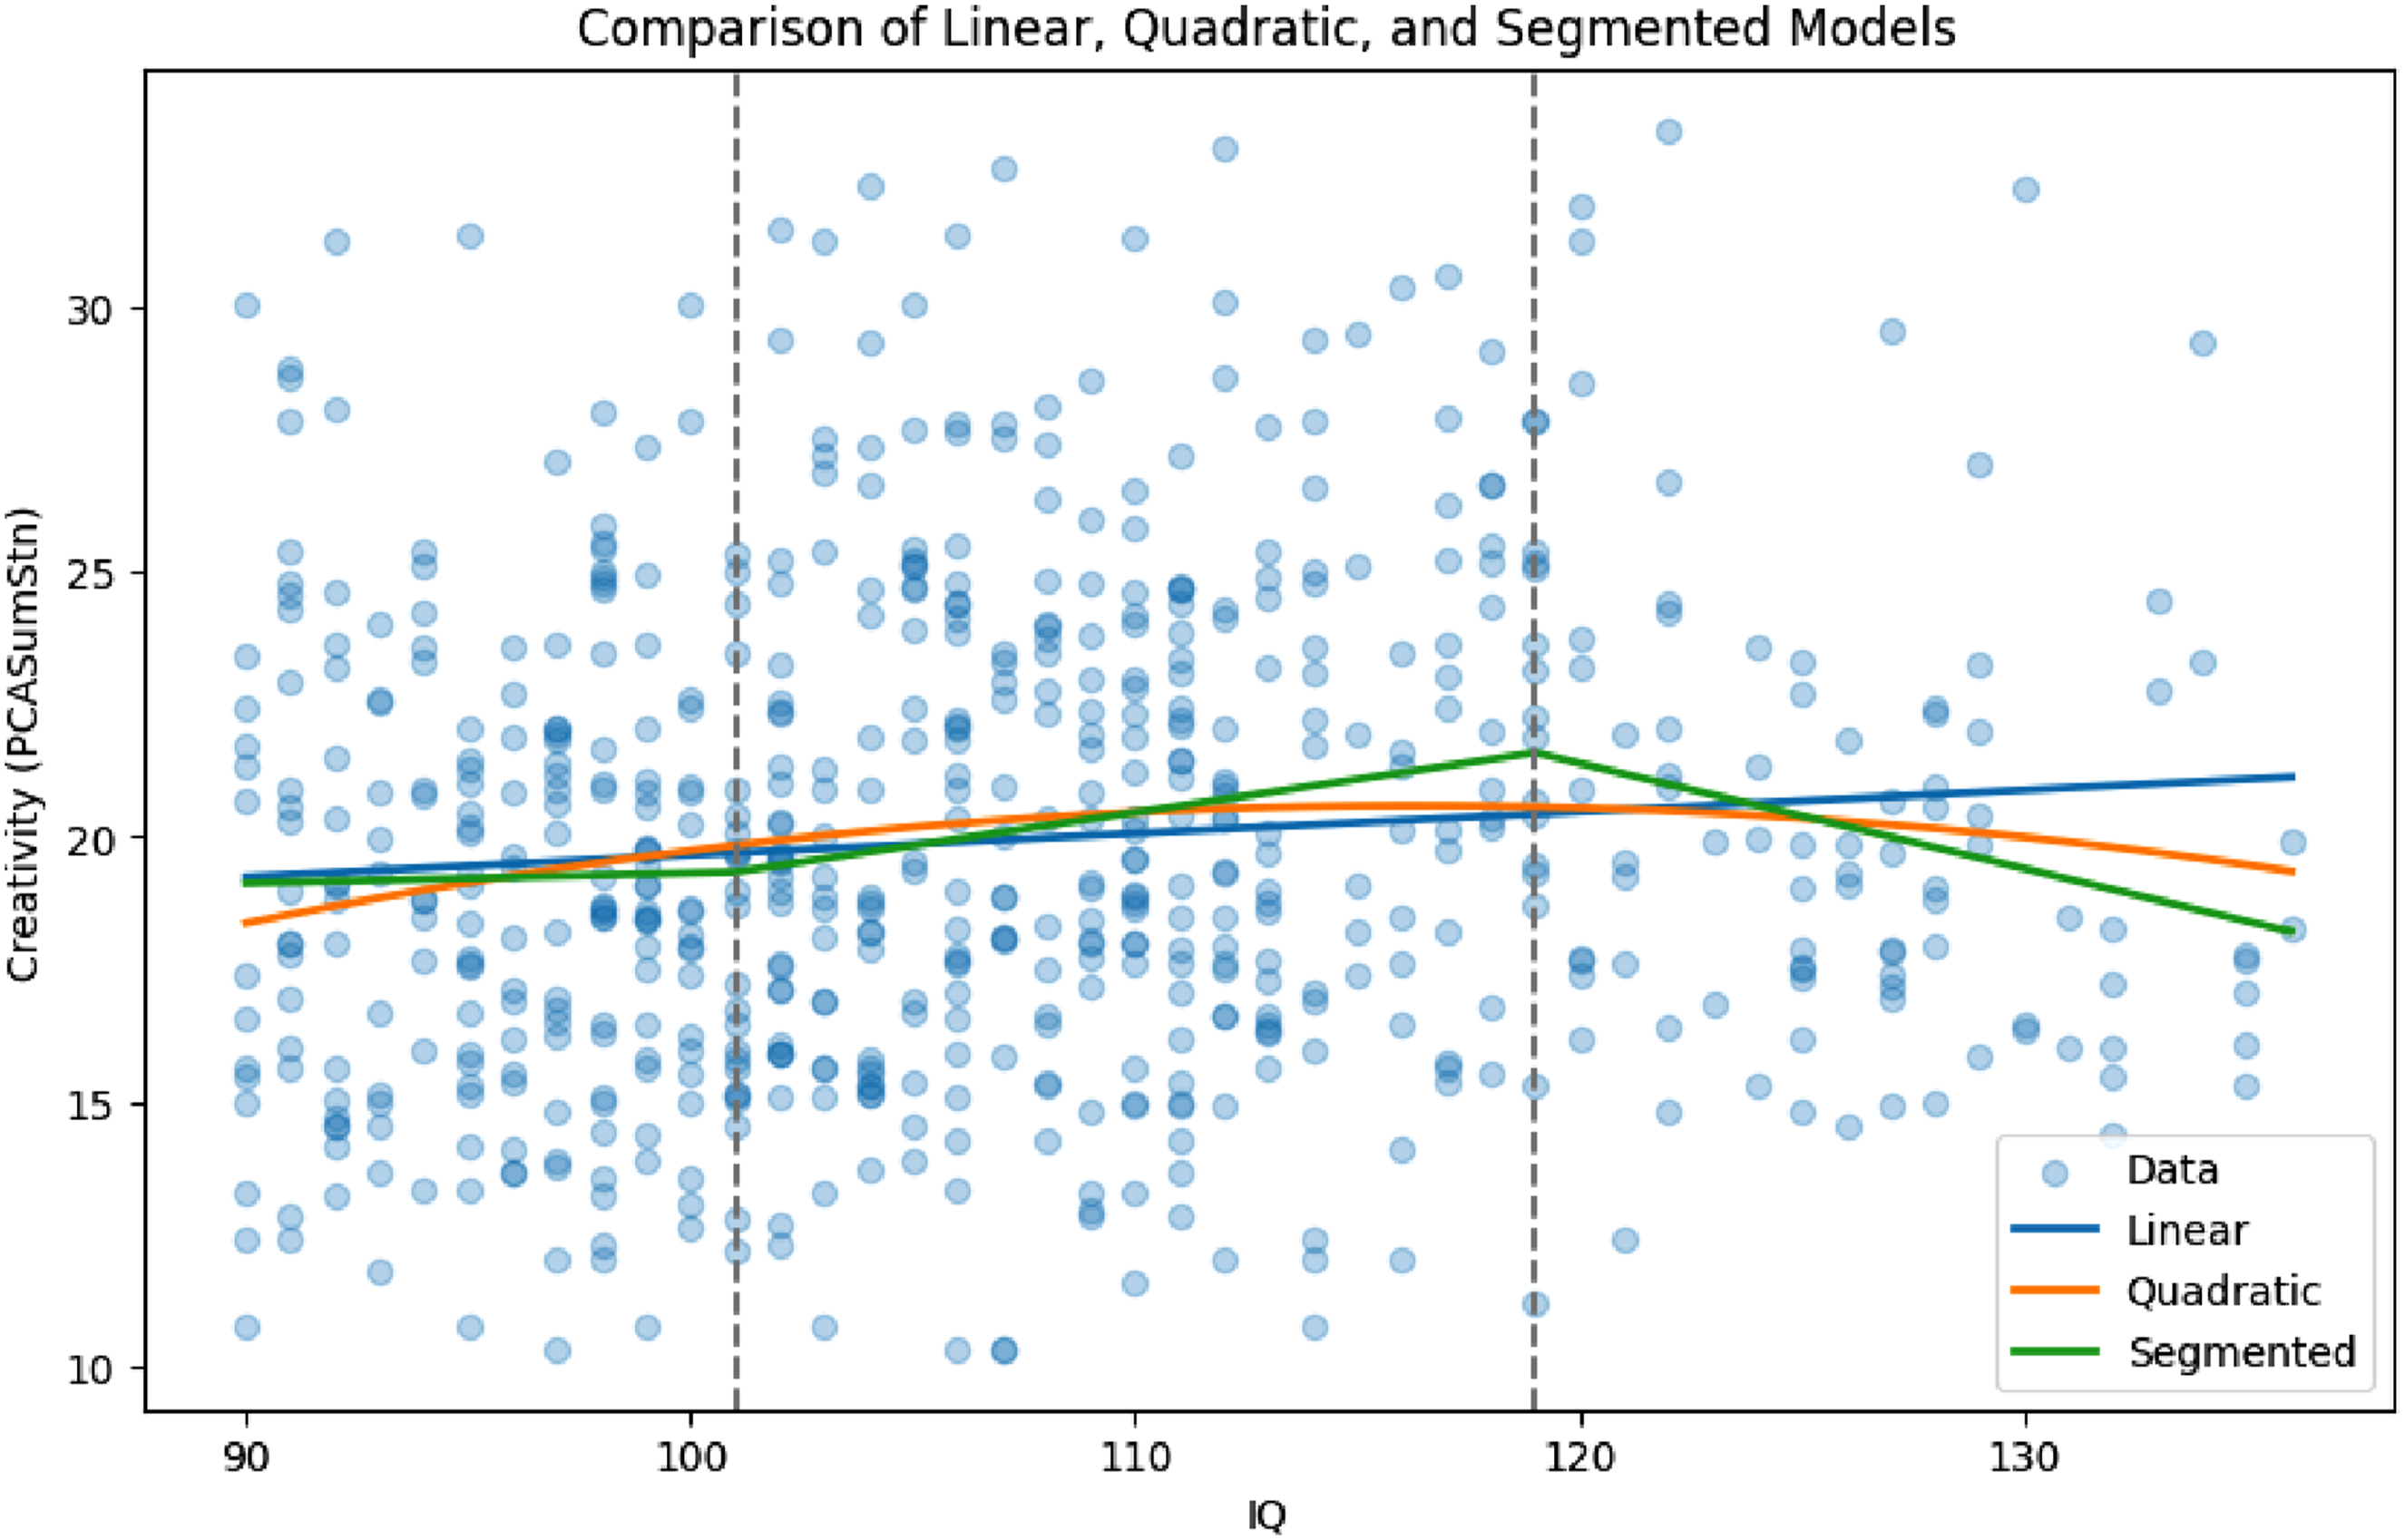
The segmented regression analytical approach was used in other studies (see Jauk et al., 2013; Mourgues et al., 2016) to examine the association between creativity and intelligence. This approach allows examination of potential changes in the relationship across levels of IQ depending on the data and develop assumptions about necessary/unnecessary points. For example, Jauk et al. (2013) found different thresholds between creative achievement and intelligence. Silvia (2008) found a threshold that is one standard deviation below the mean (IQ = 86) and for originality (IQ = 120). Likewise, Mourgues et al. (2016) found a threshold for flexibility at IQ = 106 and no thresholds for other creativity indices were found.
In our study, two breakpoints were examined, (IQ = 101) and (IQ = 119). However, the change in slope at the first breakpoint was not statistically significant, while the second breakpoint showed a significant negative change in slope. In addition, the overall explained variance of the segmented model was low (R2 = .028), the relatively low explained variance suggests that intelligence alone is not a strong predictor of creativity, and that other cognitive and contextual factors may play a more substantial role. Accordingly, more work is needed to explore more creativity indices such as originality, fluency, and flexibility using the segmented regression analysis.
Our results support what Weiss et al. (2020) confirmed “there is no convincing evidence either theoretically or analytically, for the existence of a threshold in the relation between creativity and intelligence” (p. 17). The low correlations between the CTONI and PCA scores (r = −.04 to .11 across segments) further support the idea that intellectual processes involved in creativity are somewhat distinct from those assessed through classical IQ tests (Kim, 2006; Wallach & Kogan, 1965). More recent evidence also suggests that the relationship between intelligence and divergent thinking is positive but modest (around r = .25) and highly dependent on measurement and analytical approach (Gerwig et al., 2021). Jauk et al. (2013) concluded that divergences in thresholds reported through varied assessment tools of creative potential could contribute to the extrapolation of discrepancies in research results that used ideational fluency as the sole indicator of creative potential. These breakpoint results should be interpreted with caution, as segmented regression outcomes may depend on model specification and data characteristics. This supports the view that creativity is not a unitary construct, but may differ across domains depending on the cognitive demands of the task.
Although gender differences were explored, age or grade level may represent a more relevant factor in understanding the relationship between intelligence and creativity, as cognitive abilities tend to differentiate with development. The interaction model showed slightly higher explanatory power, suggesting that demographic factors such as gender and grade may play a role in shaping the relationship, although the overall effect remains modest.
The study results were obtained from a school-based sample from the Middle East. Therefore, the cultural differences between the East and the West must also be contemplated in the evaluation of creativity. Eastern versus Western conceptions of creativity have already been scrutinized in the extant research on cultural differences (see Tang et al., 2016, for the discussion on implicit versus explicit conceptions of creativity). Eastern cultures tend to view creativity as a means of building on previous work and not as a quest for uniqueness, while creativity is often embedded within contextual and social constraints rather than purely individual expression (Corazza & Lubart, 2021). Eastern cultures also incorporate morality into the creative process, while Western cultures view creativity from the perspective of exclusivity, personal fulfillment, and enlightenment (Helfand et al., 2016).
Mohamed et al. (2017) reported that teachers in Oman rated students differentially depending on their gender, deeming female students superior in intellectual ability, academic achievement, artistic talent, and motivation. These findings were described by the researchers as reflecting the Eastern cultural perspective that expects females to outperform male peers in both academic and creative thinking tasks. Other studies have also asserted similar outcomes (e.g., Pfeiffer & Jarosewich, 2003). Such investigations have recommended that creativity research should consider cross-cultural aspects, which could represent crucial factors to explain the differences in research results obtained across different cultures.
Additionally, many researchers have underscored the importance of educational instruction in creative thinking as a means of increasing the academic achievements of students with high, average, or low IQ scores (e.g., Anwar et al., 2012; Hemdan & Kazem, 2019; Jiboye et al., 2019). For instance, Miroshnik and Shcherbakova (2019) contended that a better understanding of the functioning of several intellectual abilities in creative thinking could evoke the institution of better practices toward the enhancement of creative cognition in educational settings. The outcomes of Kim’s (2005) investigation extended the practical implications for secondary and post-secondary education by reporting that in comparison to younger students, older learners respond more positively if they are educationally influenced to use their cognitive abilities.
Studies stimulated by more recent cognitive approaches have also evaluated the contribution of more specific components of intelligence (instead of the global IQ–g factor) to cognitive creative potential. These components include divergent thinking (DT), fluid reasoning (Gf), and executive control processes that support idea generation and evaluation (Frith et al., 2021).
Limitation
Some inadequacies of this study must be acknowledged. It was concluded that contradictory results attained by studies related to TT occurred because of the diverse creativity and intelligence instruments used to address the topic and because of the narrow samples used for such studies (Runco & Albert, 1986). The present investigation recruited students at different grade levels, and its results must be replicated with average or even low academic achievers in the same culture. However, most of the study results corroborate the findings of other studies conducted with typical students using different measures of creativity, which generally report small and inconsistent relationships between intelligence and divergent thinking (Gerwig et al., 2021).
This study also admits the use of a nonverbal intelligence test that assessed nonverbal reasoning abilities (measured by CTONI-2) and a divergent thinking test (measured by PCA), which may have an influence on interpreting the results of the threshold hypothesis. The PCA has not been widely used in literature. Most of the cited investigations have used more common measures of creative potential. PCA subscales are scored differently from such frequently used measures, and divergent thinking scores may also be influenced by methodological factors such as fluency, which can inflate or obscure relationships with intelligence (Forthmann et al., 2018). Hence, the study findings must be inferred with caution. In addition, the PCA is less commonly used compared to other creativity measures, which may limit direct comparability with previous studies.
Another limitation is related to the overall explanatory power of the models. Across the analyses, the variance explained by intelligence was relatively low (R2 = .009 in the linear model, R2 = .019 in the quadratic model, and R2 = .028 in the segmented model), indicating that intelligence accounts for only a small proportion of the variability in creativity. This suggests that other cognitive, contextual, or motivational factors not included in the present models may play a more substantial role. In addition, the identification of breakpoints in segmented regression is dependent on model specification and data characteristics, and therefore should be interpreted as exploratory rather than definitive evidence of structural thresholds.
On the other hand timing of the categories subtest was another limitation, namely 3 minutes. In a meta-analysis study, Paek et al. (2021) concluded that the performance of divergent thinking increases with more time and the growth slows down at some point. Future research, using this instrument, might consider increasing the subtest timing to allow for more outcomes. Future research should examine how this relationship varies across developmental stages, as intelligence and creativity may be more closely related in younger children and become more distinct with age.
Footnotes
Acknowledgments
The authors would like to thank the Research Council in Oman (TRC) for funding this research.
Ethical Considerations
This study received ethical approval from the MoE Technical Office for Studies and Development (TOSD).
Funding
The authors disclosed receipt of the following financial support for the research, authorship, and/or publication of this article: This research was supported in part by a grant from the Research Council in Oman (TRC) RC/PSYC/14/01.
Declaration of Conflicting Interests
The authors declared no potential conflicts of interest with respect to the research, authorship, and/or publication of this article.
Data Availability Statement
It is not possible to share the data as participants have signed off a consent to participate and share their personal data on condition that it is not disclosed or shared with a third party.