
Abstract
Polypropylene (PP) foamed products have the advantages of heat and chemical resistance, but it is difficult to foam without modified PP. Traditionally, researchers have used chemical modification to increase the melt strength to improve the foaming properties of PP. In this article, we designed four kinds of screw combinations, and five regions are selected for sampling. The polytetrafluoroethylene (PTFE) and isotactic polypropylene (iPP) were blended by one-step fiber forming method, and then we tested the rheological properties and foaming properties. It is found that the rheological properties of the in situ microfiber composite are significantly improved than the iPP, and the crystallization temperature is also increased. The foaming experiment of the composite showed that the foaming performance of the composite with in situ microfiber morphology was significantly improved compared with the pure iPP performance, and the foaming temperature window of iPP was widened from 3°C to more than 6°C.

Introduction
In recent years, polypropylene (PP) has become a popular foaming material because of its environmental friendliness, good mechanical properties at higher temperature, and so on. 1 -3 Especially, the crystallization and melting temperature are much higher than the glass transition temperature. 4 Burt 5 found that the extrusion foaming temperature-window of linear polypropylene (L-PP) is only 4°C. The strict requirements on process and equipment limit its application in industry. Therefore, based on the huge advantages of PP, the researchers are very interested in its modification. 6 -10
Polyblend has the advantages of simple operation, low cost, and remarkable effects in improving matrix performance. 11 Many studies have found that the composite properties will be better with the increase of dispersion degree or relative specific surface area of the dispersed phase. 12 -15 Kiss 16 put forward the concept of in situ microfiber composite material that the dispersed phase is deformed into a fibrous shape under the action of tensile stress, and the material is rapidly cooled by air or water cooling to form a composite system with fibers. Many scholars have done a lot of research on the mechanism of microfibers, using melt extrusion, strong shear, rapid stretch, and other methods to prepare in situ microfiber or nanofiber. Through the study of many kinds of materials by many researchers, in situ microfiber not only change the crystallization and rheological behavior of the matrix but also have great potential in improving the overall mechanical properties. 17,18 The materials that can be added to the matrix as dispersed phases have some common characteristics. The molecular chains of these materials have good rigidity, can slip when sheared, and easy to deform into fibers. Si et al. 19 studied the compatibilization of PP/polyethylene terephthalate (PET) and polypropylene-grafted acrylic acid blends. PET can be used as heterogeneous nucleating agent to facilitate crystallization of PP. The compatibility of PP/PET blends was improved and their mechanical properties were improved. The deformation of dispersed phase is a complicated process, which usually changes from massive to small spherical under the action of shear or tensile flow field, and then gradually transforms into fibrous. The deformation process of the fiber is related to several technical parameters, such as shear tensile strength, dispersed phase content, temperature, and so on. 20 Jurczuk et al. 21 investigated the effects of continuous extrusion and autoclave foaming on the L-PP and long-chain branching (LCB-PP) foaming behavior of polytetrafluoroethylene (PTFE) nanofibers during shearing. The result shows that PTFE nanofibers significantly improve the thermal properties of them. PTFE nanofibers formed entanglement network and induced strain hardening of PP/PTFE nanocomposites. In addition, bead foaming in autoclave indicates that PTFE nanofibers form in nucleating cells. Shearing and stretching are the basic dynamics of deformation, and the magnitude of dynamics affects the deformation degree and rate. The added amount of the molecule determines the chance of the molecule meeting in the system, which affects the probability of collision and extrusion. Therefore, it is necessary to control the parameters and obtain the fiber morphology. The law of the parameters will be the focus of the study. Rizvi et al. 22,23 used PP and PTFE blend melt to form a tangled physical network and produced gel. CO2 foaming experiments were carried out and the results showed that after adding 0.3% PTFE, the cell density increased significantly, and the volume expansion rate increased 10 times. The effects of rheological and strain hardening behavior on foaming of CO2 were also studied. Zhao et al. 24 prepared in situ fibrotic PP and PTFE blends by twin-screw extruder. The shear rheology and tensile rheology were tested, and the crystallization temperature was characterized by differential scanning calorimetry (DSC). The results show that PTFE fiber can significantly change the crystalline properties, viscoelasticity, and strain hardening properties. With CO2 as a blowing agent, the expansion rate of the foam increased by three times. Guilong et al. 25 prepared PP/PTFE nanofiber composite materials by twin-screw. They analyzed the effect of network structure on the strength and crystallization of the melt, and the nanoporous foam was obtained. Compared with the non-foam PP, the mechanical properties of the composites increased significantly.
The cell uniformity of foamed materials is a key factor for the products properties. PP has some disadvantages, such as low melt strength and poor viscoelasticity that caused uneven foam and low foaming ratio. To prepare excellent products, in addition to improving the rheological properties of the matrix materials by polyblend, the foaming effect was further improved by adding nucleating agents. Moreover, the operation is simple and the application is convenient.
In this article, the rules of in situ fibrillation under different shear stress and content were studied with isotactic polypropylene (iPP) as matrix and PTFE as dispersed phase. The rheological properties of the blends were tested and the foaming properties were tested by batch foaming.
Experimental
Materials
The material used in this study was PTFE (CGF219), which was purchased from Zhonghao Chenguang Chemical Research Institute Co., Ltd (China). The main technical indexes are shown in Table 1. The iPP (T03-H) was used as the matrix material which was obtained from Sinopec Yangzi Petrochemical Company Limited (China). The iPP melt mass flow rate is 36 g 10 min−1 (230°C, 2.16 kg), and the melting point is about 162°C. The physical blowing agent CO2 (purity 99%) was provided by Beijing Ju Ming Cheng gas equipment technology development Co., Ltd (China). Blowing agent injection pump was supplied by Dalian Riva Pump Co., Ltd (China). The single-screw extruder (SJ-45) was provided by Nanjing Rubber and Plastic Machinery Plant Co., Ltd (China). The weight was measured by using an electronic balance (JA5003) with an accuracy of 60.001 g, which was provided by Shanghai Hengping Scientific Instrument Co., Ltd (China). FE-SEM (S-4700, Hitachi, Japan) was used to observe the samples.
The main physical properties of PTFE.
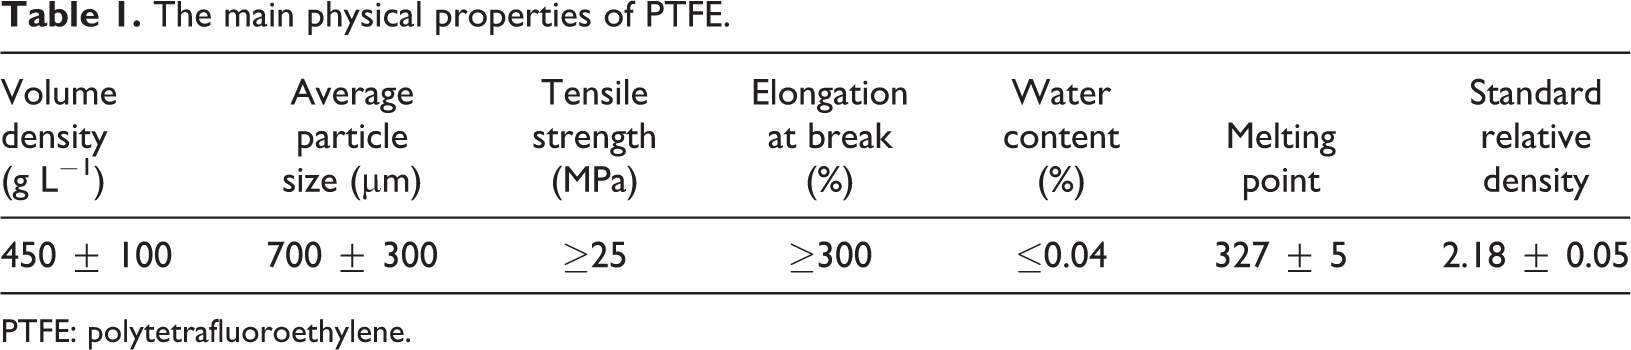
PTFE: polytetrafluoroethylene.
Processing
The amount of dispersed phase is an important factor to the morphology of the fiber. It is difficult to form fibers when dispersed phase is added too much, and it is also difficult to form continuous fibers when dispersed phase is added too little. For this, we designed the following five sets of experiments for comparative analysis, as shown in Table 2.
Content of PTFE in different screw combinations.
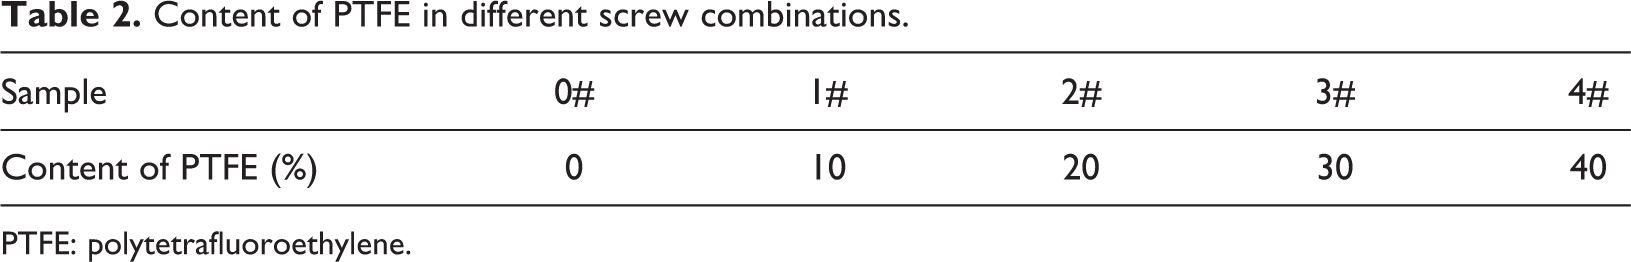
PTFE: polytetrafluoroethylene.
We designed an inverted triangular three-screw in this experiment. This equipment has a good effect on extrusion processing to form fibers. 26 The three-screw extruder used in the experiment also adopts building block structure. We can reasonably select and design screw combinations in each section according to the purpose of material processing and material characteristics. Screw elements include conveying, shearing, and mixing elements. Thread are the main transport elements, kneading block is an important shearing element to produce strong shearing effect, while tooth element promotes the efficient flow and mixing of materials. By changing the screw combination, the shear–tensile strength in the extruder can be adjusted to a large extent, thus affecting the phase morphology and comprehensive properties of the blends. For the three-screw direct extrusion method used in this article, screw assembly has a great influence on the shear–tensile force along the blend and on the fining, deformation, and coalescence of polymer particles. We selected five sampling areas in each screw combination to study the different shear effects on fiber morphology. The four screws of A, B, C, and D assemblies have 1 60°/5/36 and 60°/5/36 L meshing blocks before the zone 2, the three screws of A, B, and C have 1 60°/5/36 meshing blocks before the zone 1, the two screws of B and C have 1 60°/5/36 meshing blocks before the zone 3, and the three screws of B, C, and D have 1 60°/5/36 and 60°/5/36 L meshing blocks before the zone 4. The five groups of samples were prepared by changing the screw assembly, as shown in Figure 1.
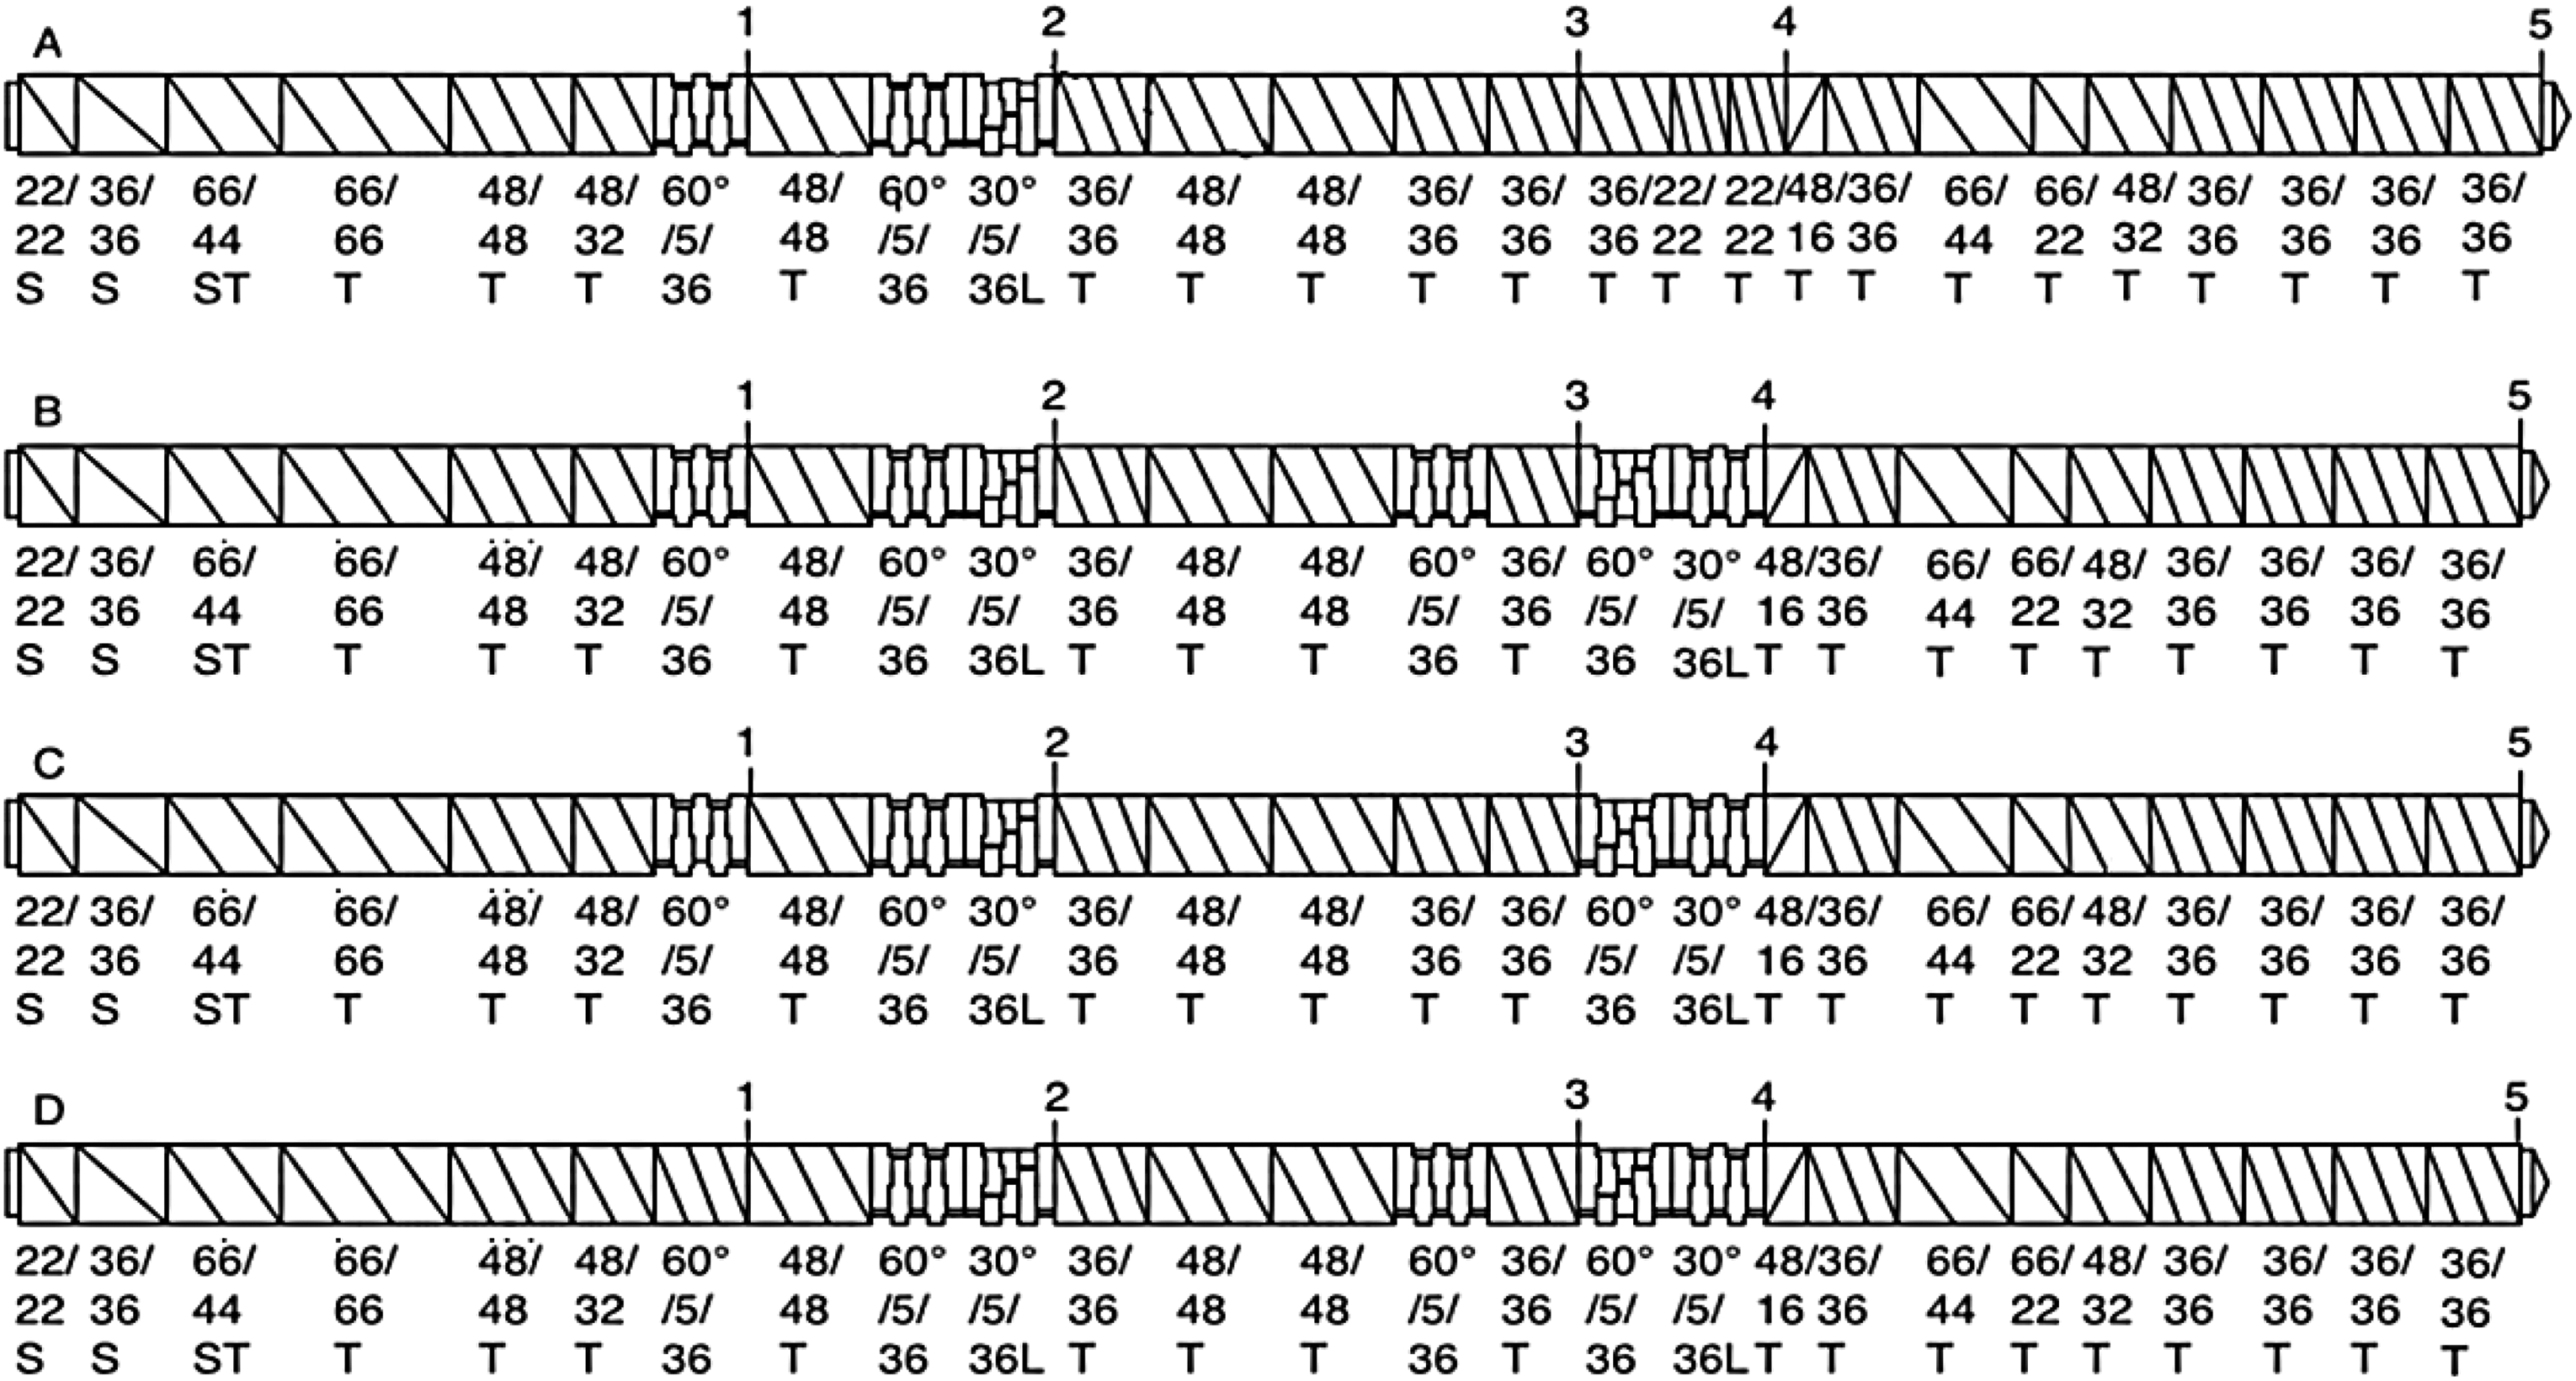
The different screw assembly.
The samples from screw A were added to a distilling apparatus with xylene, and the temperature was controlled at 150°C. The distilling apparatus heated continuously for 12 h. The purpose of this course is to remove the matrix phase iPP and obtain the dispersed phase PTFE. Then the morphology of the fibers was observed under scanning electron microscope (SEM). The average diameter and length of fibers were counted by ImageJ software. To ensure the accuracy of the results, we counted 200 fibers in this experiment.
The prepared samples were treated with a Haake internal mixer (PolyLab OS, Thermo Fisher Scientific, Waltham, Massachusetts, USA), and the content of dispersed phase was diluted to 5%. Then the rheological properties were measured. The temperature, speed, and mixing time of the Haake internal mixer were 180°, 40 r min−1, and 4 min, respectively.
In the three-screw extrusion experiment, we set the following experimental conditions. Among them, the addition of PTFE in iPP is 10 wt%, the feed of extruder is 6 kg h−1, the speed of screw is 150 r min−1, and the temperature of five screw feeding sections was 210°C. Then the screw assemblies were replaced, and different A, B, C, and D groups of screw assemblies were used to carry out experiments, and different 20 samples were obtained.
We used a self-designed single-screw extruder to foam. The experimental device is shown in Figure 2. The diameter of the screw is 45 mm, the ratio of length to diameter is 32, and the speed is 200 r min−1. The sections of T1, T2, and T3 were heated by electricity, and the section of T4 was controlled by a model temperature machine. The gas injection system used high precision plunger pump (260D, Teledyne Isco, Lincoln, Nebraska, USA). CO2 injection volume is 3%. The slice die size is 1 × 20 mm2. The temperature of static mixer was controlled by mold temperature machine, the temperature was recorded as T sm, and the temperature was recorded as T d. The die pressure was 2 MPa, and the temperature of each section of the extruder was controlled as 200°C, 200°C, 200°C, 165°C, and 163°C, respectively.
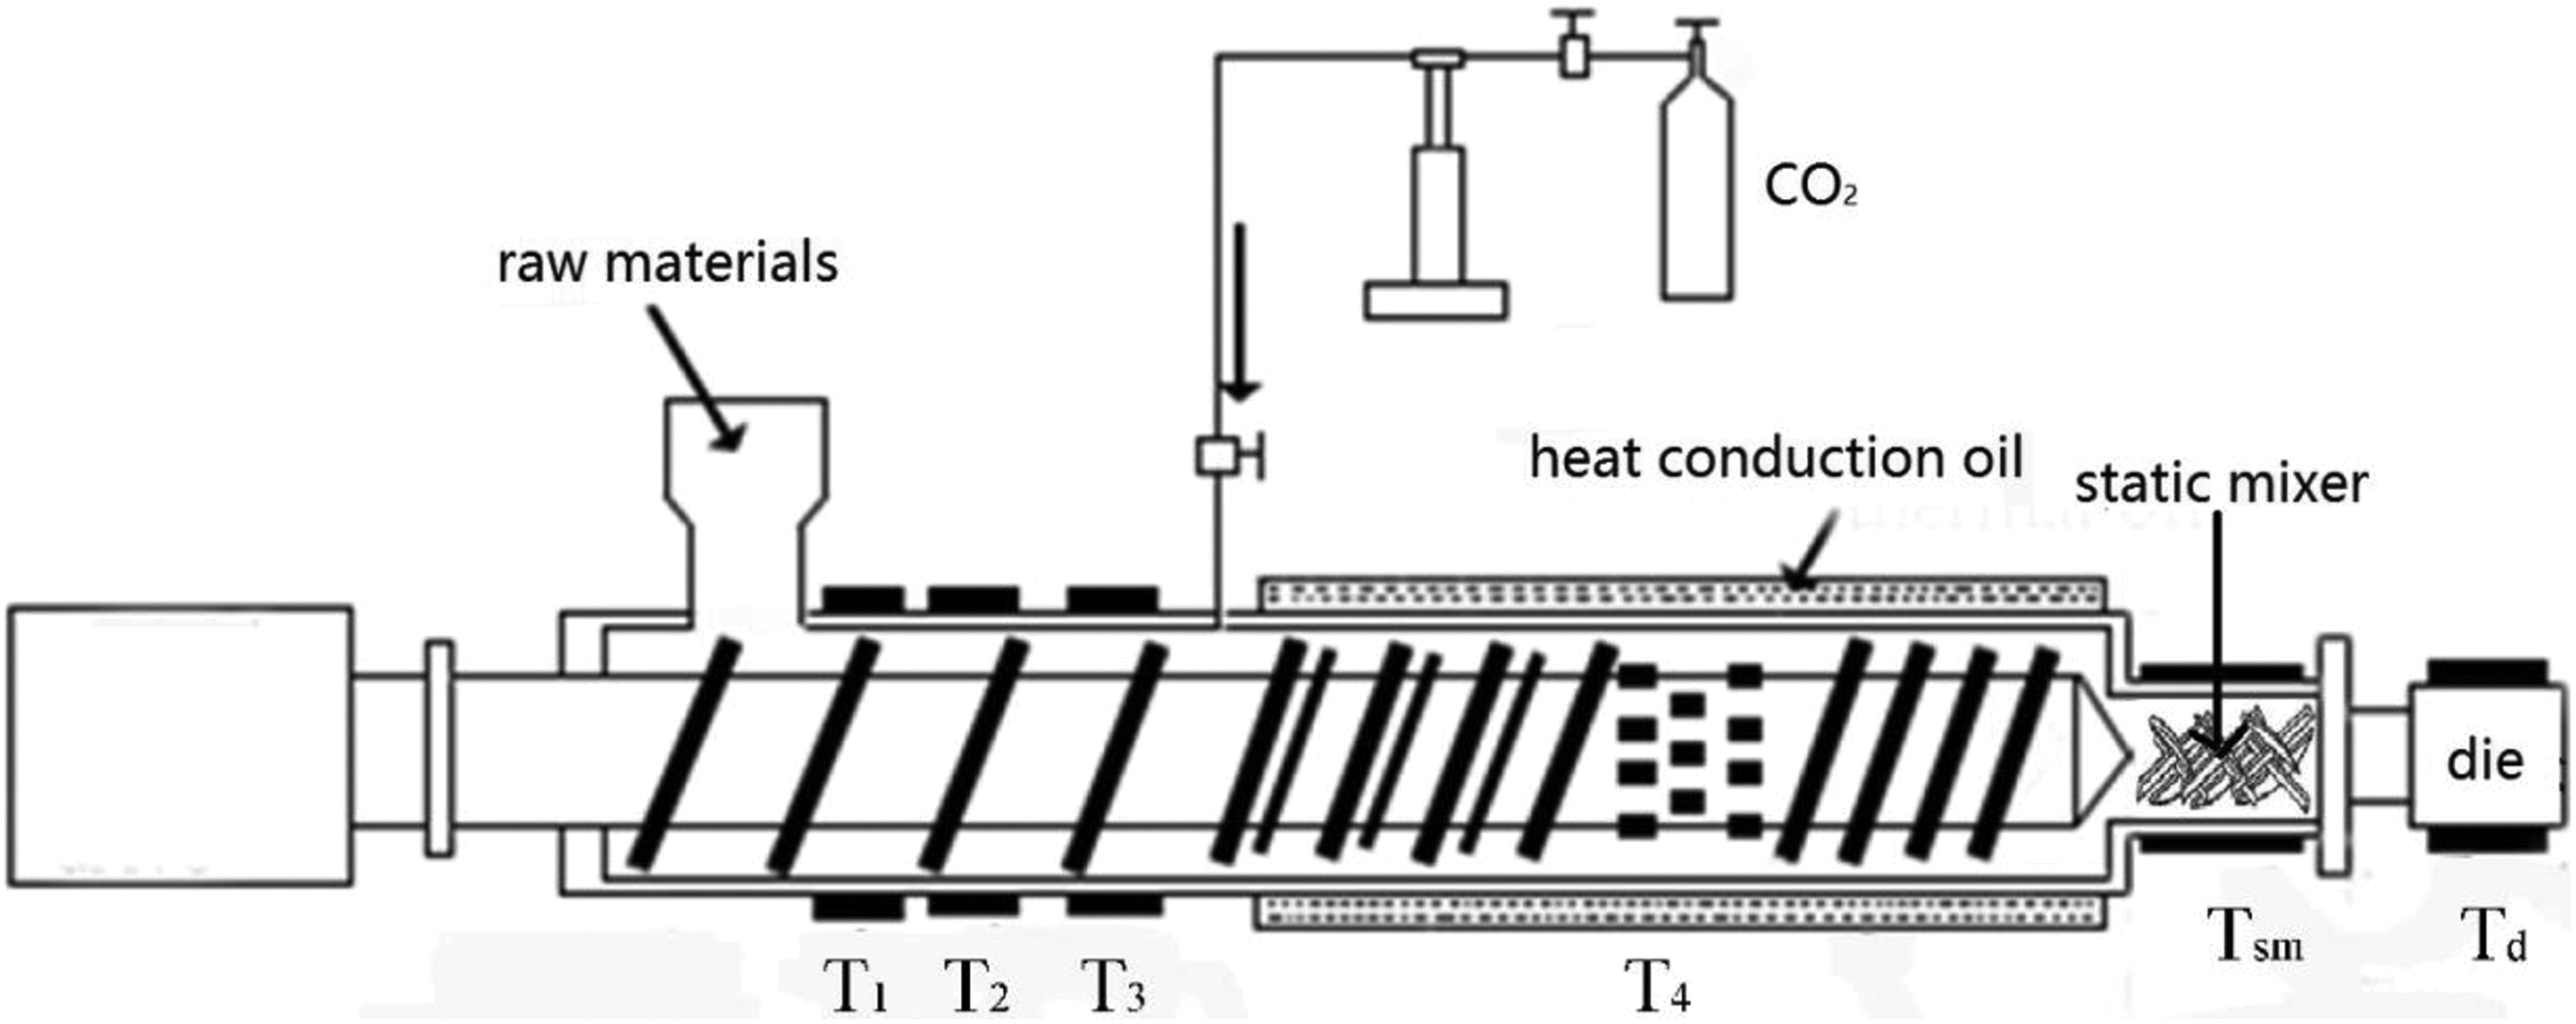
Single-screw extruder for foaming.
The foaming ratio of foamed samples was estimated by the following formula

Among them, the densities of non-foamed and foamed samples were
Among them, the

Among them, the A is the actual area (cm2) of the statistical area in the SEM images.
Results and discussion
Effect of PTFE addition on microfiber morphology
We used SEM to observe the fiber morphology of PTFE/iPP composites, as shown in Figure 3. With the content of the PTFE increased, the fiber diameter decreases first and then increases. The dispersed phase content of 1# sample is 10 wt%, which fiber is relatively small and the fiber diameter is uneven compared to others. The reason is that the blend was sheared, and PTFE was extruded to form fibrous. Because the dispersed phase content was low, the molecule of the dispersed phase has a low probability of encountering each other. Some of the fibers were cohered to form larger diameter fibers, and the diameter decreases gradually under tensile stress. To form in situ fiber morphology in polymer, the dispersed phase needs to be deformed in matrix phase and oriented along shear–tensile direction. The thermodynamic incompatibility of the two polymers and the dragging ability of the matrix relative to the dispersed phase are required. At the same time, the chemical properties of the two components also affect the interfacial tension and compatibility of the two phases, thus affecting the final morphology of the dispersed phase, and further affecting the fibrillation effect. In the process of fiber formation, the collision and coagulation between droplets and ellipsoids, droplets and fibers lead to the formation of microfibers with larger length. The content ratio of dispersed phase to matrix phase is too large or too small, which is not conducive to fiber formation. When the component ratio is too small and the concentration of dispersed phase is too low, the particle coagulation is difficult, and the effect of fiber formation is weak or difficult. 27
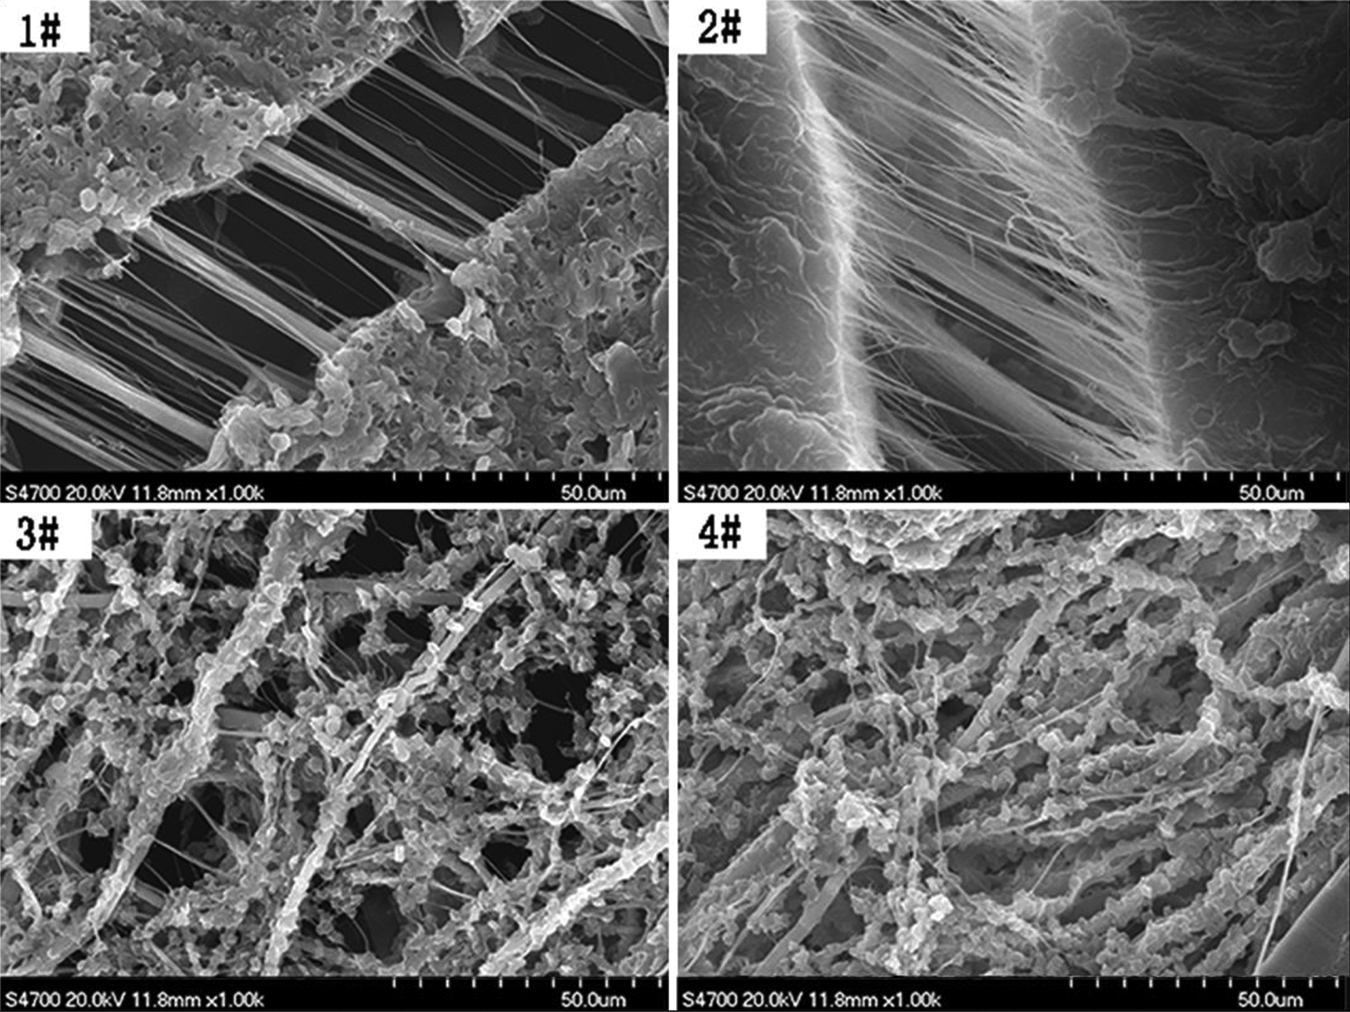
The SEM images of fibers at different PTFE contents.
The dispersed phase content of 2# is 20 wt%. From the morphology of 2#, we found the fibers were small and uniform in diameter. Under this condition, the fibers can be well dispersed and the collision and extrusion probability is suitable. The effect of fiber formation is better. The SEM images of 3# and 4# with 30 wt% and 40 wt%, respectively. They showed that the content of fibers has a great increase compared with the 1# and 2#, but the diameter of the fibers is unsatisfactory. With the increase of dispersed phase, it is difficult for the fibers to deform into small fibers during shearing and stretching. The coarse fibers will be adhered to a continuous piece or bulk. Therefore, the amount of added material should be controlled. For quantitative analysis of the fibers, the phase morphology was observed by SEM, and the fiber diameter in the image was counted by ImageJ software. The diameter of 200 fibers under the same scale was counted and the average diameter was obtained. We found that the diameter decreases first and then increases. The results are the same as that observed in the SEM images. Figure 5 shows that the viscosity of PTFE is the highest when the content of PTFE is 20%, which may be helpful to the production of fibers. The content of fibers increased with the increase of dispersed phase content, that is, the increase of PTFE content contributed to the formation of in situ fibers, as shown in Table 3.
The fiber diameter under different PTFE content.
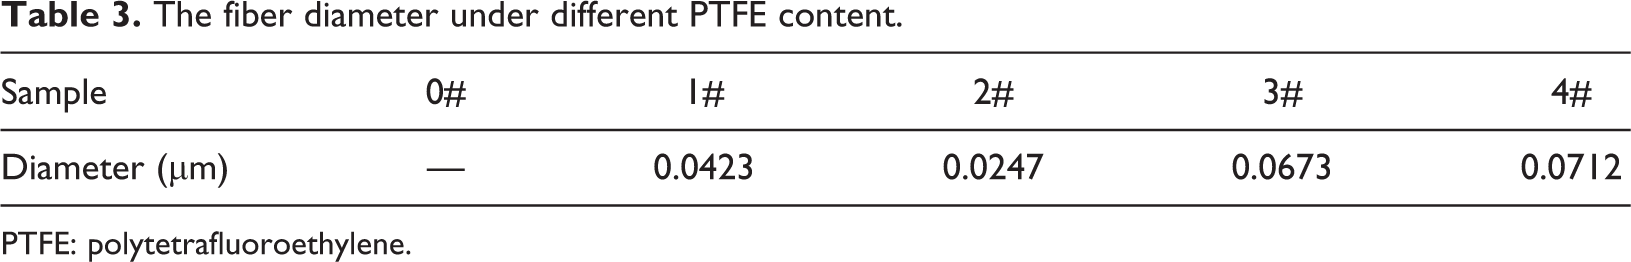
PTFE: polytetrafluoroethylene.
Effect of dispersed phase content on rheological properties
The rheological parameters of the samples can be used to predict the foaming properties of the materials. As shown in Figure 8, in order to compare the rheological properties of the blends with different PTFE contents, A2, B2, C2, and D2 in screw combinations of A, B, C, and D were selected, respectively, and the fiber diameters were shown in Table 4. The content of 0# PTFE is 0%. Shear rheological properties were investigated using a Haake Mars III rheometer (Thermo Fisher Scientific) with parallel plate geometry. Measurements were carried out at 210°C under nitrogen. All samples for testing have a diameter of 20 mm and a thickness of 1 mm, which were prepared by compression molding with the help of the parallel plate. Frequency sweeps from 100 to 0.1 rad s−1 were conducted and a stress amplitude of 10 Pa was applied to ensure the melt deformation in the linear viscoelastic region for all samples. The transient elongational viscosity was determined using a Sentmanat Extension Rheometer extensional viscosity fixture at 210°C. Rectangular test samples with dimensions 18 × 5 × 1 mm3 were obtained from the cylindrical samples prepared for shear rheology. The applied elongational rates were 0.01, 0.1, and 1 s−1. All tests were performed under a nitrogen atmosphere to avoid thermo-oxidative degradation. In this article, some extrusion rheological properties of the sample were tested, as shown in Figures 4 and 5. The storage modulus curves of the 1#, 2#, 3#, and 4# samples deviate from the standard mode in the low-frequency region and have an up-warp tendency, which means the relaxation time of the composites increases and the network entanglement structure has appeared. In Figure 4, the upward trend of 2# is more obvious than other samples that indicate the physical entanglement of fibers is more effective. As mentioned above, fine and uniform fibers can improve the properties of matrix materials by physical entanglement structure. We found that the 2# fibers have the smallest diameter, and the decrease of storage modulus in low-frequency region is a good rheological behavior for foaming. 28,29 Therefore, the foaming performance of 2# composite is better than that of other samples. Figure 5 shows the variation of viscosity under different PTFE content. The viscosity of 2# sample is the highest that shows the rheological properties of the microfiber composites with 20 wt% content are the best.
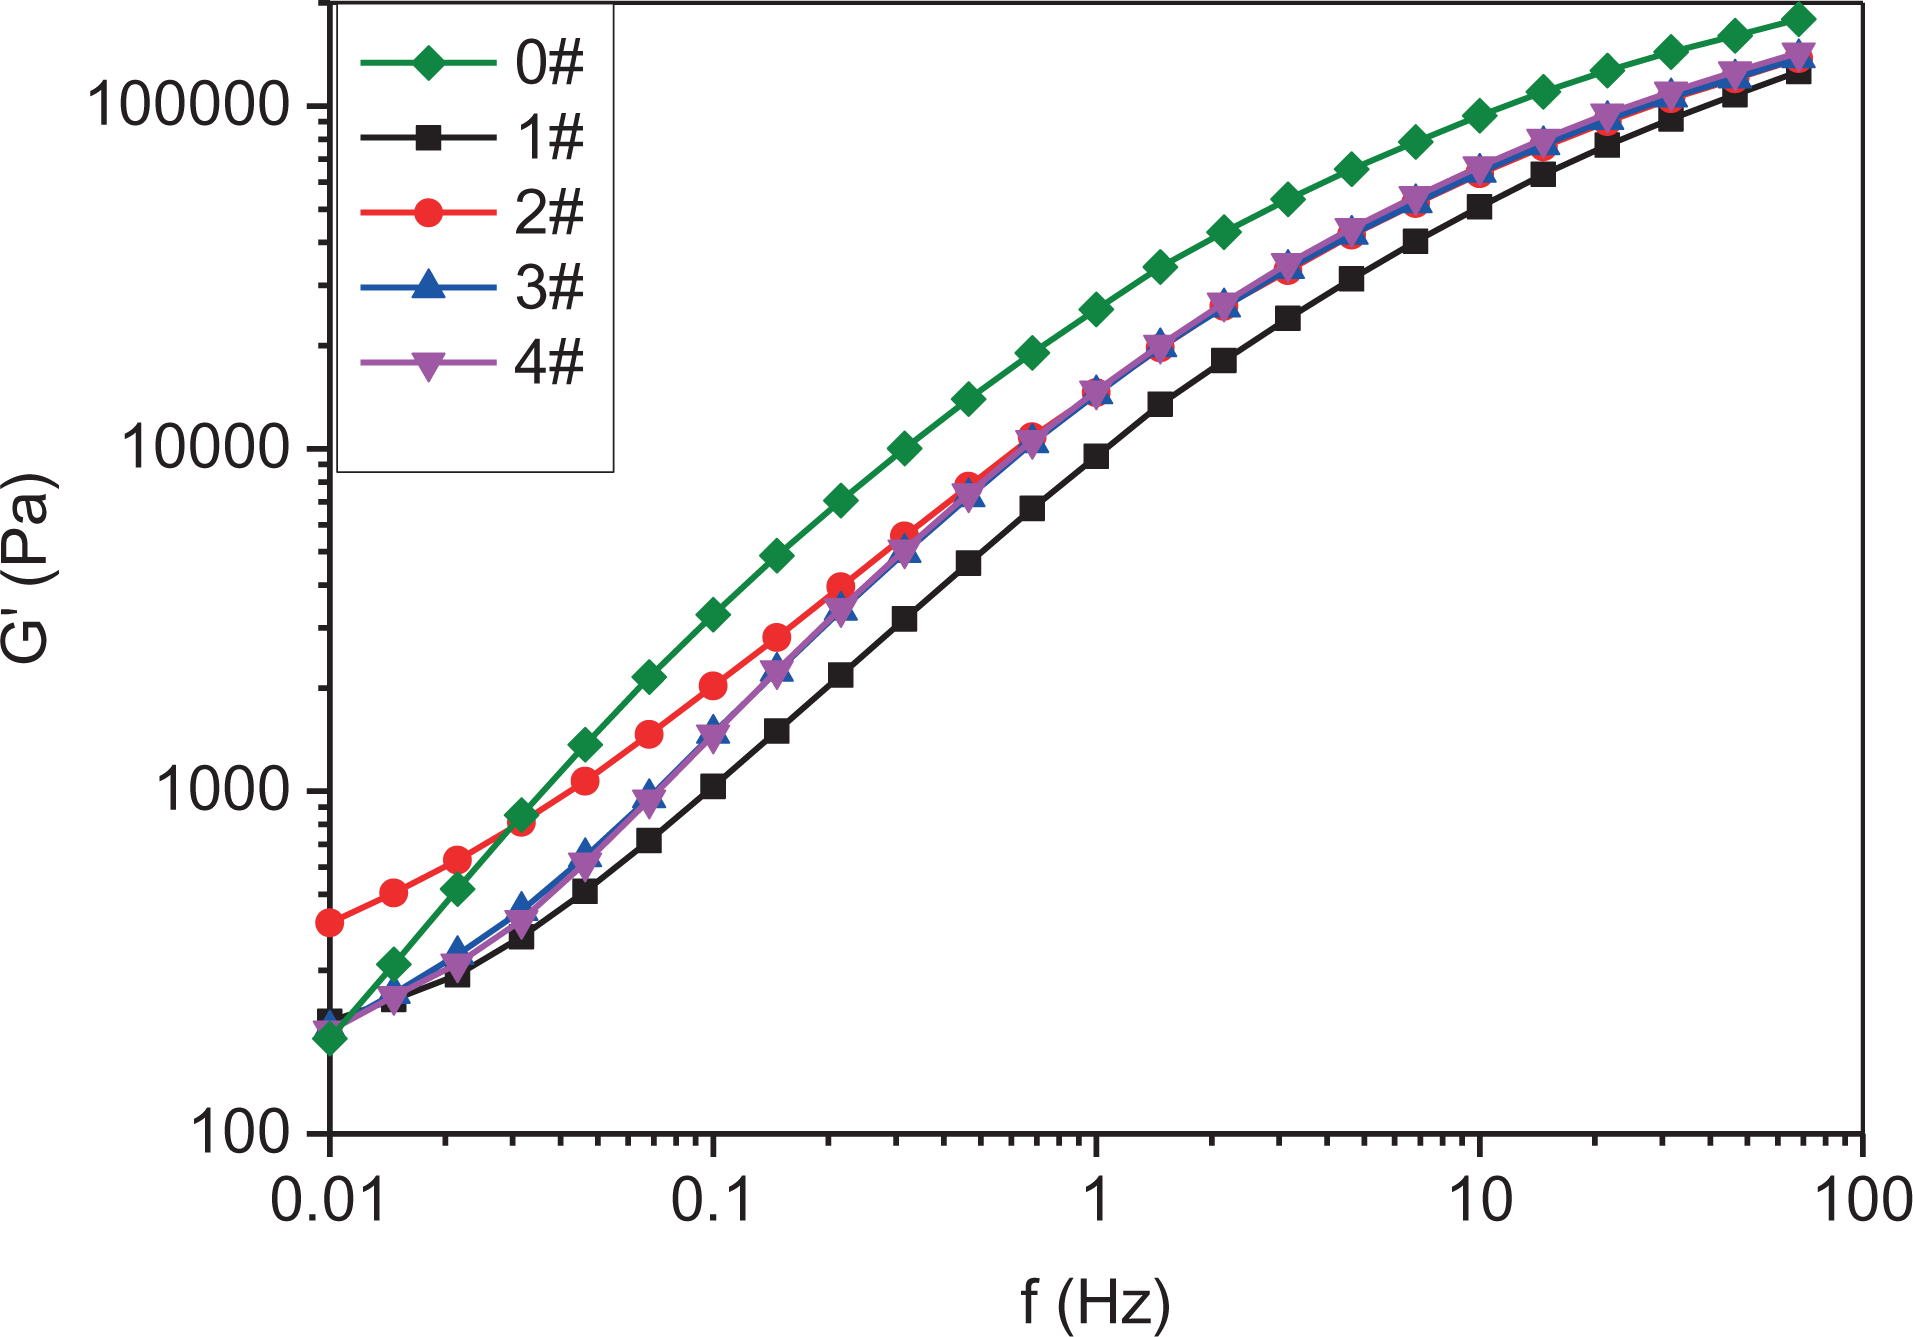
The storage modulus of different PTFE content.
The variation of viscosity under different PTFE content.
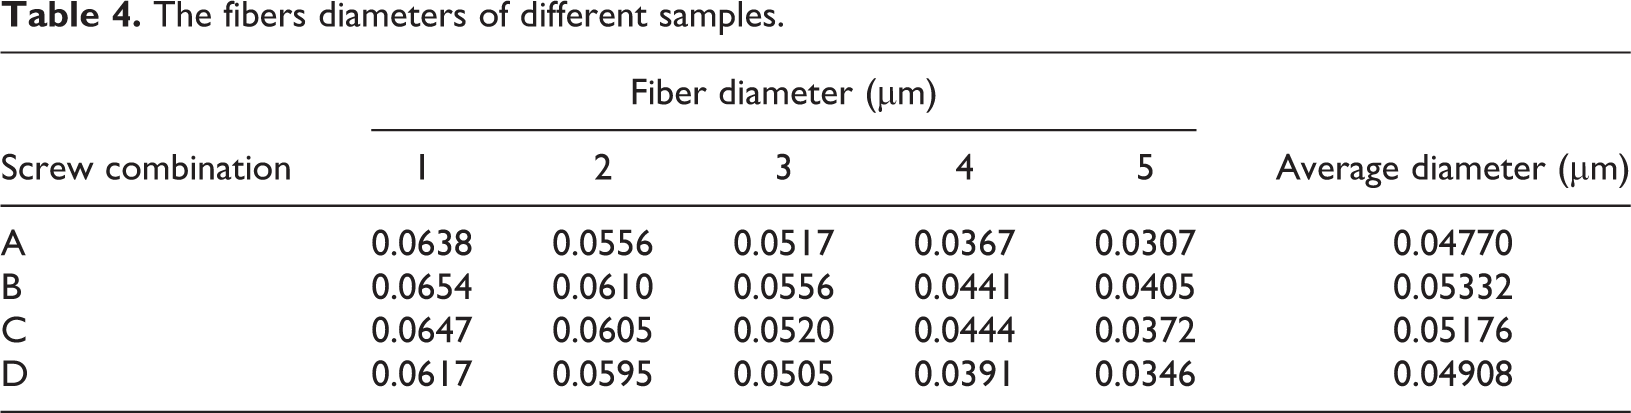
The fibers diameters of different samples.
Tensile rheological properties of the samples were tested, as shown in Figure 6. The tensile viscosity of 0#, 1#, 2#, 3#, and 4# samples at tensile strain rate of 0.05 s−1. ηE is the shear viscosity of the sample in the linear viscoelastic region and obtained from the dynamic shear test with strain rate of 0.001 s−1. Strain hardening was not observed in 0# samples. The tensile viscosity values of all samples increased. However, the effect of adding different amounts of PTFE on tensile viscosity is not obvious. As shown in Table 3, the fiber diameters of in situ microfiber composites are different, 4# > 3# > 1# > 2#. As shown in Figure 1, the shear stress of the sample is different in different regions of the screw. With the increase of shear force, the diameter of the formed fibers increases, but because the flow field tends to shear the formed fibers, the measured tensile viscosity does not increase significantly. In addition, with the increase of shear action in the extruder, the shear temperature rise will also increase, so the increase of shear viscosity will be affected to a certain extent. In the foaming process, the higher tensile strength of the bubbles is required. Otherwise, the biaxial tensile stress will cause the cell wall to break. Increasing the tensile viscosity of the composite is beneficial to foaming.
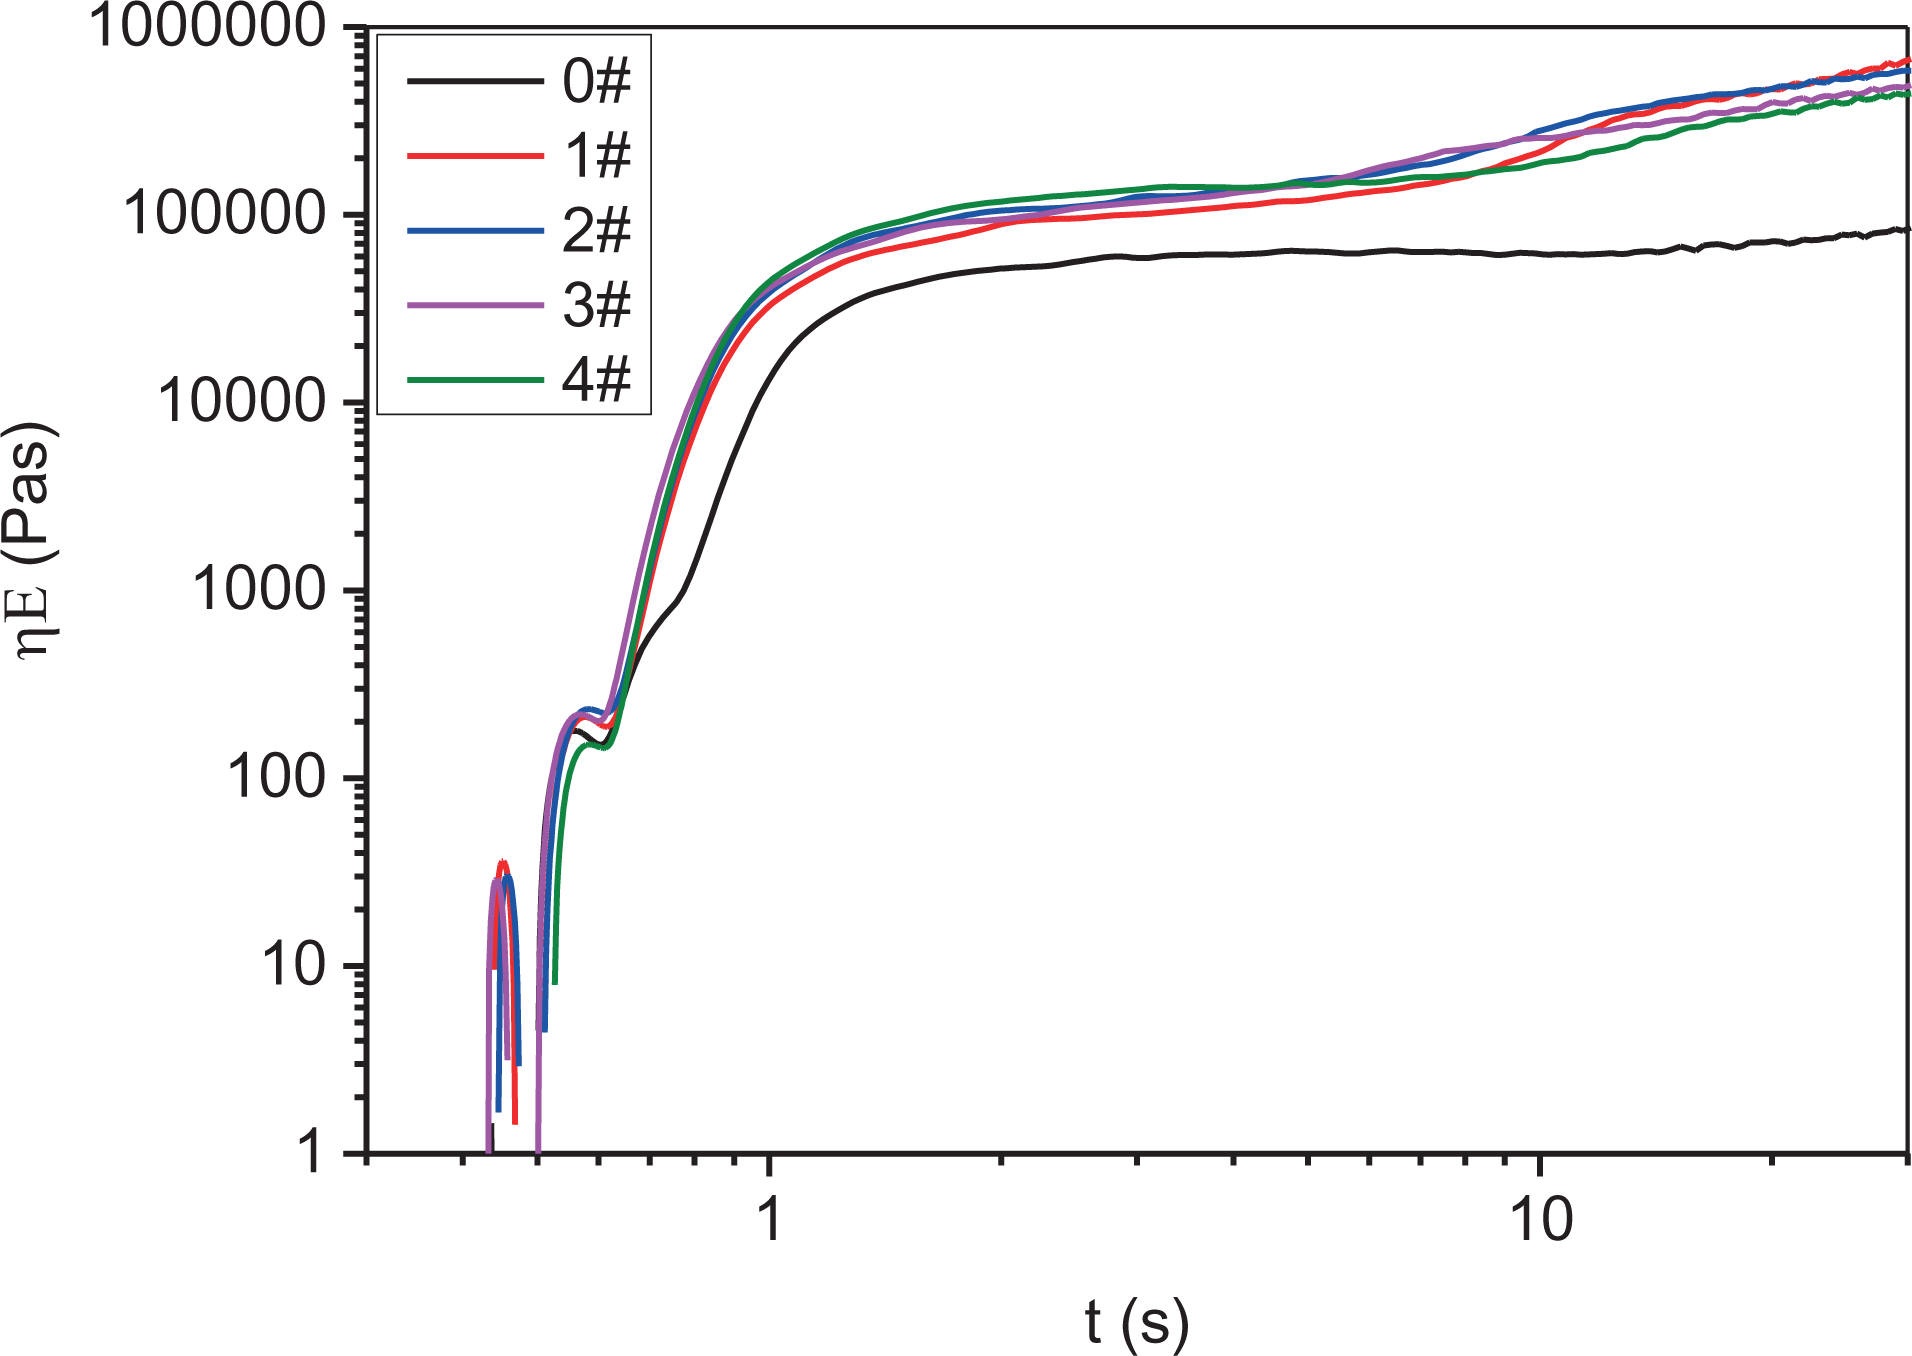
The tensile viscosity curves of different PTFE content.
The higher the crystallization temperature, the quicker the material reaches the initial crystallization temperature and the shorter the setting time. The DSC tests were carried out for the melting and crystallization of composite materials, as shown in Figure 7. It is necessary to rapid cooling, which makes the bubble solidification and maintains the maximum expansion ratio. In practice, there are many ways of cooling, such as air cooling and water cooling. These methods can help the products under rapid cooling. The faster the crystallization rate, the shorter the time it takes for the material to solidify, which can reduce the shrinkage. The higher the crystallization temperature, the quicker the material reaches the initial crystallization temperature. The melting and crystallizing point of the composite materials were characterized by DSC, as shown in Figure 7.
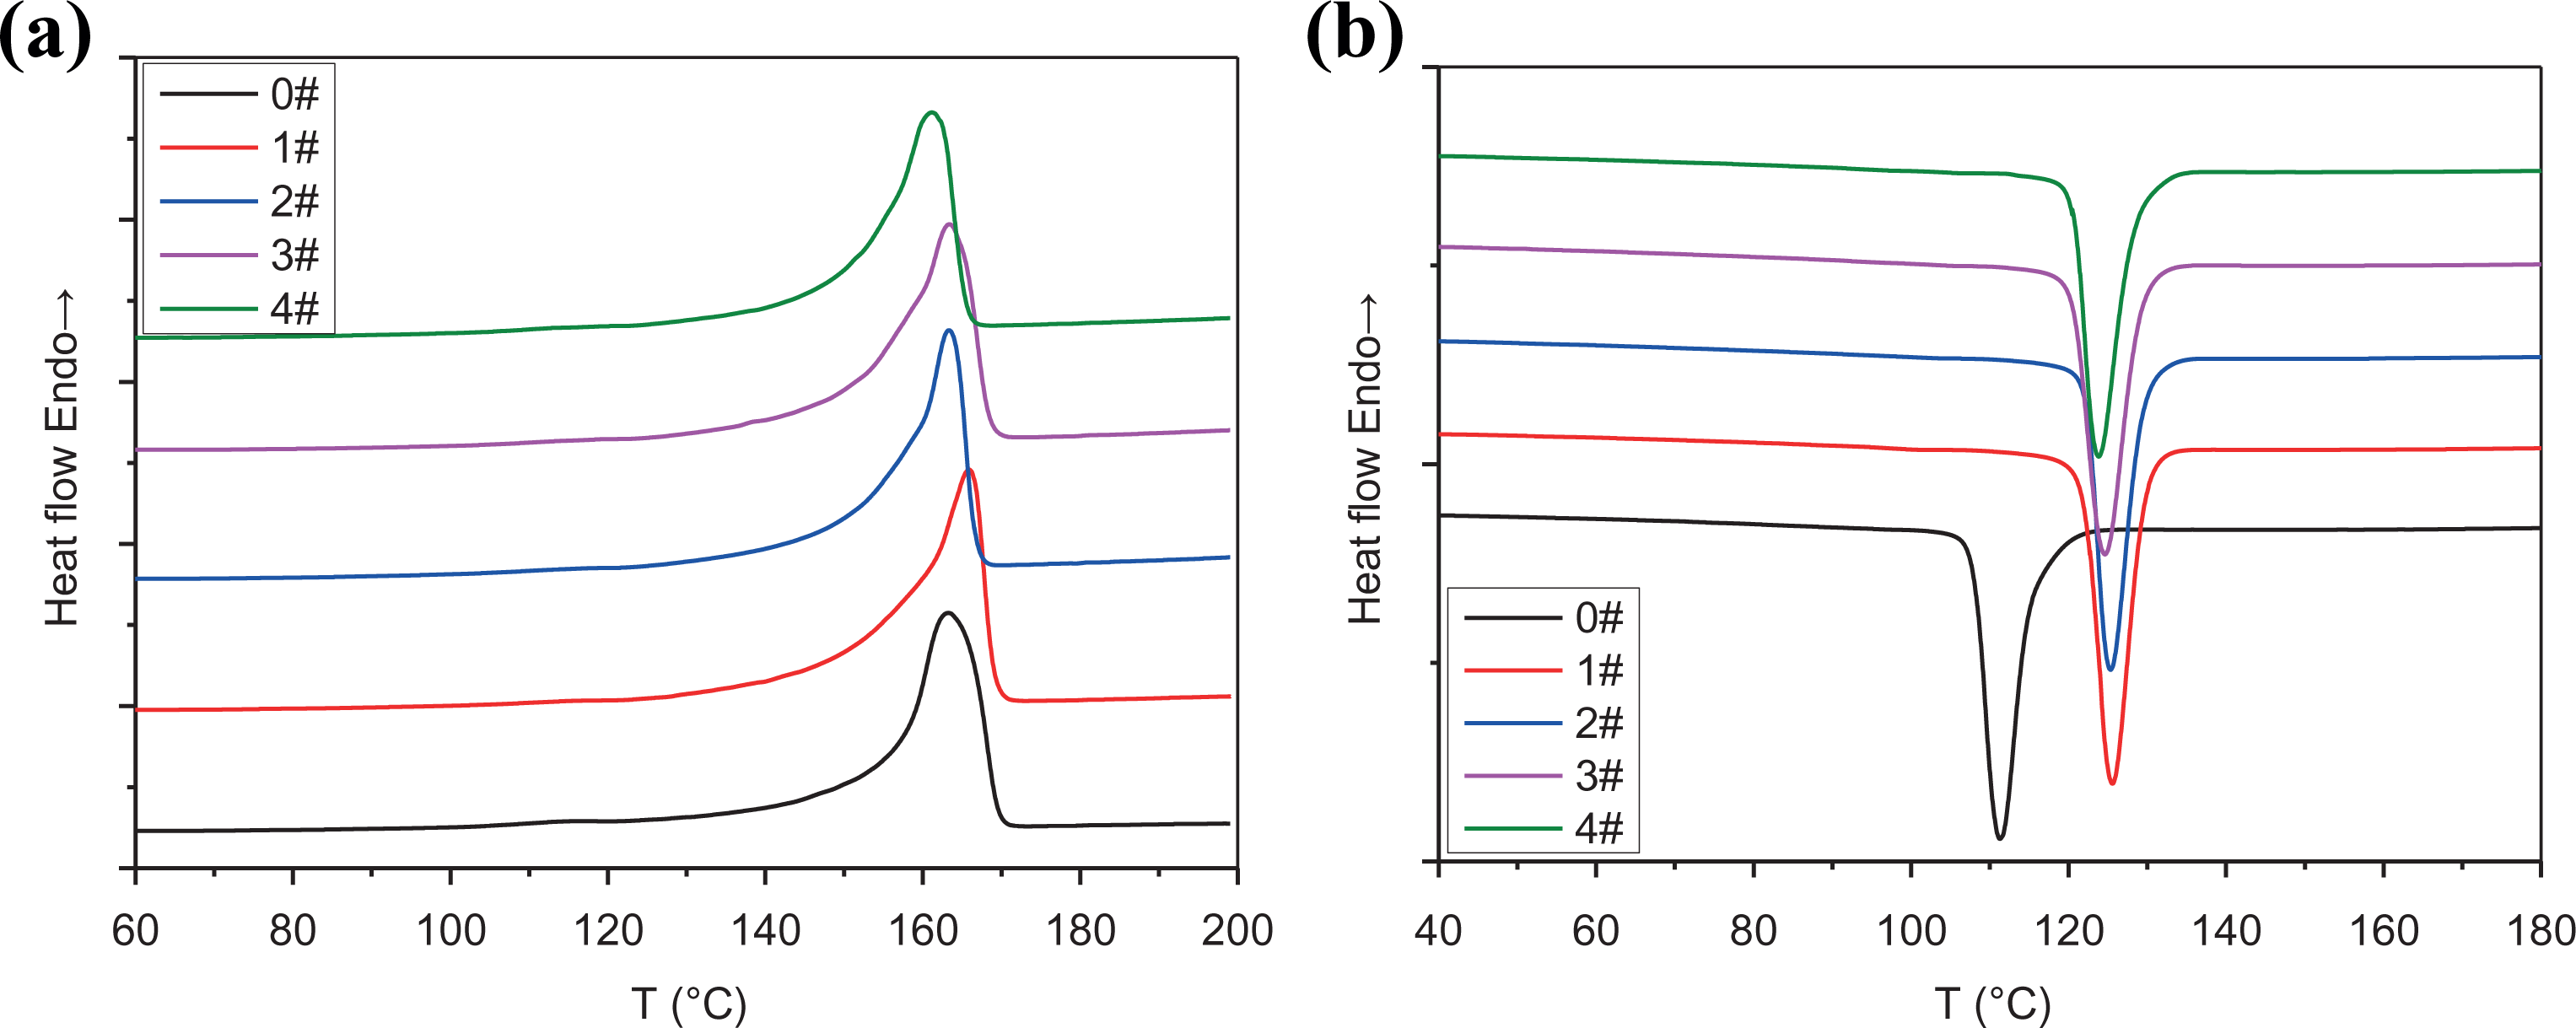
The DSC curves with different PTFE contents: (a) the melting curve and (b) the crystallization test curve.
As shown in Figure 7, the DSC test of the material was carried out at the heating rate of 10 C min−1, and the heat absorption direction was in the longitudinal coordinates. We find from Figure 7(a) that the melting point of the composite system increases with the addition of 10% PTFE. However, the melting point of the material decreases gradually and is less than 0# when the content of the additive exceeds 20%. When PTFE content reaches 40%, the melting point decreases obviously. It shows that the melting point of the composite system affected slightly by the addition of PTFE less than 40%.The cooling rate was also controlled at 10° min−1. It was found that the crystallization temperatures of the materials were increased. Nevertheless, the amount of addition had little effect on the crystallization temperature. The fibers were solid near the crystallization temperature of iPP, and the specific surface area of fine fibers is larger, which has a greater impact on the matrix material. The fibers attached to fine solids preferentially nucleate and crystallize. Figure 7(a) and (b) shows the DSC results of melting and crystallization behavior, respectively. As can be seen from Figure 7(a), the addition of PTFE reduces the melting temperature and crystallinity of the iPP. This is mainly due to the heterogeneous nucleation of unmelted PTFE in the crystallization process of PP, which promotes the crystallization process of iPP. The significant increase of the initial and peak crystallization temperatures in Figure 7(b) also proves that the heterogeneous nucleation of solid PTFE in the crystallization process of iPP is very obvious. As far as melting temperature and crystallinity are concerned, at the same cooling rate, the effect of different forms of PTFE (spherical or fibrous) on the crystallinity of iPP is not significant, and it is difficult to see the difference in DSC curve.
Effect of screw shearing on microfiber morphology
To observe the morphology of the fiber under different shear strength, the SEM images of the treated samples were obtained, as shown in Figure 8. The samples images from left to right are sampled on 1, 2, 3, 4, and 5 zones of each screw in turn. From top to bottom, A, B, C, and D are four samples of screw assemblies. From these SEM images, we can see the deformation process of fibers.
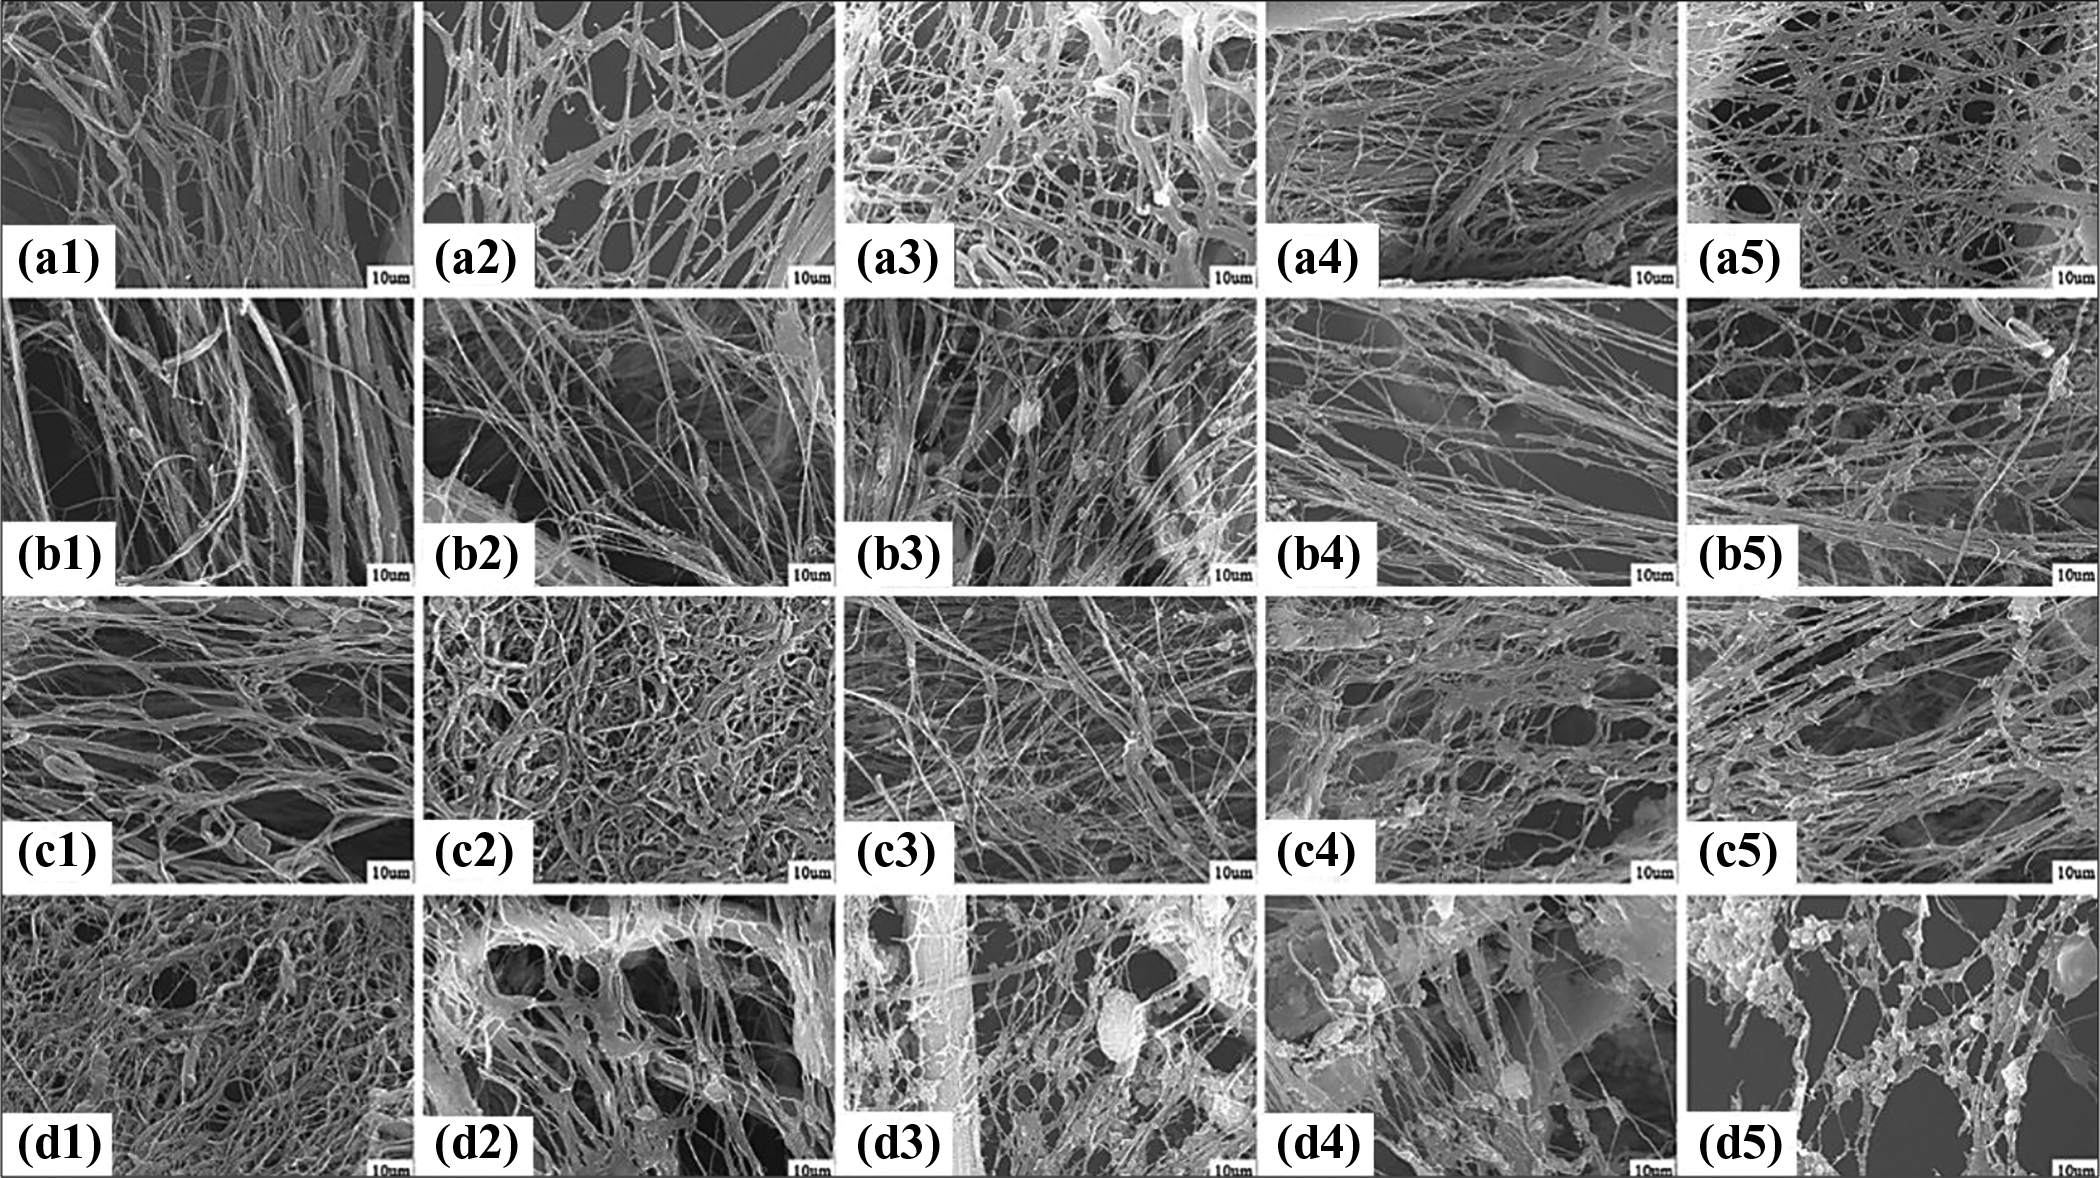
The SEM images of fiber morphology with different screw combinations: (a1) the sampling zone 1 of screw A, (a2) the sampling zone 2 of screw A, (a3) the sampling zone 3 of screw A, (a4) the sampling zone 4 of screw A, (a5) the sampling zone 5 of screw A, (b1) the sampling zone 1 of screw B, (b2) the sampling zone 2 of screw B, (b3) the sampling zone 3 of screw B, (b4) the sampling zone 4 of screw B, (b5) the sampling zone 5 of screw B, (c1) the sampling zone 1 of screw C, (c2) the sampling zone 2 of screw C, (c3) the sampling zone 3 of screw C, (c4) the sampling zone 4 of screw C, (c5) the sampling zone 5 of screw C, (d1) the sampling zone 1 of screw D, (d2) the sampling zone 2 of screw D, (d3) the sampling zone 3 of screw D, (d4) the sampling zone 4 of screw D, and (d5) the sampling zone 5 of screw D.
From the processing process, the shear strength of screw A is the weakest, there are two shear fields in the front of the screw, and there is no shear element in the back of the screw. From the fiber morphology, it can be seen that the fiber has become fibrous after the first shear field, the fiber diameter continues to decrease after the second shear field, and the fiber is refined and homogenized under the action of the subsequent tensile field, eventually forming a well-distributed network of fiber structure. The shear strength of screw D is higher than that of screw A. But there is no shear element before zone 1, and the shear elements are arranged before zones 2, 3, and 4. From the sample of screw D, the fiber of the sample in zone 1 is serious adhesion, and there is no obvious fibrous formed, because of the weak shear. Under the condition that the fine fibers did not formed, it was found that the adhesion of the fibers was more serious after intensive shearing. Most of the fibers formed continuous phase of block or sheet, and the morphology of the whole fiber was poor. The screw C has shear elements before 1, 2, and 4, so the shear strength of screw C is stronger than that of screw D. The SEM images show that the fiber morphology is also obvious after shearing in zone 1. After shearing in zone 2, stretching before zone 3, and shearing in zone 4, the diameter of the fiber decreases continuously, but the samples in zone 3 and zone 4 show that the fiber begins to adhesion and break, which indicates that the fiber is not strong enough to endure the shear of this strength. Screw B has the strongest shear strength among the four screws, and shear field exists in the 1, 2, 3, and 4 zones. It was found that the fibers have formed after the 1 zone, and the fibers have broken under the subsequent intense tensile.
Comparing with the four kinds of screw, it is found that the better fibers can be formed in zone 1 with shear field, and the subsequent processing fibers can be more refined. The shear field in zone 2 can further reduce the diameter of the dispersed phase which is well-formed fibers, but the situation in the D-screw begins to deteriorate. The samples from the four screws of zone 3, the fibers were further formed with no significant difference. However, after shearing in zone 4, it was found that both B and C screws have fiber breakage, which indicates that the strong shear in this part is not conducive to the formation of better fiber morphology.
Because PTFE is prone to deformation when subjected to shear and tension, it is not necessary to have too strong shear strength during fibrillation. However, the application of shear force needs careful consideration. When the blends entered the screw, the shear field must be applied to make PTFE fully dispersed and pre-deformed to form the initial fibrous structure. Otherwise, just like D screw, there is still no fibrillar dispersion after temperature rise, and under the shear effect, it will only adhere to each other, and no fibers can be formed. In the case of initial fiber formation, as the temperature increases and the shear field was applied, the PTFE became soft, the fibers were continuously squeezed and stretched, the length was continuously increased, and the diameter was reduced. As the fibers diameter decreases, the shear field continues to increase and the fiber breaks. Just like the case of screws B and C.
Many researchers evaluate fiber characteristics by length to diameter ratio. The parameter is relatively large, the fiber network structure is better, and the performance improvement of the matrix is more remarkable. 30 -32 To accurately establish the relationship between experimental parameters and fiber changes, quantitative studies should be used. Therefore, the diameter of the fiber was measured, as shown in Table 4. It can be seen from the SEM images that the fibers are in a continuous state. Since it is difficult to accurately measure the length of the fiber, we evaluate it by diameter.
As seen from the Table 4, the fiber diameter of each screw is continuously reduced as the extrusion progresses, and the fiber average diameter of the screw A is the smallest. The adhesion of dispersion D is too serious. The strong shear of screw leads to the increase of the fracture degree of fibers in the flow field, and the dispersive fibers still do not form after the increase of temperature, which will adhere to each other. These adhering fibers cannot be separated clearly, so the diameter data are meaningless. Compared with the three screws of A, B, and C, the order of shear strength is A < C < B, and the average diameter of fibers is A < C < B.
In the process of PTFE fibrillation, shear field should be applied in the melting stage of the matrix to form the basic fiber type during the heating and softening stage. Then the shear strength is increased to form a smaller diameter fiber, but the shear strength is not too large. In the second half of the screw, the shear field should be minimized. At this time, the fine fiber on the tensile stress can be continuously changed, and the shear will cause the fiber to break, so the shear strength should be avoided as much as possible.
As shown in Table 4 and Figure 8, the fiber diameters of different screw combinations A, B, C, and D are compared. The morphology of microfibers are the best, the average diameter of microfibers is the largest, followed by C and D screw. The maximum fiber diameter of screw combination B is 0.0654 µm and the average diameter of five regions is 0.05332 µm; the maximum diameter of microfibers obtained by screw combination C is 0.0647 µm and the average diameter is 0.05176 µm; the optimal fiber diameter prepared by screw combination D is 0.0617 µm and the average is 0.04908 µm; the maximum fiber diameter of screw combination A is 0.0638 µm and the average diameter of five regions is 0.0638 µm. According to the screw combination shown in Figure 1, the shear mixing effect of screw combination A, D, C, and B are enhanced in turn, which shows that for iPP/PTFE blend system, it seems that the stronger shear force is more suitable for the fiber formation of dispersed phase PTFE. With the increase of shear force, we find that the D flow field tends to cut the fibers, which hinders the formation of fibers to some extent.
However, it is found that the ratio of fiber length to diameter is the largest in the region 1 corresponding to the B-screw combination, and the increase of fiber diameter is due to the larger probability of collision and aggregation of particles in the flow field corresponding to the B-screw combination. In addition, it should be considered that the shear temperature rise will increase with the increase of shear force in the extruder. Therefore, the effect of high shear temperature rise can be compensated by lowering the temperature appropriately.
Effect of in situ microfibrils on rheological properties of iPP
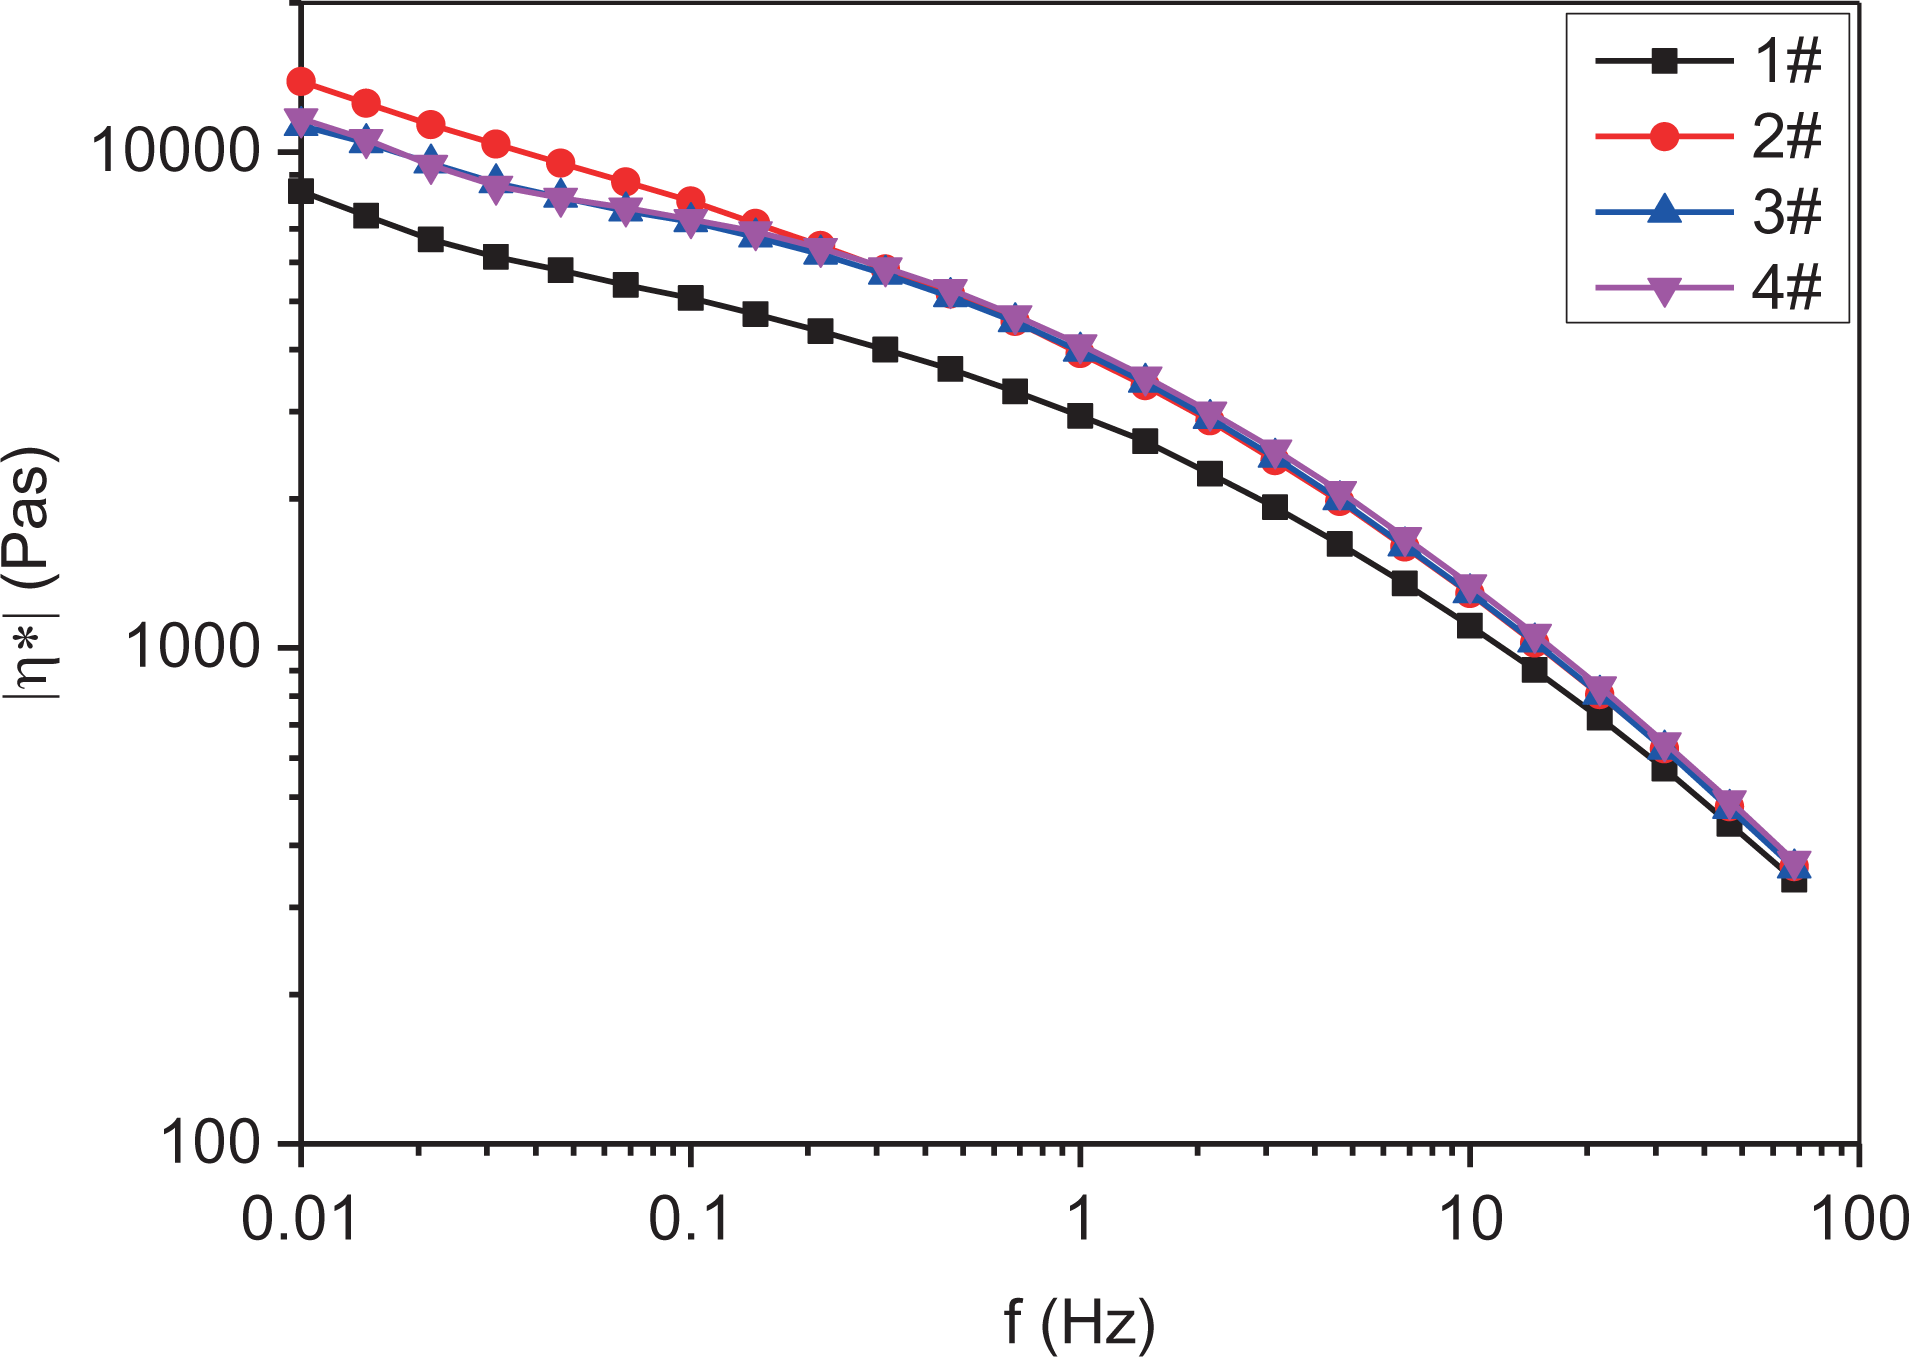
The flow of the polymer is affected by various factors such as temperature and shear. The dynamic rheological behavior of the material can obtain the performance parameters of the material. Dynamic rheological properties were tested on the samples to observe the difference in flow properties of the composites formed under different screw combinations. The complex viscosity is a basic parameter of the polymer. Firstly, the complex viscosity η* of the material was studied, and the dynamic rheological test was performed by a flat rheometer. Complex viscosity is affected by many properties of the material, such as molecular structure and molecular weight. As shown in Figure 9, the 0# sample was a blank control group to which no PTFE was added, and each sample exhibited shear thinning. The viscosity of the three groups of B, C, and D is lower than 0#, because the high strength shear affects the molecular structure of the iPP matrix, which causes the overall viscosity to decrease slightly. It can be seen from the Figure 9 that in the high-frequency region, the complex viscosity of the sample A and the sample 0# is similar, but there is a large difference in the low-frequency region, and the viscosity of the sample A is significantly higher than that of the sample 0#. This is due to the formation of PTFE fibers, which affect the viscoelasticity of the material, so that the material has a longer relaxation time and a longer relaxation time distribution. When the stress was applied, PTFE fibers prevented to rapid deformation and the relaxation time increased.
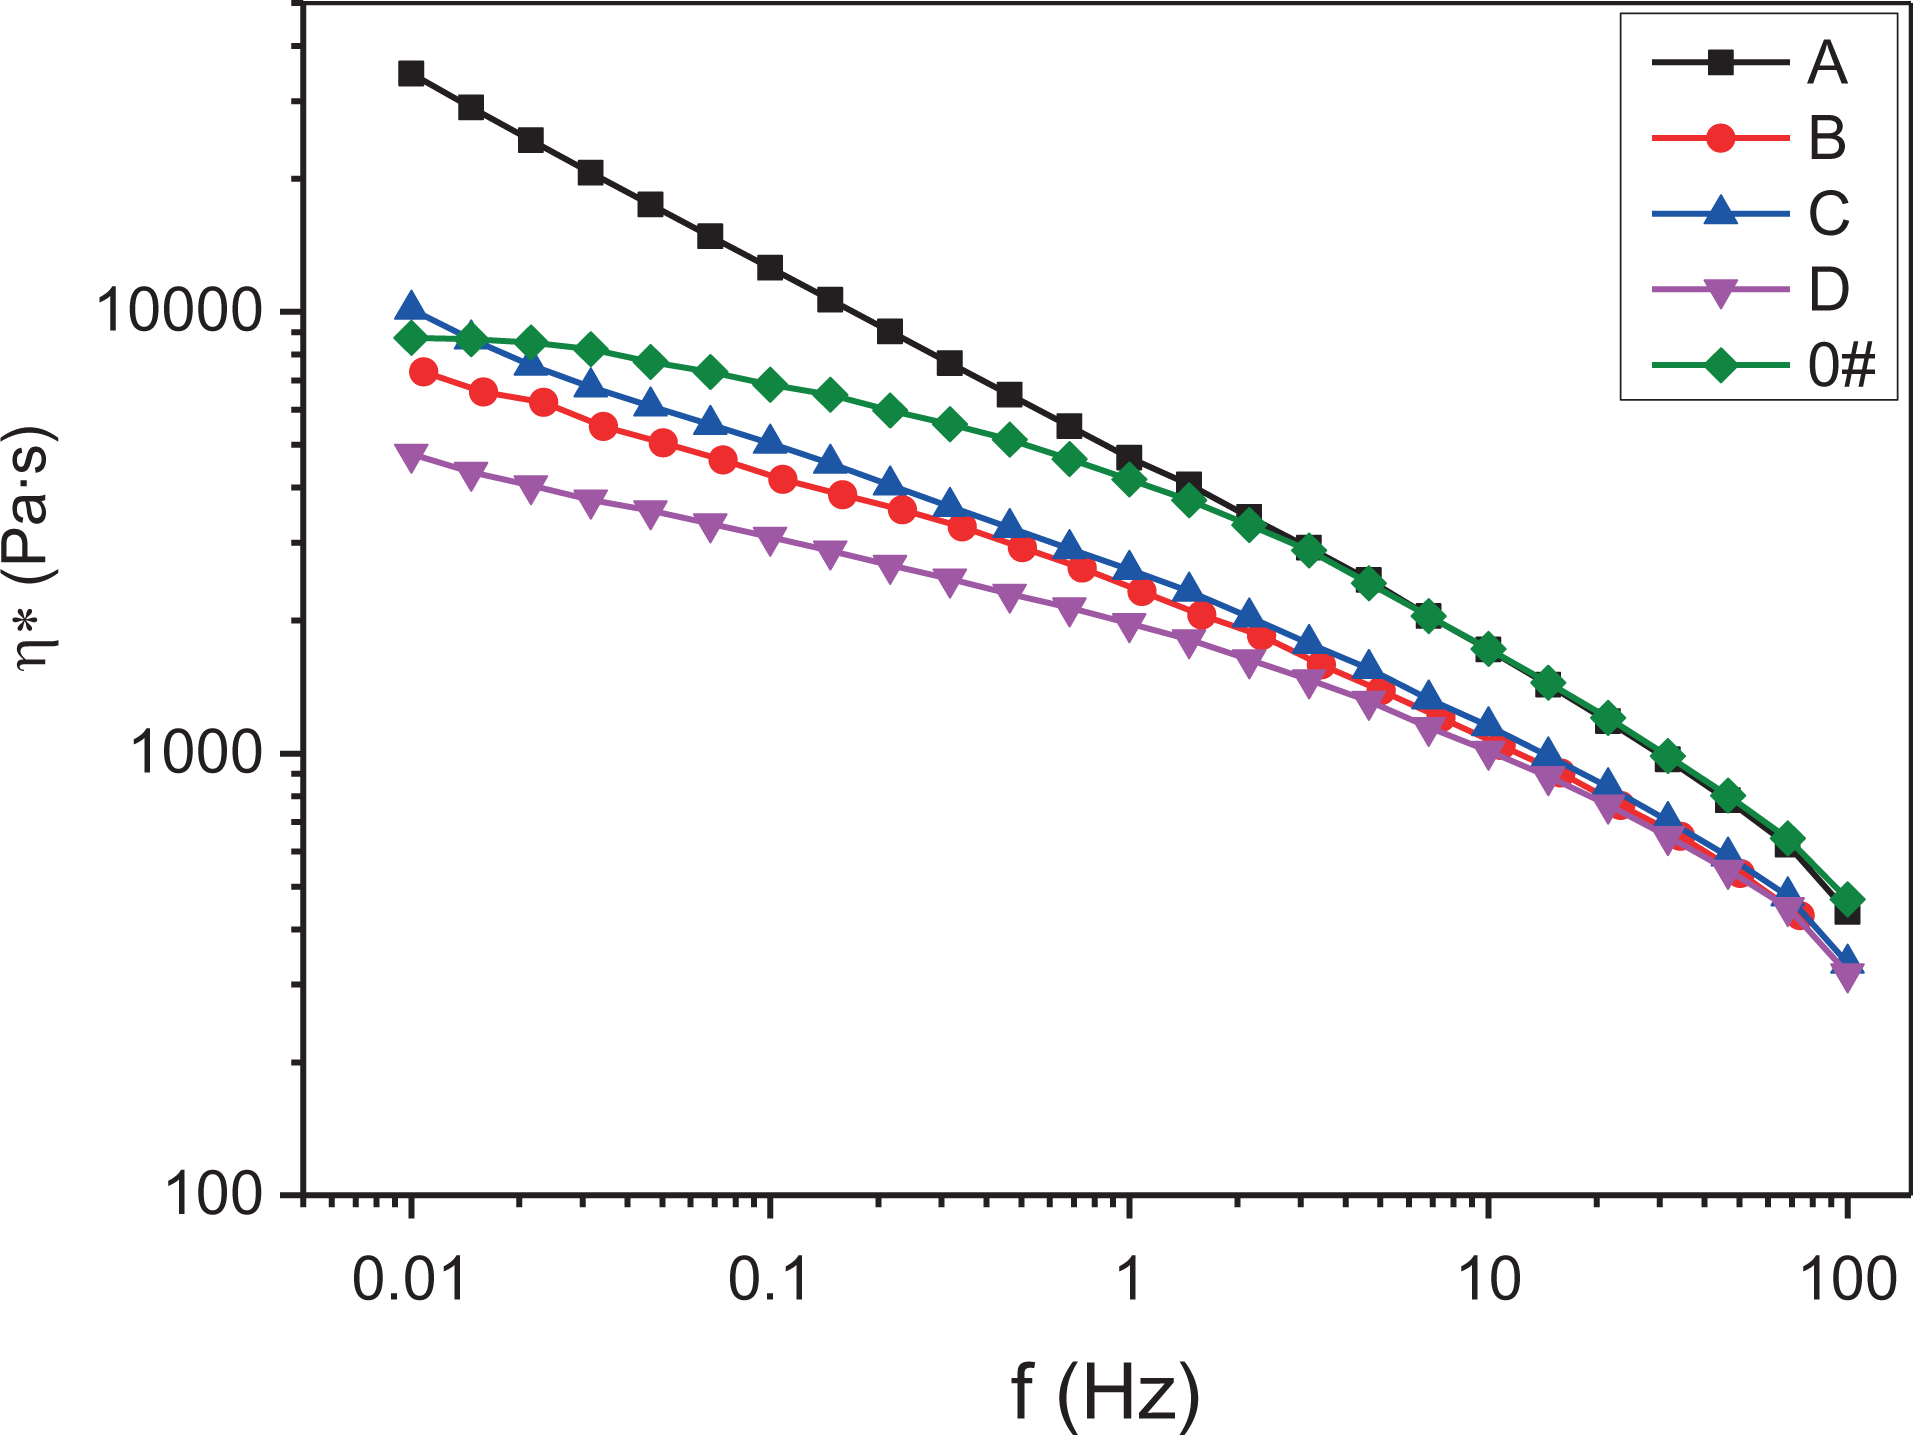
The complex viscosity of different samples.
The storage modulus G′ is a parameter that is often concerned when the performance of the material is reflected by the dynamic rheological test results. This parameter can characterize the elastic properties of the material. The storage modulus is closely related to the molecular structure of the material, which is greatly affected by the angular frequency and the structural changes of the molecular chain. Because of the molecular structures, the G′ of the polymer varies with the angular frequency at the low-frequency end. By observing the change of slope in the low-frequency region, we can find the linear-chain molecular sample, as shown in Figure 10. The storage modulus of each sample is basically the same when the angular frequency is large. With the decrease of frequency, the storage modulus of sample A is much higher than that of other ones. The curves of B, C, and D in the low-frequency region show a slight upward trend, and the slope decreases. The same deviation from the standard linear chain of the end effect can be used to judge the nonlinear network structure in the material.
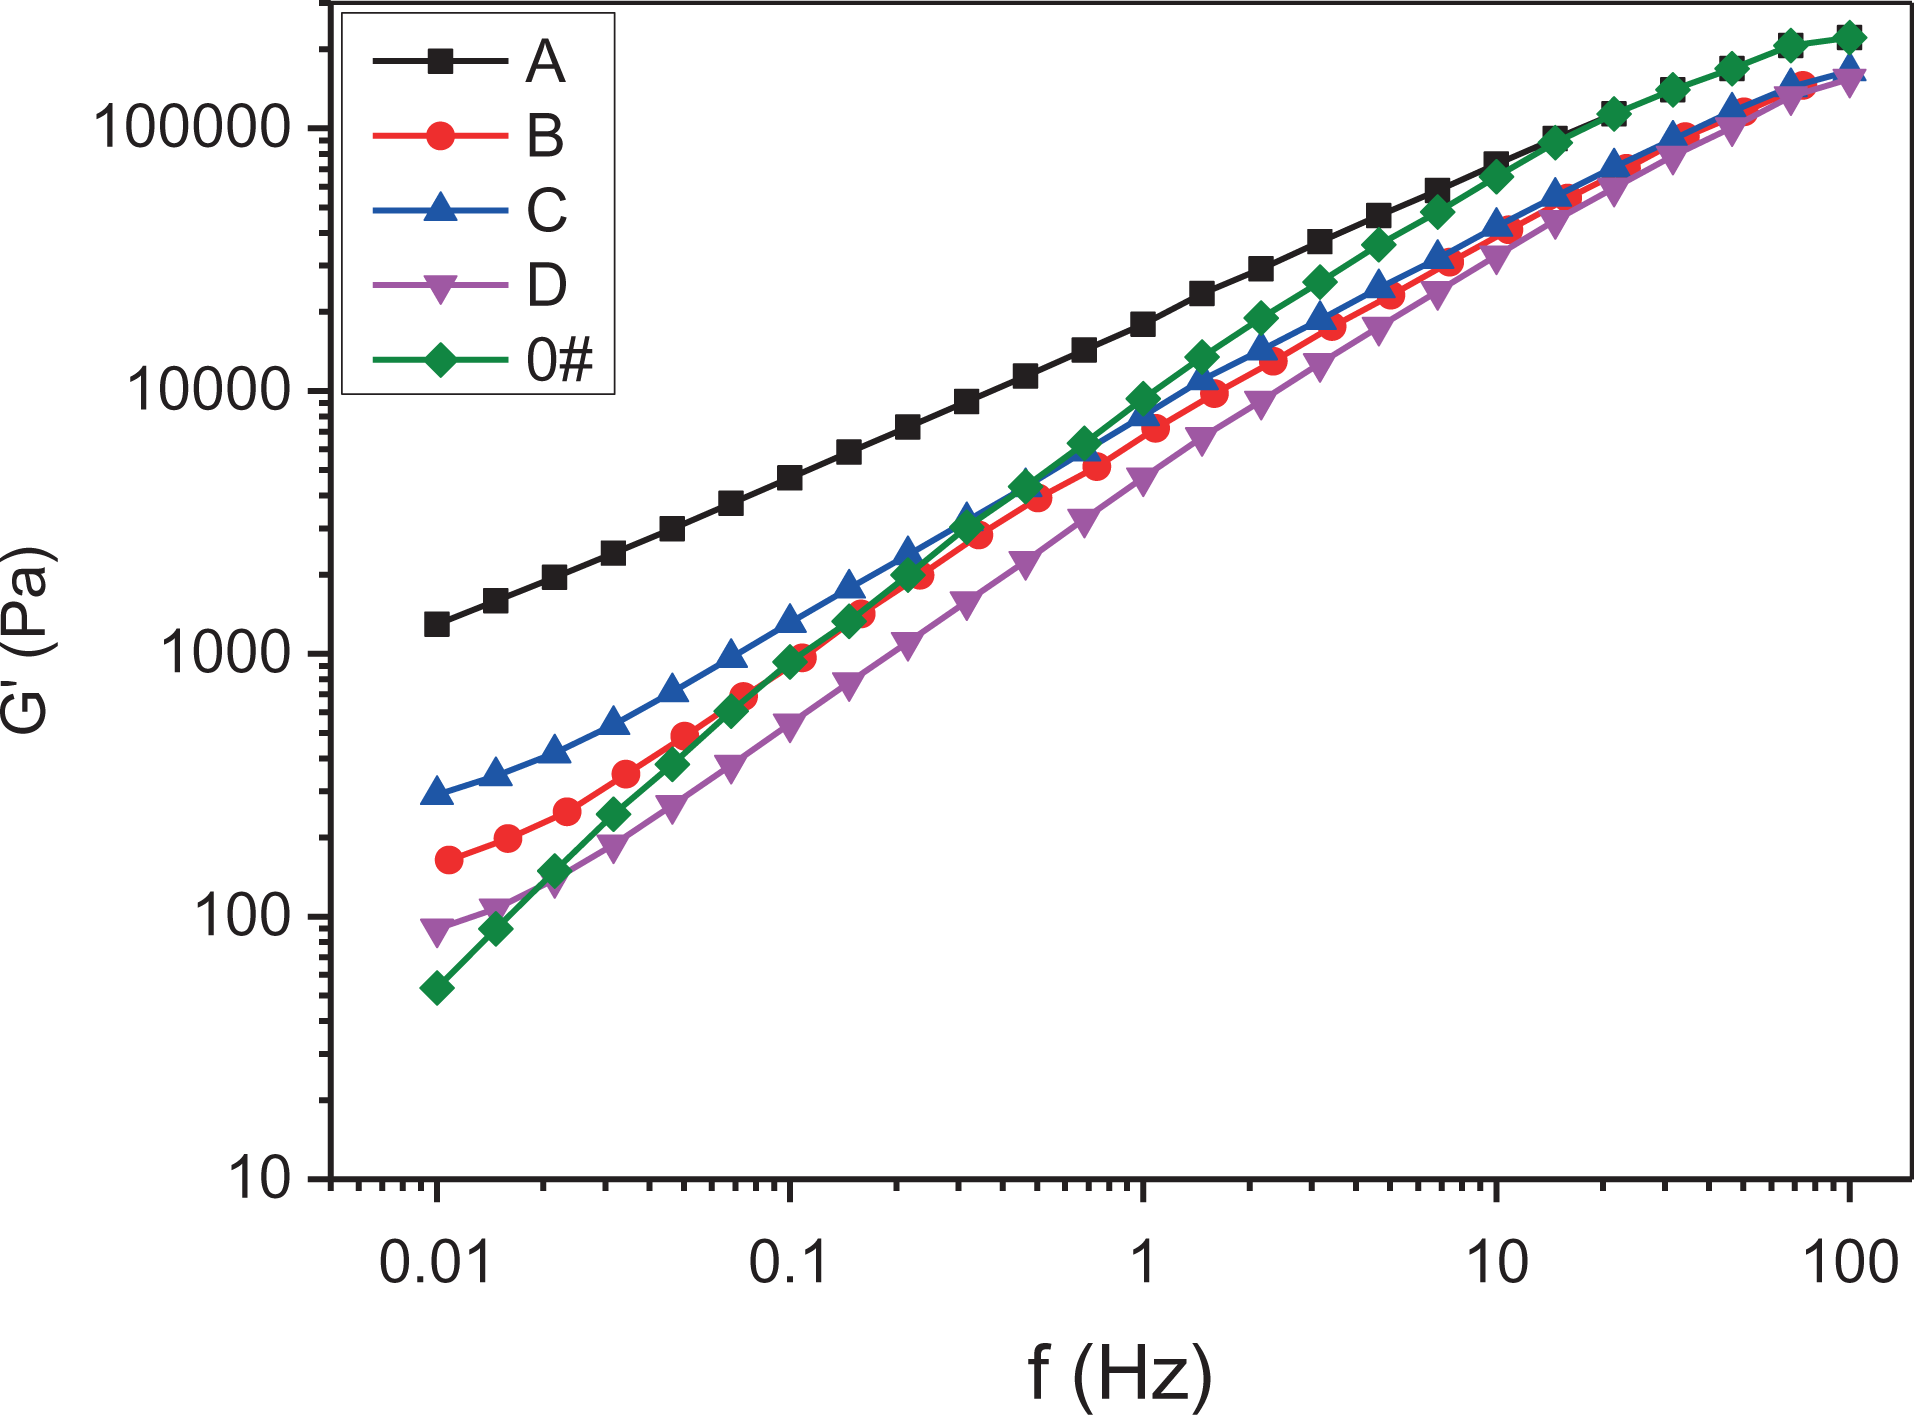
The storage modulus of different samples.
As shown in Table 4, the degree to which the test curve of each samples deviates from the 0# sample is related to the fiber diameter. Sample D is not a complete fiber structure due to the strong bonding and has no reference value. The smaller fiber diameter of the three samples A, B, and C, the greater the deviation of the curve from the 0# curve. It shows that the smaller the fiber diameter, the tighter the network entanglement is formed, and the performance improvement of the matrix material is more remarkable. The SEM image of sample A showed a very reticular structure of the fibers. The results of the dynamic rheological properties also can confirm it.
The loss tangent tan δ is a very meaningful parameter in the characterization of foaming properties. It is equal to the ratio of the loss modulus G″ to the storage modulus G′, which represents the specific gravity of the elastic action in viscoelasticity. It is a very important parameter in the evaluation of foaming materials. It is found that tan δ can predict the foaming properties of polymer materials. The loss tangent tan δ changed with angular frequency, and the characteristics of low-frequency region in rheological properties have reference value. The decrease of tan δ in the low-frequency region indicates that the greater the proportion of the elastic in the viscoelasticity, the more favorable to the foaming. Figure 11 is the curves of loss tangent of different samples. Compared with 0# samples, the values of all samples were reduced, and the sample A was the smallest. Sample A has the smallest fiber diameter, and the tan δ value does not change substantially throughout the entire frequency range, and the entangled physical structure of the network further promotes the increase in elasticity. Fibers in the three samples of B, C, and D also exhibited this effect, but they were relatively poor. The order of change indicates that the smaller the fiber diameter, the more obvious the effect on the elasticity of the composite material, and the more favorable the foaming.
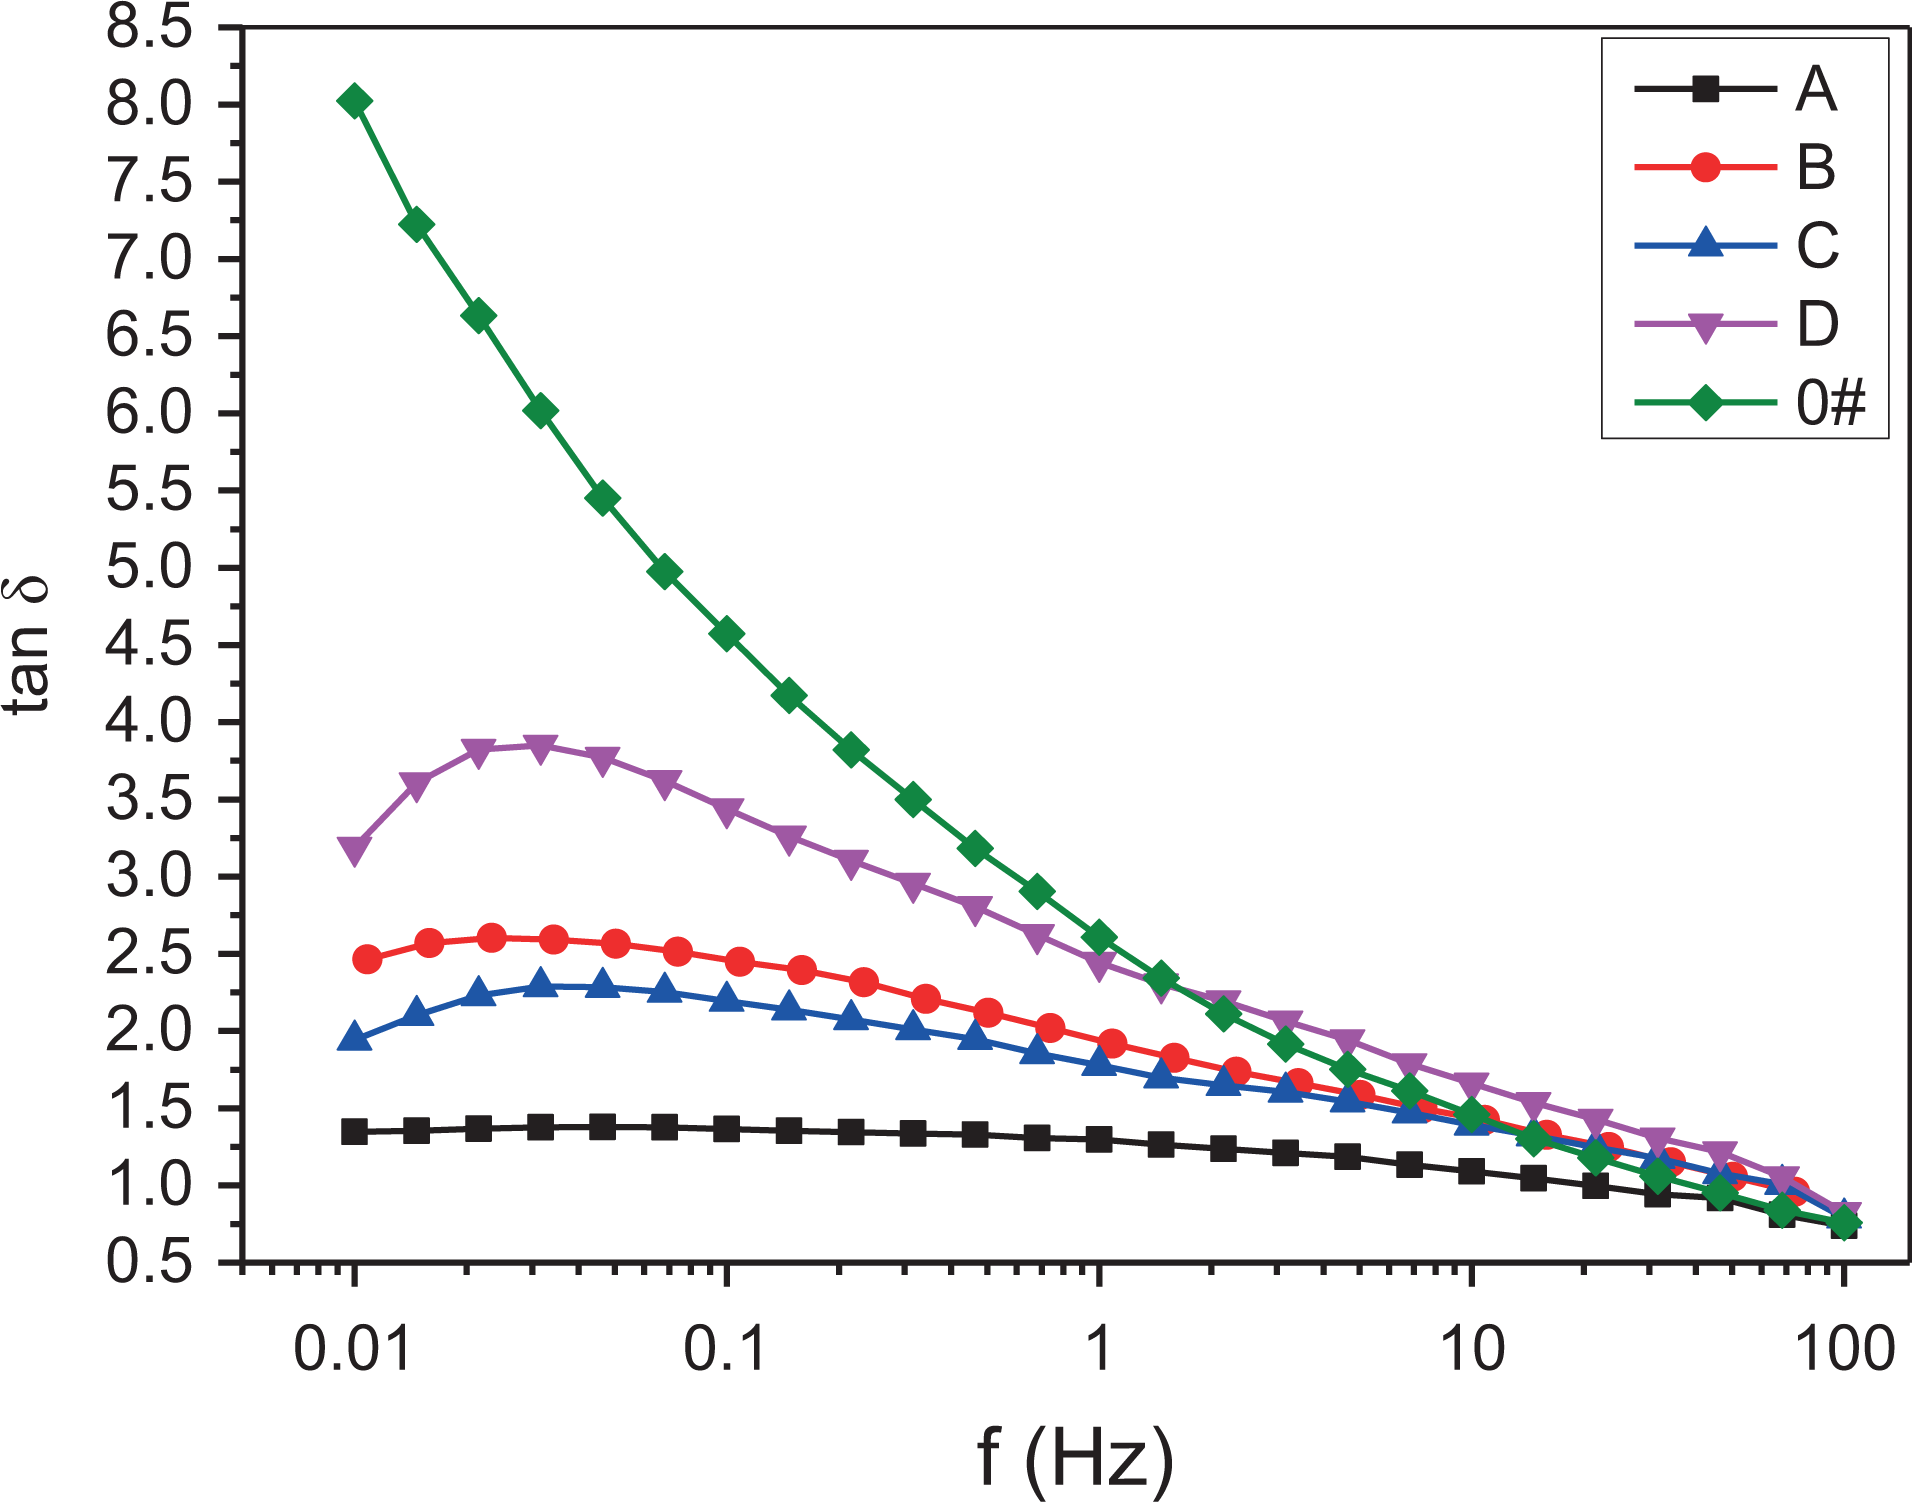
The loss angle tangent of different samples.
According to the testing principle of gel point, it essentially reflects the elastic properties of the blend system, indicating that the fibers formed after adding PTFE have stronger elastic deformability than iPP. The formation of physical entanglement network structure was confirmed by rheological tests and SEM images. The Winter–Chambon criterion has been widely used to accurately determine the gel points of physical and chemical gels from rheological data. 33,34 PTFE can form a gel structure when forming a physical entangled network structure. The gel polymer has the rheological characteristics that the loss tangent does not change in the whole frequency range. For specific fiber diameter samples, the tan δ value decreases with increasing concentration, and the curve forms a common intersection point, which is considered to be the critical concentration of the entanglement of fiber formation network, that is, the gel point. This critical concentration implies that for fibers with specific morphologies, a network structure can be formed to achieve the minimum concentration of physical entanglement. It can be concluded from this phenomenon that fiber diameter has a significant effect on gel point formation. In addition, larger diameter fibers require lower fiber content to form physical entanglement networks. On the one hand, the fibers with larger diameter have larger surface area and increase the interface area between PP and PTFE; on the other hand, the fibers with larger diameter tend to form high concentration physical tangles than those with smaller diameter.
The rheological test results were obtained by diluting the sample to different concentrations, as shown in Figure 12. The gel point of sample A is 7.8 wt%, and the gel point content of B and C samples is 10 wt%. The samples D was diluted, and gel points are not obtained in various concentration ranges. Because the fiber diameter of sample A is the smallest, the concentration needed to form physical entanglement network is also smaller. Because the concentration of 10 wt% is larger than the gel critical concentration of sample A, we can see that there is an obvious network entanglement structure in the SEM picture of Figure 7. The samples B and C were not very obvious. We hope to form a better physical entanglement structure with the least addition, so the diameter or aspect ratio of the fiber should be controlled as much as possible during in situ fibrillation. The shear strength of PTFE composites with dispersed phase should be controlled in a suitable range.
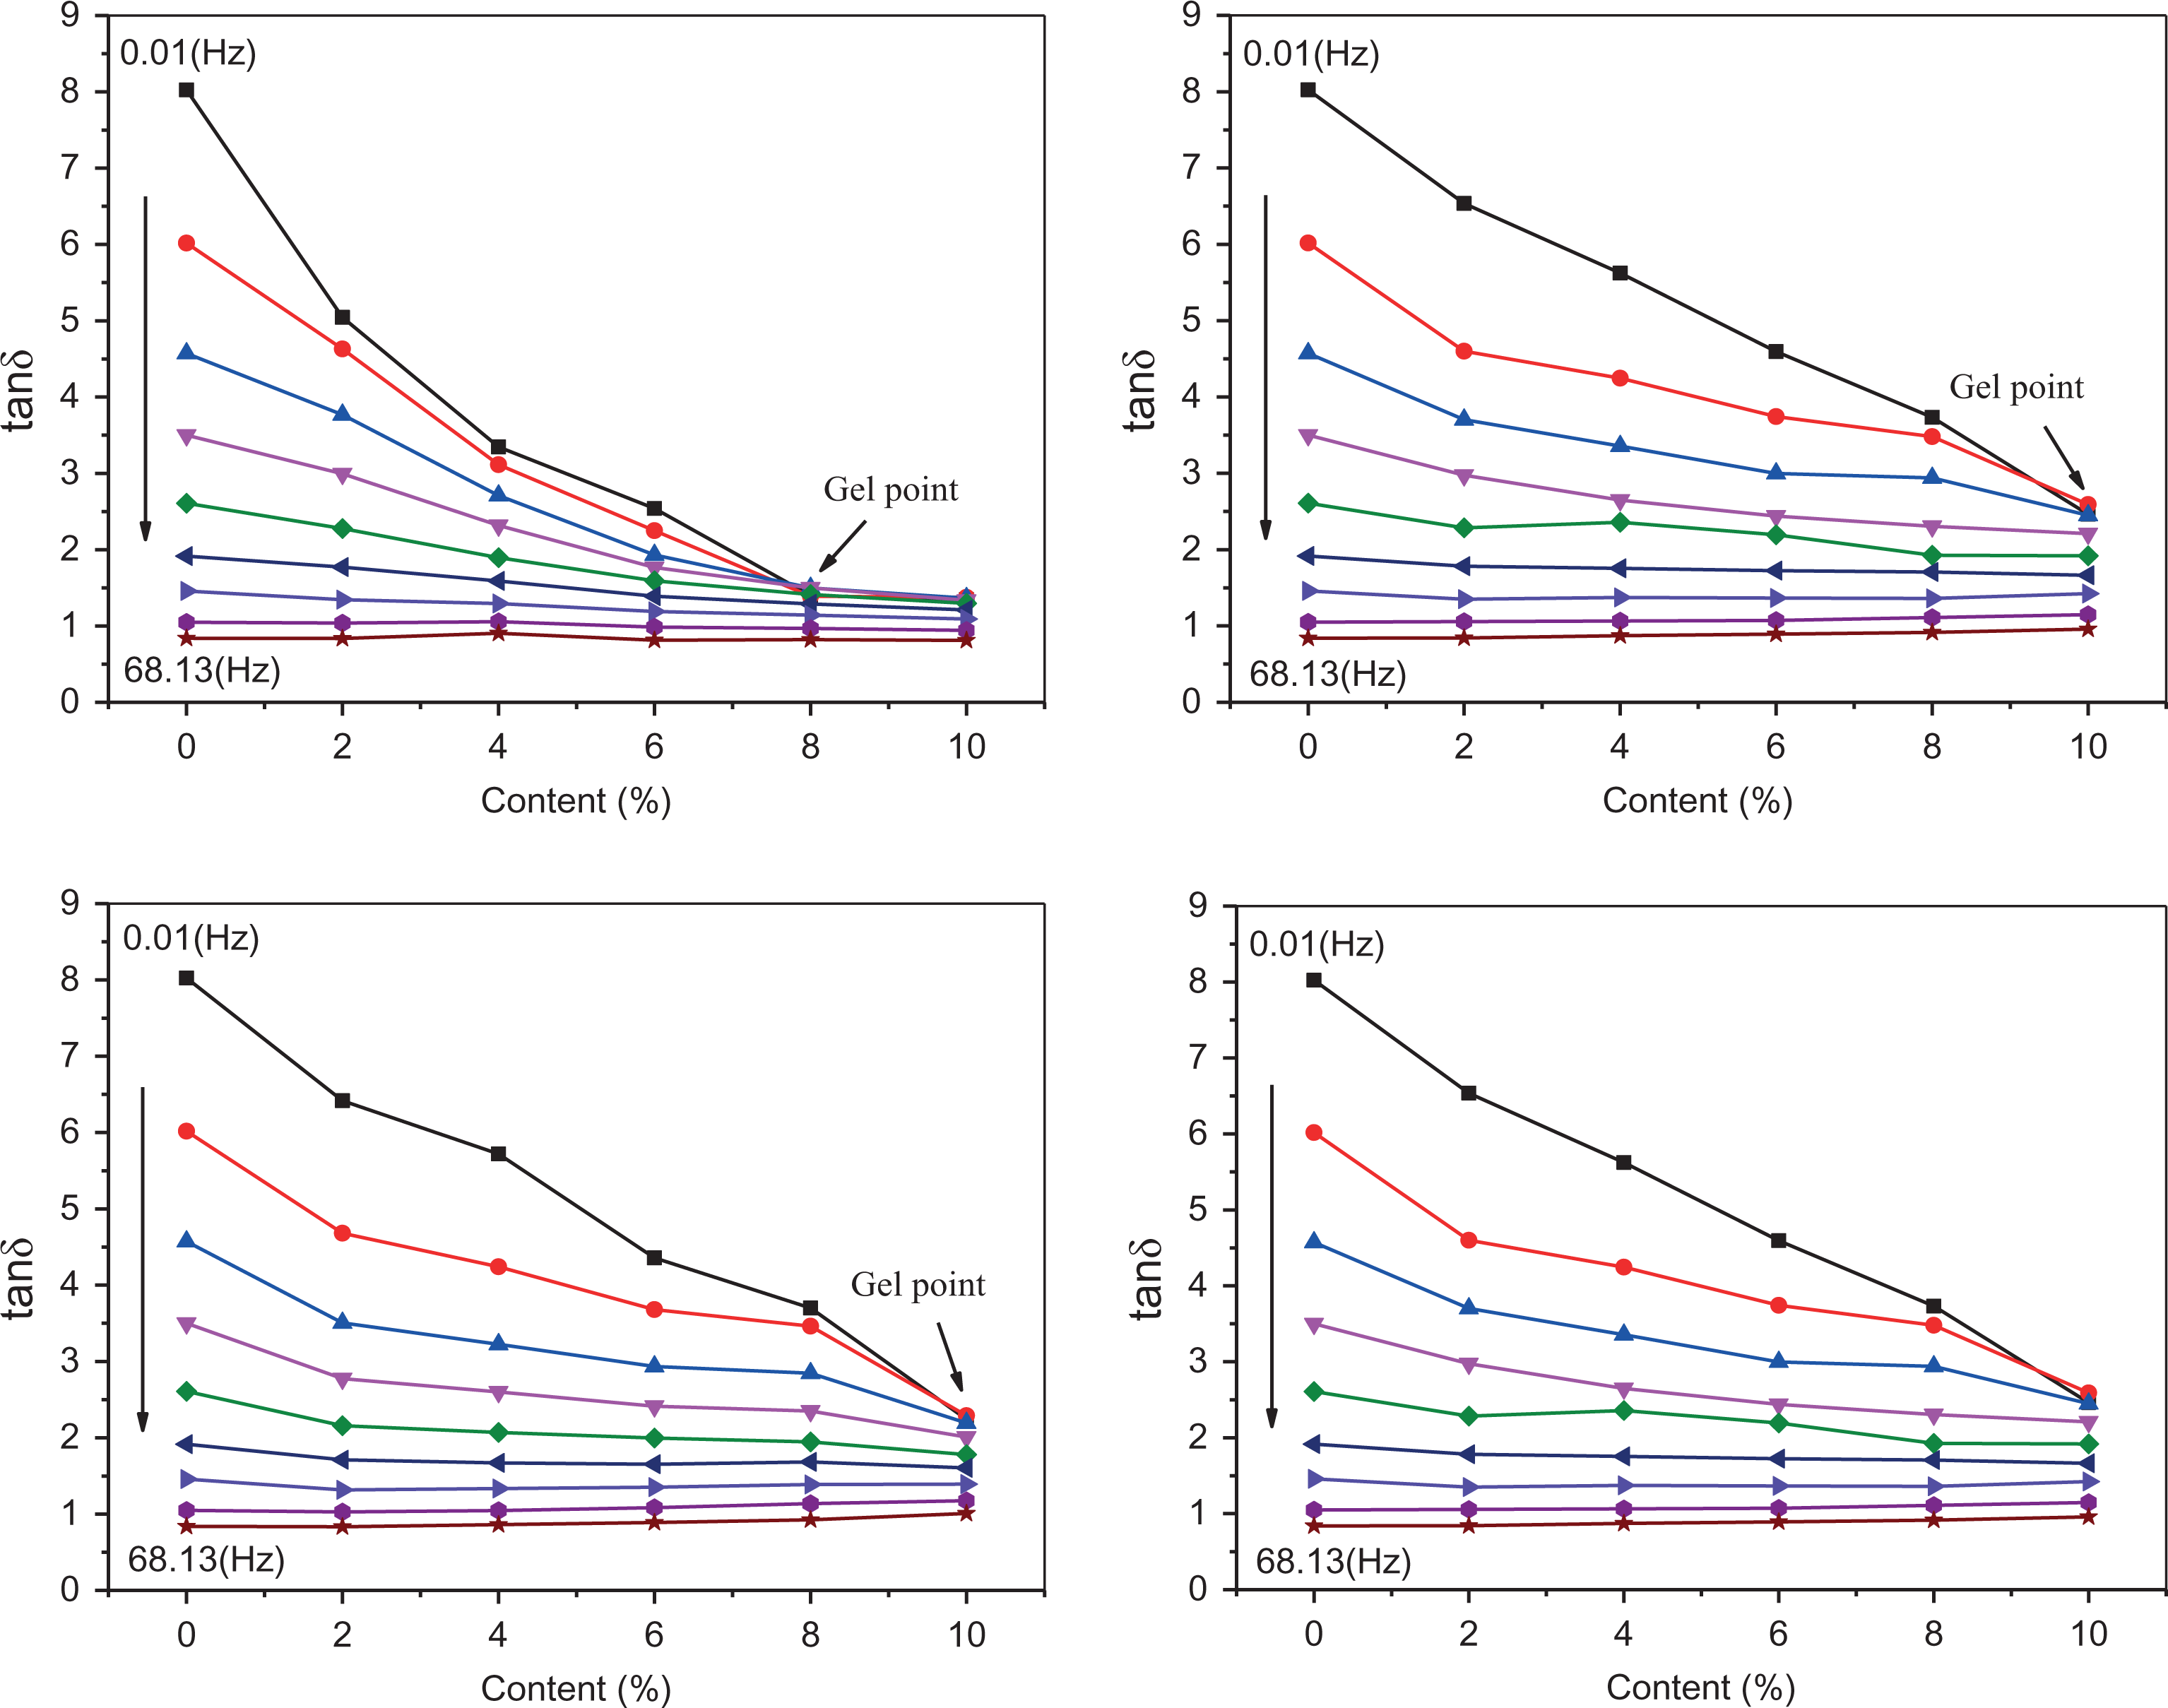
The gel points of different samples: (a) sample A gel point, (b) sample B gel point, (c) sample C gel point, and (d) sample D gel point.
Batch foaming process
To verify the foaming properties of iPP composites with different PTFE microfibers content, batch foaming experiments were carried out and the foaming expansion ratio of the samples was tested. The foaming expansion ratio was calculated by dividing the density of raw materials before foaming by the apparent density of foamed products that is one of the most commonly used method to measure the foaming effect. The experimental equipment is a self-made autoclave. Firstly, the temperature of autoclave was raised to 200°C. The cylindrical samples with length of about 20 mm and diameter of 2 mm were put into the autoclave and sealed. Vacuum pump was used to extract 2 min, and no air and water exist in the autoclave. Then CO2 was injected into the autoclave by a booster pump, and the pressure of CO2 in the autoclave was stable at 15 MPa. The autoclave was then heated to 200°C and held for 10 min to ensure that the sample was fully melted and CO2 was dissolved into the sample rapidly. Then the temperature was reduced to the foaming temperature. The pressure in the autoclave was kept constant at 15 MPa when the temperature changed. Finally, the pressure was quickly released through the valve, and obtained the foaming samples. At different foaming temperatures, the time from cooling to pressure relief foaming was 60 min. After the pressure relief was completed, the autoclave was quickly opened and the foamed sample were cooled at room temperature for subsequent characterization. The cell density of each sample was calculated by the following formula (3).It can be seen from the test data that the addition of PTFE can increase its elasticity, tensile viscosity, and crystallization temperature. Therefore, batch foaming experiments at different temperatures were carried out, and the test results are shown in Figures 13 and 14. The foaming expansion ratio of the composites with PTFE is higher than that of the matrix without PTFE. The reason is that the fibers increase the elasticity and melt strength of the matrix. The cell wall is not easy to crack and merge when the biaxial tensile stress of the cell wall under the bubble growth.
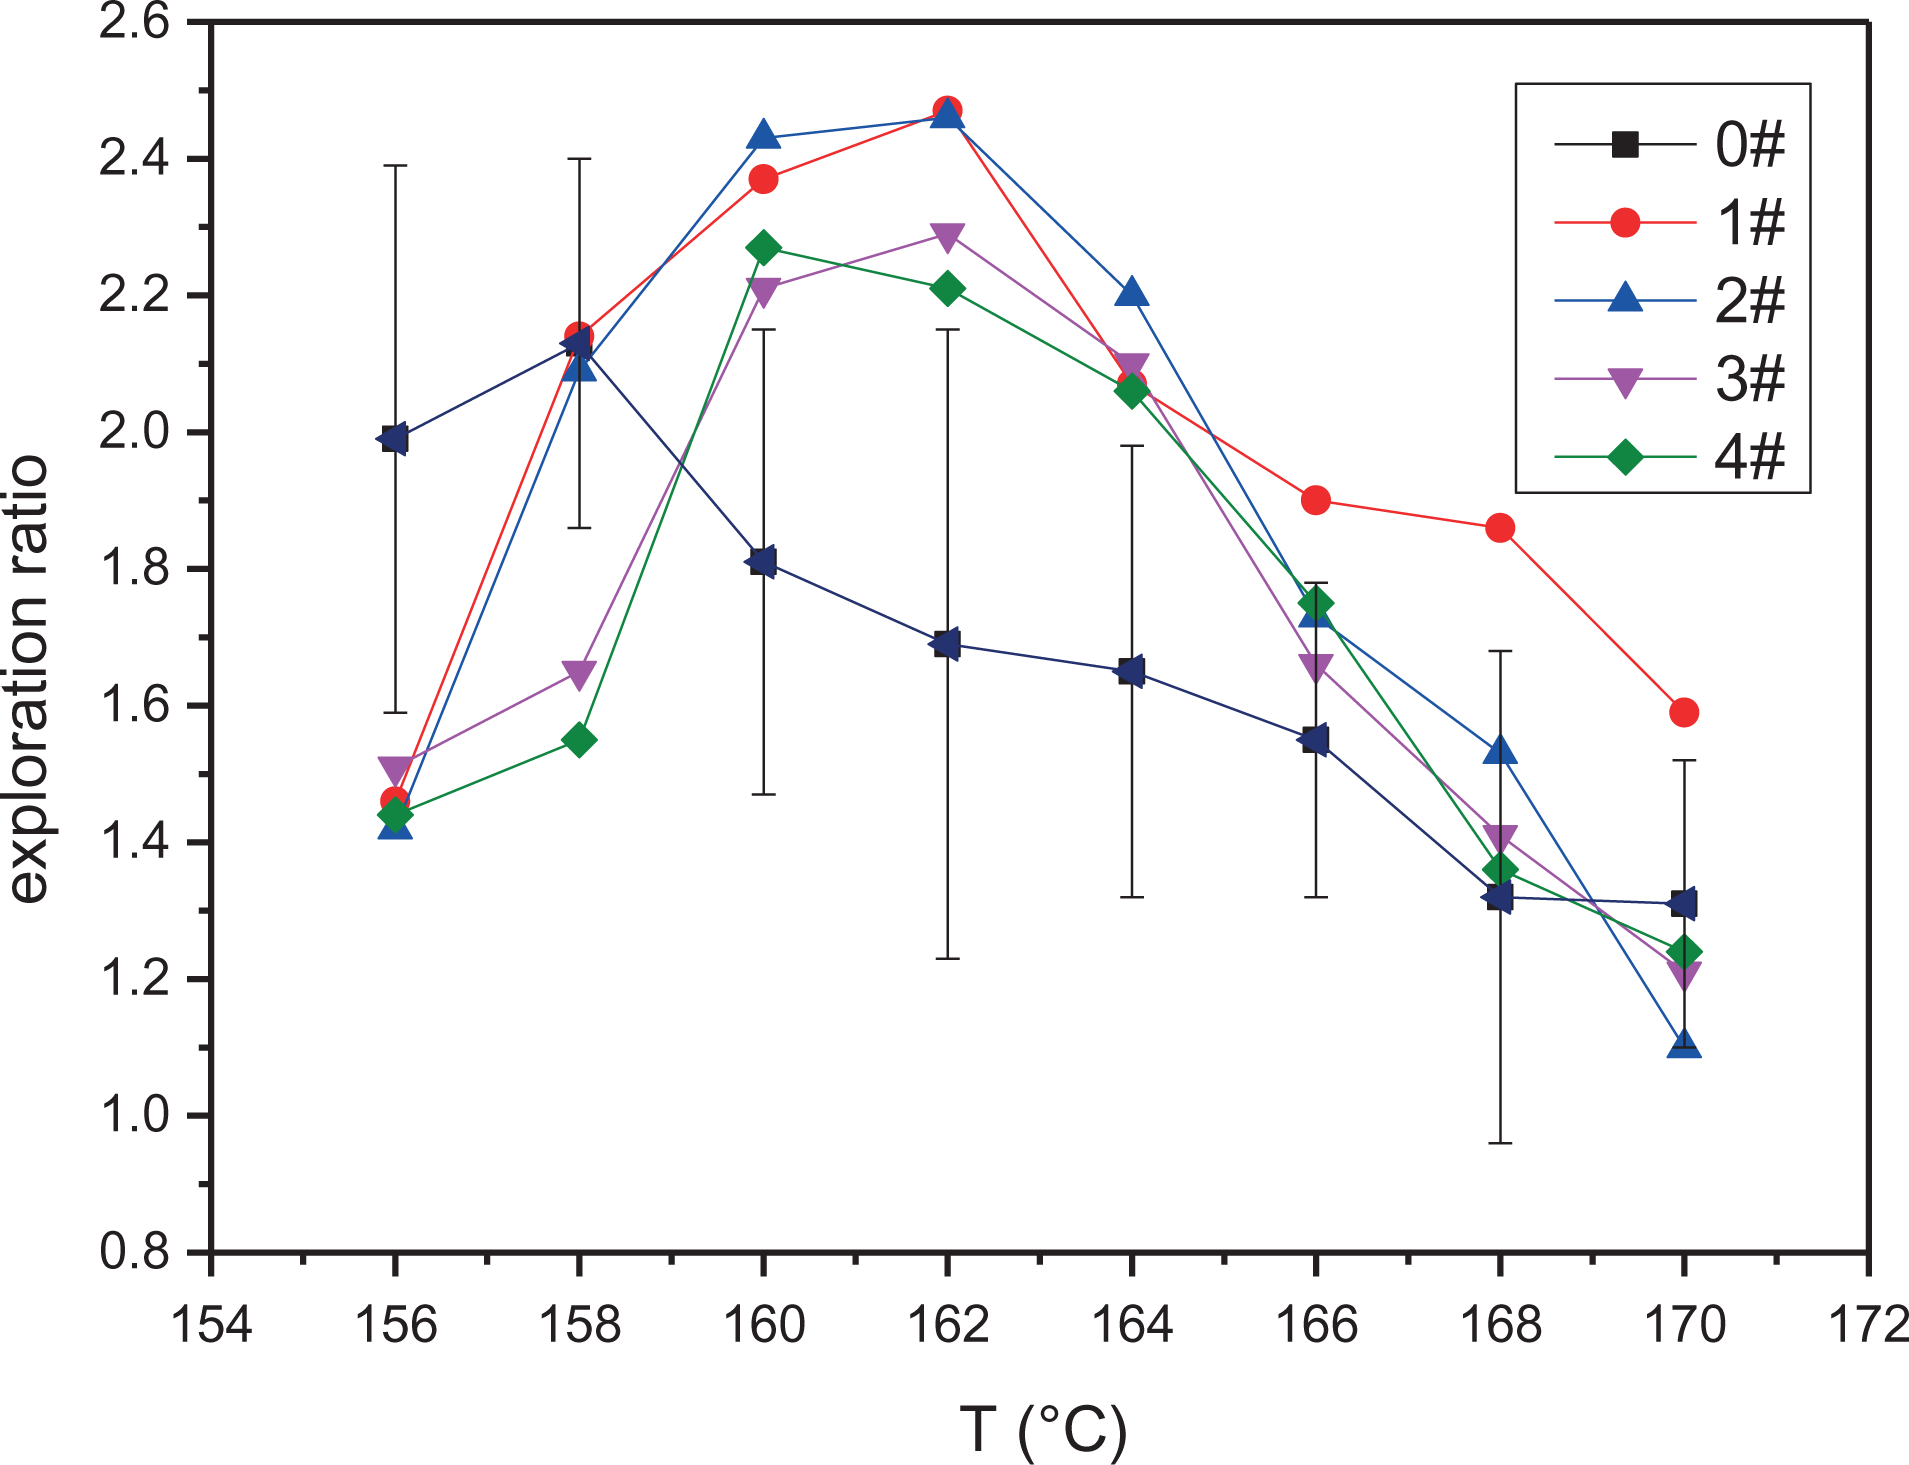
The foaming expansion ratio of samples with different PTFE content.
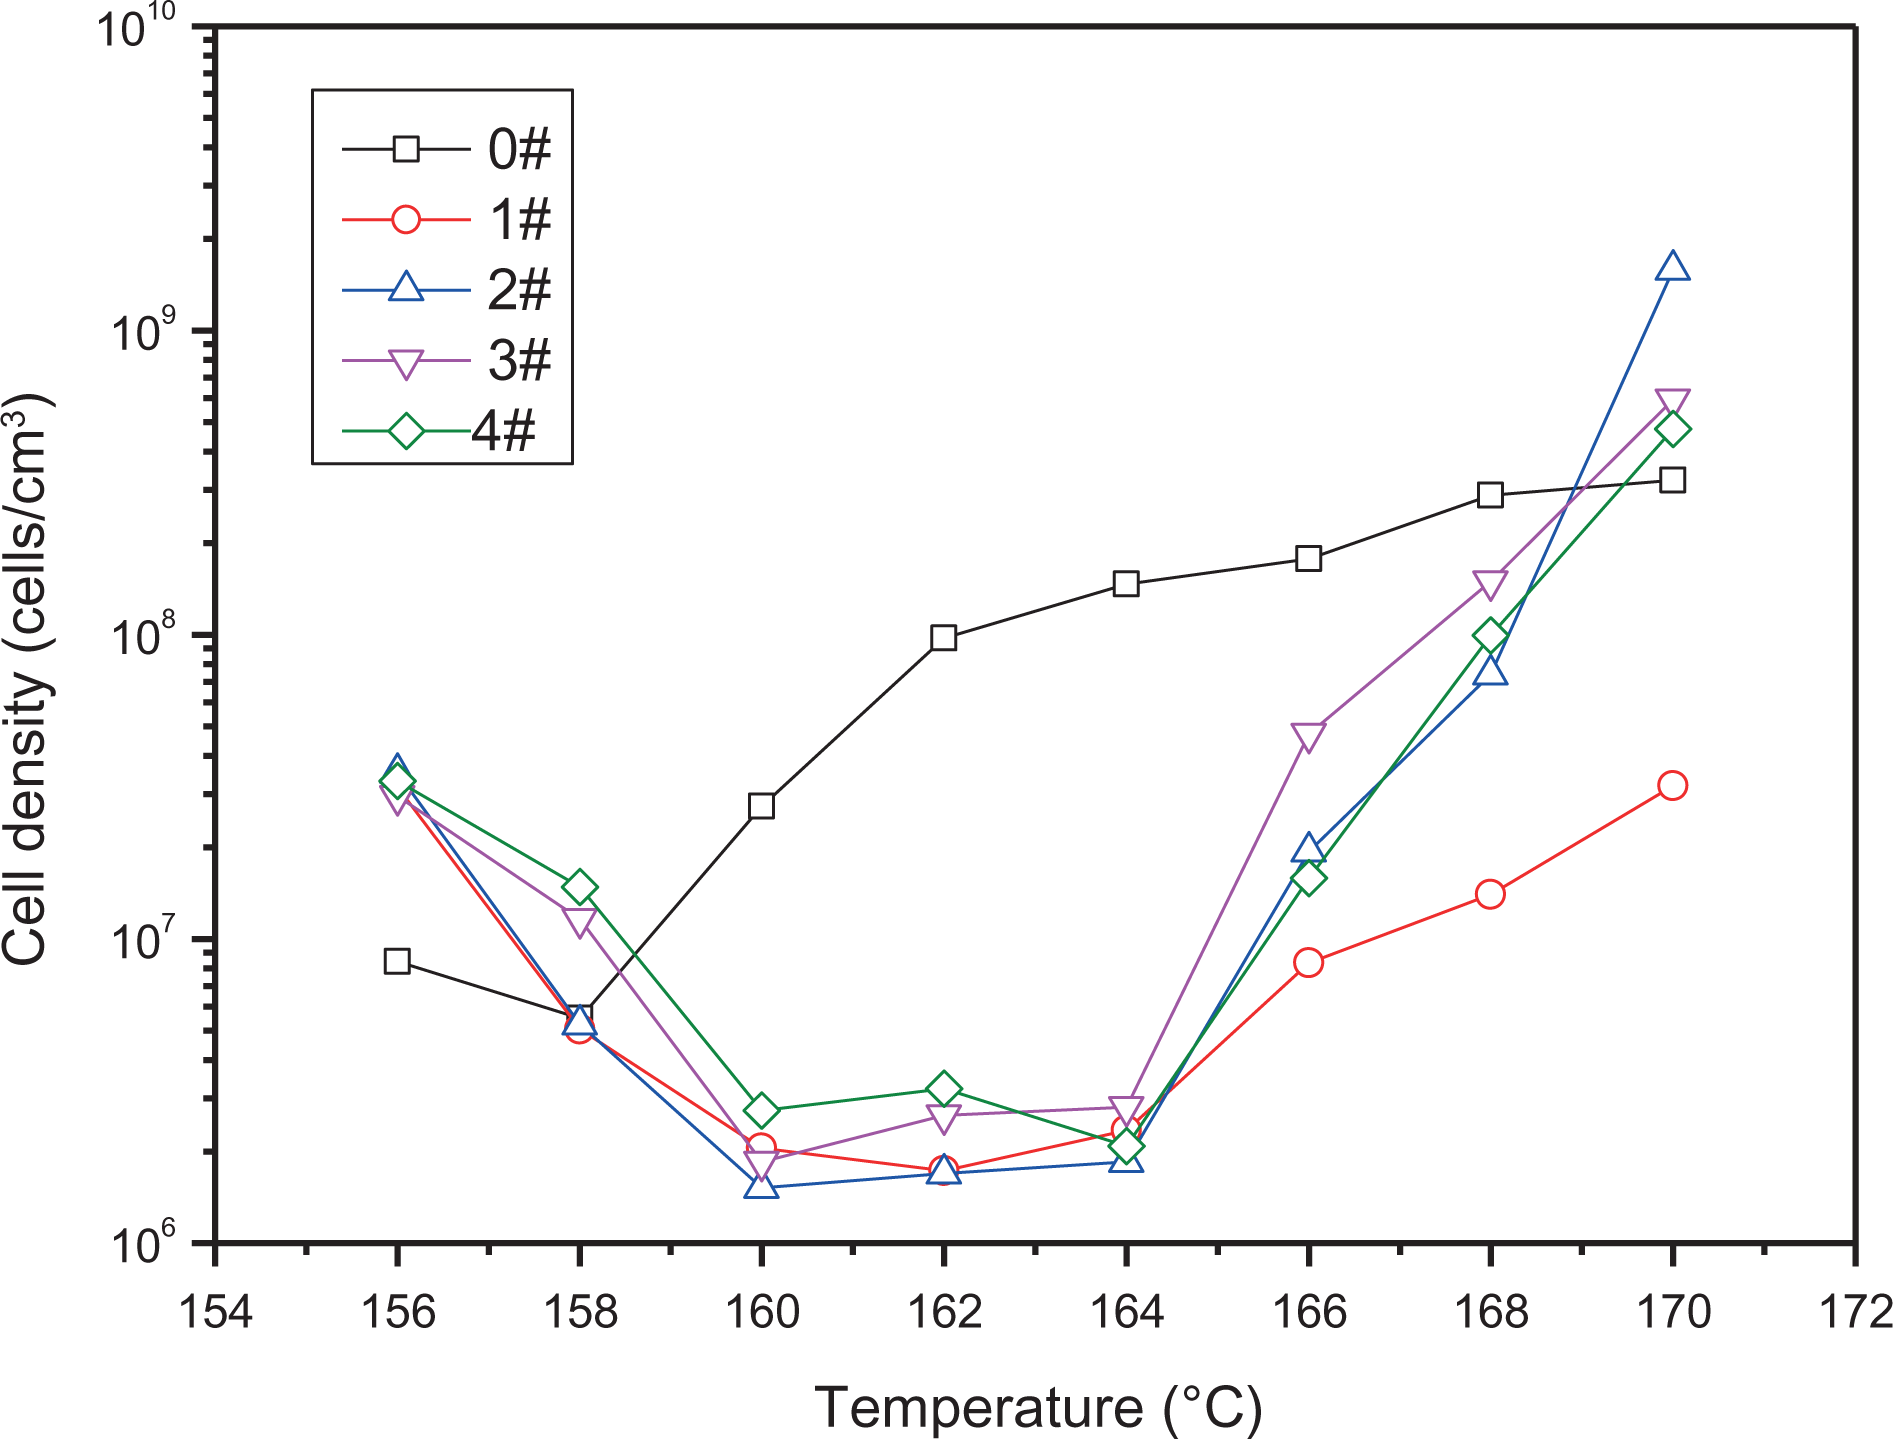
The foaming cell density of samples with different PTFE content.
It can be seen from the SEM images of Figure 15, the 1# and 2# samples are obviously better than the 3# and 4# samples because the fibers diameters of 1# and 2# are smaller than 3# and 4#. Fine fibers are more likely to form a physically entangled network structure, which can better serve as a skeleton to improve the melt strength of the material. As shown in Figure 13, the temperature at which iPP can be foamed is only about 3°C. It is basically impossible to control in industry. The foaming temperature window of the microfiber composites added with PTFE expanded to about 6°C that makes it possible to control the foaming.
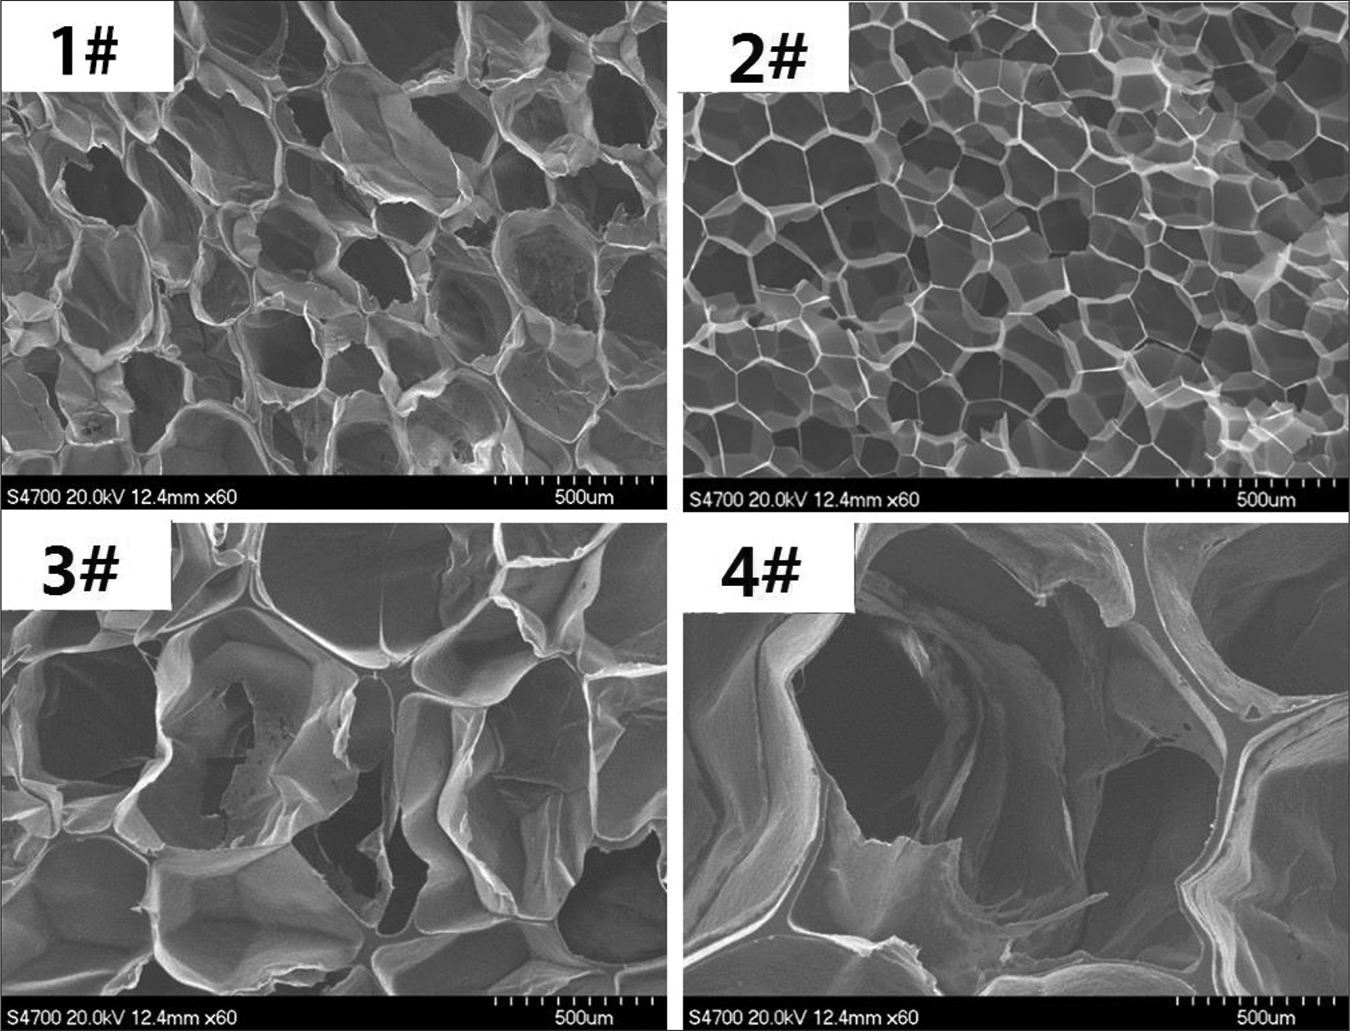
The morphology of foamed samples.
Conclusions
The shear rate of iPP/PTFE composite was studied in this article. It was found that proper shear rate is beneficial to the fibers formation of PTFE. In the upstream of the screw, the shear strength is needed to make PTFE fully deformed into fiber shape. In the middle and downstream of the screw, the shear field is no longer needed. It should be mainly stretched, so that the fiber diameter decreases continuously under the action of stretching, eventually forming uniform and fine fibers. From the SEM images, it can be seen that fine fibers can form network structure, which has a good effect on improving the rheological properties of the materials.
The study shows that addition of 20%PTFE is beneficial to the formation of small diameter fibers. If the content is too low, the probability of collision and extrusion is very small, and the fiber is not uniform. The content is too high, the fiber will be difficult to refine evenly, which is disadvantageous to the fiber-forming effect. Fine fibers with larger length–diameter ratios tend to form physical tangled network structures, which can maximize the performance of the material. PTFE fibers can not only improve the rheological properties of materials but also increase melt strength and tensile viscosity. The increase of rheological properties of small diameter fibers is more obvious. The crystallization behavior of the matrix material also changed after adding PTFE. The melting point decreased and the crystallization temperature increased. The crystallization temperature of the microfiber composite with small diameter fiber was lower, which was beneficial to the formation of the cell.
Through the batch foaming experiment, it was found that the foaming properties of the fibers composites were improved after adding PTFE. Fibers can form a network structure, like bones in the process of foaming, this makes the bubble not easy to collapse, and the foaming expansion ratio increased. Especially, the foaming temperature-window of iPP expanded to 6°C, and we can control the foaming process easily. The addition of PTFE and in situ fiber formation improved the foaming ability of iPP.
Footnotes
Declaration of conflicting interests
The author(s) declared no potential conflicts of interest with respect to the research, authorship, and/or publication of this article.
Funding
The author(s) disclosed receipt of the following financial support for the research, authorship, and/or publication of this article: This work was financially supported by grant from the National Key Research and Development Program of China (No. 2016YFB0302203).