
Abstract
In this work, microcellular acrylonitrile-butadiene-styrene foams were developed with utilization of water as a co-blowing agent and CO2 as the primary blowing agent through the solid-state batch foaming process. The effect of saturation parameters with the content of the co-blowing agent has been studied extensively for various foaming attributes. The co-blowing agent enhanced the average cell size and the expansion ratio which are useful for better thermal insulation. The maximum expansion ratio of 29.9 obtained from the effect of saturation temperature and co-blowing agent, 23.6 from the effect of saturation pressure and co-blowing agent, and 22.4 from the effect of saturation time and co-blowing agent. The co-blowing agent significantly affects the cell morphology of polymeric foam with saturation parameters.
Introduction
The polymeric foam is categorized as microcellular foam when the cells are produced in the polymer matrix of size less than 10 µm and the cell density in the range of 109–1015 cells/cm3. 1 The microcellular structure has evidently reported to enhanced numerous properties including energy absorption, specific strength, high impact strength and lower thermal conductivity compared to the virgin polymer and mainly it curtailed the material utilization which made product cost-effective. 2 -4 Owing to these superior properties, microcellular foamed plastics have wide range of applications: automotive as parts like dashboard, bumper and extended to aerospace and naval application; biomedical uses as tissue engineering scaffolds; construction material as insulation for sound and thermal; safety-enhancing material in helmets; furniture fabrication as cushioning; and as packaging material and as filter. 5,6 Nowadays, numerous efforts by the researchers working worldwide have been found focused towards developing the customizable microstructural attributes in microcellular plastics for fulfilling the end application’s requirements.
Acrylonitrile-butadiene-styrene (ABS) is a terpolymer composed of three different monomers that can often meet the property requirement at a reasonable cost. ABS has good toughness, stiffness, impact strength, heat stability, chemical resistance and easy processing made it most demandable engineering thermoplastic. 7 -9 Due to the amorphous nature of the polymer matrix, the blowing agent easily dissolved in ABS leads to make ABS foam without much difficulty than semi-crystalline material. 10 ABS-based foam has been reported to be a good replacement for wood-based applications because of similar acoustical properties along with the excellent nail, screw and staple holding ability. 11
In general, microcellular plastic can be manufactured through the continuous process such as extrusion foaming, injection mould foaming or non-continuous process such as batch solid-state foaming process. 1,12 The process named as solid-state batch foaming due to two factors as state of the sample (solid-state) and the nature of the process (non-continuous/batch). Although the methods of foaming are different in different techniques, the principle of foaming is the same and it involves four steps: blowing agent dissolution and sample saturation, cell nucleation, cell growth and cell stabilization. In the first step, the blowing agent dissolves in the polymer matrix due to its chemical affinity until the saturation condition reached which formed a saturated gas/polymer matrix. The second step is cell nucleation which was initiated due to the generation of thermodynamic instability. The thermodynamic instability caused either by a sudden increase in temperature or by a rapid decrease in pressure, which leads to cell nucleation. In the third step, nucleated cells grow over a period of time due to thermal interchange. And in the fourth step, the generated cell structure stabilized by immersing the foamed sample in cool media like water. There are two distinct techniques in solid-state batch foaming, one is pressure-induced (single stage) and the other is temperature-induced (two-stage). The major difference between these techniques is cell nucleation in pressure-induced due to the rapid drop in pressure, while in temperature-induced due to the sudden increase in temperature. 1,13 -17
Also notably, physical blowing agents are mostly preferred than chemical blowing agents (CBAs), due to the adverse effect of CBA on the environment and it left residues. The CO2 is the most frequently used blowing agent due to its environment-friendly nature, low cost, high solubility in polymer and easy availability. 18 The solubility of the blowing agent plays a vital role in the foaming process and significantly affects the cellular foam structure to be produced. The CO2 acts as a plasticizer which leads to a decrease in the viscosity, glass transition temperature and melting temperature. 6,19 -22
The dissolution of CO2 in most of the polymers is less compared to the hydrofluorocarbons (HFCs)/hydrochlorofluorocarbons (HCFCs). 23 To enhance foamability, the utilization of the co-blowing agent with CO2 has been experimented by various researchers. Some of the researchers worked using co-material with primary material (i.e. blending of two polymers) to produce the complex cellular structure. 24 -26 Table 1 represents the literature on microcellular foaming using the co-blowing agent.
Literature on microcellular foaming using co-blowing agent.
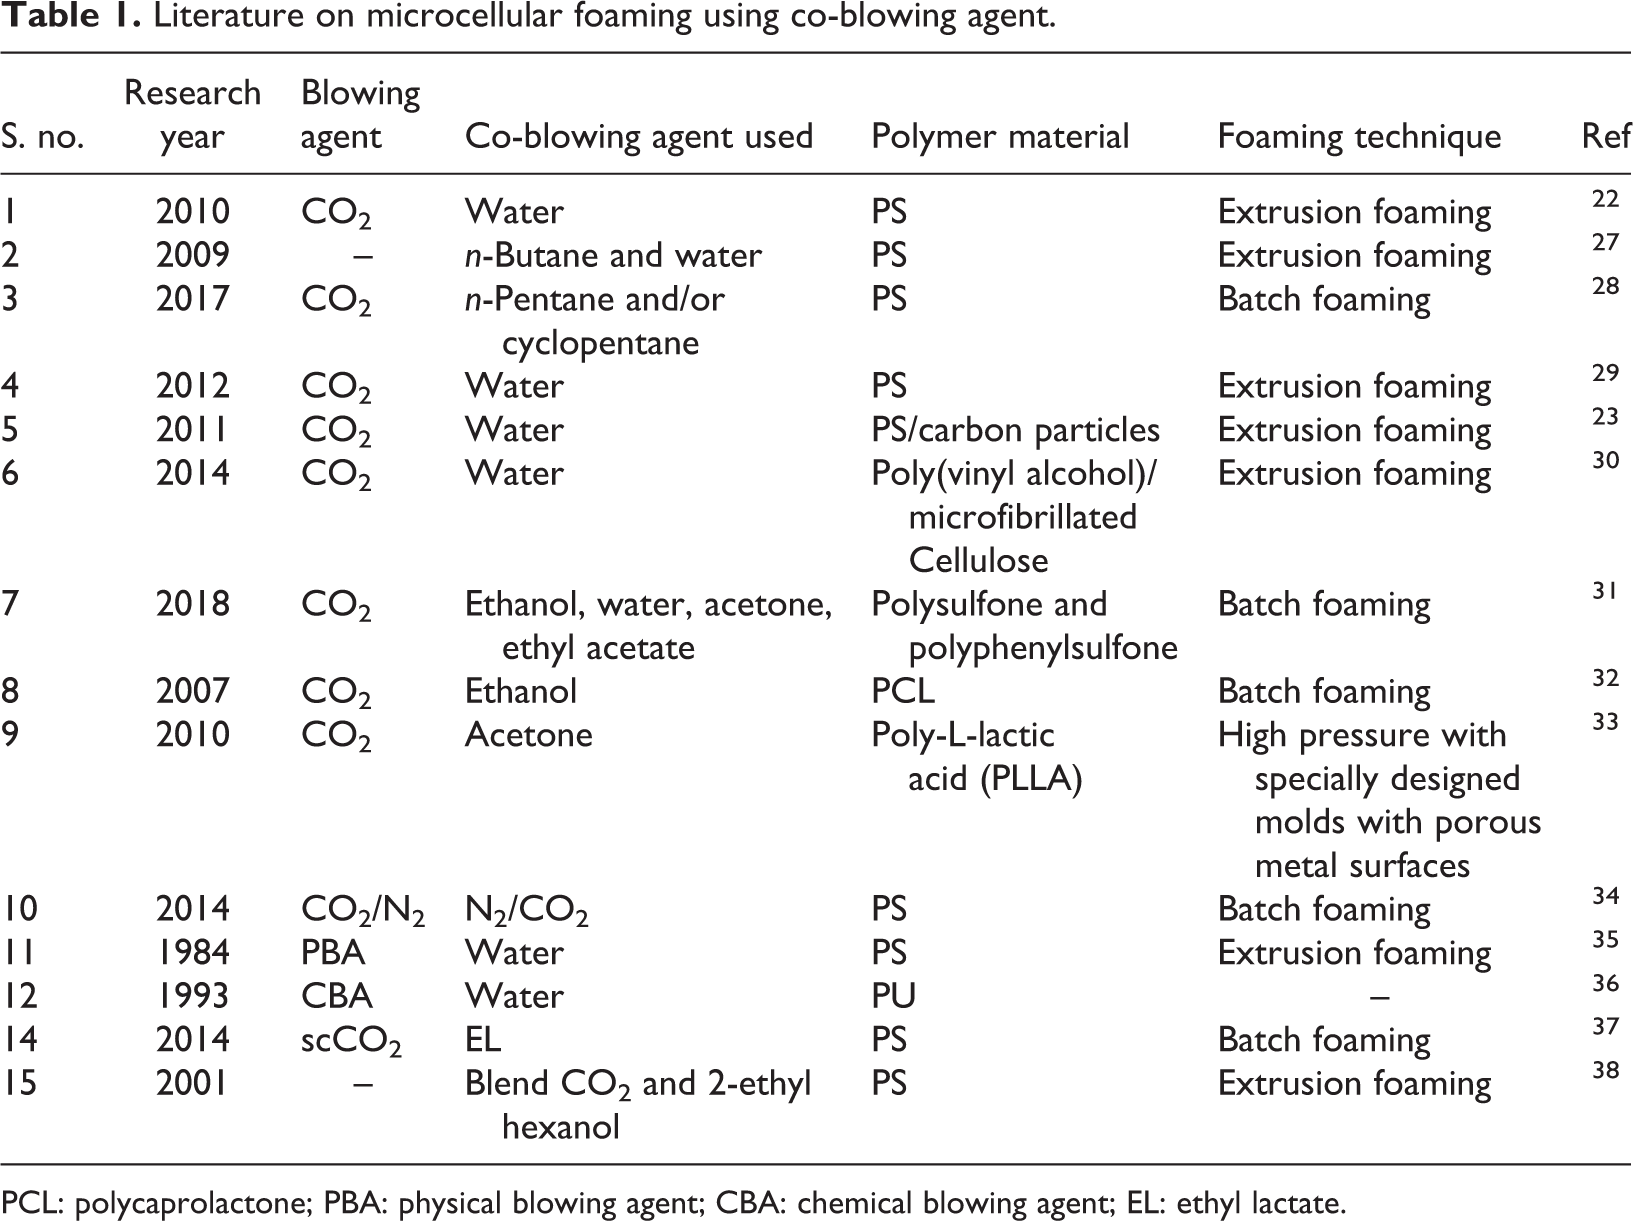
PCL: polycaprolactone; PBA: physical blowing agent; CBA: chemical blowing agent; EL: ethyl lactate.
Among the several co-blowing agents such as alcohol, ketone, water and nitrogen, water has more advantages as easy availability, low cost, non-toxic and very high heat capacity. 39 After ethanol, water has good interaction and compatibility with CO2 due to its interaction energy of about 11.56 KJ/mol. 31 The interaction energy between the additives and polymer chain is more than that of between the pure CO2 and polymer chain. The water has very less solubility in polymer about 0.5 wt%, thus the possibility of water to be dissolved in the polymer matrix is negligible. 27 The presence of water causes the even distribution of heat inside the chamber which leads to swelling of the sample by reducing the intermolecular cohesive forces as polymer chain flexibility increases mean enhancement of the plasticization. 40,41 The plasticization effect obtained by either using the diluent effect or heating the material above the glass transition temperature. 15 In our case, the plasticization effect achieved by three aspects as (1) selecting temperature range above the glass transition temperature of ABS, (2) use of primary blowing agent, CO2 and (3) use of co-blowing agent, water. Both expansion ratio and cell size obtained by utilization of co-blowing agent more than by the individual CO2 which gives better thermal insulation applications. 39,42
In this work, a solid-state batch foaming technique with water as a co-blowing agent was used to manufacture microcellular ABS foam at the various levels of the different processing parameters to evaluate its morphological attributes. This work to evaluate the effect of water content along with the foaming parameters like saturation temperature, saturation pressure and saturation time on cell morphology. The resulting outcomes of the foam evaluation were in terms of the expansion ratio and cell morphology as cell density, cell size and cell structure.
Experimental
Material
In this work, ABS terpolymer (LG Chem, HI121H grade) was utilized as the base polymer for the study. The considered values of density and melt flow index were 1.04 g/cc and 23 g/10 min (at 220°C and 10 kg), respectively, which were mentioned in a specific data sheet provided by the supplier. The CO2 with 99% purity and tap water was used as received throughout the experimentation as a blowing agent and a co-blowing agent, respectively.
Manufacturing of ABS sheet
The polymer sheets were prepared from ABS granules using a compression moulding machine (M/s HEMCO Corporation, Mumbai, India) of the thickness of 1.65 mm. The dimension of the specimens was 30 × 20 mm2. The compression moulding parameters such as mould temperature, 220°C; time, 7 min; and force, 1510 N were used for ABS sheet preparation.
Methodology for foam preparation
The lab set-up used for the development of ABS microcellular composite foam is depicted in Figure 1. The solid-state batch foaming technique was applied to form the microcellular ABS foamed samples using the autoclave vessel having the capacity of 1 L. As in this study, the two blowing agents, CO2 and water, were used and their content mentioned in terms of volume fraction (vol%). The water content varies as 0, 15, 30, 45 and 60 vol%. The ratio of blowing agent is vol% of CO2 divided by vol% of water which is given as 100:0, 85:15, 70:30, 55:45 and 40:60. The first autoclave vessel was filled with defined water content and placed a plastic sample in the vessel. After that pressurized it with CO2 gas and heated it to the desired temperature and kept it for a defined period. Subsequently, the autoclave vessel was depressurized to the atmospheric pressure and taken out the foamed ABS sample from the vessel. Finally, the autoclave vessel cooled in water for generated cell structure stabilization. The water inside the autoclave vessel, at various conditions of temperature and pressure, remains in the liquid state. The National Institute of Standards and Technology Steam Table (NISTIR 5078) was used to check the state of water. From the steam table, saturation temperature T sat and saturation pressure P sat were calculated and compared with the defined saturation temperature and saturation pressure.
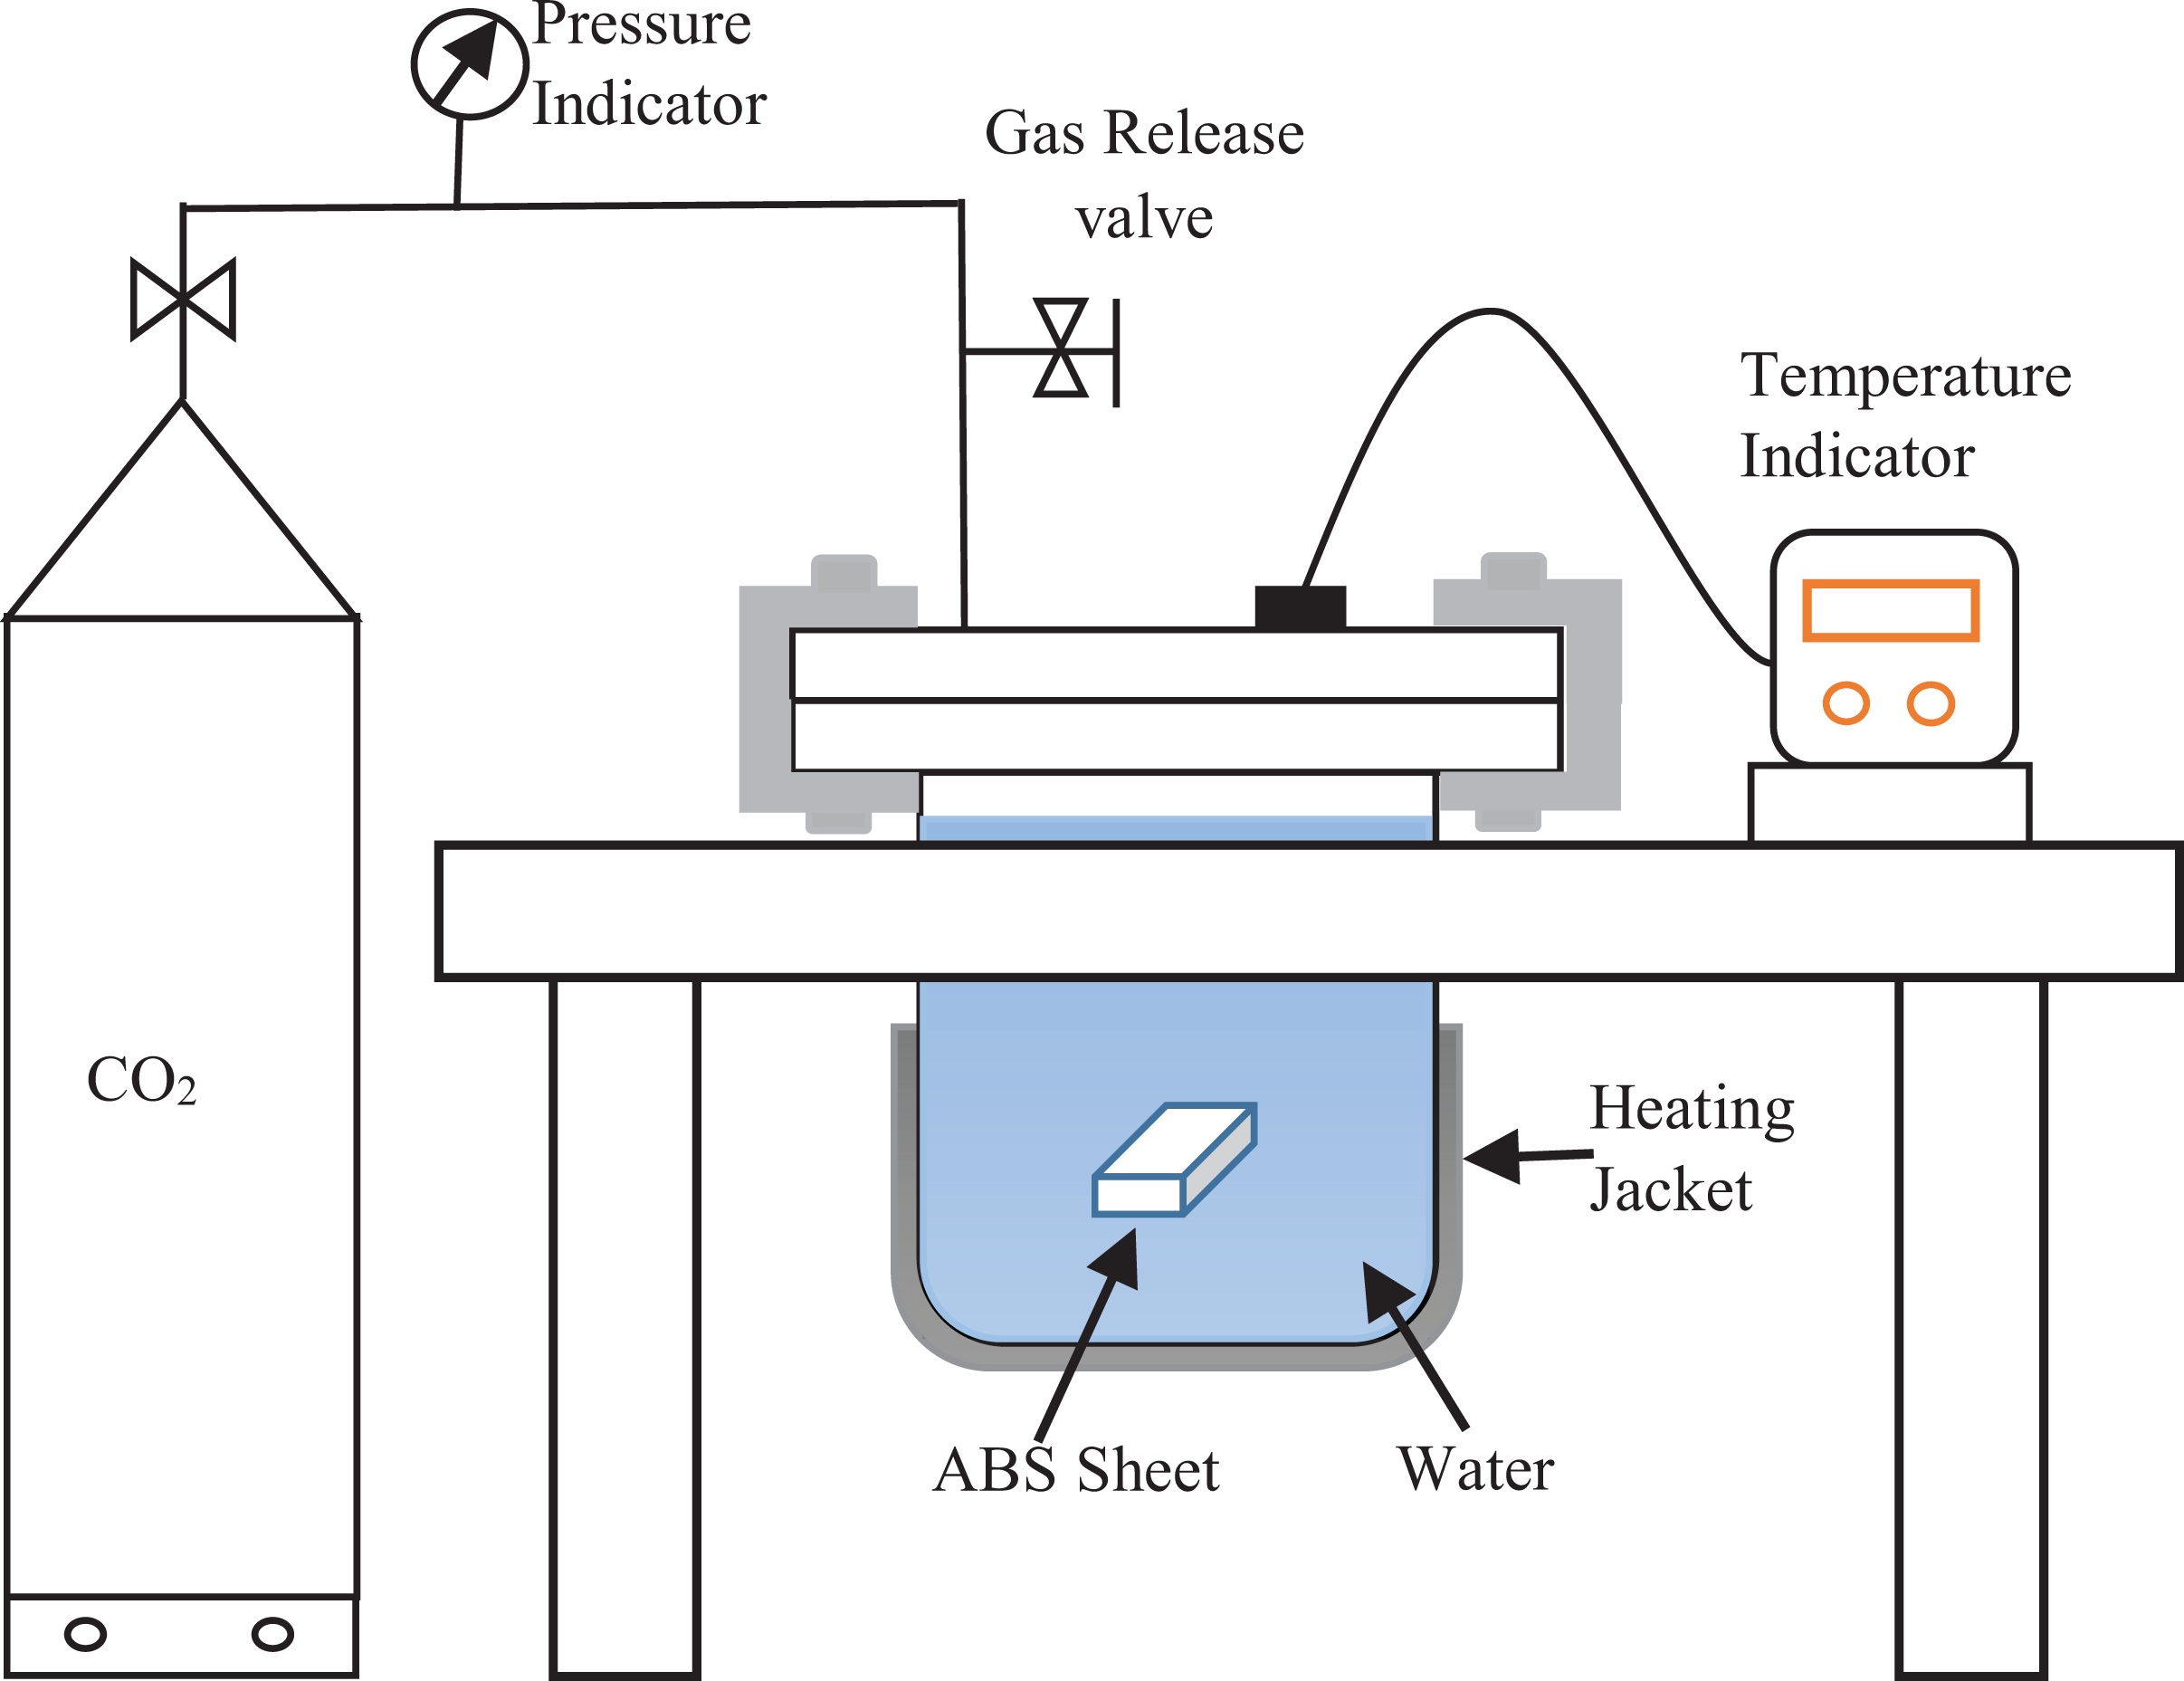
Schematic of lab setup for solid state batch foaming apparatus.
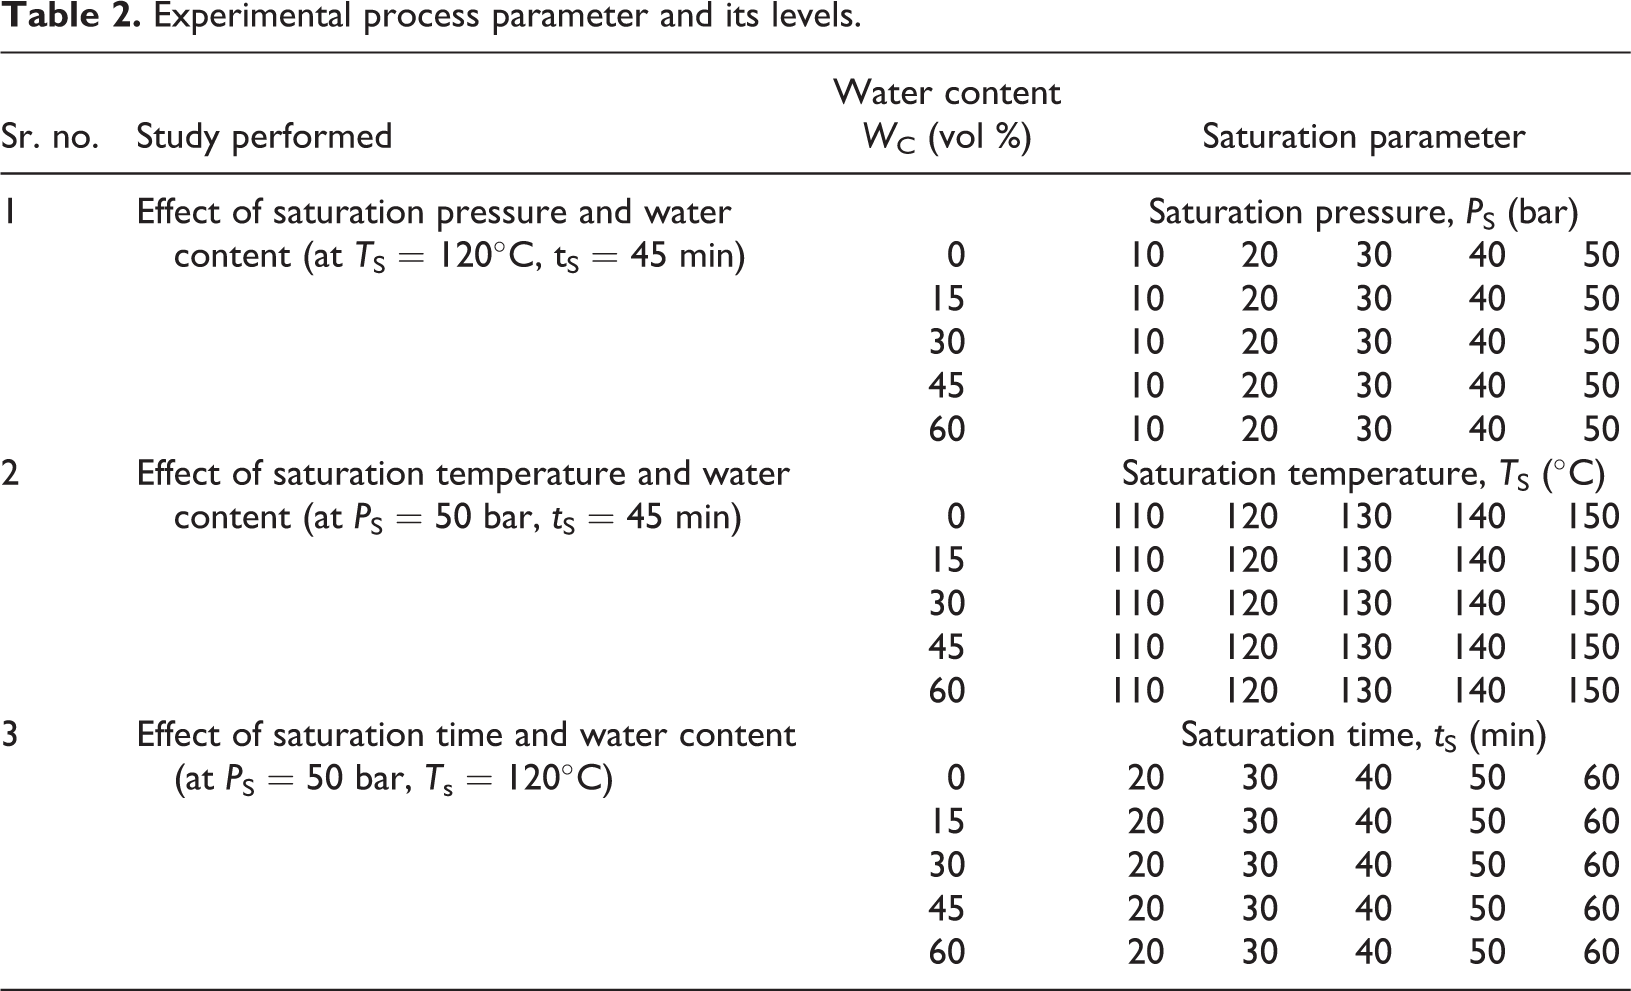
Table 2 depicts the details of the experimental studies that were performed to evaluate the response of each process parameters over the wild range of levels for its effect on foam attributes.
Experimental process parameter and its levels.
Characterization of foam
Morphological characterization
The foamed samples were dipped inside liquid nitrogen for 5 min and then were cryogenically brittle fractured. The fractured surface was gold sputter coated and subsequently analysed under scanning electron microscope (SEM; COXEM, EM-30AX, South Korea).
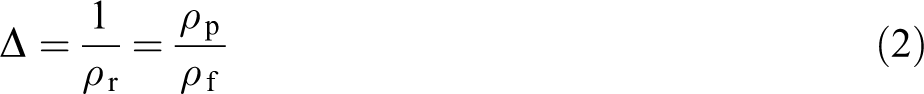
Expansion ratio (Δ)
The ratio of the volume of foam formed to the volume of polymer used is termed as relative density. Expansion ratio (Δ) is reciprocal of relative density. Equation (2) used for the calculation of expansion ratio of the specimen as equation (1):

where
The density of samples was measured according to ASTM D-792 and the weighing balance used for that was Wensar – MAB-220 (Chennai) with the least count of 0.1 mg.
Cell density (N o)
Cell density is defined by the number of cells per cubic centimetre of the foamed polymer. Equation (3) used for the calculation of the cell density. 1 The area ‘A’ consider in the centimetre square thus magnification factor has not multiplied with the number of cells ‘n’ the equation given as:
where N o is the cell density, n is the total number of cells in the SEM micrograph, M is the magnification factor and a is the area of micrograph (cm2).
Average cell size (D v)
The volumetric average cell diameter calculated for each cell considering each has cellular structure from the following equation 43 :
where n is the number of cells in the SEM micrograph and di is the diameter calculated from the perimeter of the cell.
The value of cell size directly extracted from the SEM micrograph using the Image J software (Software Version-ImageJ 1.52d; Java 1.8.0_202). The number of cells present in the micrograph area has been considered for the calculation of cell size. The Image J software considers the overall area of the SEM micrograph and detects the perimeter of each cell presents within the micrograph. And from the perimeter of the cell, the diameter was calculated for each cell. Then, using equation (3), the average cell size was calculated.
Result and discussion
Effect of saturation pressure and water content on the expansion ratio and cell morphology
In this study, the effect of saturation pressure and water content was investigated at constant saturation temperature and saturation time of 120°C and 45 min, respectively. Figure 2 depicts that at the initial levels of saturation pressure, that is, at 10 and 20 bar, significant foaming was not observed. This could be due to the more nucleation barrier results in the significant amount of cells not nucleated. 44
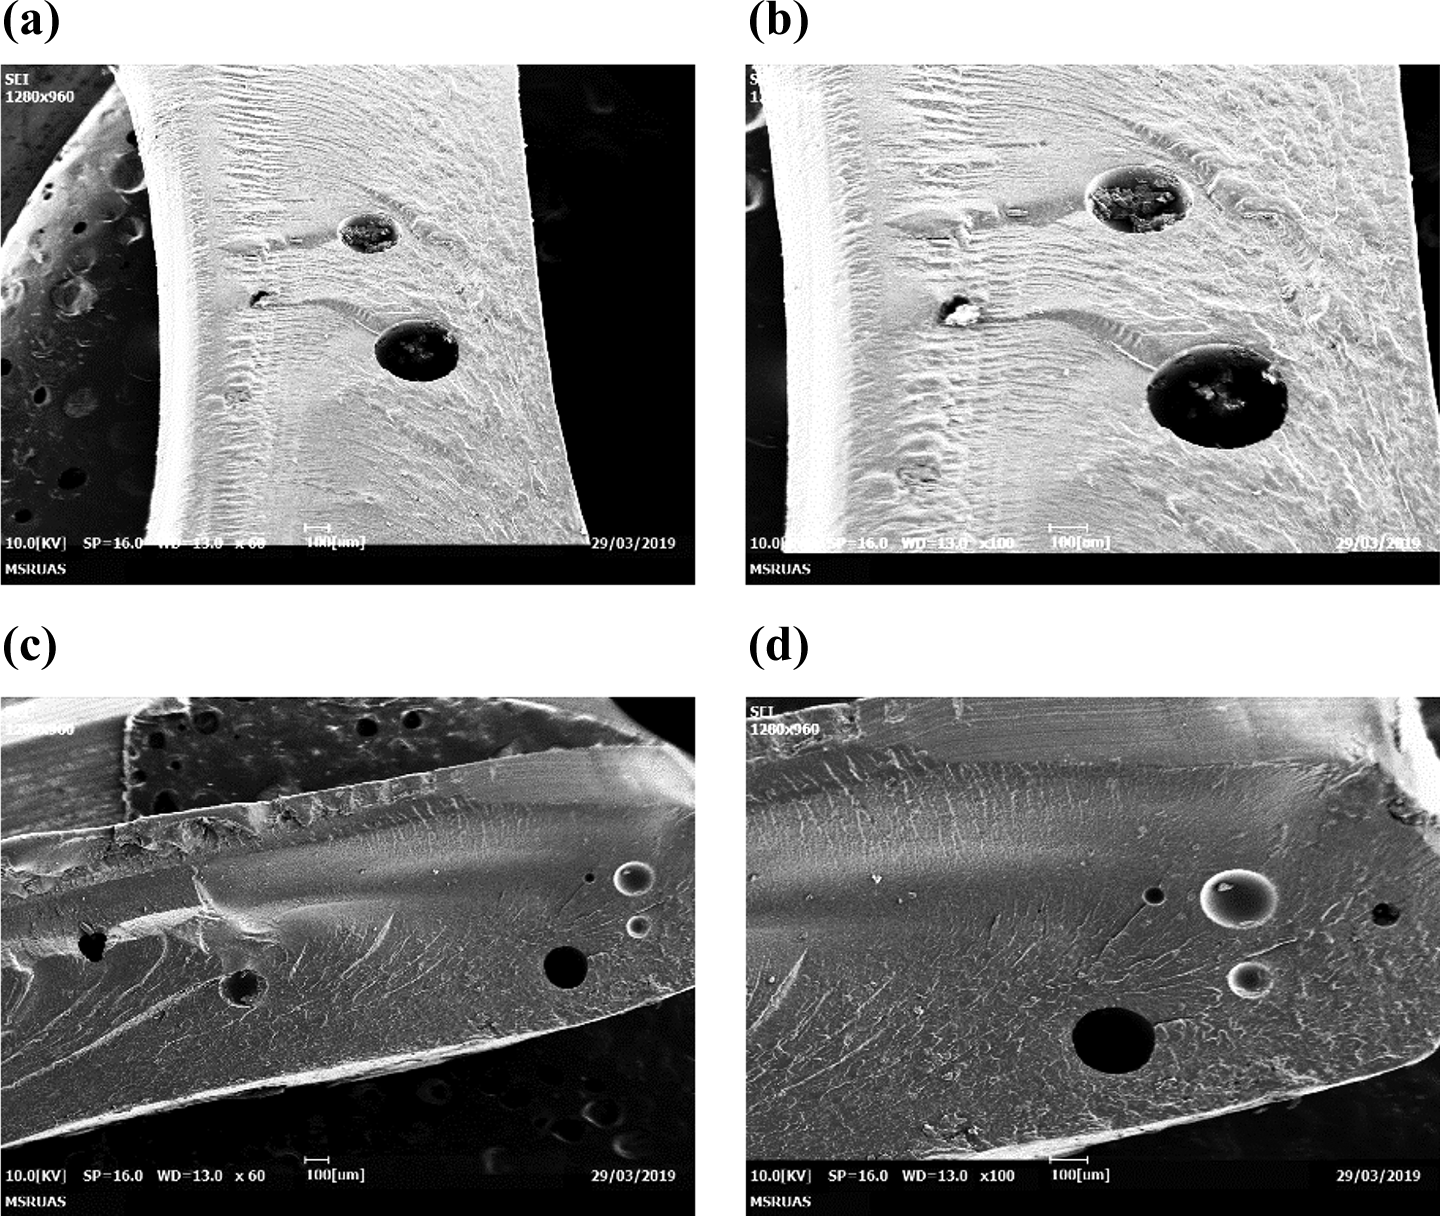
SEM micrograph at W C = 60 vol%, T S = 120°C and t S = 45 min. (a) P s = 10 bar, 60×; (b) P s = 10 bar, 100×; (c) P s = 20 bar, 60× and (d) P s = 20 bar, 100×.
The experimentation was done at various levels of saturation pressure with different water content. Figure 3 shows that the expansion ratio escalates with an increase in the saturation pressure. However, at 45 and 60 vol% water content and above 40 bar saturation pressure, the expansion ratio decreased which could be due to the gas loss phenomenon from the foam surface. 45 The expansion ratio varies with water content also. The CO2 has an affinity to dissolved in the water. The water content increment reduces the availability of CO2 to dissolve in the polymer, which causes less cell nucleation and results in lower cell density. The polymer sample may be plasticized more due to the presence of water at an elevated temperature which enhanced the cell size, in turn, more expansion obtained. The maximum expansion ratio of 23.6 at saturation pressure of 40 bar and 60 vol% water content was obtained.
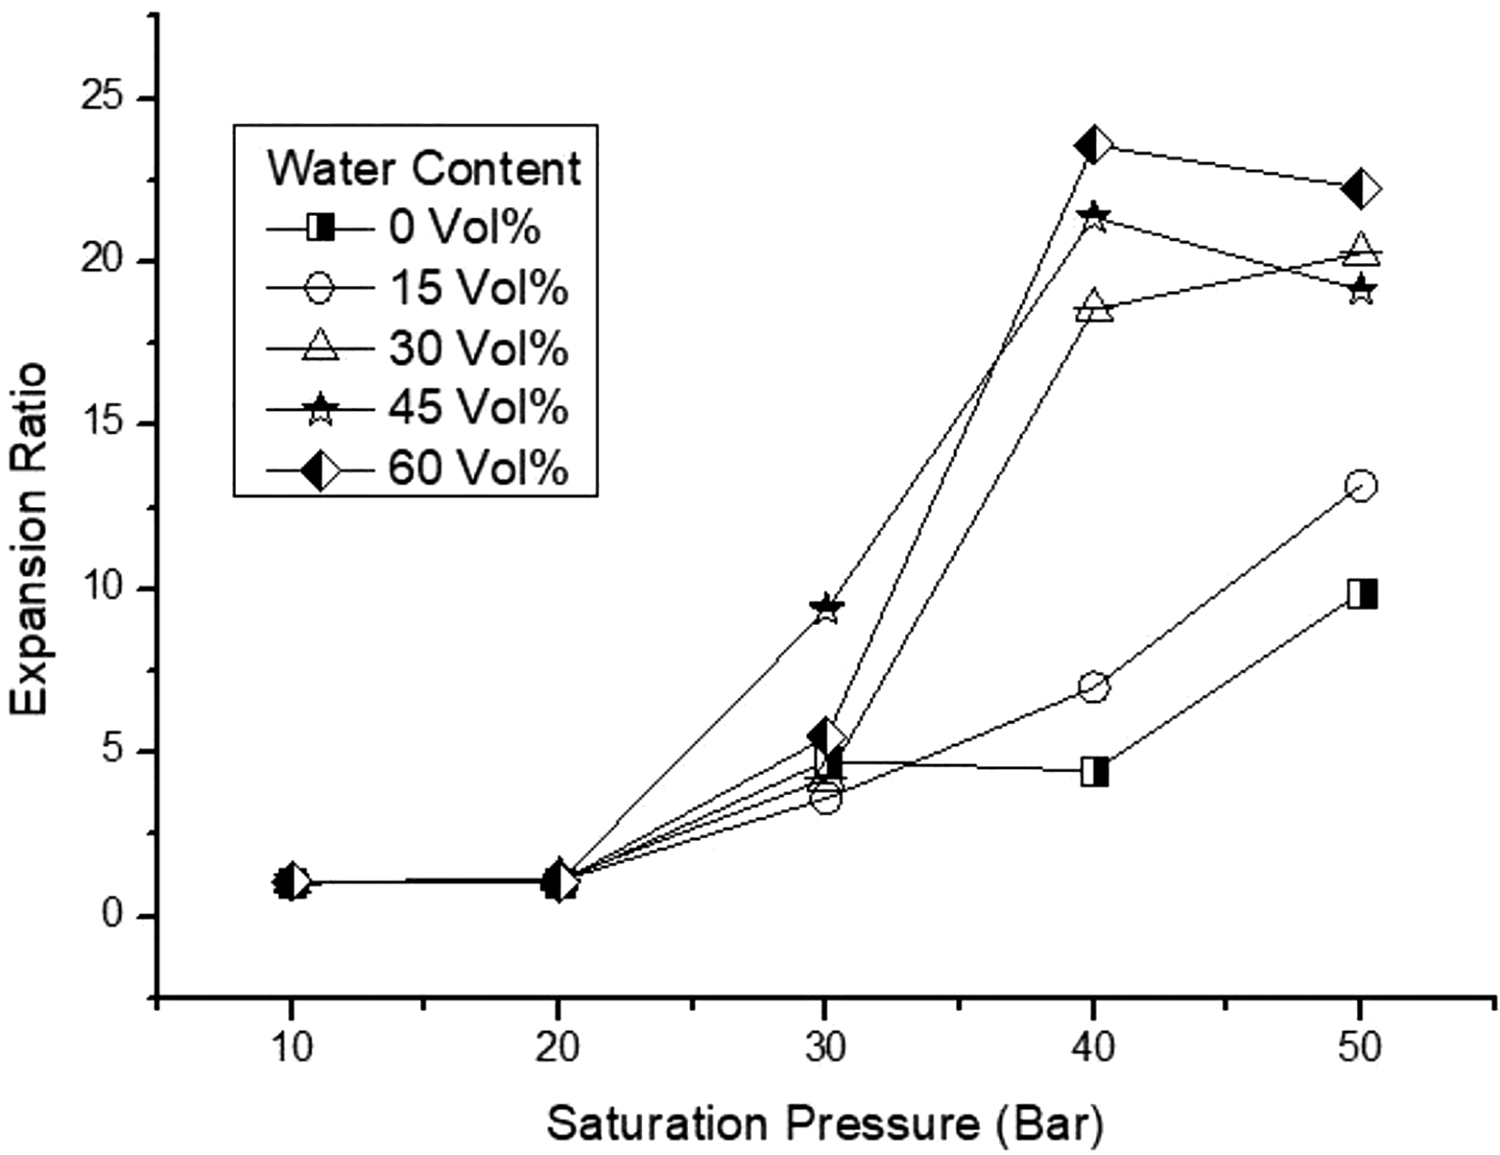
Effect of saturation pressure on expansion ratio at various co-blowing agent contents.
Figures 4 and 5 illustrate the variation in average cell size and cell density of foamed samples manufactured at various conditions. At no water content (0 vol%), the cell density increases and average cell size decreases with an increase in saturation pressure from 30 bar to 50 bar. This was the result of an increase in CO2 dissolution with elevation in saturation pressure which subsequently leads to more number of nuclei resulting in higher cell density. 46 In the case of water content from 15 vol% to 60 vol%, it was observed that the average cell size increased up to 40 bar then decreased due to the cell growth difference which was the result of the difference in plasticization effect of water and CO2.
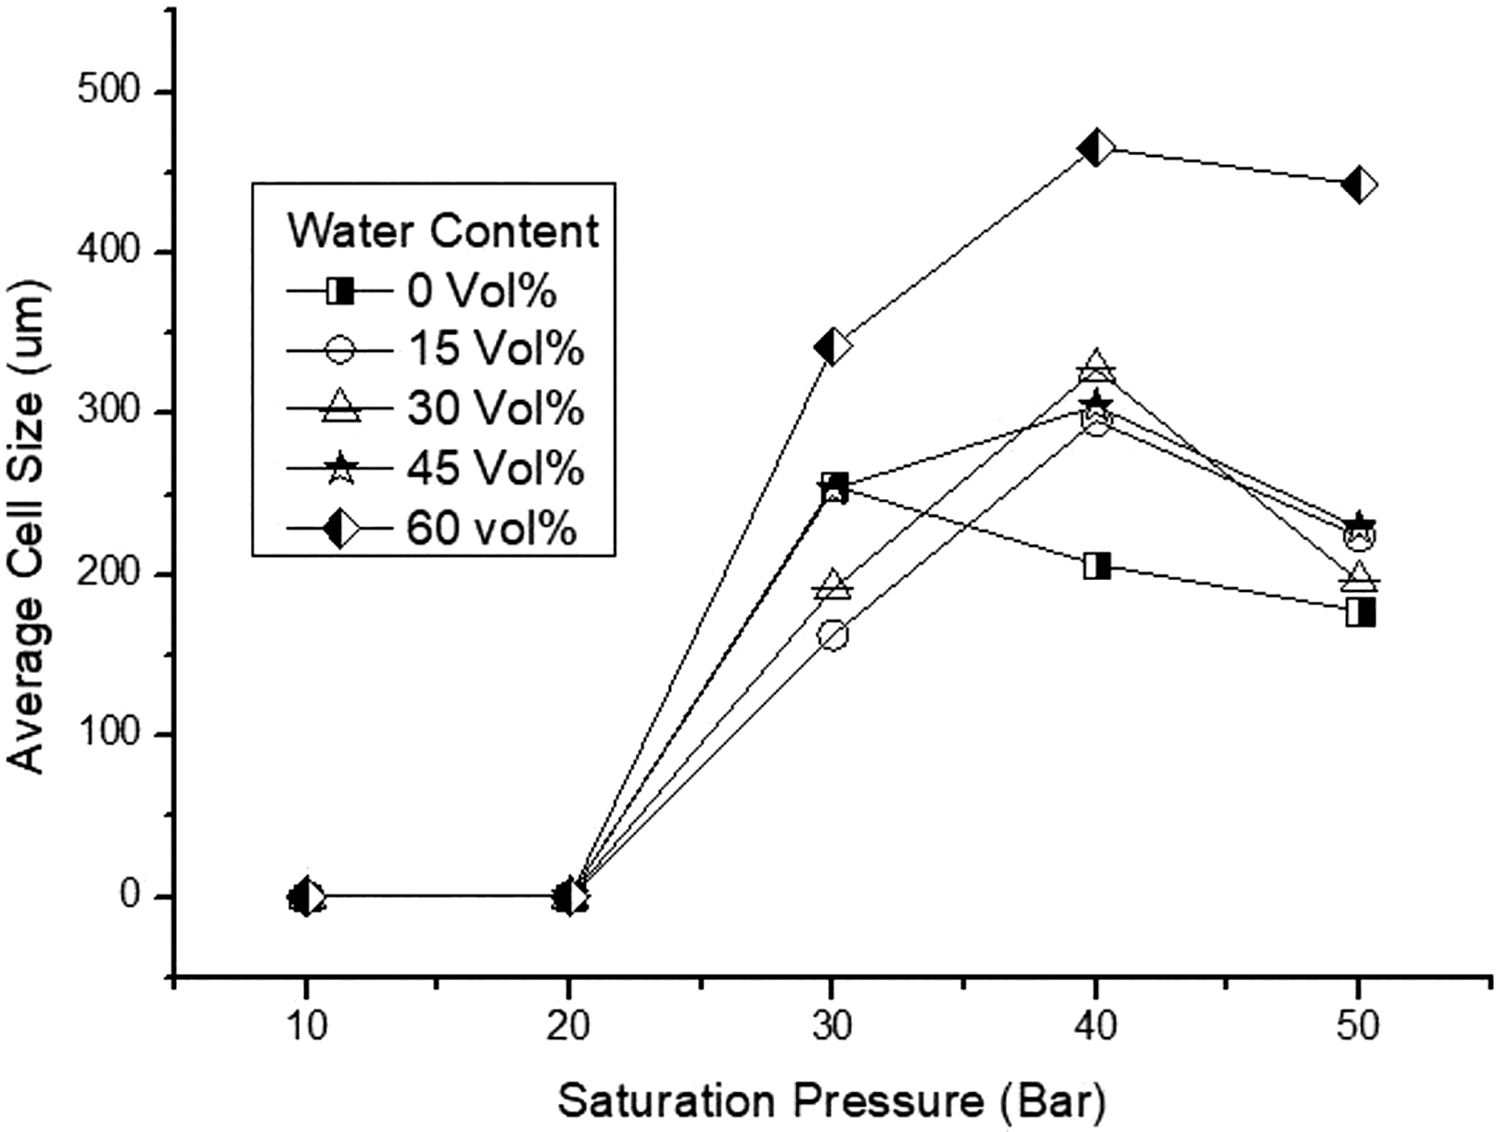
Effect of saturation pressure on average cell size at various co-blowing agent contents.
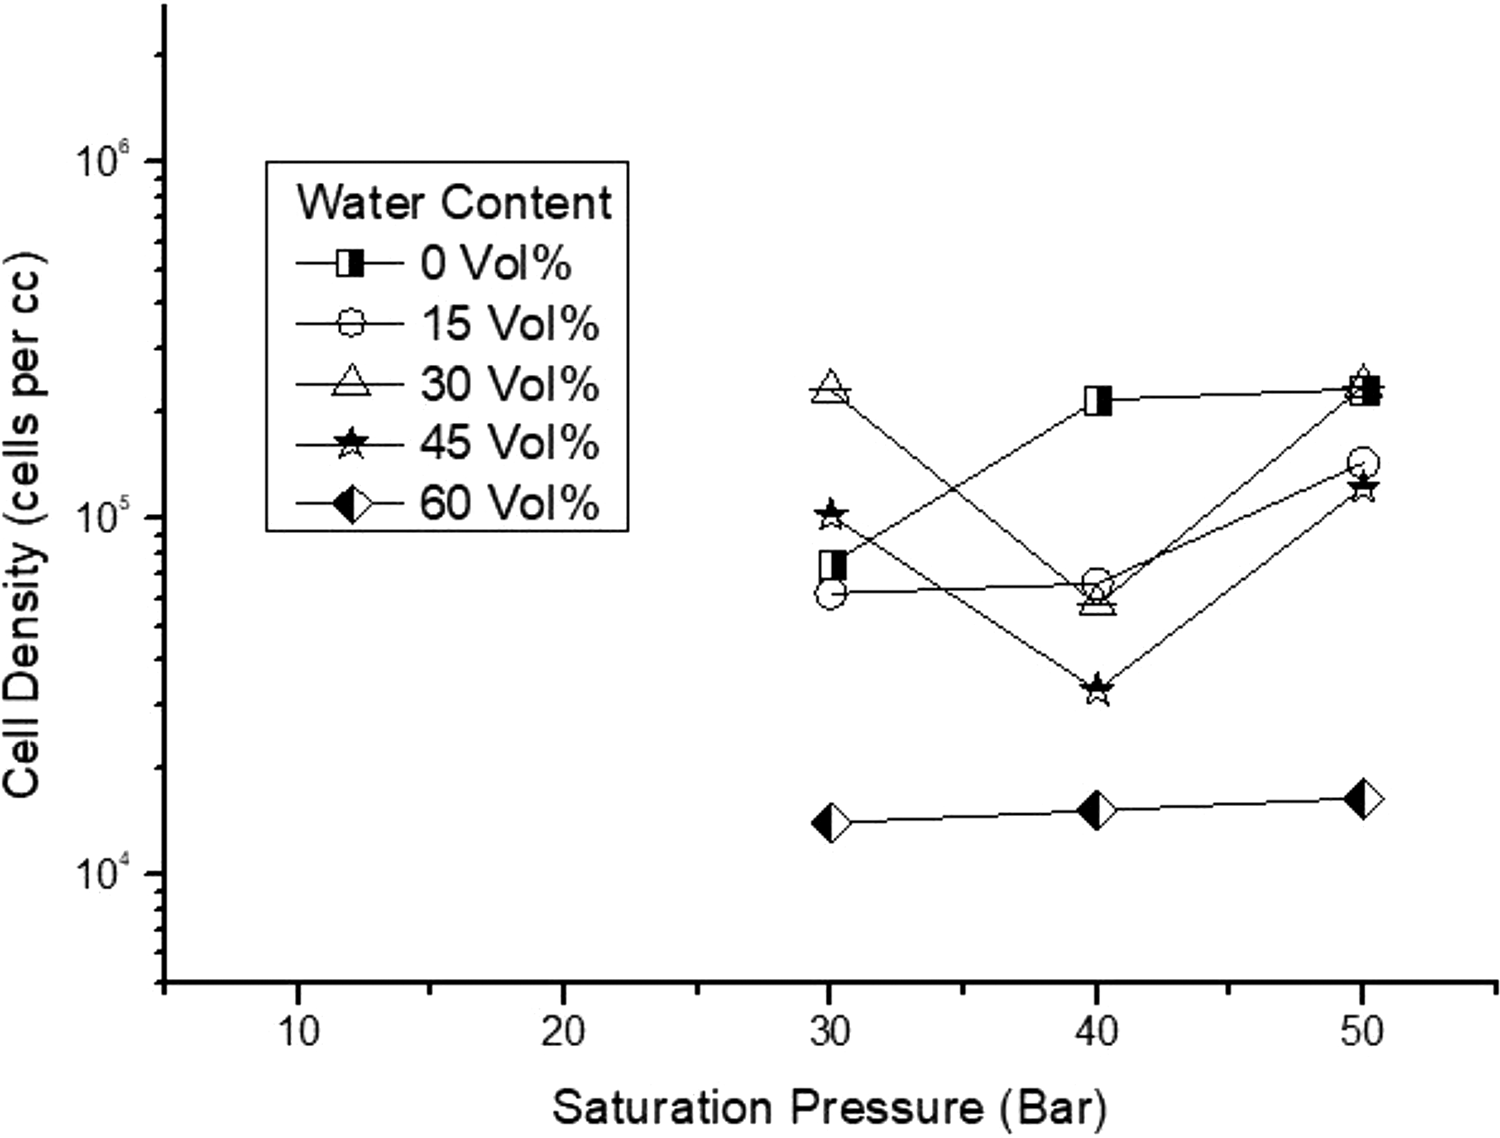
Effect of saturation pressure on cell density at various co-blowing agent contents.
Figure 6 depicts the cell morphology with a variation of pressure at no water content (0 vol%). The uniform, closed-cell structure was observed due to the absence of water. At 30 bar, polygonal cell structure with large cell size (Figure 6(a) and (b)) and above that pressure, polygonal structure with small cell size was observed (Figure 6(c) to (f)).
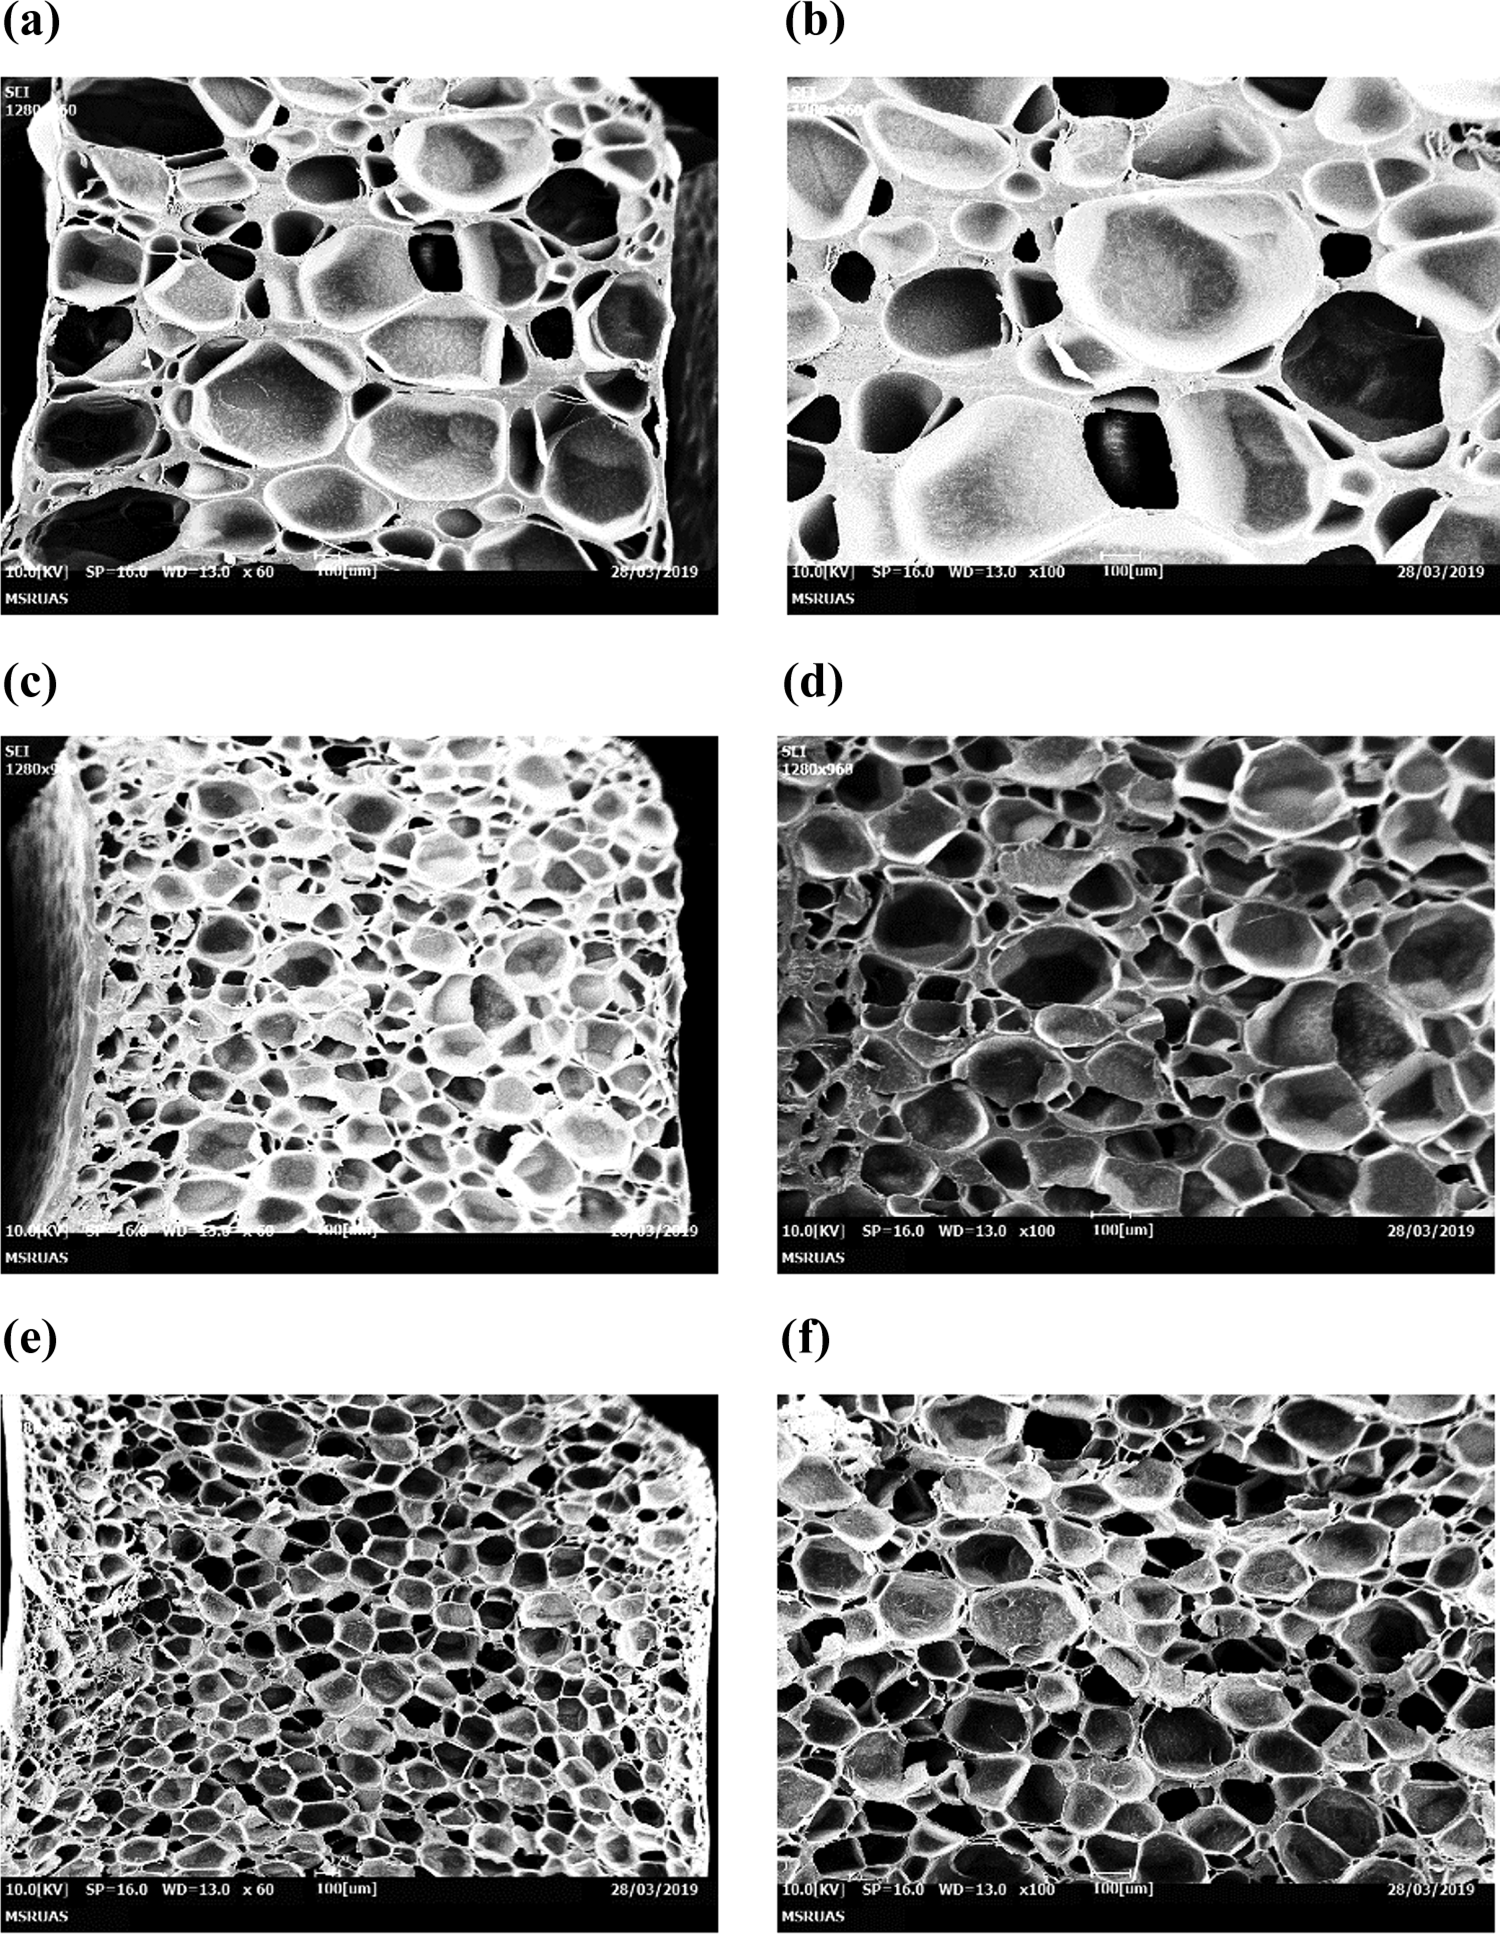
SEM micrograph at W C = 0 vol%, T S = 120°C and t S = 45 min. (a) P s = 30 bar, 60×; (b) P s = 30 bar, 100×; (c) P s = 40 bar, 60×; (d) P s = 40 bar, 100×; (e) P s = 50 bar, 60× and (f) P s = 50 bar, 100×.
Figure 7 depicts the result of 15 vol% water content with saturation pressure variation. Due to cell impingement, 47 spherical cell structure changes to polygonal structure with an increase in saturation pressure. Both large size cells and small size cells observed due to the presence of two blowing agents.
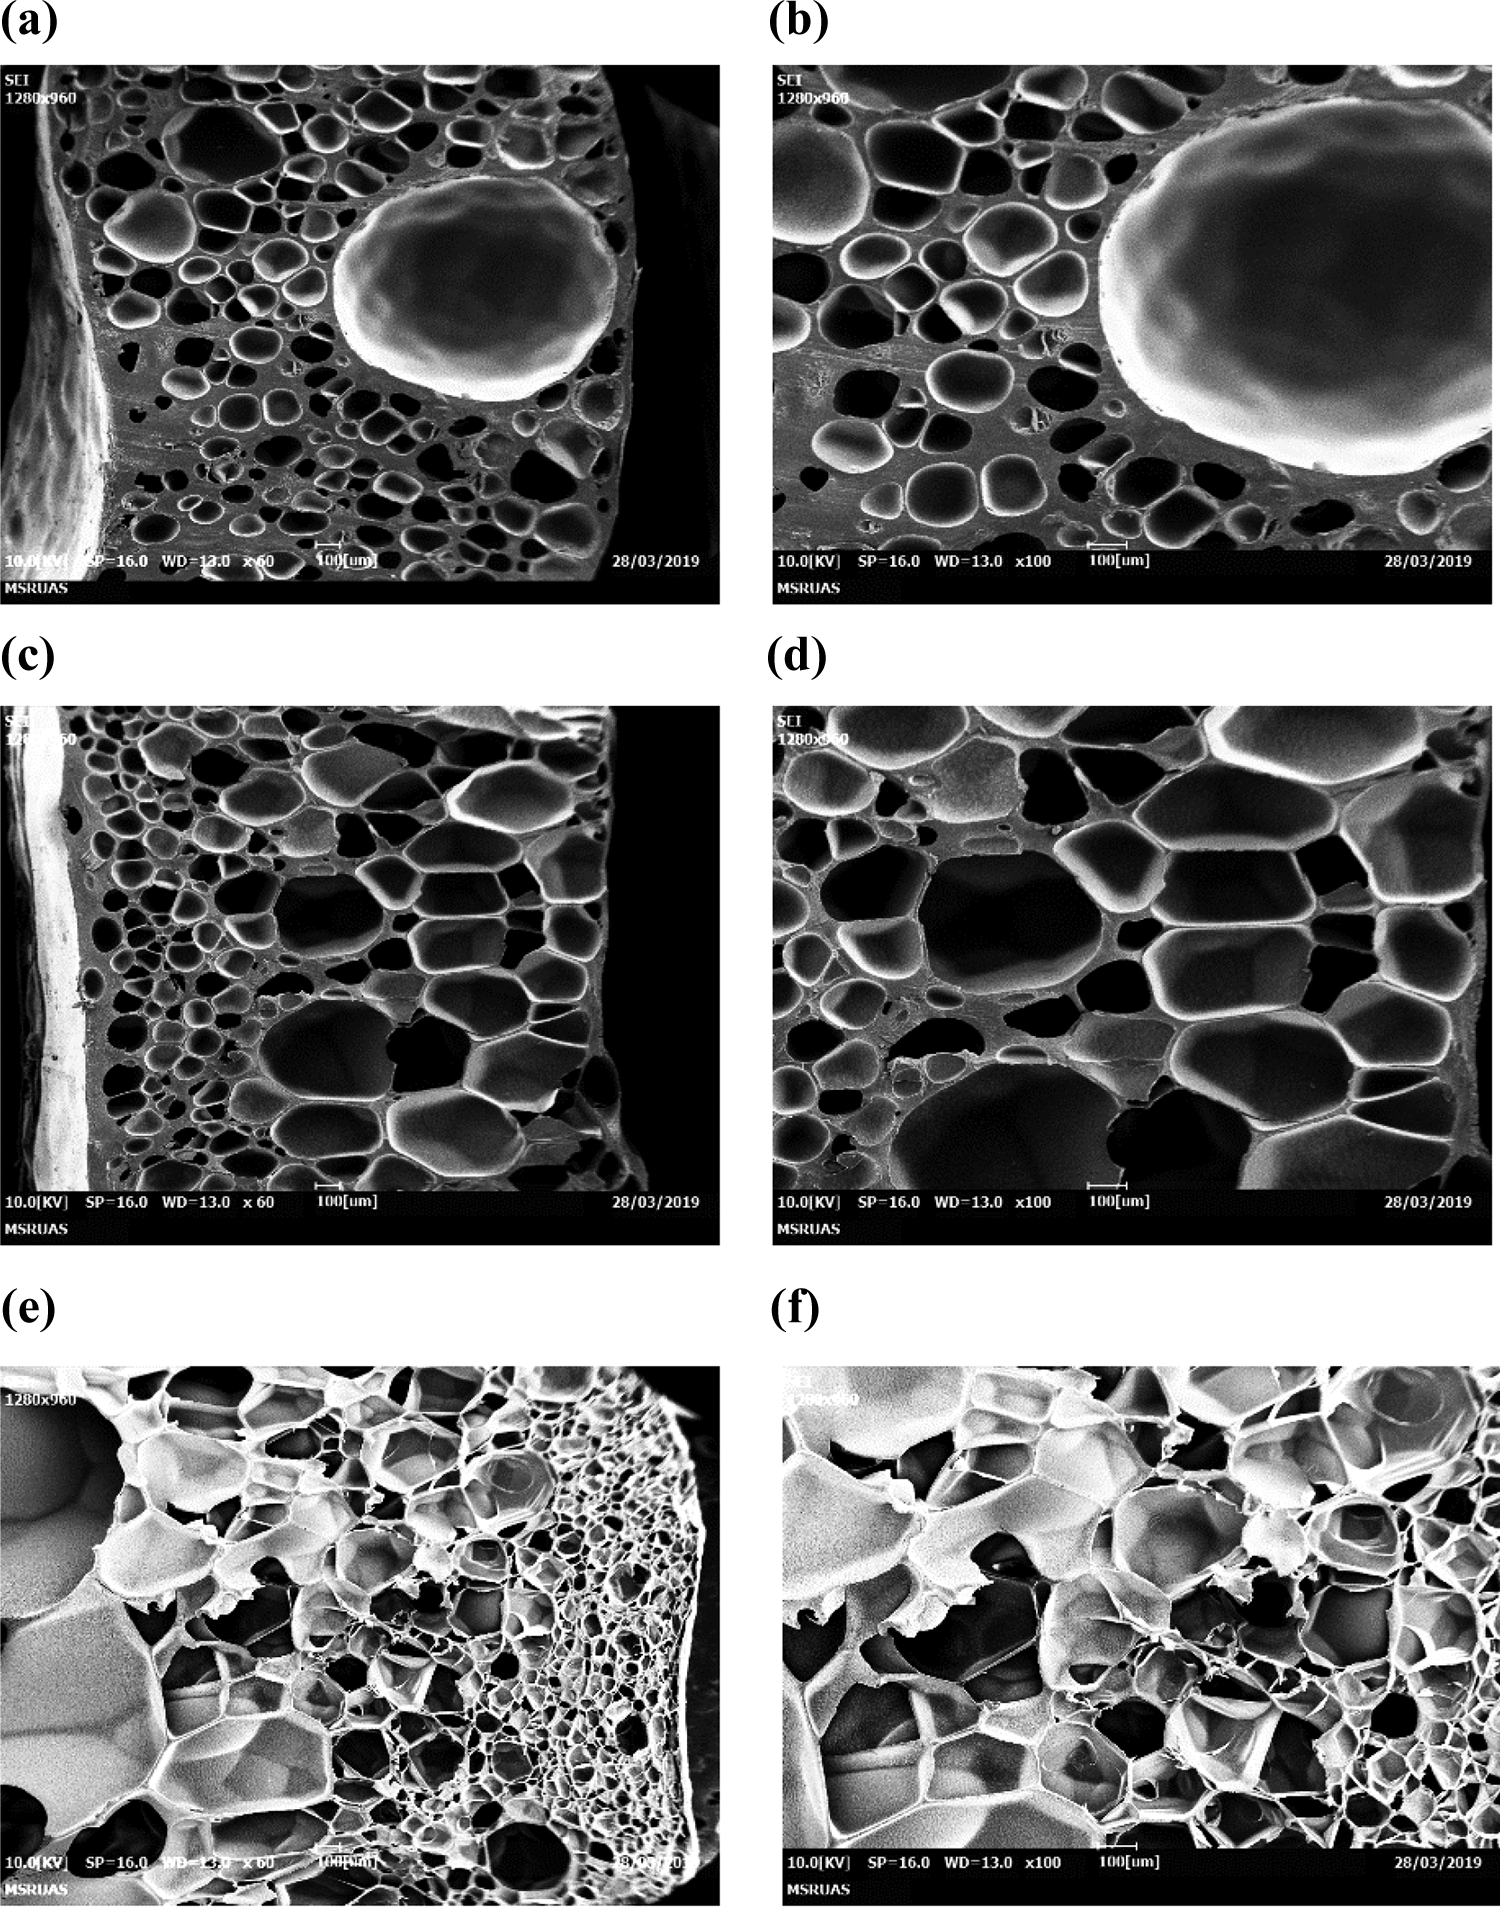
SEM micrograph at W C = 15 vol%, T S = 120°C and t S = 45 min. (a) P s = 30 bar, 60×; (b) P s = 30 bar, 100×; (c) P s = 40 bar, 60×; (d) P s = 40 bar, 100×; (e) P s = 50 bar, 60× and (f) P s = 50 bar, 100×.
Figures 8 to 10 represent the cell morphology at 30, 45 and 60 vol% water content, respectively. The irregular polygonal cell structure with large-sized cells was observed with an increase in water content. Along with this, the increase in the saturation pressure increased cell density.
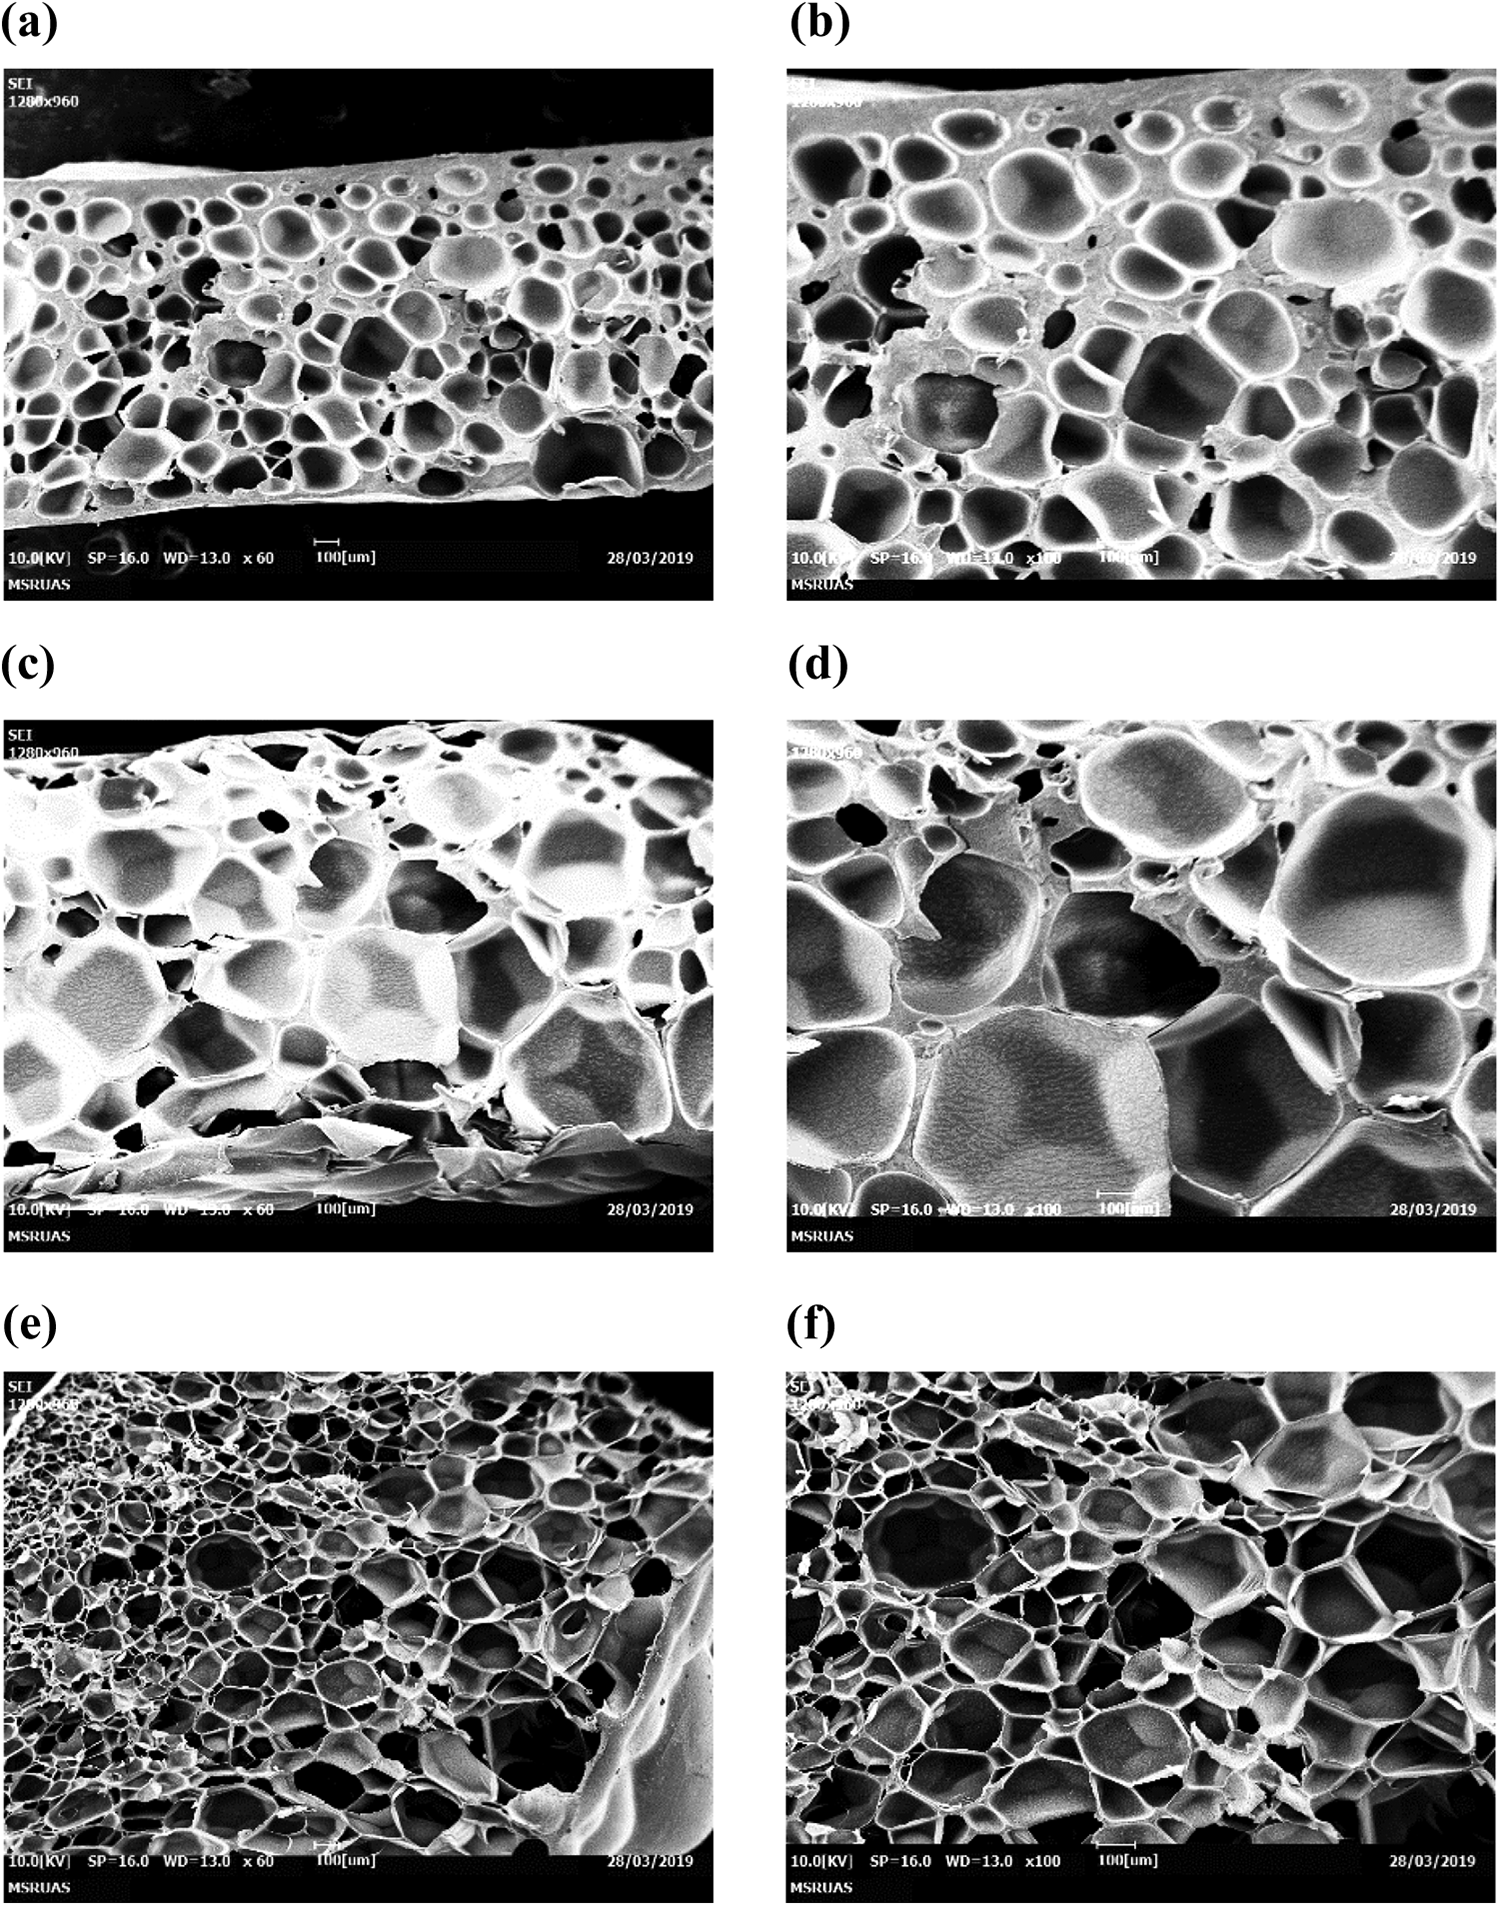
SEM micrograph at W C = 30 vol%, T S = 120°C and t S = 45 min. (a) P s = 30 bar, 60×; (b) P s = 30 bar, 100×; (c) P s = 40 bar, 60×; (d) P s = 40 bar, 100×; (e) P s = 50 bar, 60× and (f) P s = 50 bar, 100×. SEM: scanning electron microscope.
SEM micrograph at W C = 45 vol%, T S = 120°C and t S = 45 min. (a) P s = 30 bar, 60×; (b) P s = 30 bar, 100×; (c) P s = 40 bar, 60×; (d) P s = 40 bar, 100×; (e) P s = 50 bar, 60× and (f) P s = 50 bar, 100×.
SEM micrograph at W C = 60 vol%, T S = 120°C and t S = 45 min. (a) P s = 30 bar, 60×; (b) P s = 30 bar, 100×; (c) P s = 40 bar, 60×; (d) P s = 40 bar, 100×; (e) P s = 50 bar, 60× and (f) P s = 50 bar, 100×.
Effect of saturation temperature and water content on the expansion ratio and cell morphology
To investigate the effect of saturation temperature and water content, the saturation pressure of 50 bar and saturation time 45 min kept constant. Figure 11 represents the comparison between virgin ABS sample and foamed ABS sample. It has seen that the surface of the foamed sample becomes shinier than the unfoamed sample which was the result of skin stretching 48 and also some flexibility in the foamed sample was seen.
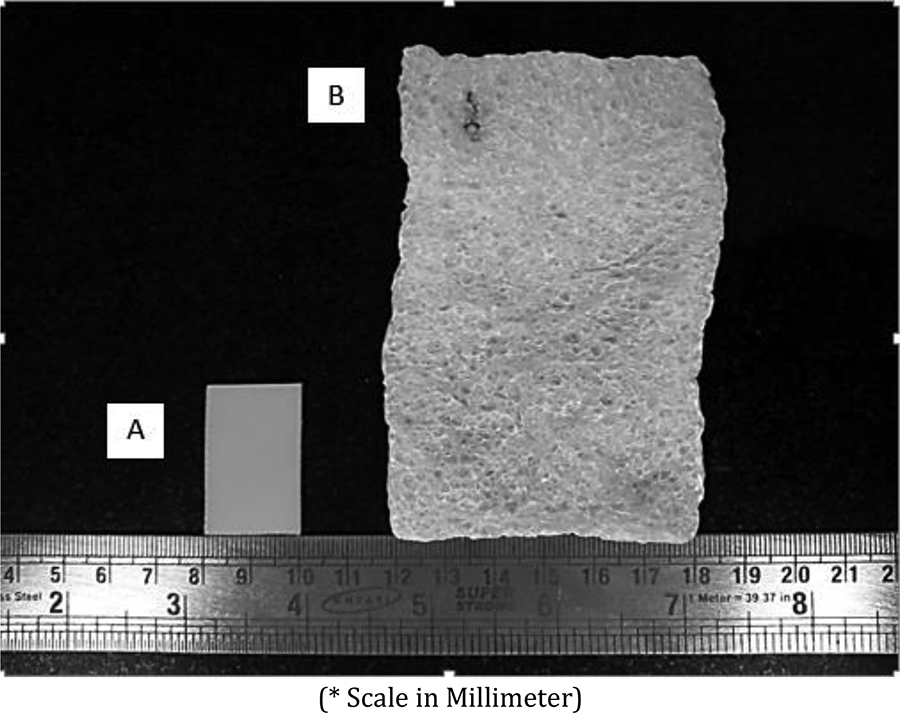
Comparison between (a) virgin ABS sample and (b) foamed ABS sample.
Figure 12 illustrates the expansion ratio increased with an increase in temperature from 110°C to 130°C and then decreased with further increase in temperature up to 150°C. The increase in expansion ratio was due to decrease in the stiffness of material at an elevated temperature which increased the chain mobility initially with an increase in the temperature from 110°C to 130°C; however, then the expansion ratio decreases due to gas loss as a result of high diffusivity of CO2 from polymer material to the environment. 49
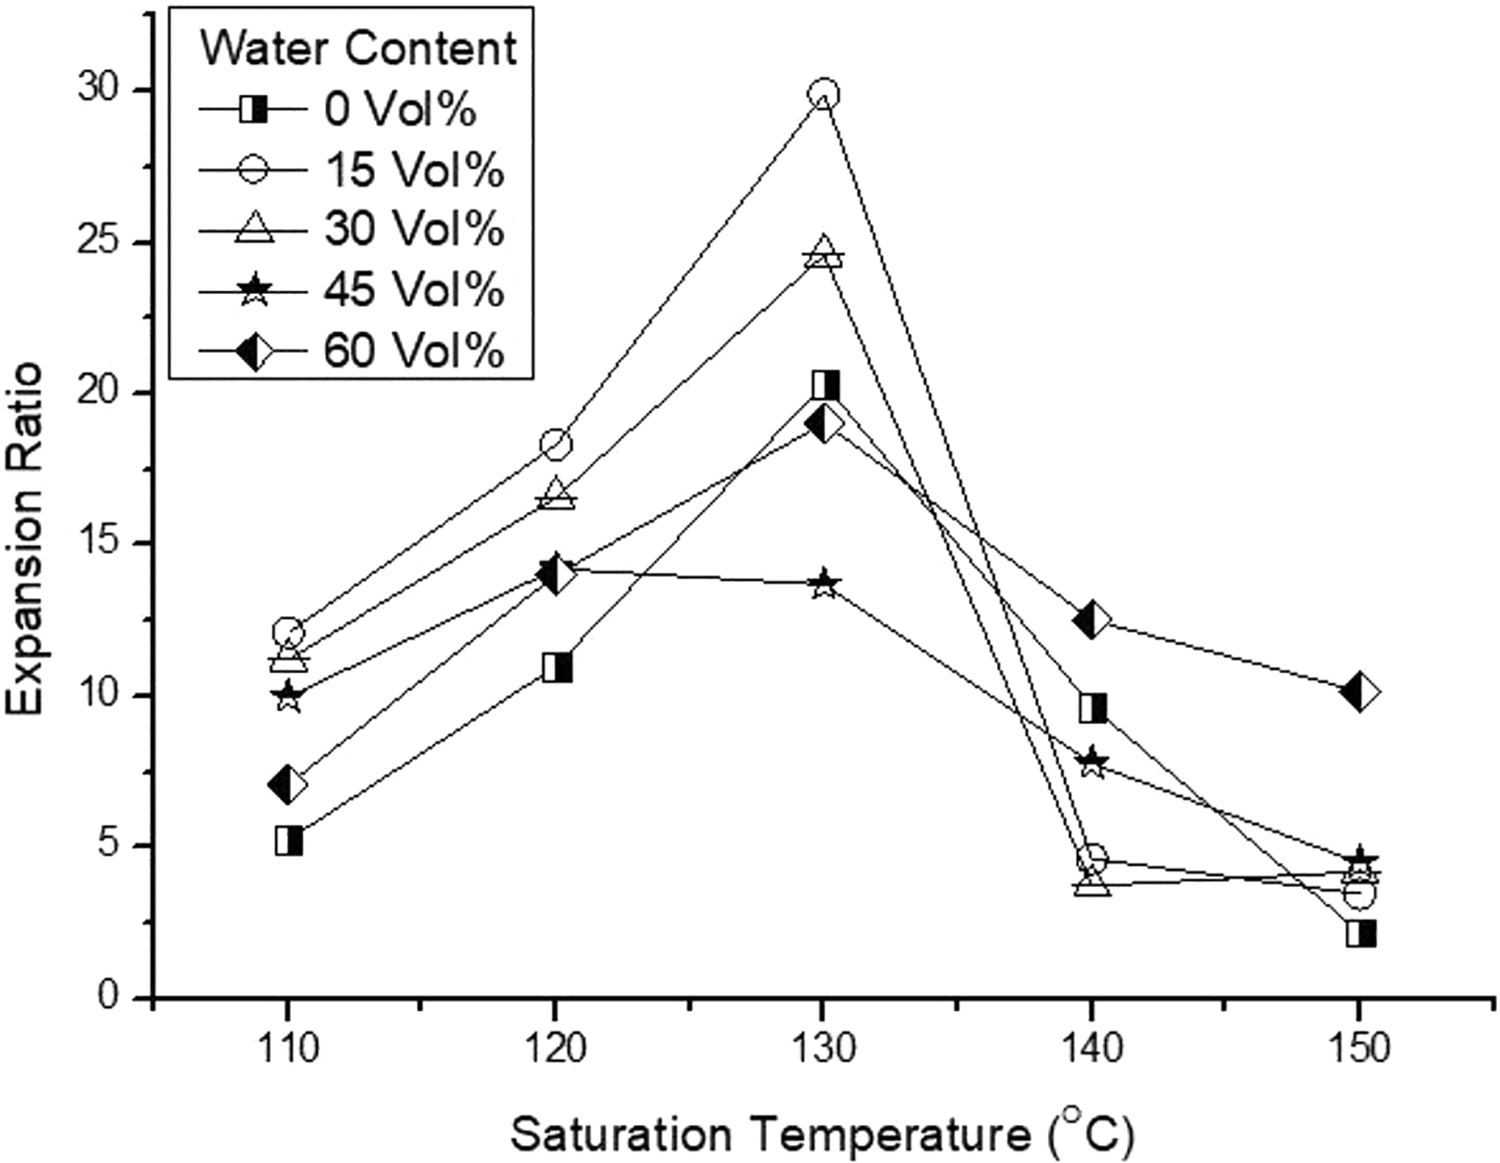
Effect of saturation temperature on expansion ratio at various co-blowing agent contents.
Figures 13 and 14 show that, at lower water contents (i.e. 0 and 15 vol%), the average cell size increased and cell density decreased with an increase in the temperature from 110°C to 130°C. Because the rise in temperature causes decrease in material stiffness, hence cell growth resistance reduced and limited cell nucleation due to decrease in CO2 dissolution with the increase in temperature. Subsequently, the average cell size decreases and cell density increases with further increases in saturation temperature above 130°C due to the high diffusion rate leads to gas loss. 50 At water content level from 30 vol% to 60 vol%, the average cell size increases and cell density decreases with rise in saturation temperature. Because of the presence of water, melt strength was not much deteriorated hence gas losses were less.
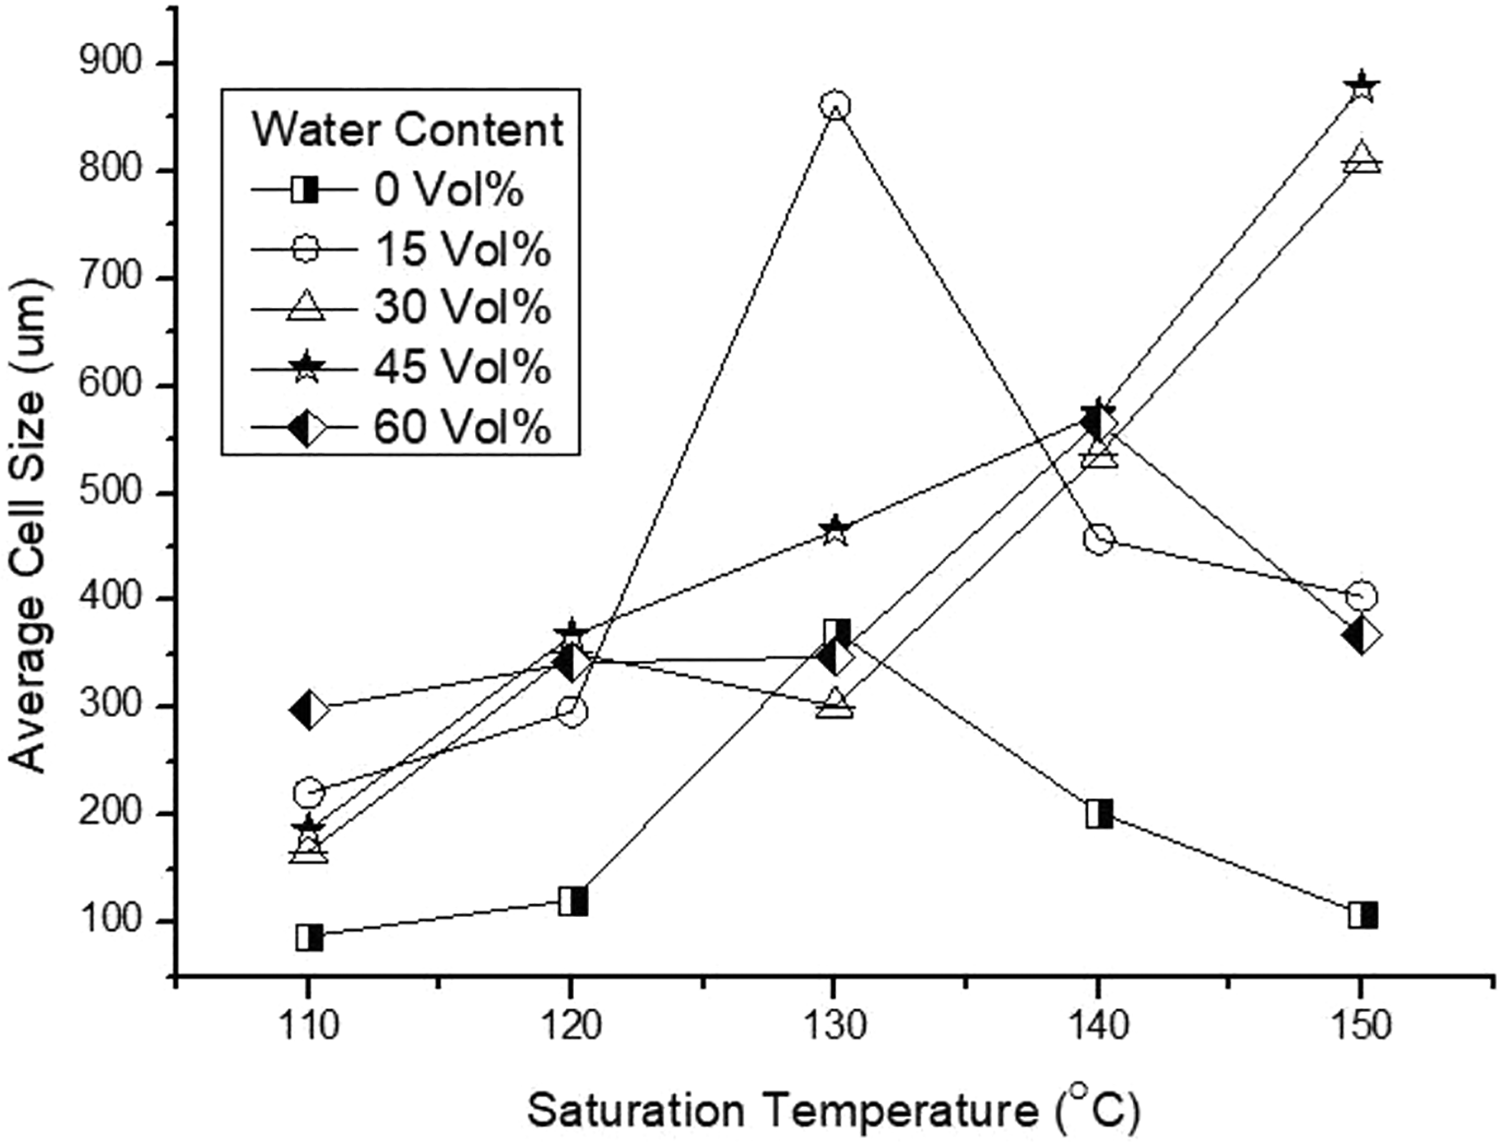
Effect of saturation temperature on average cell size at various co-blowing agent contents.
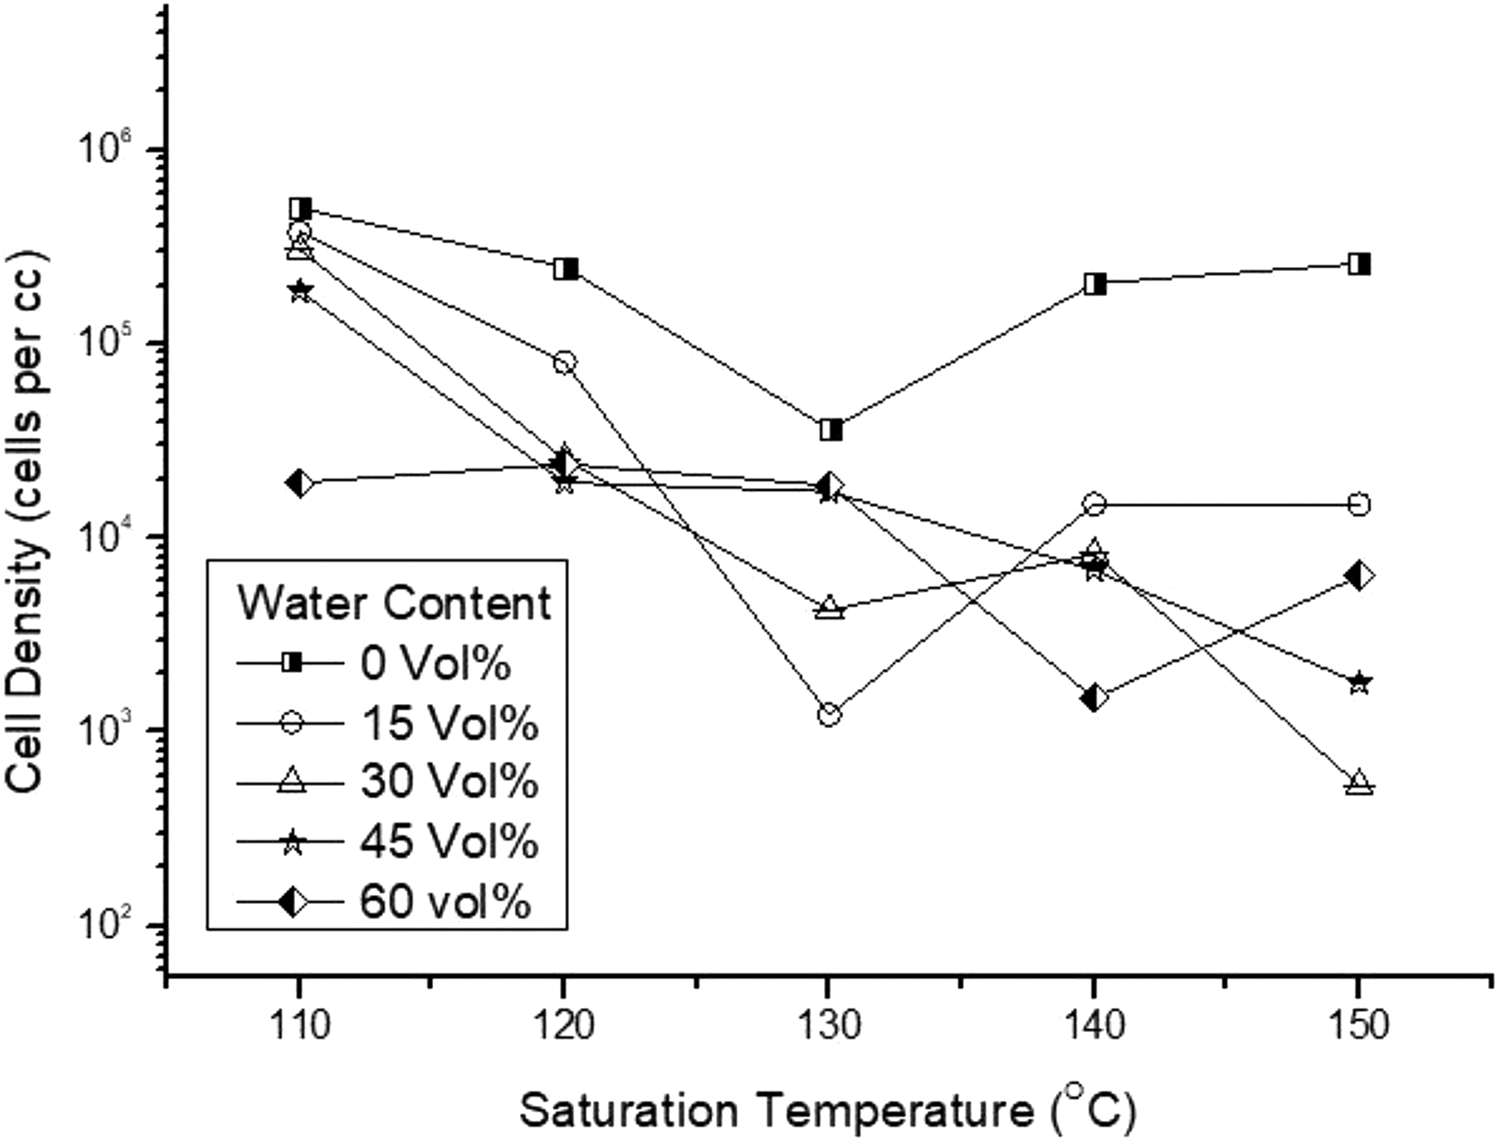
Effect of saturation temperature on cell density at various co-blowing agent contents.
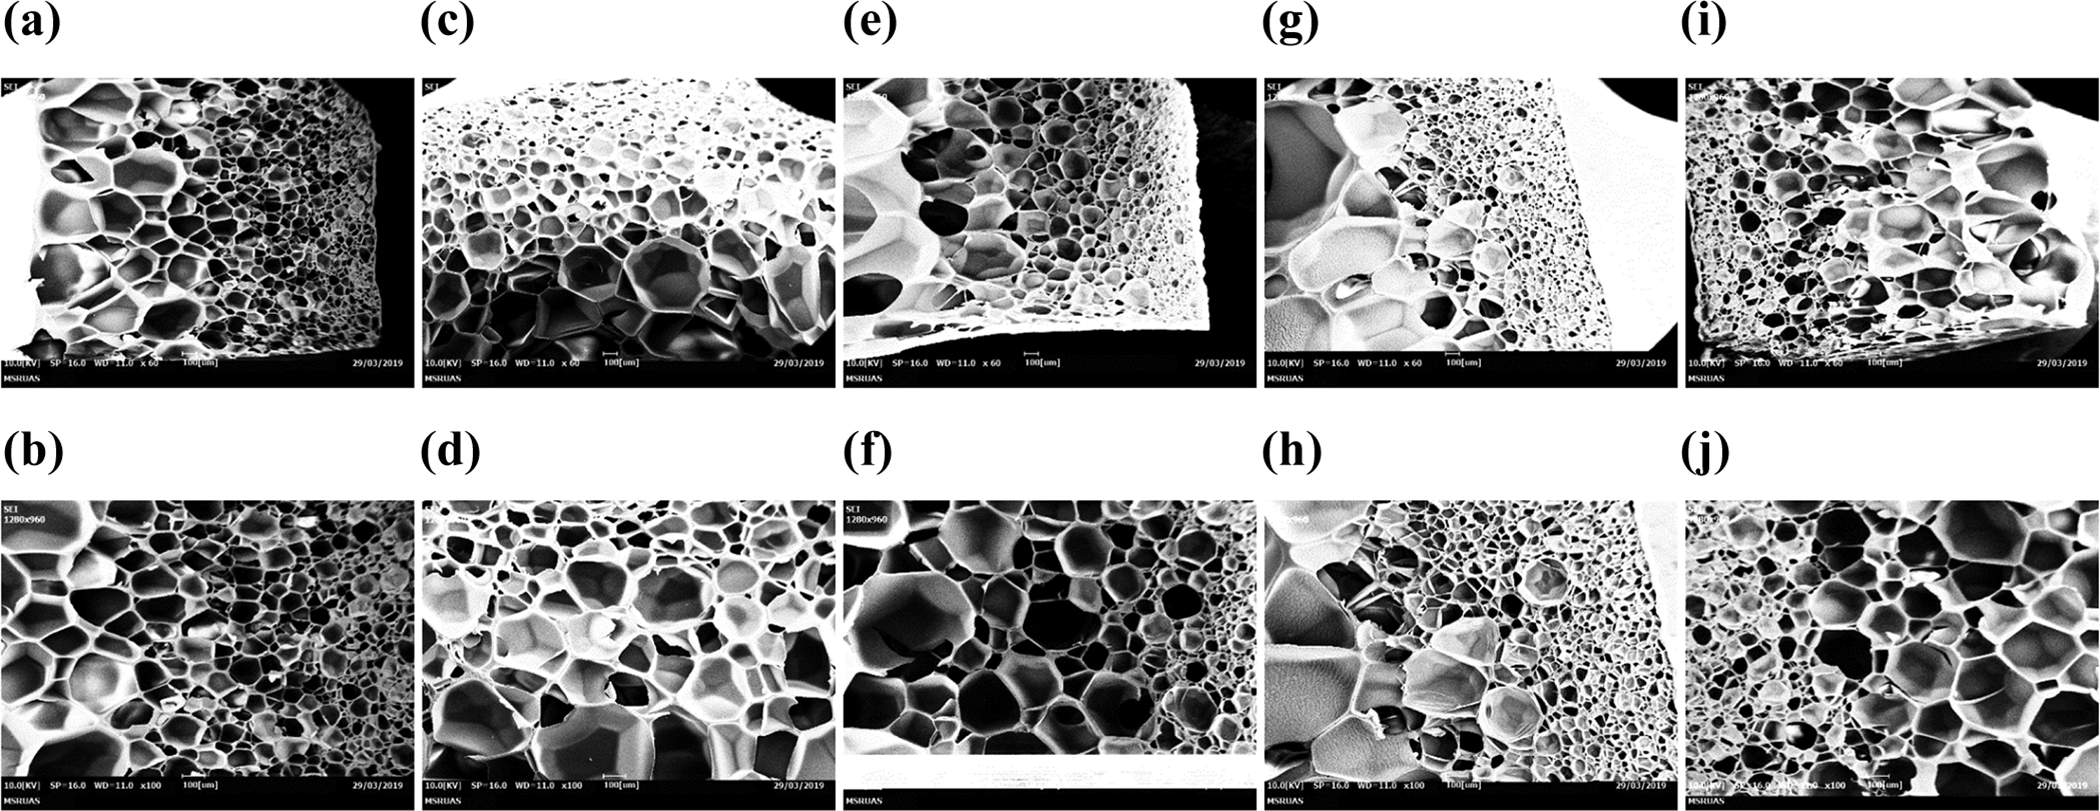
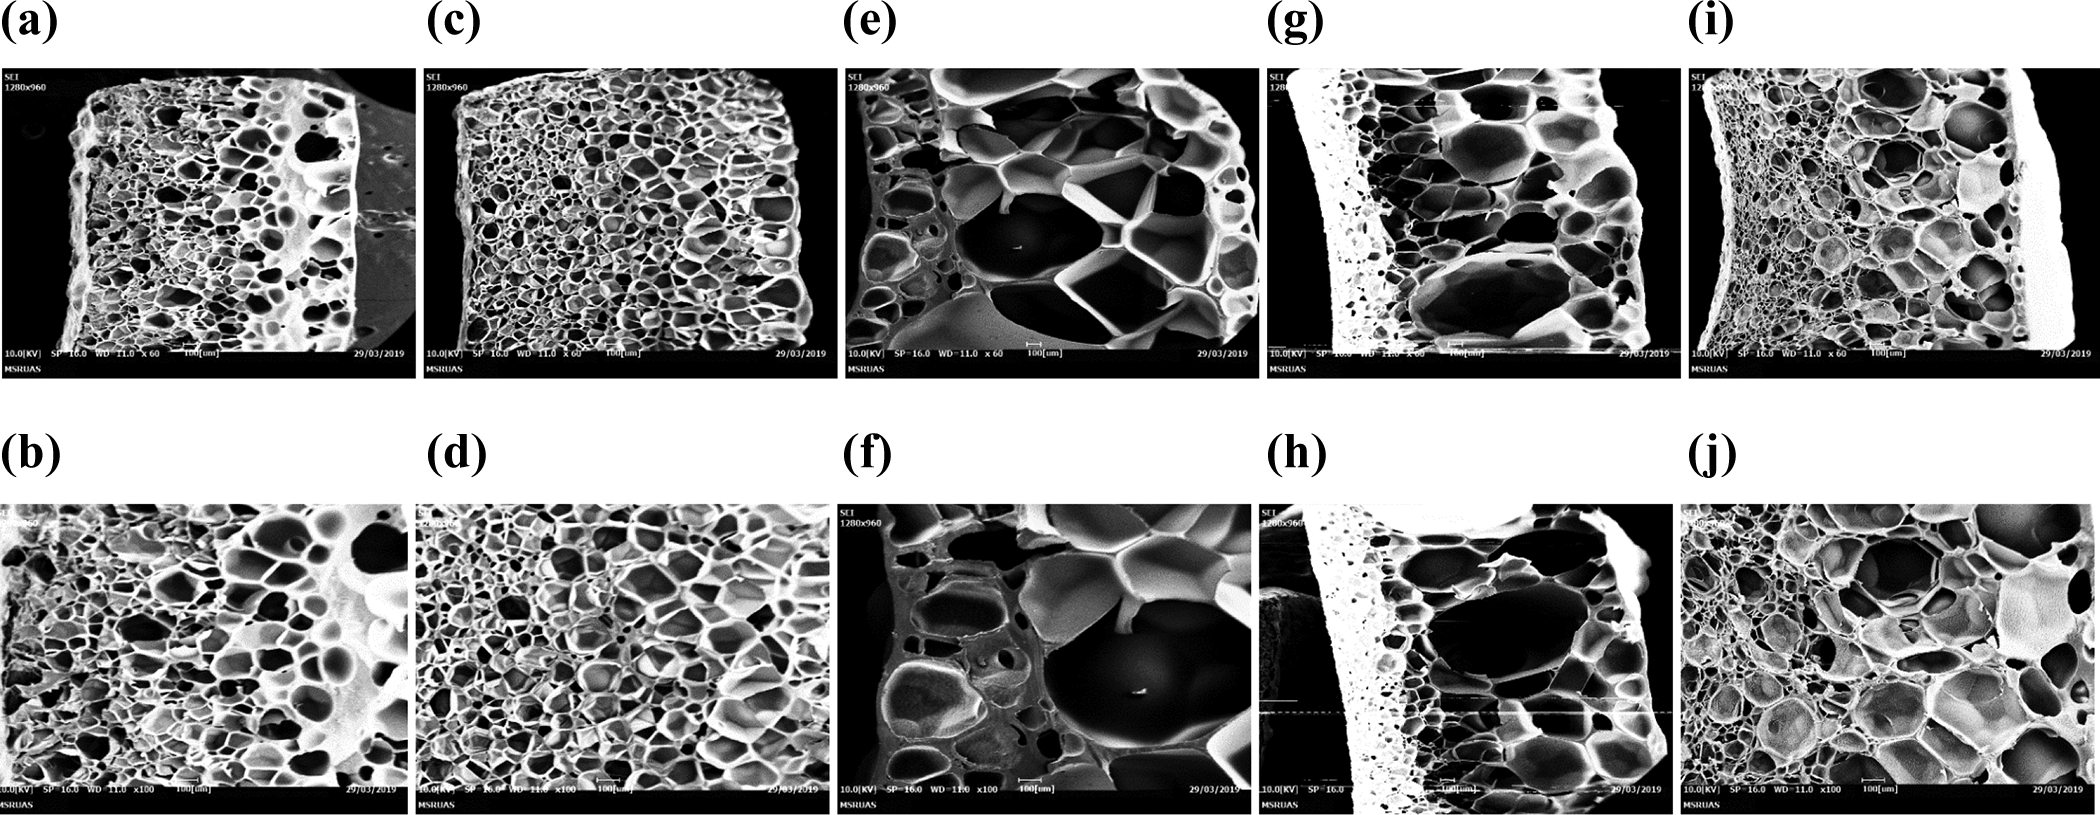
Figure 15 represents the cell morphology of foam product at no water content (0 vol%) with variation in saturation temperature. It observed that initially, the cell density was higher and the average cell size was less. As the temperature increased from 110°C to 130°C, cell density decreases and average cell size increases due to cell coalescence. From 130°C to 150°C, distorted cell structure with more cell density was observed. The cell morphology observed from Figure 16 (i.e. at 15 vol%) is nearly similar to the cell morphology observed from Figure 15 (i.e. at 0 vol%), but the only difference was that the average cell size obtained was more in case of 15 vol% water content.
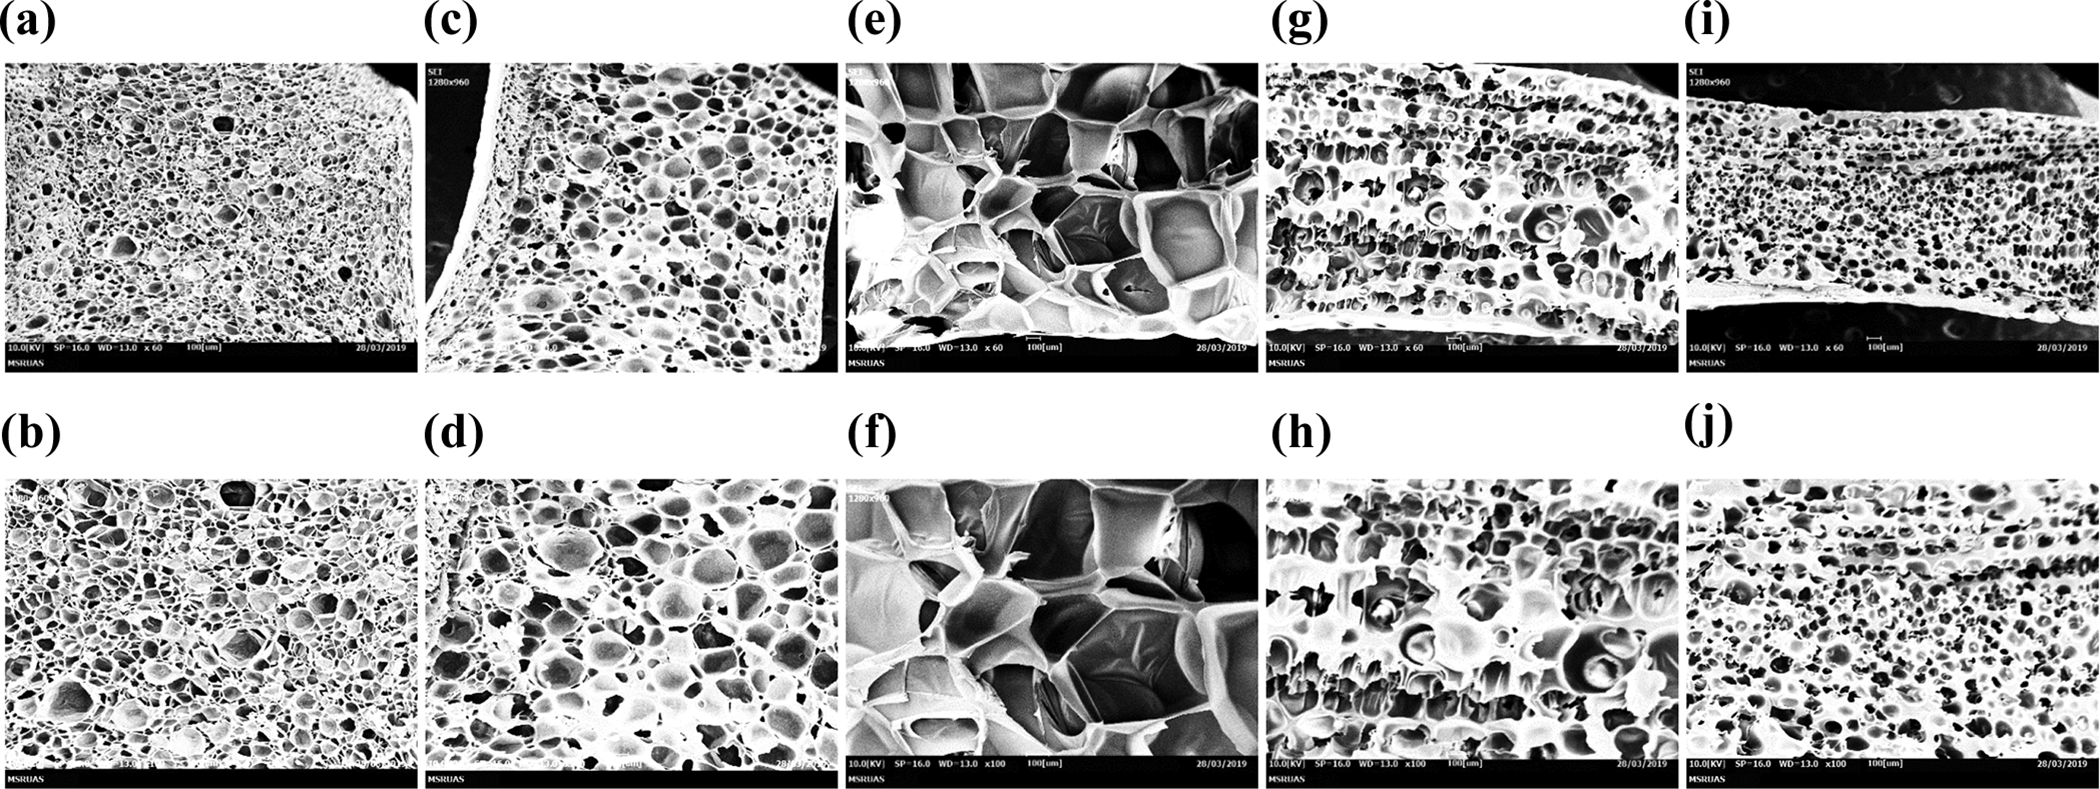
SEM micrograph at W C = 0 vol%, P S = 50 bar and tS = 45 min. (a) T s = 110°C, 60×; (b) T s = 110°C, 100×; (c) T s = 120°C, 60×; (d) T s = 120°C, 100×; (e) T s = 130°C, 60×; (f) T s = 130°C, 100×; (g) T s = 140°C, 60×; (h) T s = 140°C, 100×; (i) T s = 150°C, 60× and (j) T s = 150°C, 100×.
SEM micrograph at W C = 15 vol%, P S = 50 bar and t S = 45 min. (a) T s = 110°C, 60×; (b) T s = 110°C, 100×; (c) T s = 120°C, 60×; (d) T s = 120°C, 100×; (e) T s = 130°C, 60×; (f) T s = 130°C, 100×; (g) T s = 140°C, 60×; (h) T s = 140°C, 100×; (i) T s = 150°C, 60× and (j) T s = 150°C, 100×.
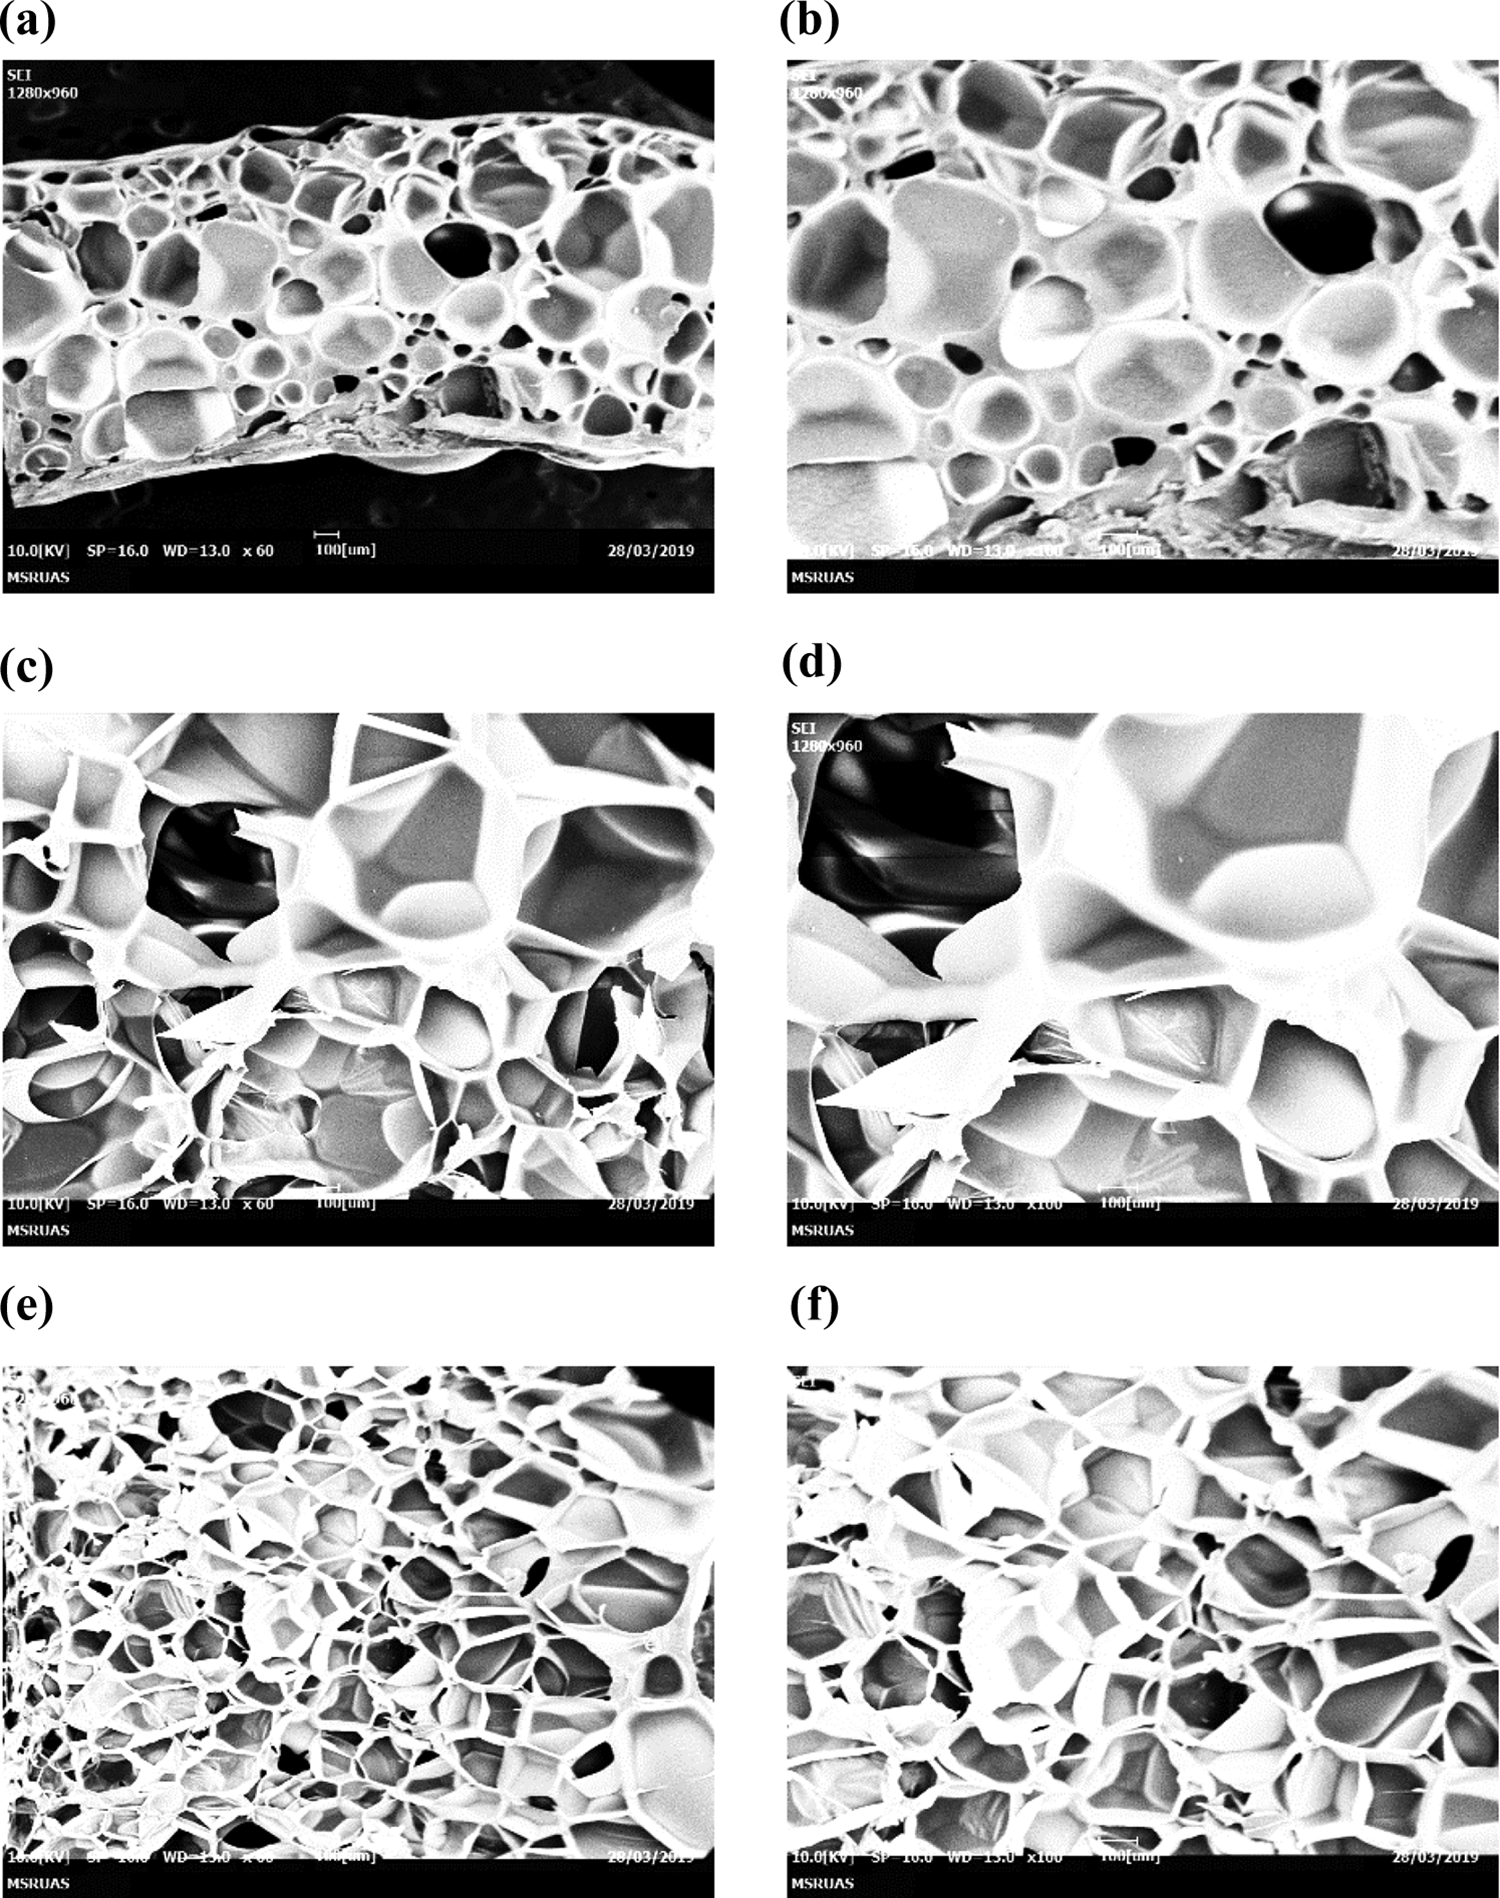
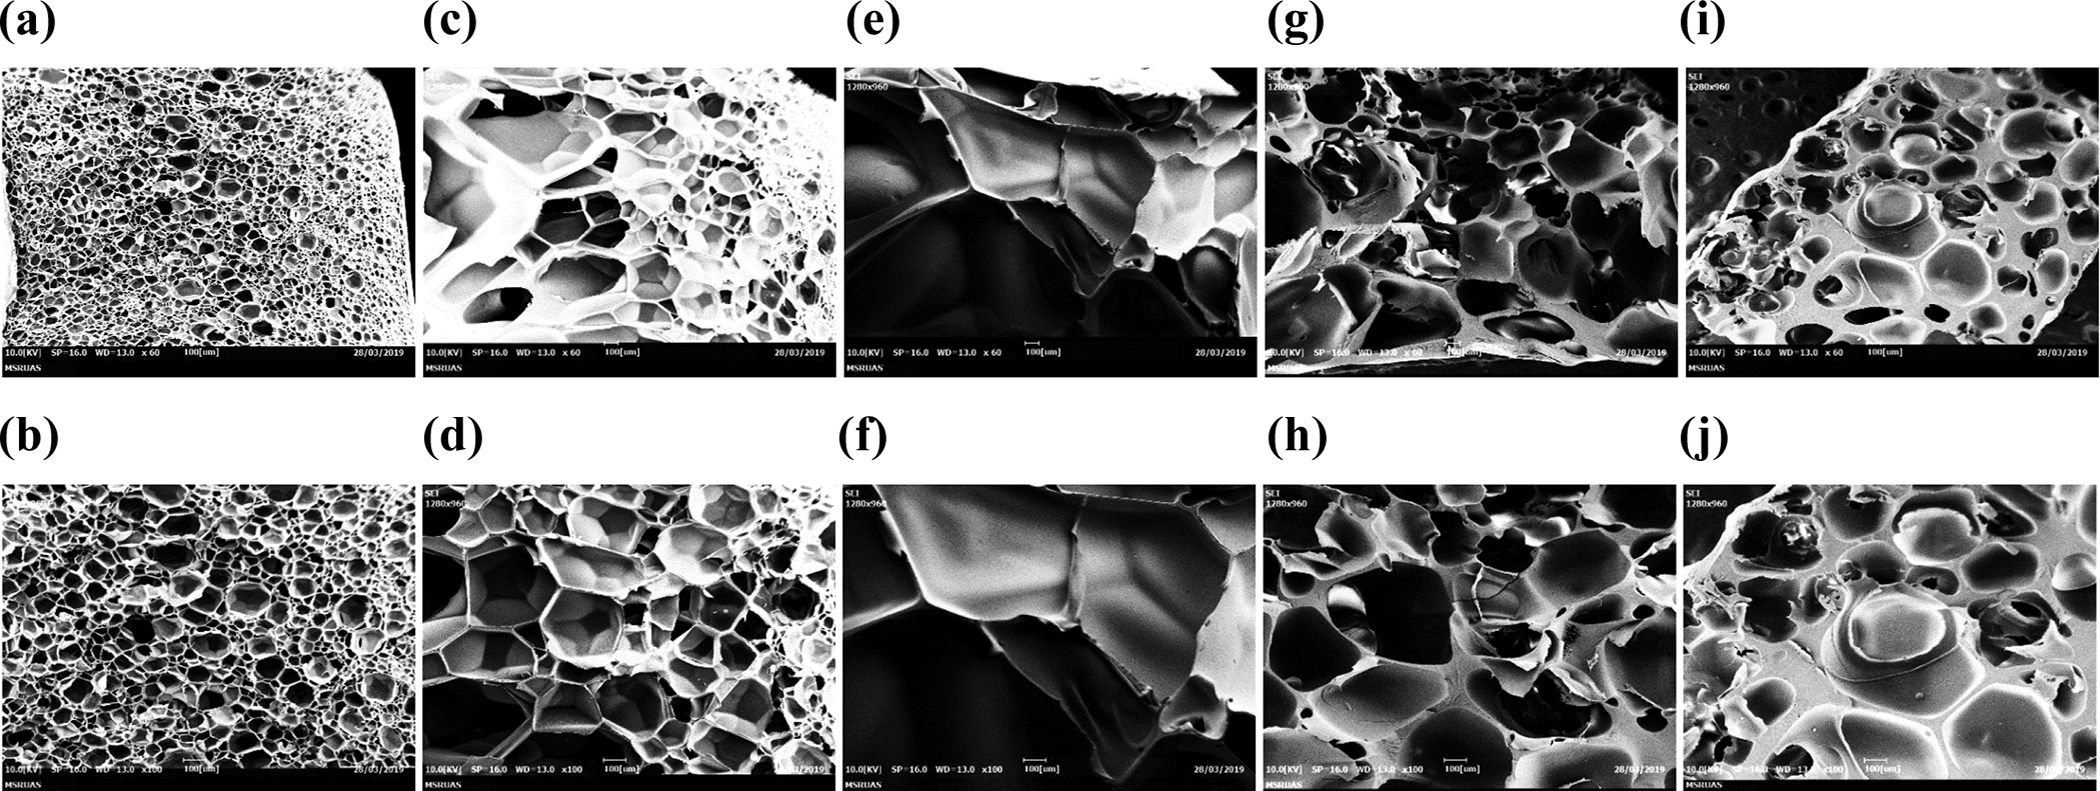
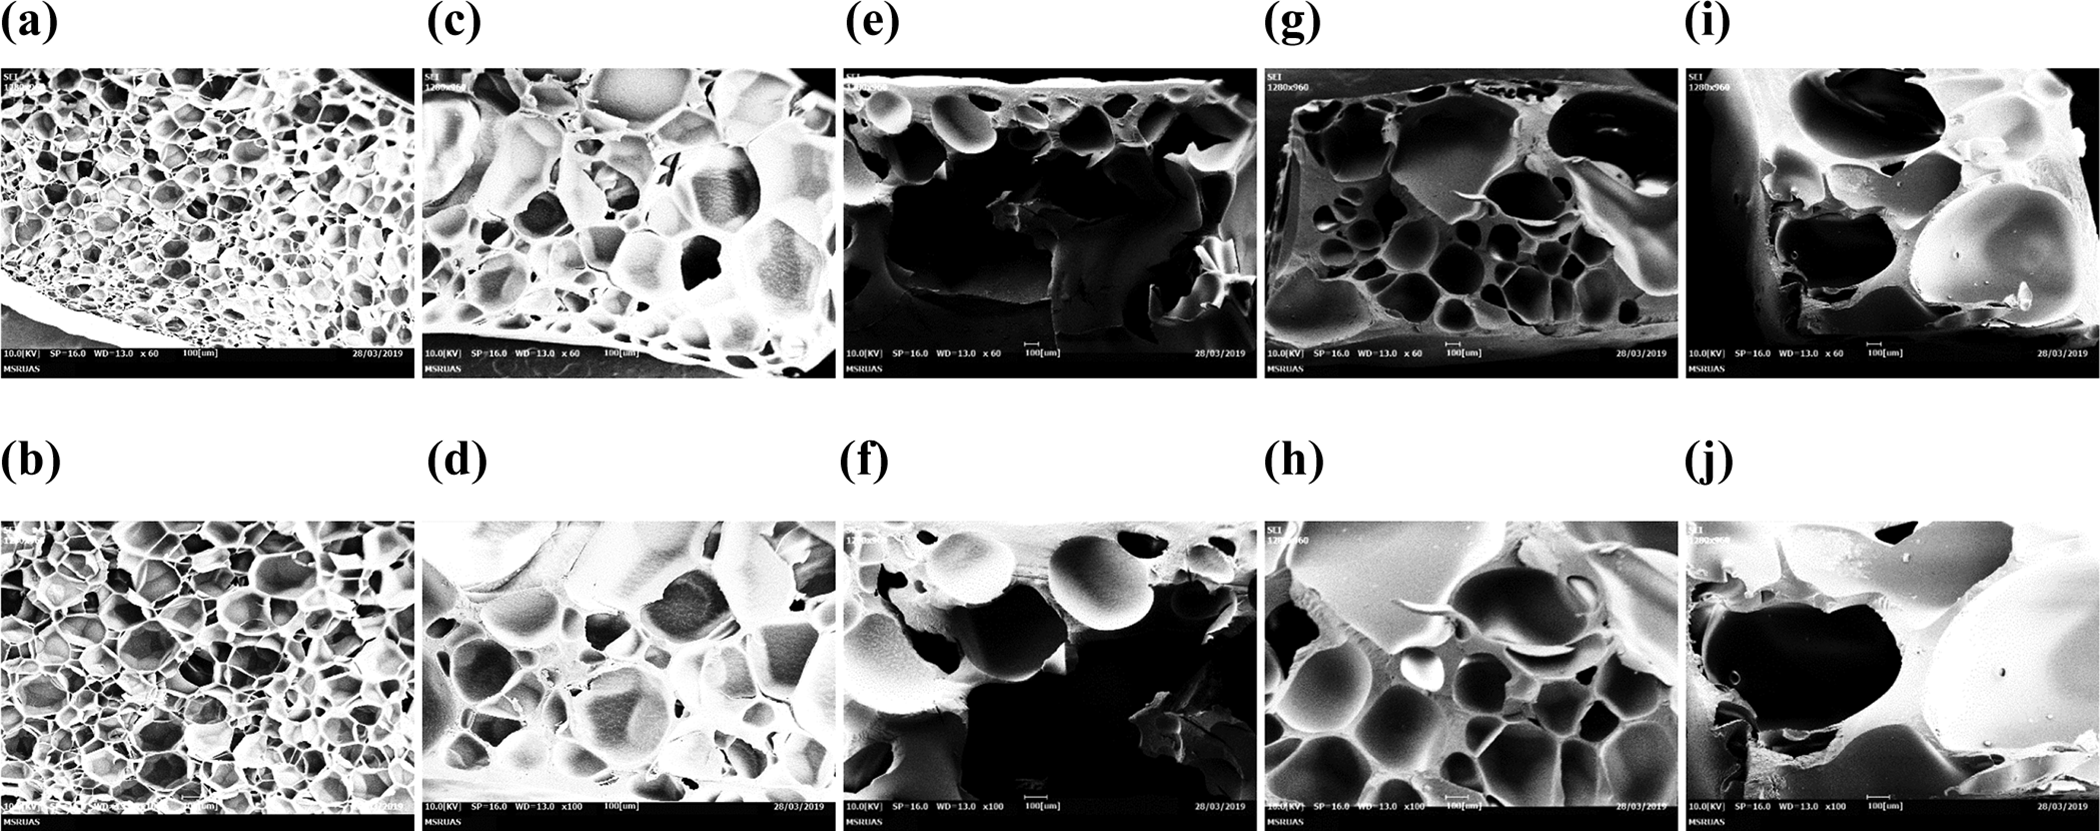
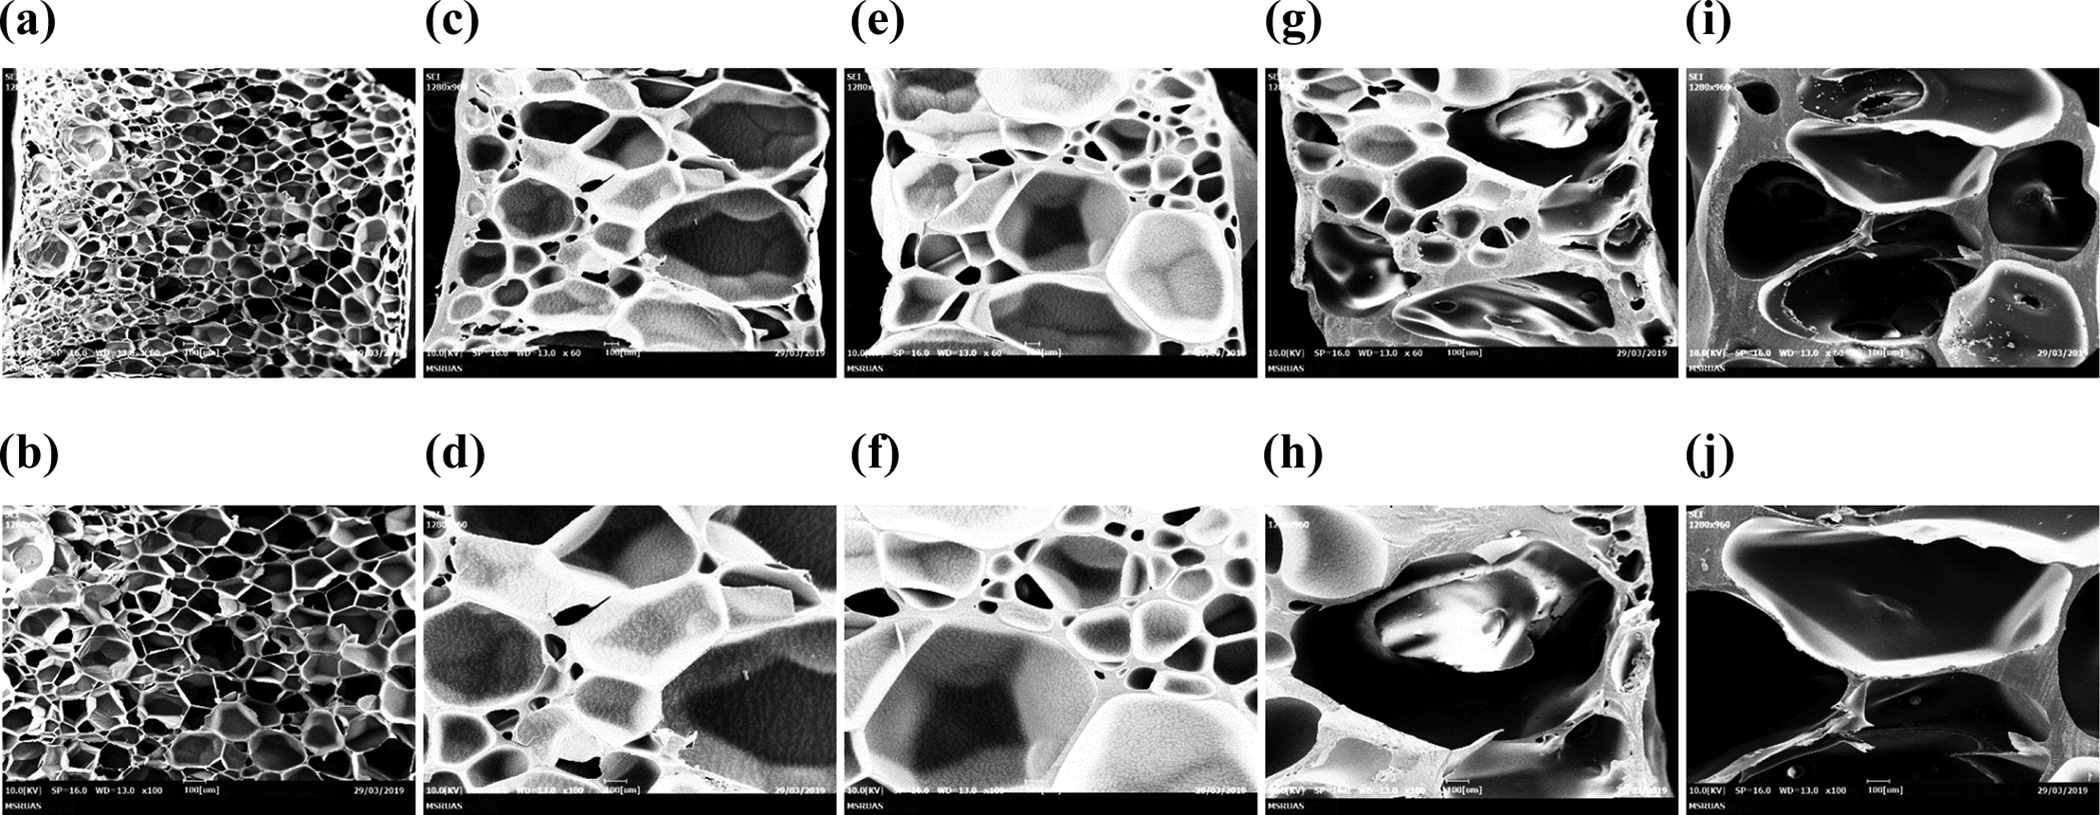
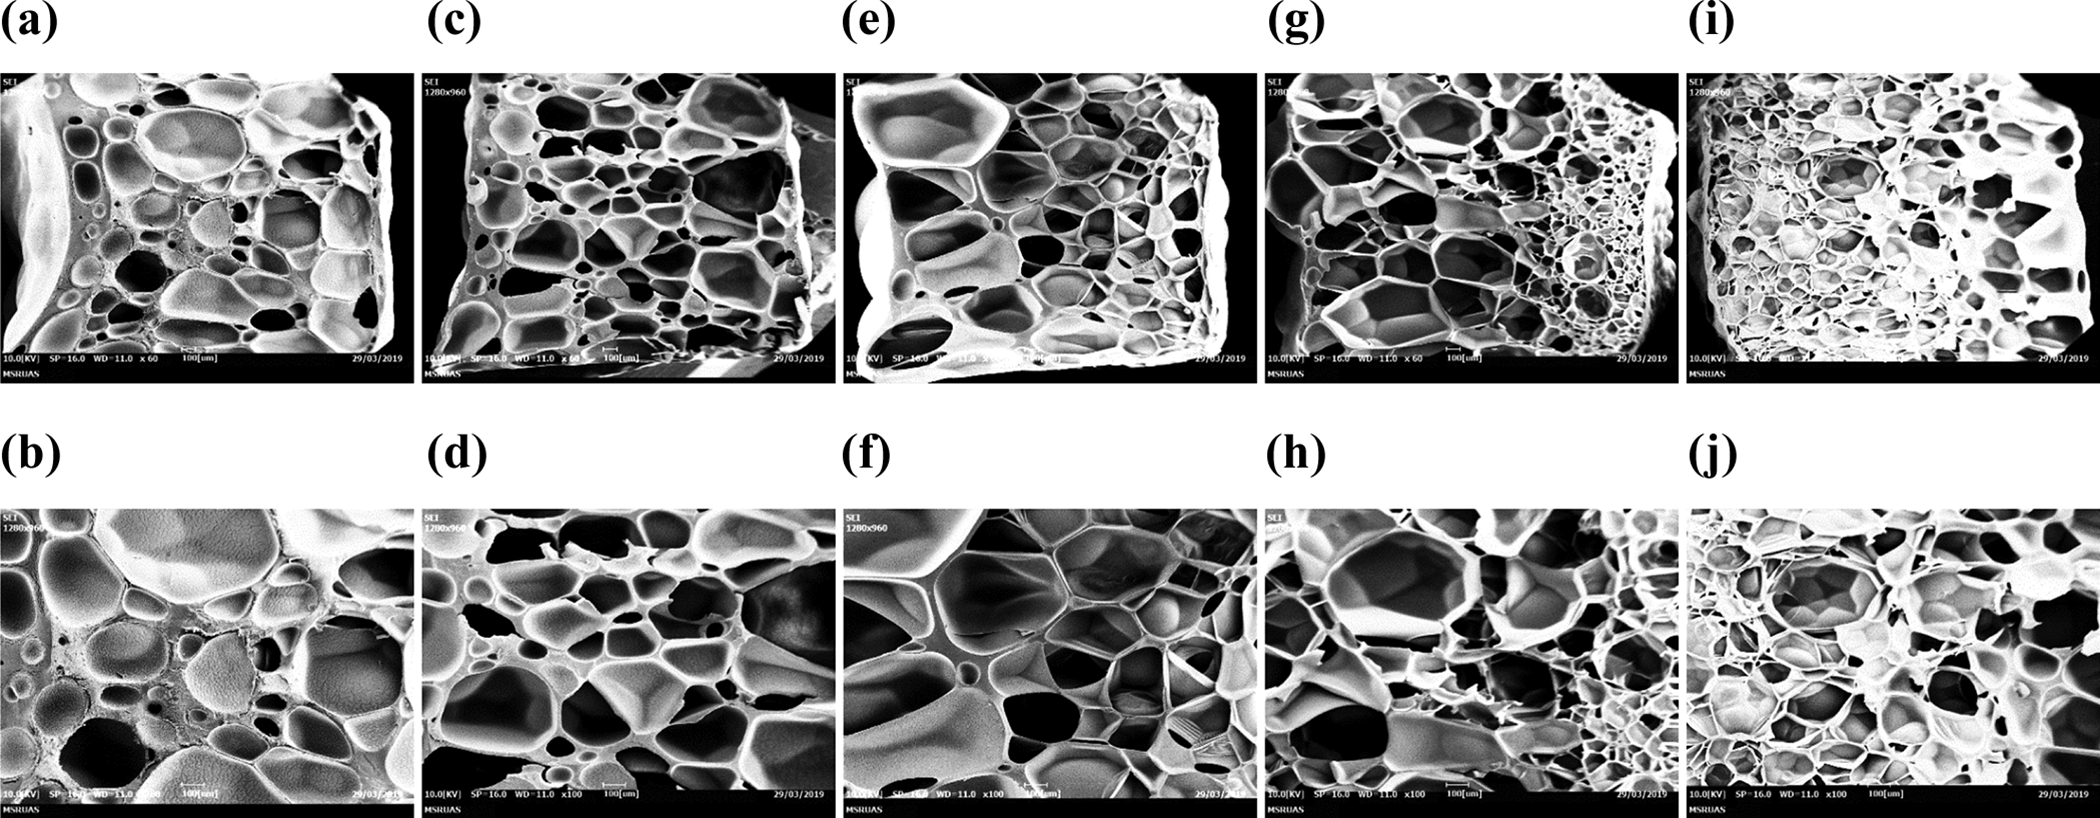
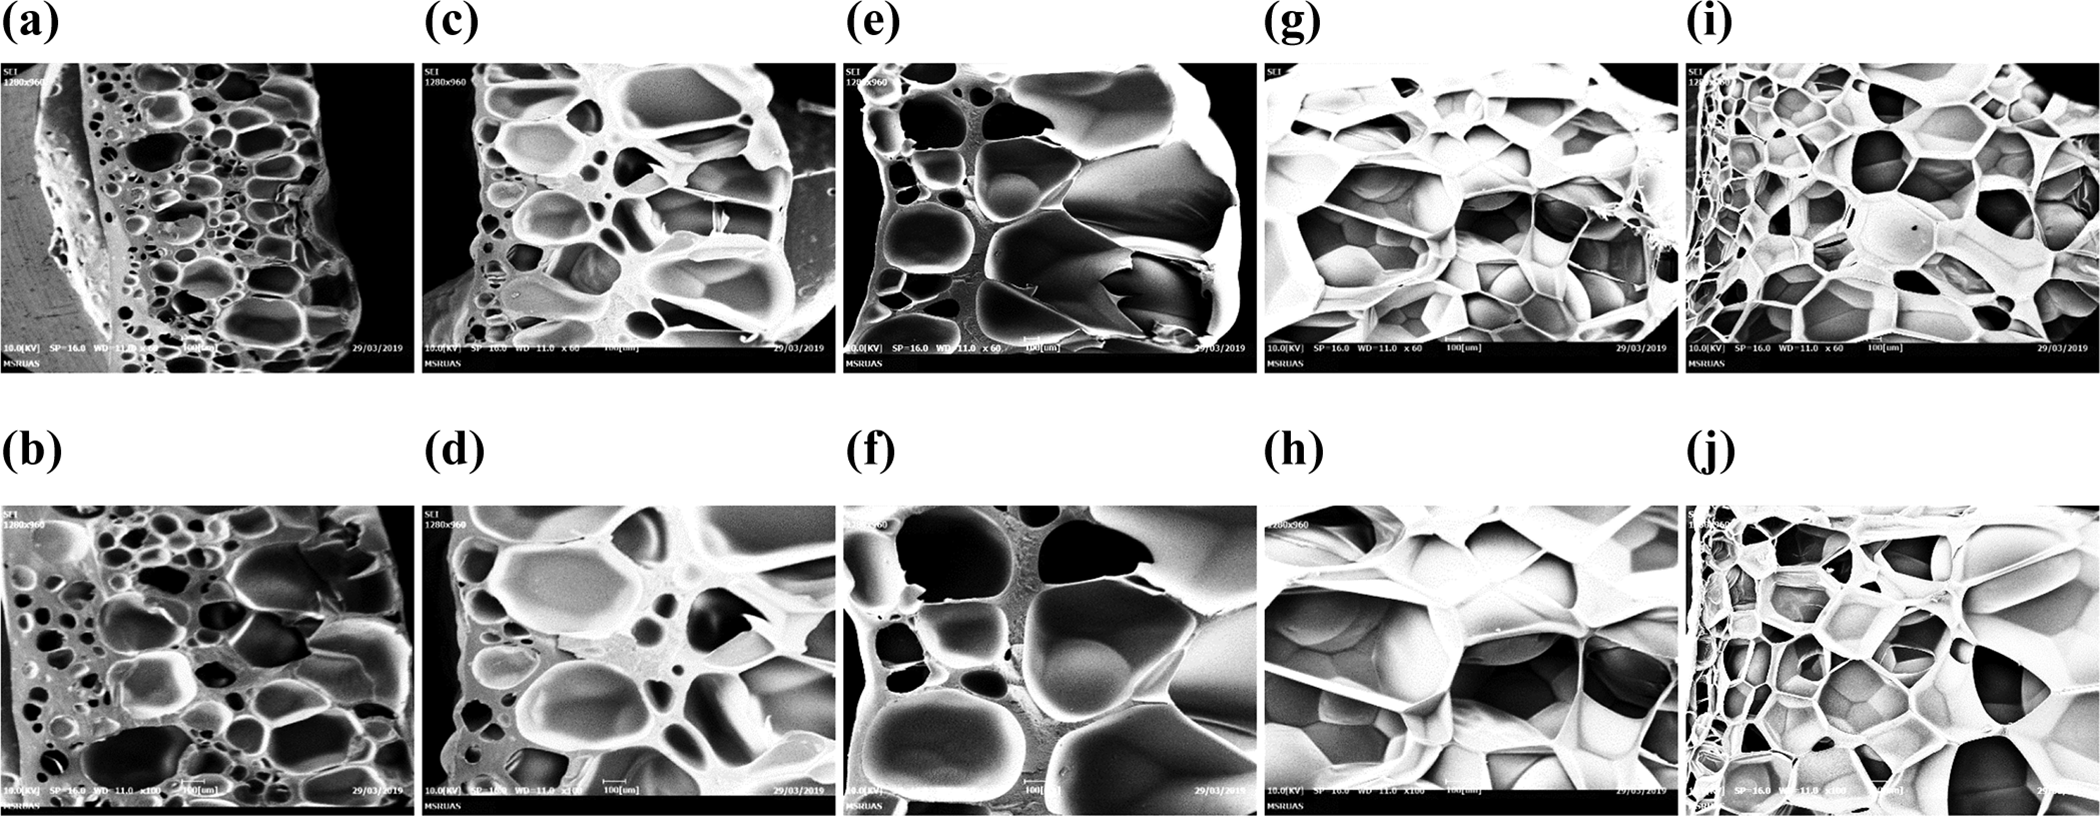
Figures 17 to 19 represent the cell morphology of foam samples produced at 30, 45 and 60 vol%, respectively, with the variation of saturation temperature. In the case of these water content, the enhanced cell size with stable cell structure observed even with an increase in the saturation temperature. The stable cell structure usually obtained good melt strength, in this case, which may be maintained due to the presence of water. The maximum expansion ratio of 29.9 was observed at 130°C for 15 vol% of water content. The saturation temperature of 130°C was observed as the optimum temperature at all levels of water content.
SEM micrograph at W C = 30 vol%, P S = 50 bar and t S = 45 min. (a) T s = 110°C, 60×; (b) T s = 110°C, 100×; (c) T s = 120°C, 60×; (d) T s = 120°C, 100×; (e) T s = 130°C, 60×; (f) T s = 130°C, 100×; (g) T s = 140°C, 60×; (h) T s = 140°C, 100×; (i) T s = 150°C, 60× and (j) T s = 150°C, 100×.
SEM micrograph at W C = 45 vol%, P S = 50 bar and t S = 45 min. (a) T s = 110°C, 60×; (b) T s = 110°C, 100×; (c) T s = 120°C, 60×; (d) T s = 120°C, 100×; (e) T s = 130°C, 60×; (f) T s = 130°C, 100×; (g) T s = 140°C, 60×; (h) T s = 140°C, 100×; (i) T s = 150°C, 60× and (j) T s = 150°C, 100×.
SEM micrograph at W C = 60 vol%, P S = 50 bar and t S = 45 min. (a) T s = 110°C, 60×; (b) T s = 110°C, 100×; (c) T s = 120°C, 60×; (d) T s = 120°C, 100×; (e) T s = 130°C, 60×; (f) T s = 130°C, 100×; (g) T s = 140°C, 60×; (h) T s = 140°C, 100×; (i) T s = 150°C, 60× and (j) T s = 150°C, 100×.
Effect of saturation time and water content on the expansion ratio and cell morphology
The effect of saturation time and water content was studied at a fixed saturation temperature of 120°C and a saturation pressure of 50 bar, respectively. In this study, the term cell size gradient was observed. The cell size gradient is the variation in cell size over the thickness of the sample. This may be due to the variation in the dissolution of CO2 with saturation time over the sample thickness. The smaller cell size was observed at the upper surface and large cell size observed at the lower surface.
Figure 20 shows the effect of saturation time on expansion ratio at different water content. It was seen that at all levels of water content, the expansion ratio increases with an increase in saturation time. This could be due to a decrease in foam density and over long saturation time, not much variation was observed. 50
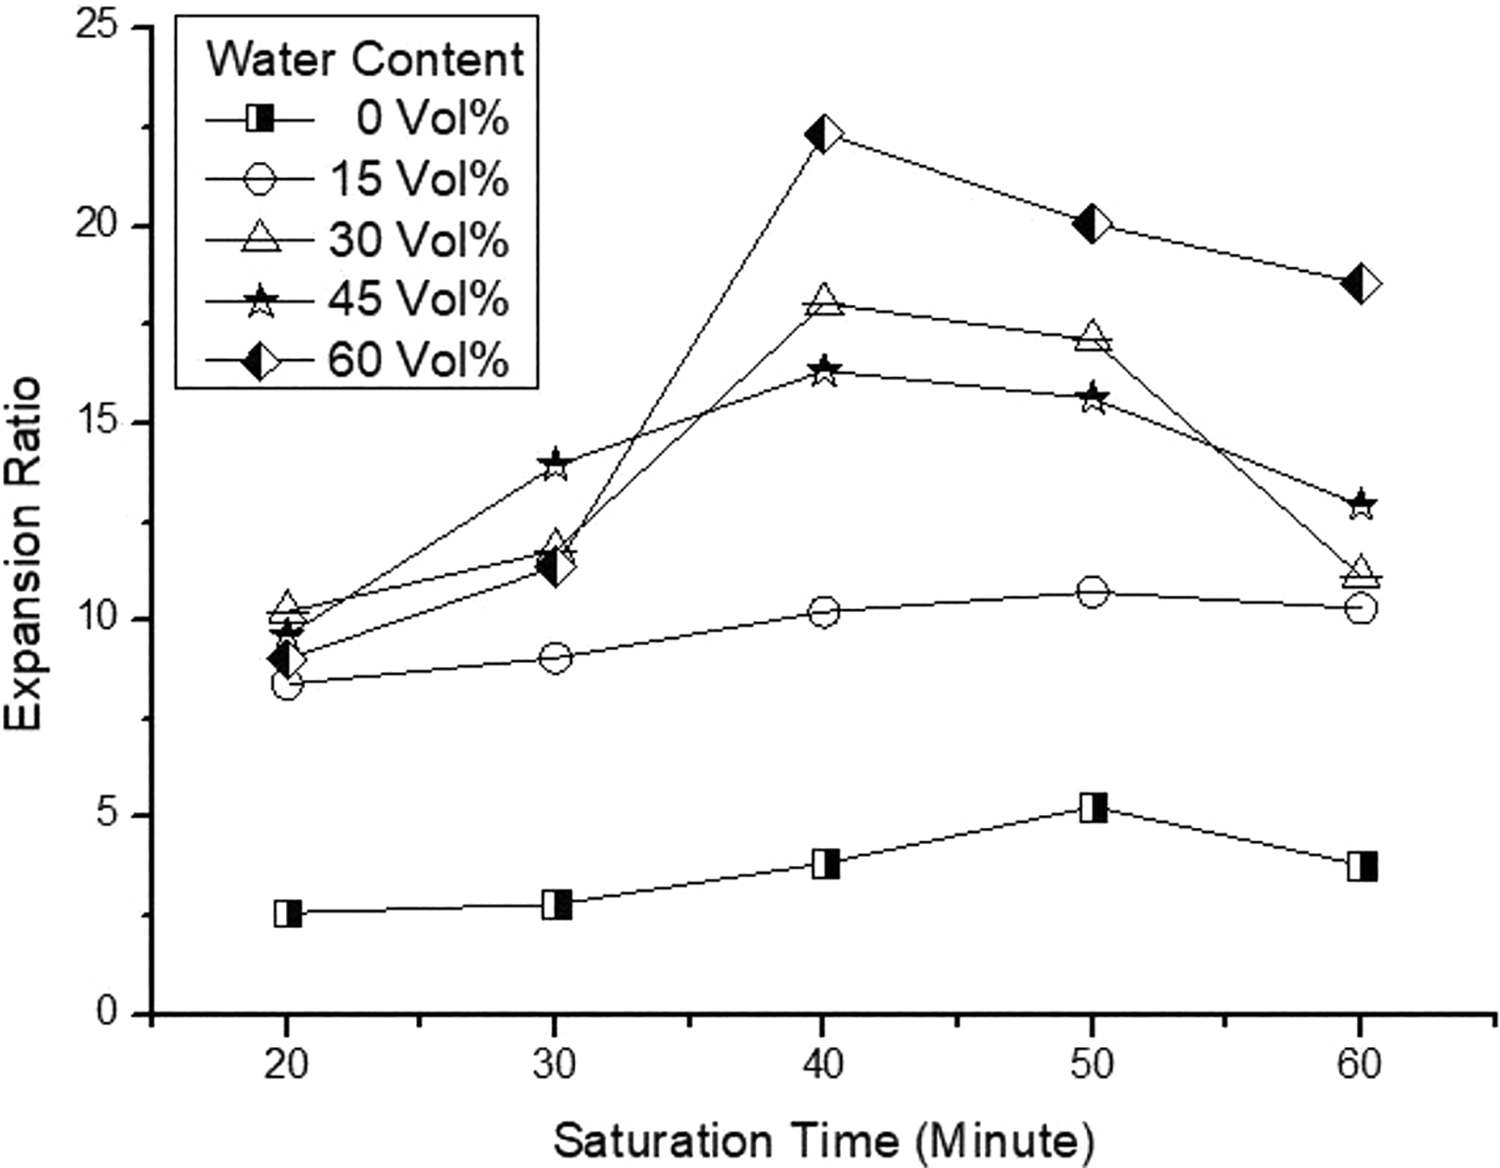
Effect of saturation time on expansion ratio at various co-blowing agent contents.
According to Goel and Beckman, saturation time means the time for which the sample has been in contact with the blowing agent. Figures 21 and 22 depict the average cell size and cell density variation at different water content and different levels of saturation time. At no water content (0 vol%), as the rise in saturation time, the cell size decreased and cell density increased because of the dissolution of CO2 increases with an increase in saturation time. 15 When the water content was from 15 vol% to 60 vol%, the average cell size increased with an increase in saturation time up to 40 min, then it reduces due to cell size gradient.
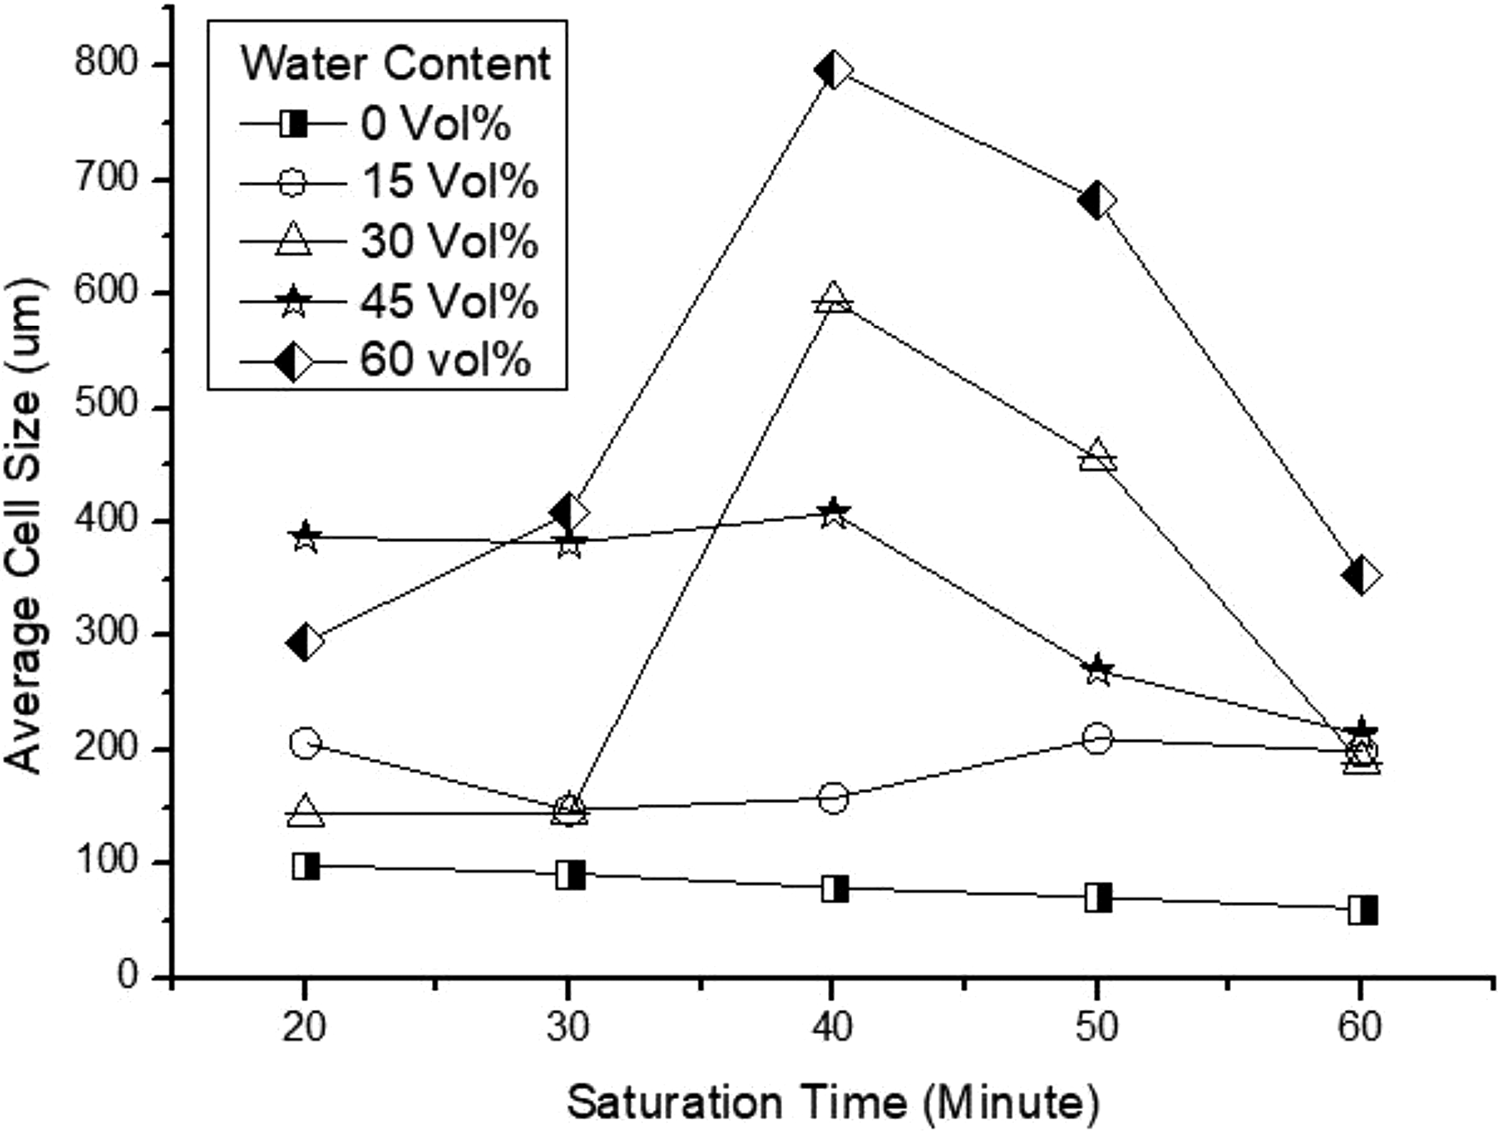
Effect of saturation time on average cell size at various co-blowing agent contents.
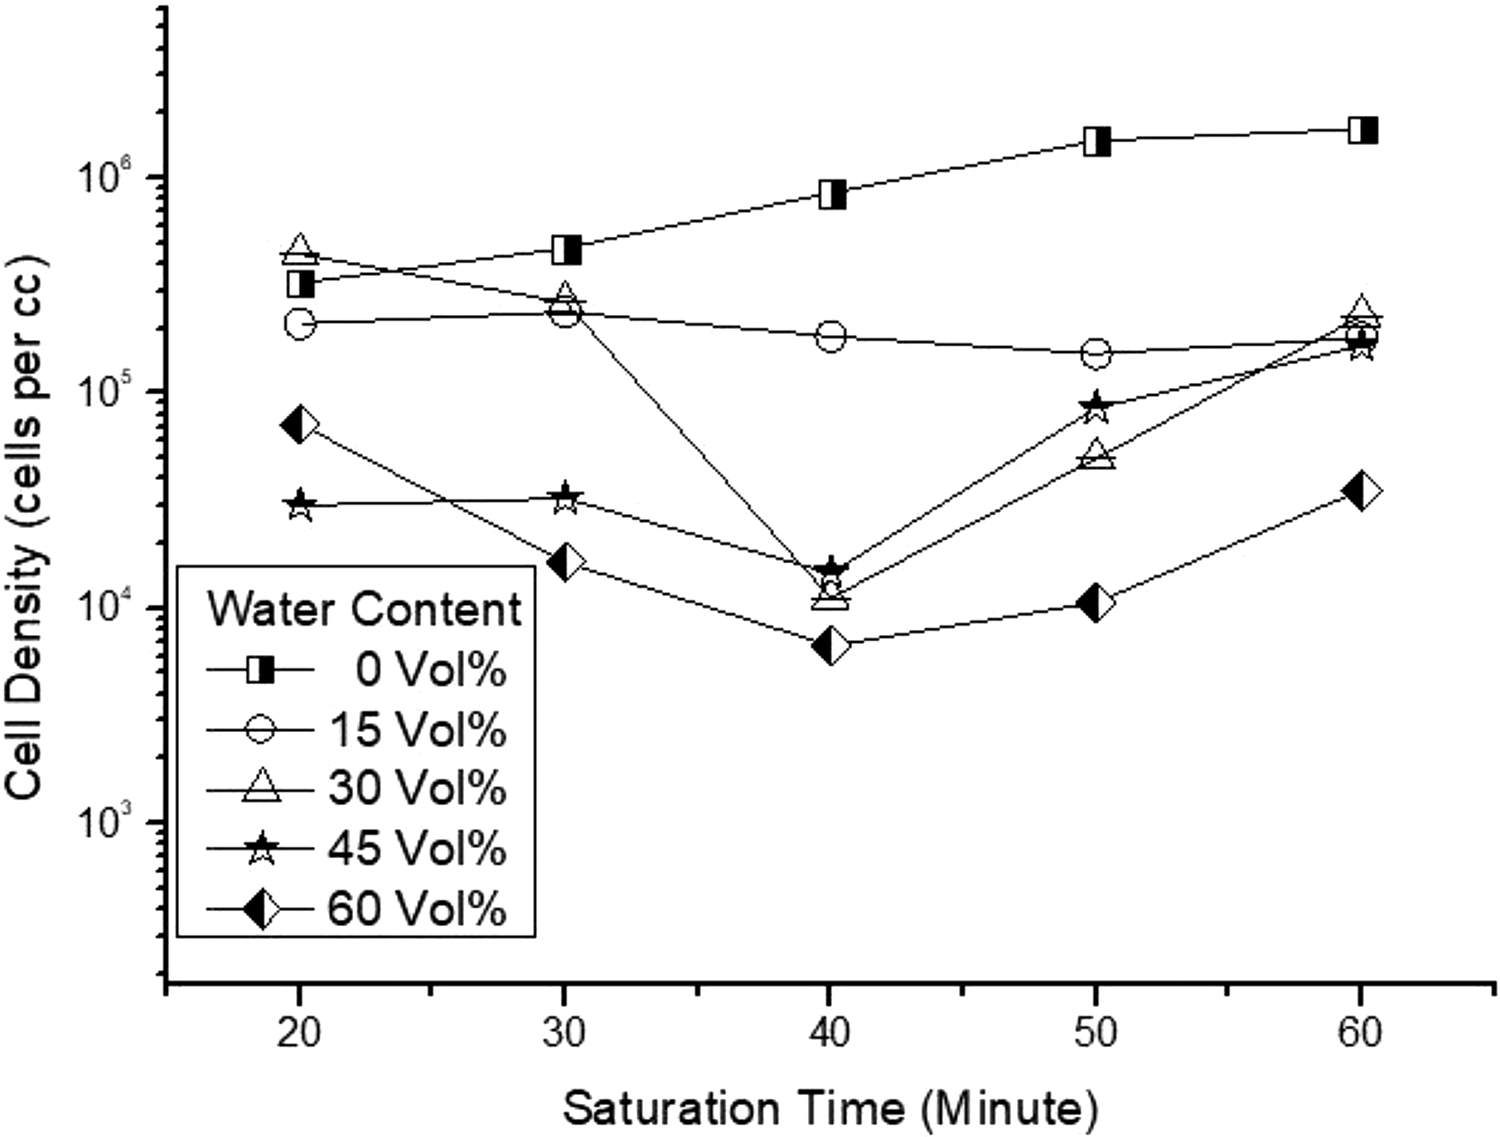
Effect of saturation time on cell density at various co-blowing agent contents.
Figure 23 illustrates the cell morphology at no water content (0 vol%) with variation in saturation time. It was observed that the closed spherical cell structure changed to closed polygonal cell structure due to higher cell density increases which were the result of more CO2 dissolution in the polymer matrix. 15
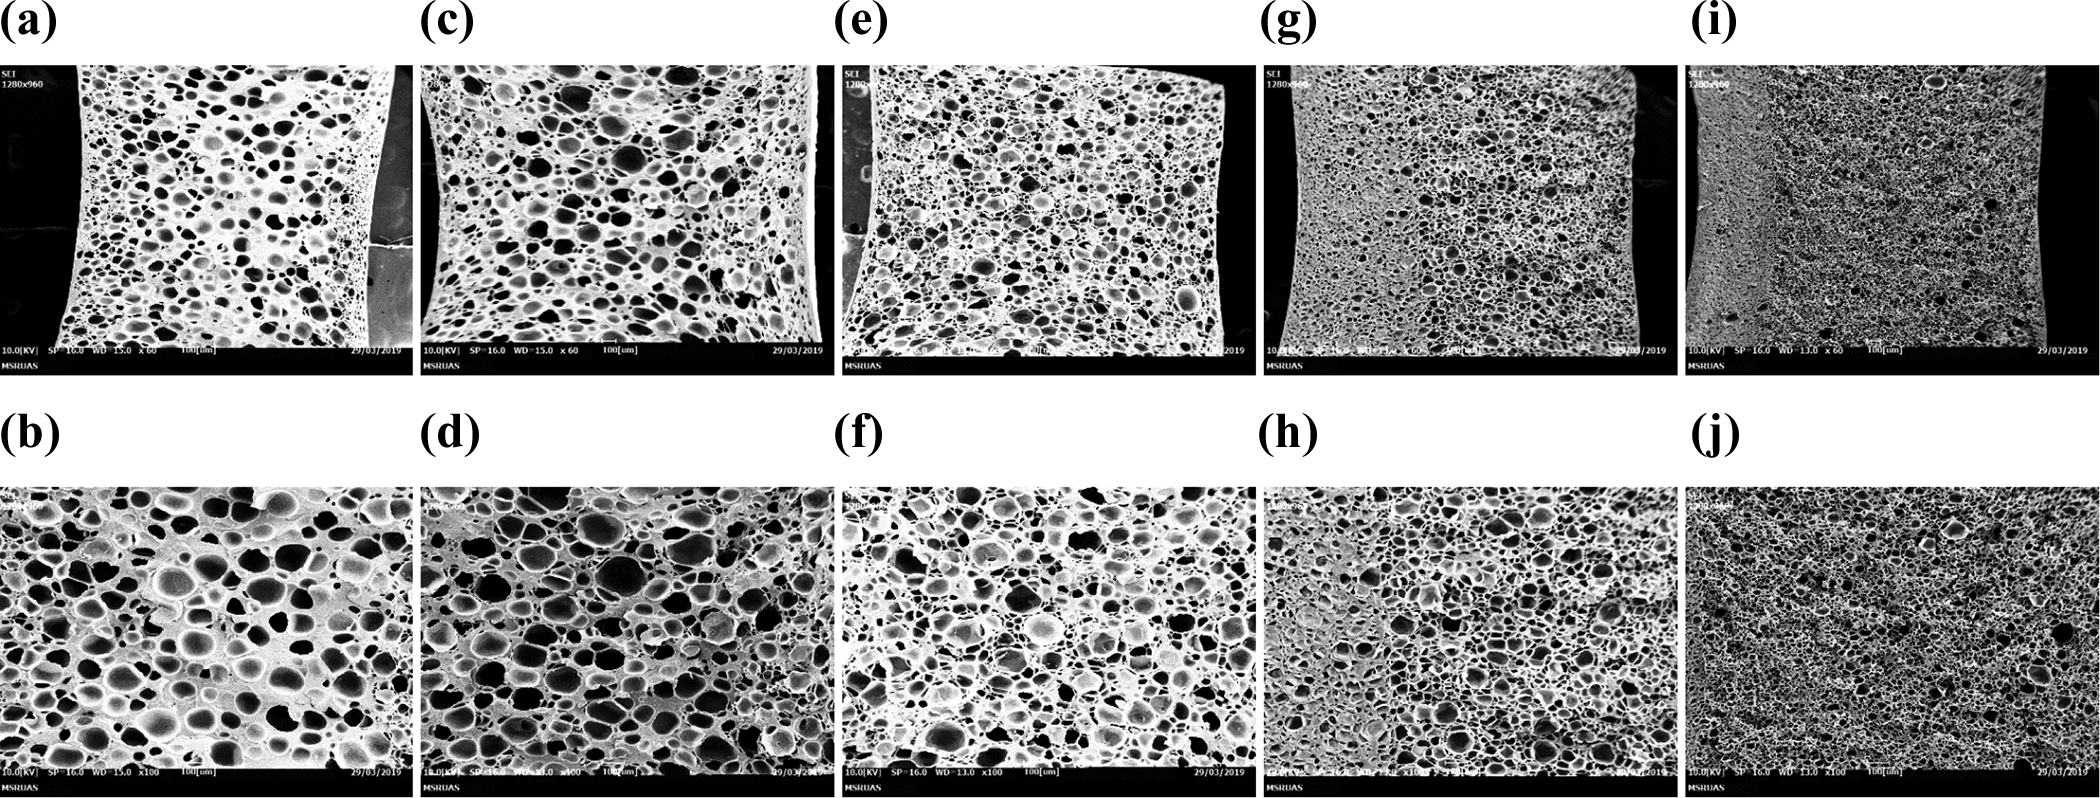
SEM micrograph at W C = 0 vol%, P S = 50 bar and T s = 120°C. (a) t s = 20 min, 60×; (b) t s = 20 min, 100×; (c) t s = 30 min, 60×; (d) t s = 30 min, 100×; (e) t s = 40 min, 60×; (f) t s = 40 min, 100×; (g) t s = 50 min, 60×; (h) t s = 50 min, 100×; (i) t s = 60 min, 60× and (j) t s = 60 min, 100×.
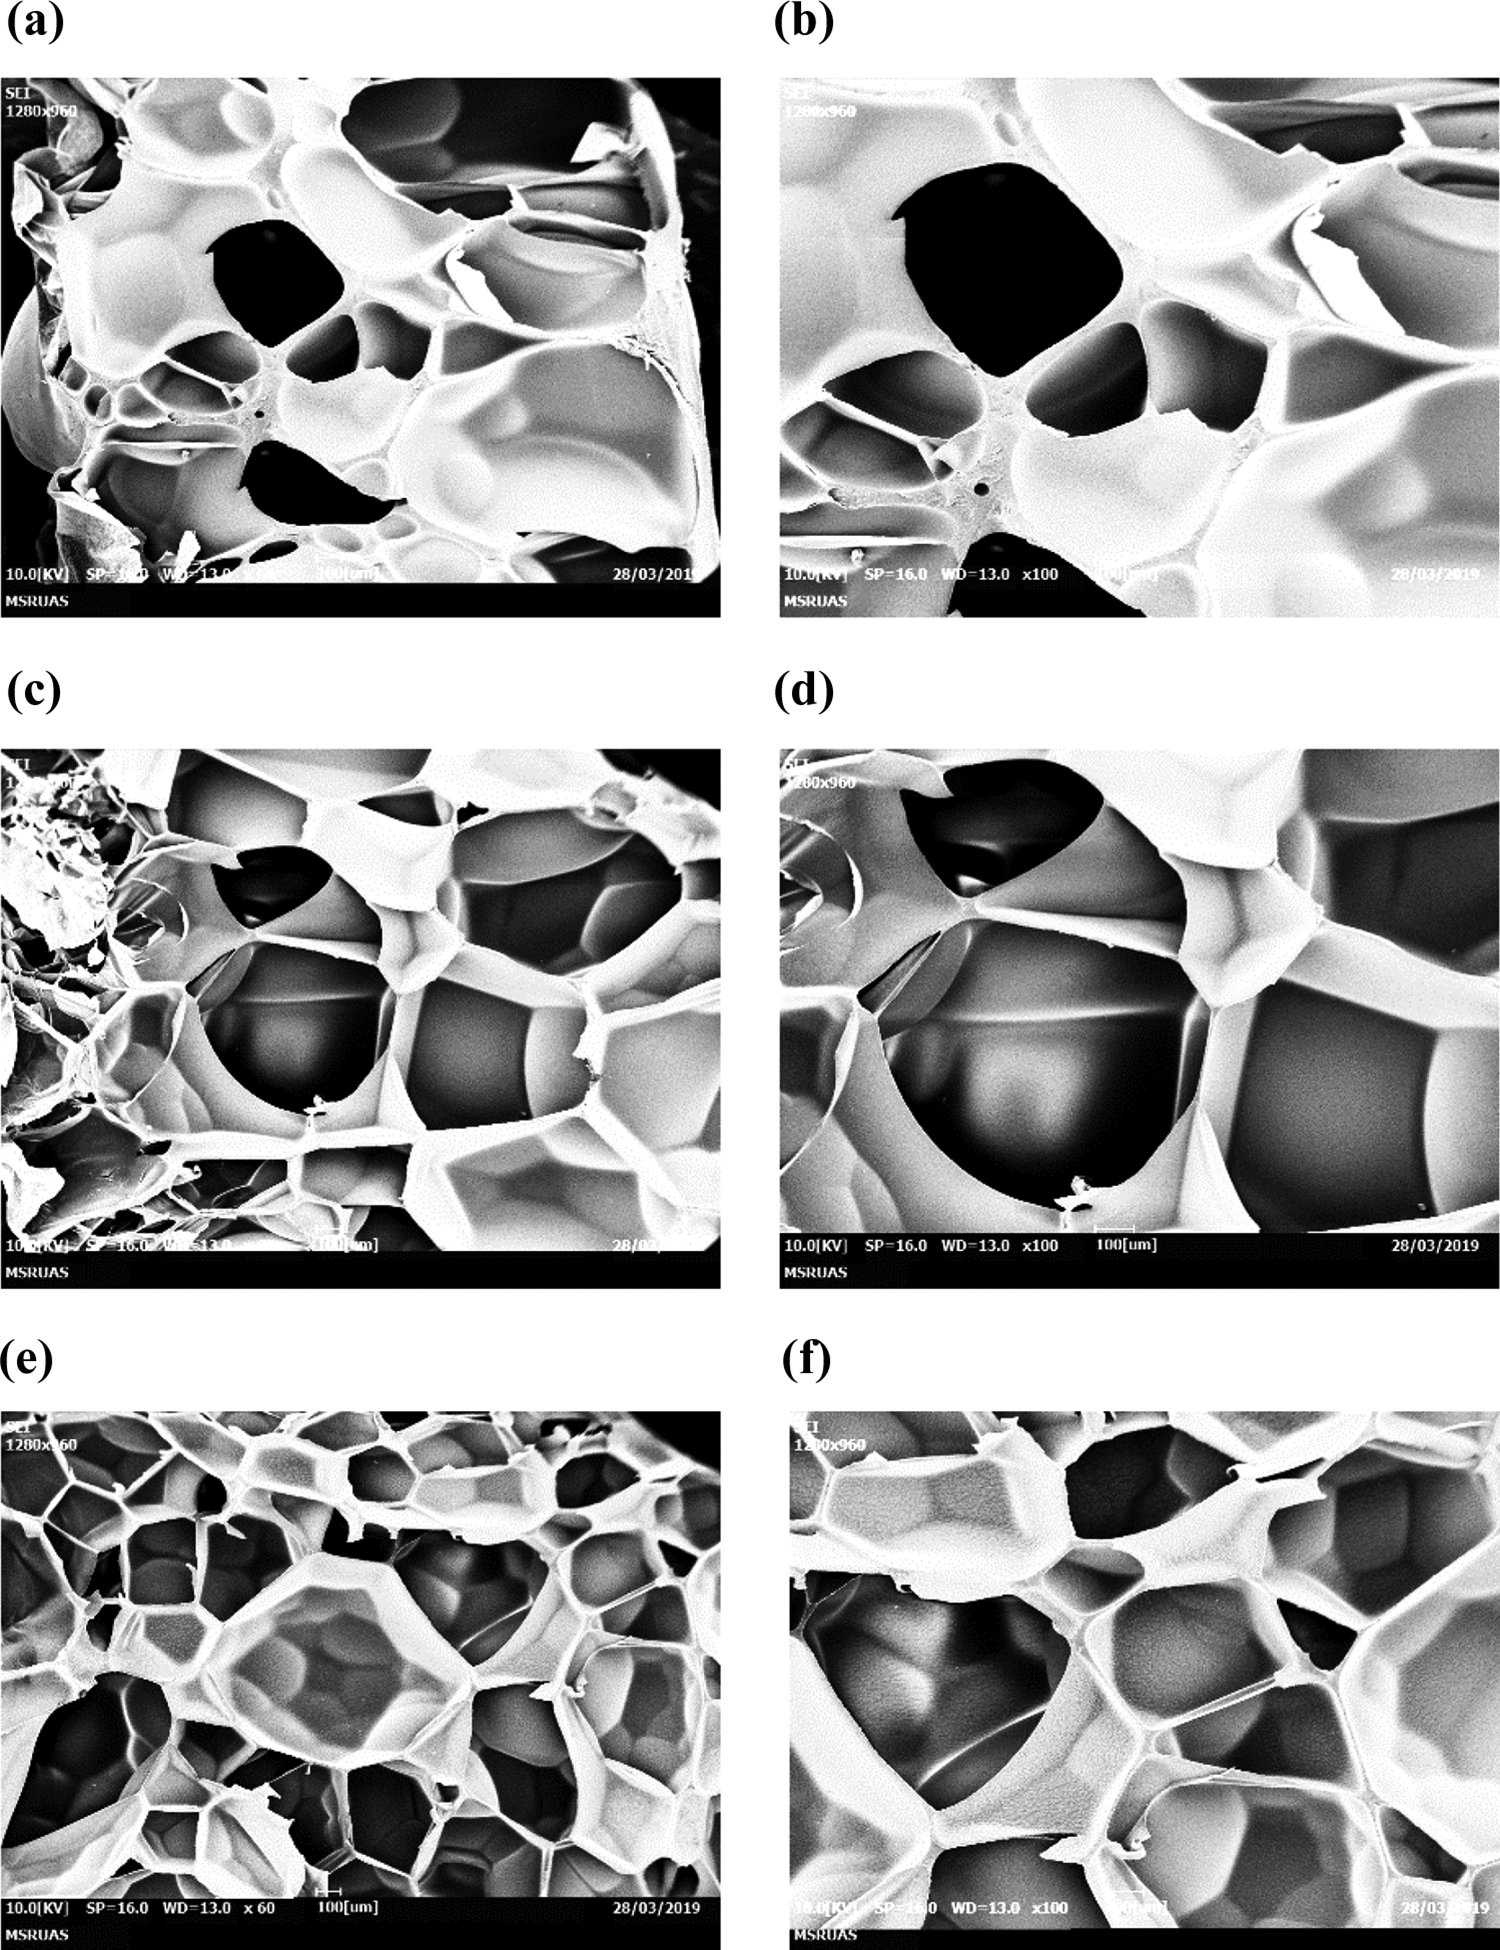
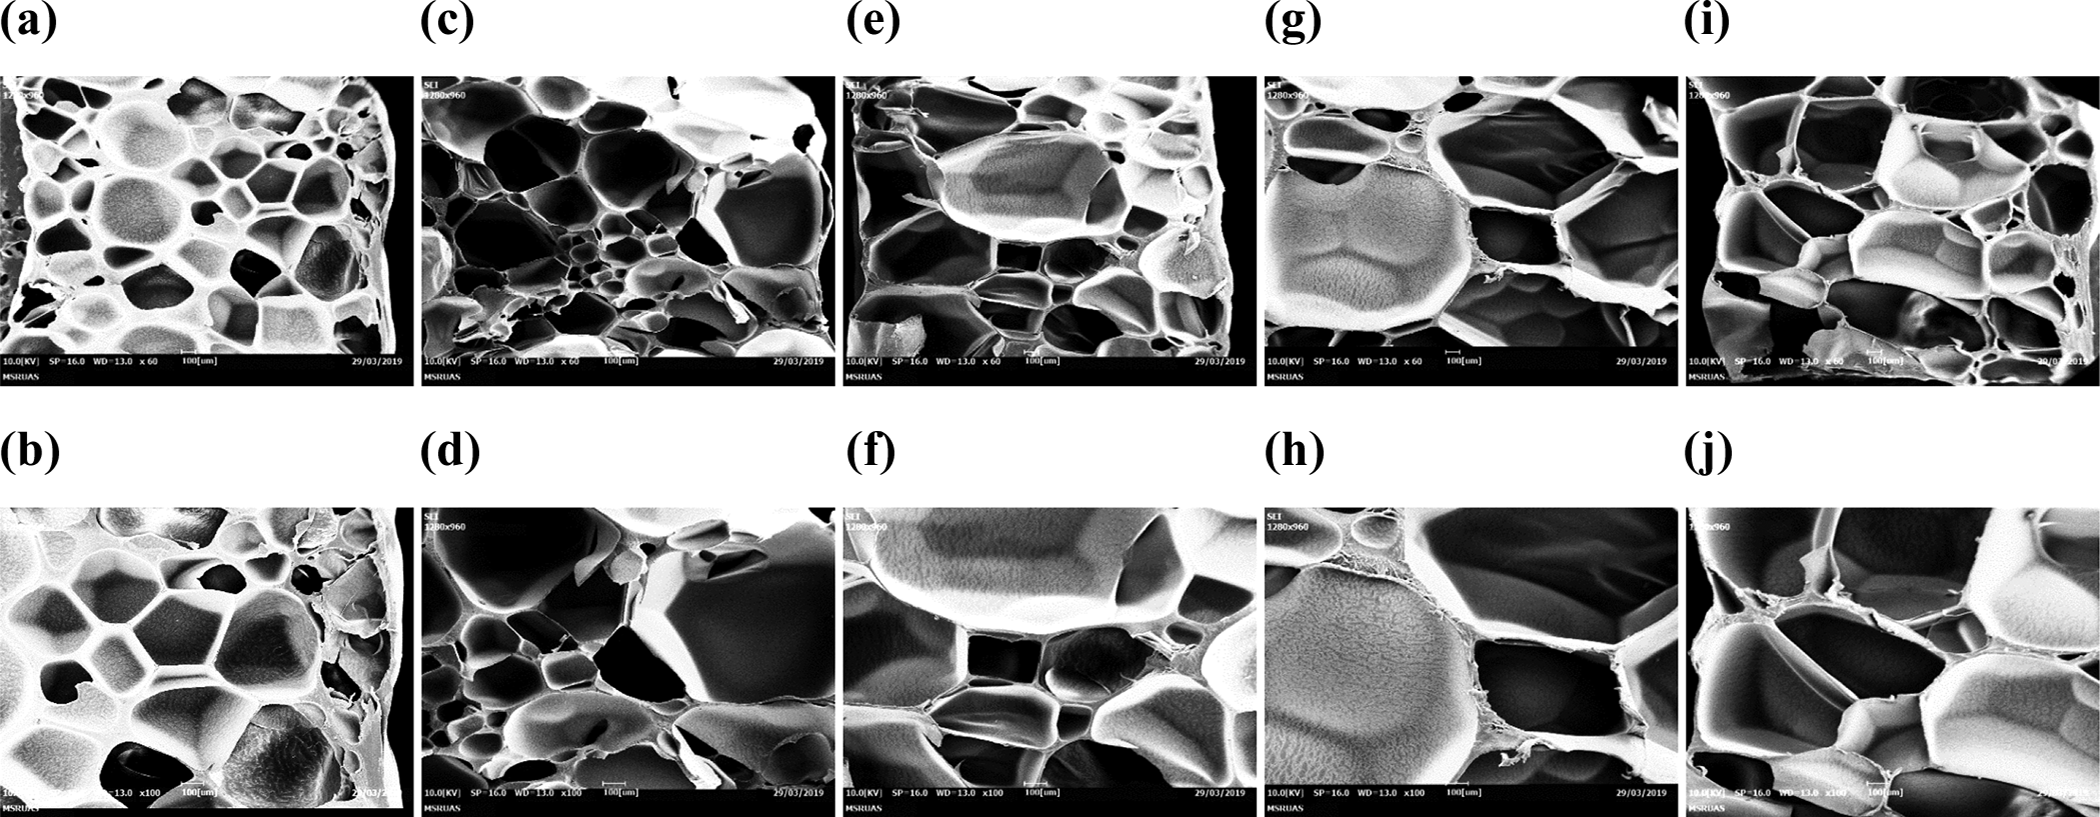
Figures 24 to 27 show the cell morphology of foam products at 15–60 vol% water content. The closed polygonal cell structure with larger cell near one surface and a smaller cell near one surface. This was due to the cell size gradient which was the result of two distinct blowing agent. The large cells due to water and smaller cells due to CO2.
SEM micrograph at W C = 15 vol%, P S = 50 bar and T s = 120°C. (a) t s = 20 min, 60×; (b) t s = 20 min, 100×; (c) t s = 30 min, 60×; (d) t s = 30 min, 100×; (e) t s = 40 min, 60×; (f) t s = 40 min, 100×; (g) t s = 50 min, 60×; (h) t s = 50 min, 100×; (i) t s = 60 min, 60× and (j) t s = 60 min, 100×.
SEM micrograph at W C = 30 vol%, P S = 50 bar and T s = 120°C. (a) t s = 20 min, 60×; (b) t s = 20 min, 100×; (c) t s = 30 min, 60×; (d) t s = 30 min, 100×; (e) t s = 40 min, 60×; (f) t s = 40 min, 100×; (g) t s = 50 min, 60×; (h) t s = 50 min, 100×; (i) t s = 60 min, 60× and (j) t s = 60 min, 100×.
SEM micrograph at W C = 45 vol%, P S = 50 bar and T s = 120°C. (a) t s = 20 min, 60×; (b) t s = 20 min, 100×; (c) t s = 30 min, 60×; (d) t s = 30 min, 100×; (e) t s = 40 min, 60×; (f) t s = 40 min, 100×; (g) t s = 50 min, 60×; (h) t s = 50 min, 100×; (i) t s = 60 min, 60× and (j) t s = 60 min, 100×.
SEM micrograph at W C = 60 vol%, P S = 50 bar and T s = 120°C. (a) t s = 20 min, 60×; (b) t s = 20 min, 100×; (c) t s = 30 min, 60×; (d) t s = 30 min, 100×; (e) t s = 40 min, 60×; (f) t s = 40 min, 100×; (g) t s = 50 min, 60×; (h) t s = 50 min, 100×; (i) t s = 60 min, 60× and (j) t s = 60 min, 100×.
Conclusions
Ultralow density ABS polymer foams were developed at various levels of different saturation parameters with the variation of the content of the co-blowing agent, further its morphological attributes were investigated comprehensively. It was found that the co-blowing agent addition in the microcellular foam process plays a substantial role in the enhancement of cell size and the expansion ratio. The effect of co-blowing agent content with saturation temperature was found to be highly significant than the co-blowing agent with other saturation parameters. The expansion ratio was obtained in the range of 2.2–29.9, 1.0–23.6 and 2.6–22.4 for the studies with varying saturation temperature, saturation pressure and saturation time, respectively. The saturation temperature of 130°C was found to be the most optimum temperature for getting the maximum expansion ratio. In this study in case of water content, the average cell size obtained ranges from 143.5 µm to 878.5 µm and cell density ranges from 528.2 cells/cc to 4.4 × 10⁵ cells/cc. And in case of no water content, the average cell size ranges from 60.9 µm to 372.05 µm and cell density ranges from 3.6 × 10⁴ cells/cc to 1.6× 10⁶ cells/cc. The most probable increase in water content at the same saturation parameter causes the enhancement in cell size and a decrease in cell density. To conclude, it was found that with the introduction of water as a co-blowing agent in the microcellular foaming process, the cell size expands and morphological attributes could be effectively controlled and tuned for the respective end of applications.
Footnotes
Declaration of conflicting interests
The author(s) declared no potential conflicts of interest with respect to the research, authorship, and/or publication of this article.
Funding
The author(s) disclosed receipt of the following financial support for the research, authorship, and/or publication of this article: Financial assistance has been received from the Department of Science and Technology, Government of India, under the project titled ‘Development of Microcellular & Nanocellular 3D Printing Process to Manufacturing Acrylonitrile Butadiene Styrene Foamed Products’.