
Abstract
There is a growing need for 3D printing of polymer structures in a cost-effective way and green. This study presents an experimental approach to investigate structural parameters effects on mechanical properties of polylactic acid (PLA) hollow-sphere structures manufactured with fused deposition modeling (FDM). The mechanical behavior characteristics of square_hexagonal stacking, closed_open porosity and parallel_perpendicular compression direction compared to the direction of manufacture under quasi-static uniaxial compression are examined using Taguchi method. The S/N ratio analysis and the Analysis of Variance (ANOVA) were used to find the optimal parameters that improve the mechanical properties (Young modulus, yield strength) and to provide a significant ranking of the different parameters analyzed in this paper. It was found that the optimum level and significance of each process parameter vary for “hexagonal cells,” “open porosity” and “parallel direction.” The optimal values of the results give a Young modulus E of 90.12 MPa and a yield strength
Introduction
Additive manufacturing (AM) offers an extraordinary opportunity for innovation and growth for manufacturing companies. It defines how products are designed, manufactured, controlled and distributed using emerging technologies. AM refers to a group of techniques that fabricate object directly layer by layer. These technologies are on the axis to influence new designs and new applications in multiple fields such as automotive, biomedical, electronics, aerospace packaging and structural engineering, moreover the jewelry and fashion.1,2
Fused deposition modeling (FDM) is one of the most widely used additive manufacturing techniques. The process consists of depositing molten wire layer by layer, from a 3D model. 3 FDM is capable of yielding strong plastic parts as bond forms between successive layers because of partial or full melting of the feedstock filaments. 4
Over the years, light materials such as foams and hierarchical parts with high porosity have been used extensively in the fabrication of structures because of their important mechanical properties. 5 Fabrication of cellular structures via FDM process has attracted a lot of attention over the last decades thanks to the advent of additive manufacturing technology thereby development of architecture-controlled porous biomaterials and for excellent properties.6-8 Hollow-sphere structures HSS (or stacking) media exist widely in our daily lives as well as in natural materials such as the cork, the os, sponges, etc. It is also widely used in different types of materials like metallic foams, polymer, polystyrene and materials sandwich. 9 Cellular hollow-sphere structures have been studied because of their interest for various applications. 10 Similarly, to polymer foams or honeycombs, high specific mechanical properties and multi-functional materials are expected, like a high specific stiffness/strength, energy absorbing performance by large plastic deformation, which are therefore easily available to be used as a core material of sandwich structures (as beams) in many protective engineering applications. 11 Another main advantage of cellular materials is their capacity to dissipate mechanical energy thanks to the plastic collapse of their constitutive cells. 12 The mechanical performances such as the compressive strength, elastic modulus and stress–strain results have been widely discussed, as defined by Gibson and Ashby.13,14 These 3D porous structures consist of several layers of different orientations and their properties can be changed through a number of variables including, cell diameter, 15 diameter of struts, 16 orientation, 17 stacking cells, 18 etc. The properties of these structures can be modified by the pore morphology, their dimensions and their stacking. 19
About the mechanical characterization of porous structures, especially that are manufactured by 3D printing with at high rates of deformation. Recent studies have investigated the mechanical efficiency of porous structures printed in 3D with several types of cells. Recently, Song et al. 15 studied hierarchical structures with micro-macro porosity (rectangular pores) architectures adapted to bone engineering applications. PLA poly-lactic acid has been innovatively mixed with polyvinyl alcohol PVA to prepare a composite filament for the parts manufacture via Fused Deposition Modeling (FDM). Macropores of size > 100 µm show more precision by the FDM process. Corcione et al. 20 investigated porous materials (PLA/hydroxyapatite microsphere) manufactured by FDM process, the purpose of which is to increase bone regeneration capacity. They observed that the higher porosity of the composite specimens compared to PLA ones, most likely caused a decrease of the mechanical performances of the PLA/sdHA specimens. Composite material showed stiffness values compatible with that of bone tissue. Wang et al. 21 created closed-cell foams using polylactide (PLA) as the base material. They observed that the PLA foams with regular meso-structures are more probably to induce local collapse during compression test, and those with random structures show good performances. The experimental results further indicate that random foams where loading direction is perpendicular to the deposition layers have greater strength than those with a different orientation. Gautam et al. 22 examined the compression performance of the Kagome unit cell of acrylonitrile butadiene styrene (ABS +) manufactured by Fused Deposition Modeling. The influences of manufacturing orientation, beam radius, and surface roughness on stiffness and strength are critically shown. the change of orientation of the construction to improve the stiffness and maximum strength by 19% and 23%, respectively.
Zhou et al. 23 studied porous structures hierarchized in polylactic acid (PLA) with macro-pores by FDM. The design of porosity could offer innovative opportunities to control the performance of pores (cells) in 3D structures. Tsouknida et al. 24 examined the influence of density, layer heights, filling patterns on the energy dissipation properties of porous cylinders printed in polylactic acid (PLA). Results showed that a great dependence of density on the absorption capacity of impacts. Friedl et al. 25 conducted experimental characterization on Hollow Spherical Structures (HSS) in stainless steel developed by powder metallurgy for both compressive and tensile loads. Their results show a lot of information on the mechanisms that govern the mechanical response of HSS, as well on the sensitivity of their behavior to several constitutive parameters, such as their relative density, sphere thickness or diameter. Sing et al. 26 prepared two-unit cell types, square pyramid and truncated cube-octahedron for Tissue structure using SLM. They observed that the elastic constant in compression of the lattice structures increases with an increase in relative density. Analysis of Variance (ANOVA) is also used out to determine the significance of various process parameters on the compressive strength and the dimensional accuracy. The experimental results further reveal that geometrical design parameters such as strut diameter and unit cell type have significant effects on the elastic constant of the lattice structures. Almela et al. 27 discussed the advantage of 3D printing to fabricate a bilayer TCP based controllable scaffold that replicates the cortico-cancelous alveolar bone architecture. They observed that the Mechanical properties were within the range of human cancelous bone with 10.0 ± 2.4 MPa strength and 55.5 ± 5.7 MPa young’s modulus.
Based on the aforementioned pre-requisites, one major aim in porous structure production is to maintain control over macro-structural properties (such as a density, porosity, mechanical properties) and micro-structural properties (such as a pore size, pore distribution, stacking cells, pore interconnectivity). 28 Development of additive manufacture (AM) methods such as FDM has significantly improved control over the pore network architecture of polymer hollow spherical structures. To our knowledge, there is a paucity of information on polymer hollow spherical structures manufactured by FDM. Besides, the influence of structural parameters for 3D parts with spherical cells on mechanical properties using the experimental design methodology has not yet been investigated. In this study and through to the fused Deposition Modeling (FDM) technology, specimens porous with different structural parameters such as stacking cells, type of porosity and compression direction compared to direction of layer deposition have been studied and evaluated using Taguchi method.
Materials and methods
Materials and manufacturing conditions
3D printing was performed on a Raise 3D Plus printer with a nozzle diameter of 0.4 mm, using PLA filament with a diameter of 1.75 mm with a density of 1.25
Taguchi method
Taguchi method was first designed by Genichi Taguchi for improving quality of manufactured products. Recently. the method is also applied in other fields such as marketing. advertising. engineering and biotechnology. Using this method, the optimum parameters are obtained using several limited experiments. Therefore, the time and costs of the experiments decrease significantly. 29 In this method. orthogonal standard arrays are set for choosing the minimal experiments giving full information of all factors affecting the performance parameters. The set of experiment parameters with maximum signal to-noise ratio (S/N) is introduced as the optimum experiment.
Experimental procedures
Factors that affect the performance of a structure printed by the FDM process are versatile and include material parameters, porous structure, software settings, and operating environment (Figure 1). In this study, we focus on the parameters related to the porous structure, which includes pores morphology. The detailed effects of three factors chosen are as follows.
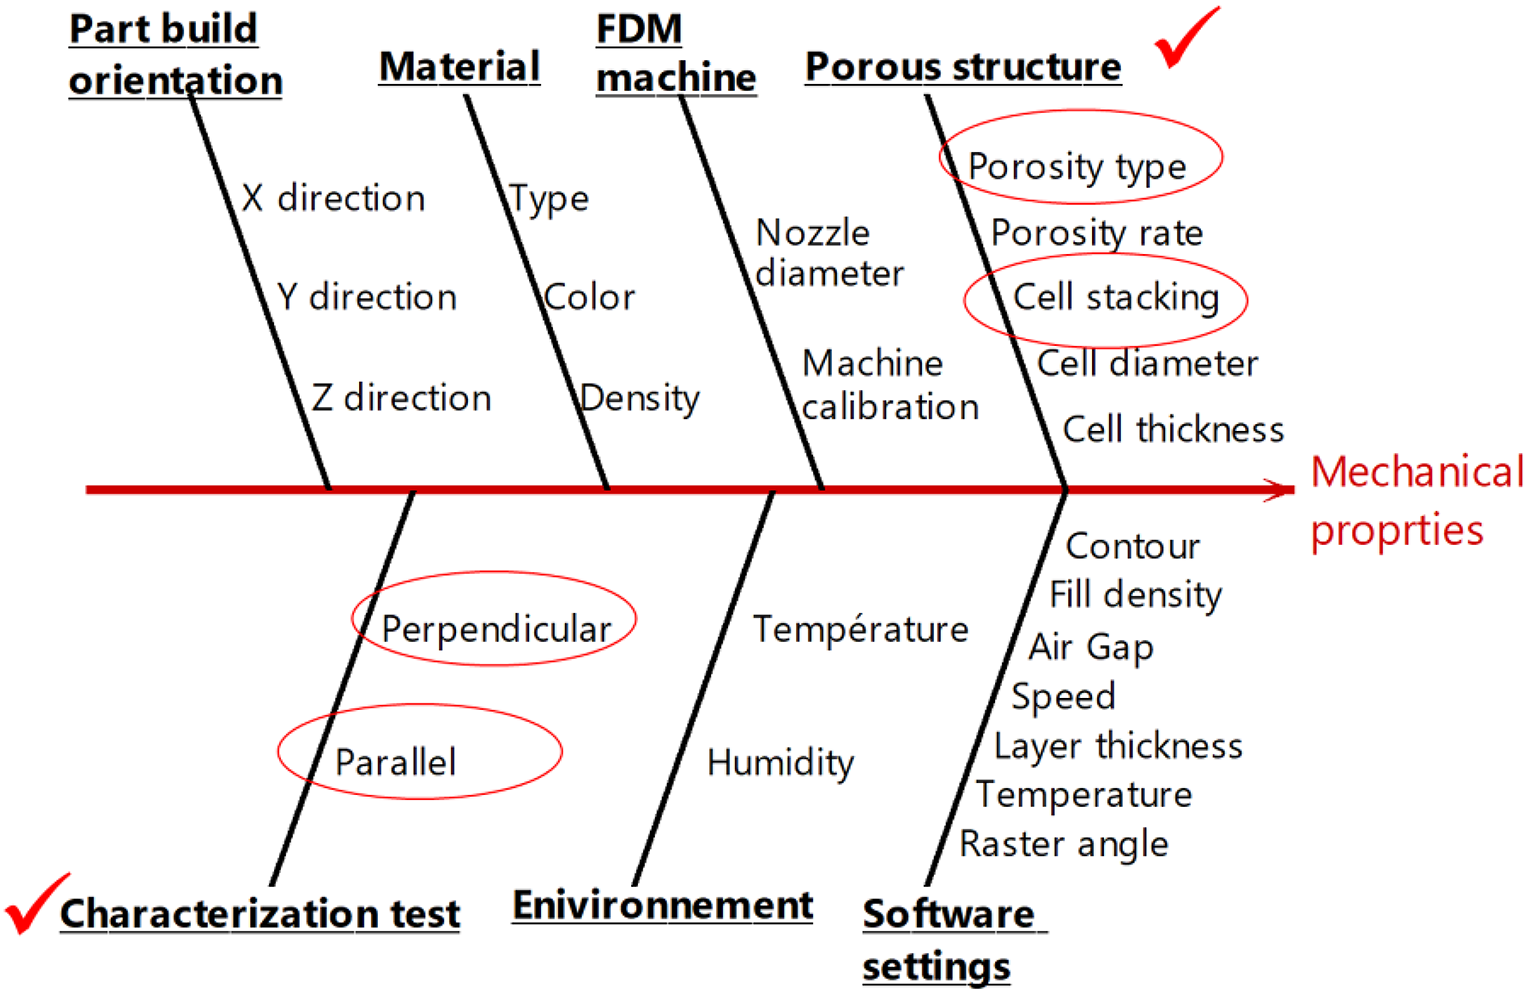
The cause and effect diagram.
Usually, the type of cell stacking (square or hexagonal cell) in the porous structures is a critical parameter that influences the mechanical properties and collapse mechanism, the second important factor is the nature of the porosity between the cells (open or closed cells). Therefore, it is necessary to identify and study this parameter. The third factor adopted is the direction of compression test compared to the direction of manufacture (parallel or perpendicular), due to the layer deposition strategy. Figure 2 shows the flowchart of the experimental procedures. First, the problem and the parameters are defined. To improve the efficiency of experiments, a Taguchi fractional design method is used to screen the main factors and their effects among the three factors adopted. Subsequently, study the effects of each parameter level to optimize the responses, and finally the optimal result is verified. The experiments were carried out with three variables (factors or parameters) and two discrete values (levels) for each variable (where each level is represented by the values of 1 and 2): stacking cells, porosity type and compression direction. Table 1 shows the factors selected and their levels.
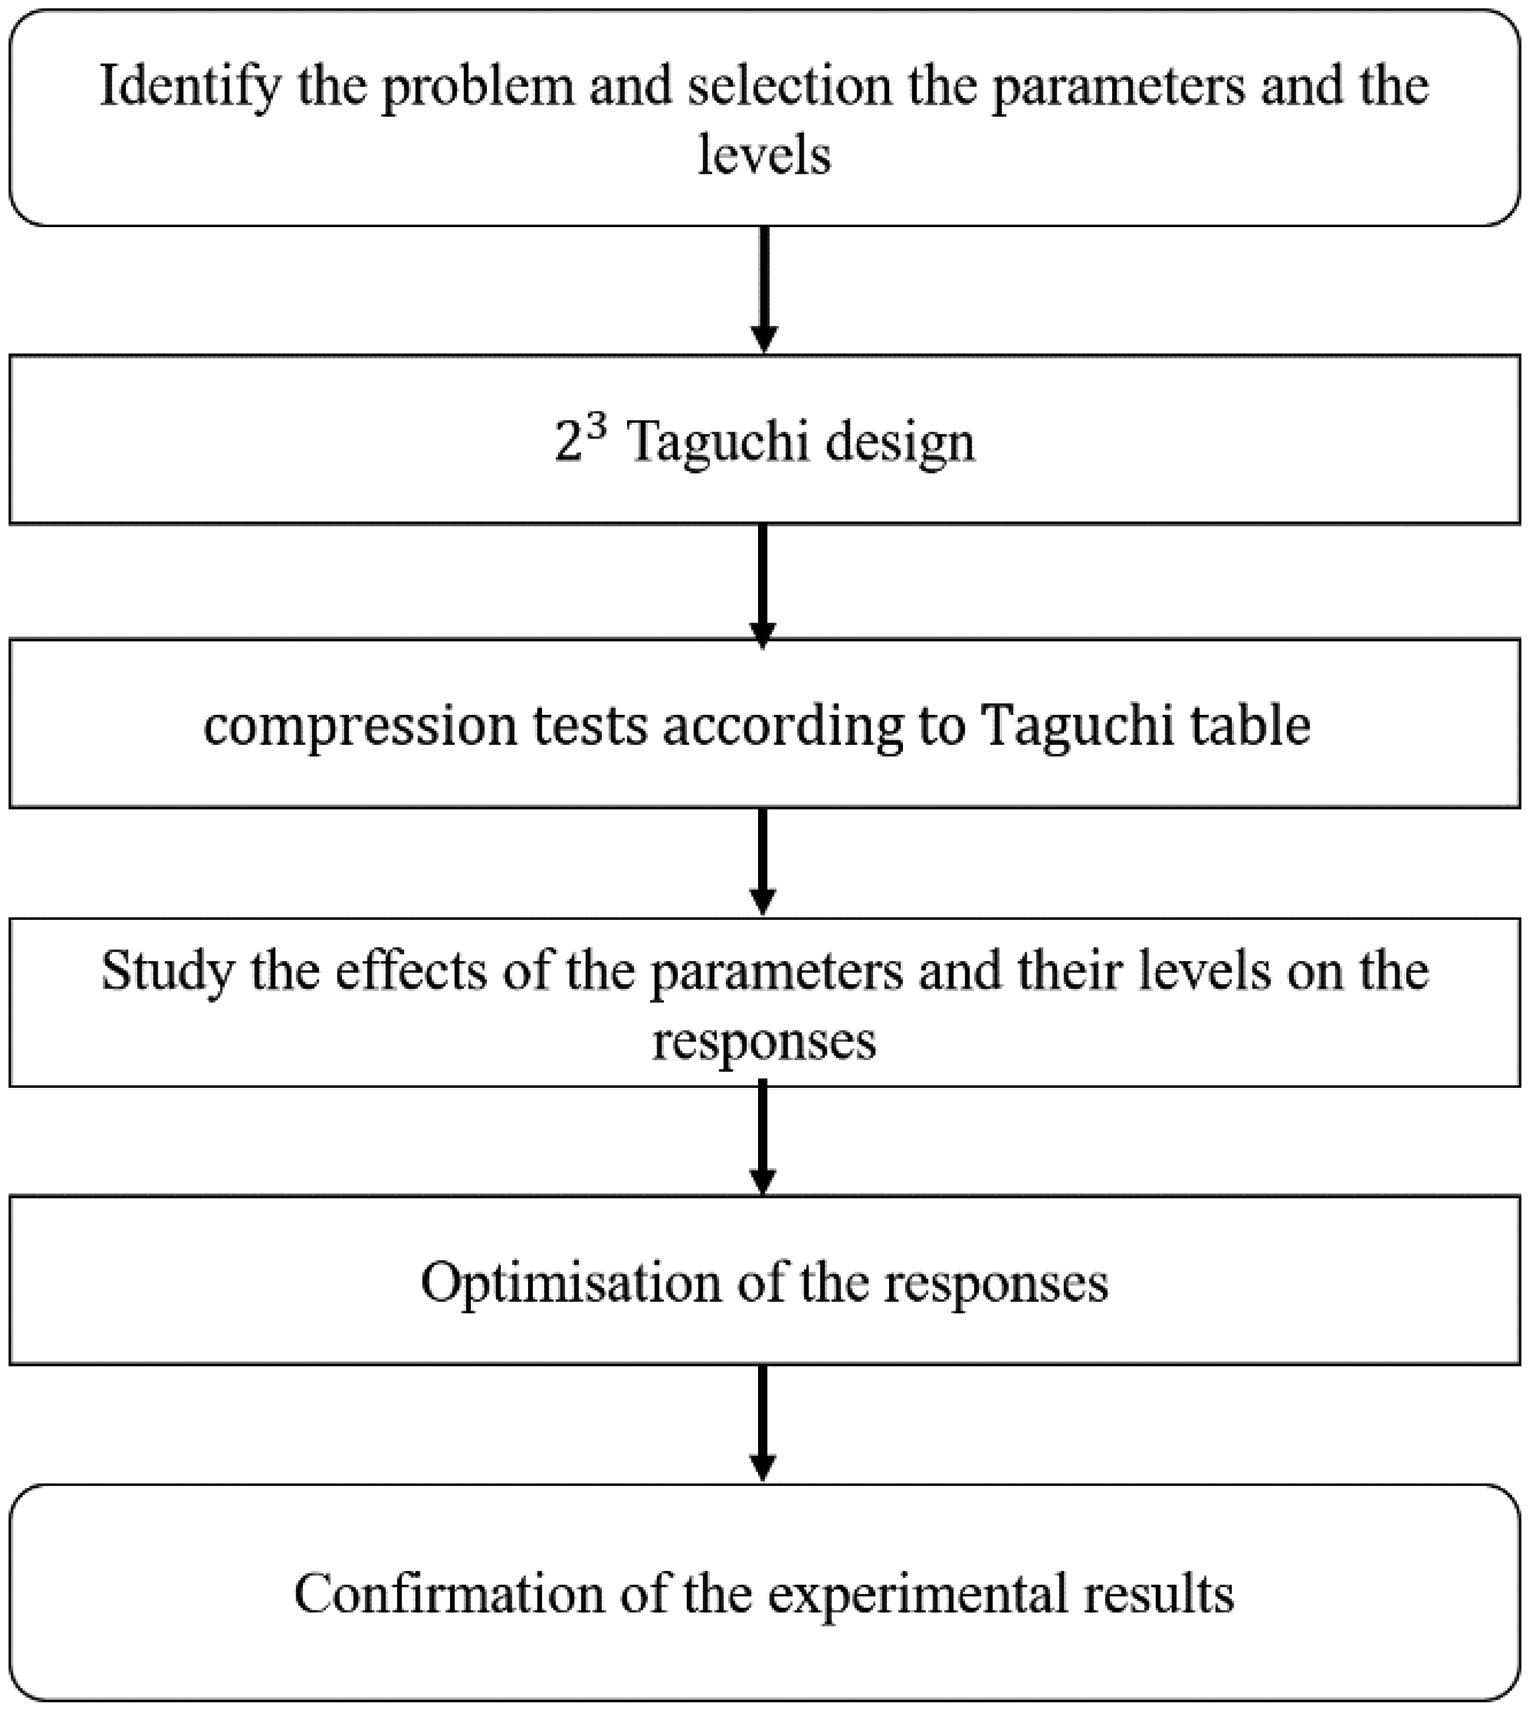
Experimental procedure.
The levels of each factor.
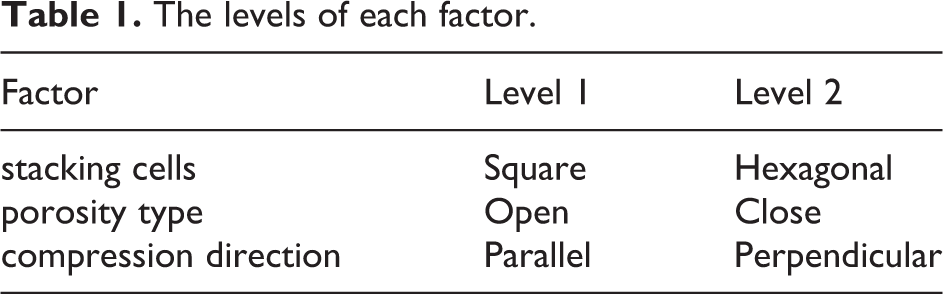
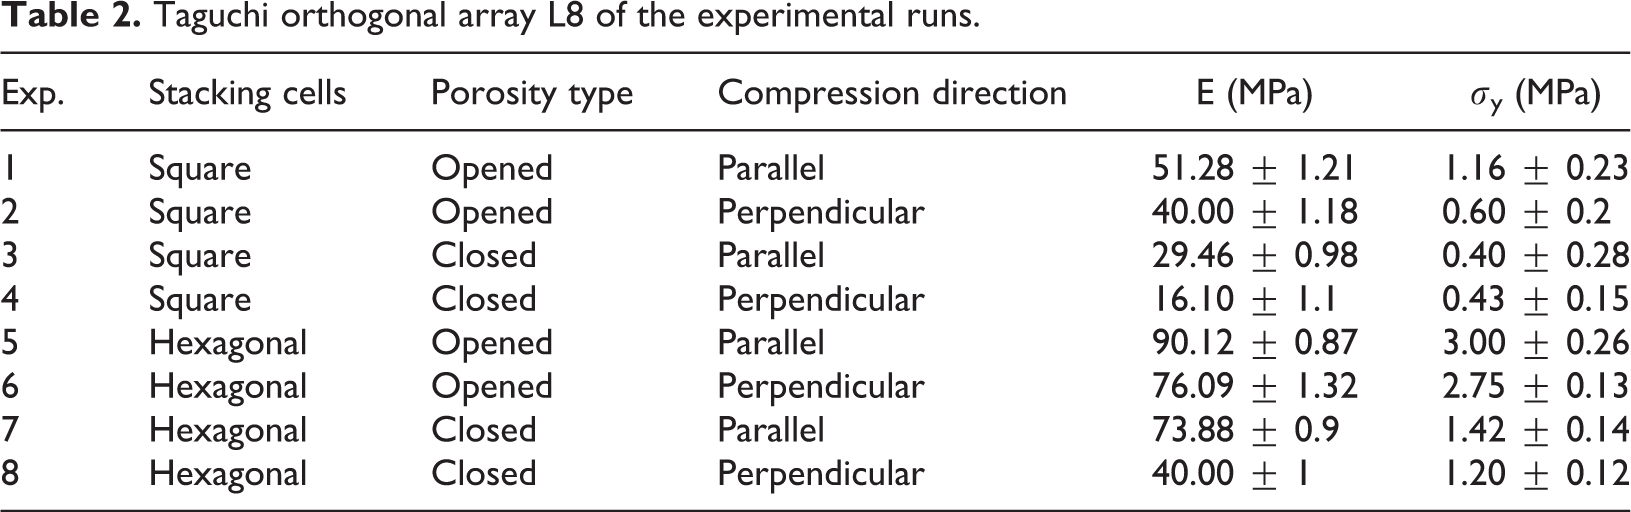
Table 2 presents the L8 Taguchi selected in this search with the assigned parameters. The table consists of four columns, which were assigned the three factors and eight rows that define the eight trials conditions that have to be performed. Across the row, it is possible to read the discrete values, at the high level (level 1) and low level (level 2), that must be assumed during the experiment, the response variables are the Young’s modulus (E) the yield strength (
Taguchi orthogonal array L8 of the experimental runs.
The dimensions of the prepared specimens are 40 × 40 × 40 mm with an equivalent cell diameter of 10 mm. Furthermore, the print raster has a thickness of 0.4 mm, a layer height of 0.15 mm along the Z axis with a nozzle diameter of 0.4 mm, as shown in Figure 3(a) and (b). The regular configurations were prepared with the stacks of the corresponding specific cells. The temperature of the nozzle is 190° C, the temperature of the heated bed is 60°C and the printing speed is 80 mm/s. These structures are based on four types of morphology. Two porosities were obtained; Open porosity where the distance between the centers of the two spheres is 8 mm, and closed if the connection of 0 mm (Figure 3(c)). Figure 3(b) shows the orientation of the samples in relation to the direction of manufacture during the compression tests.
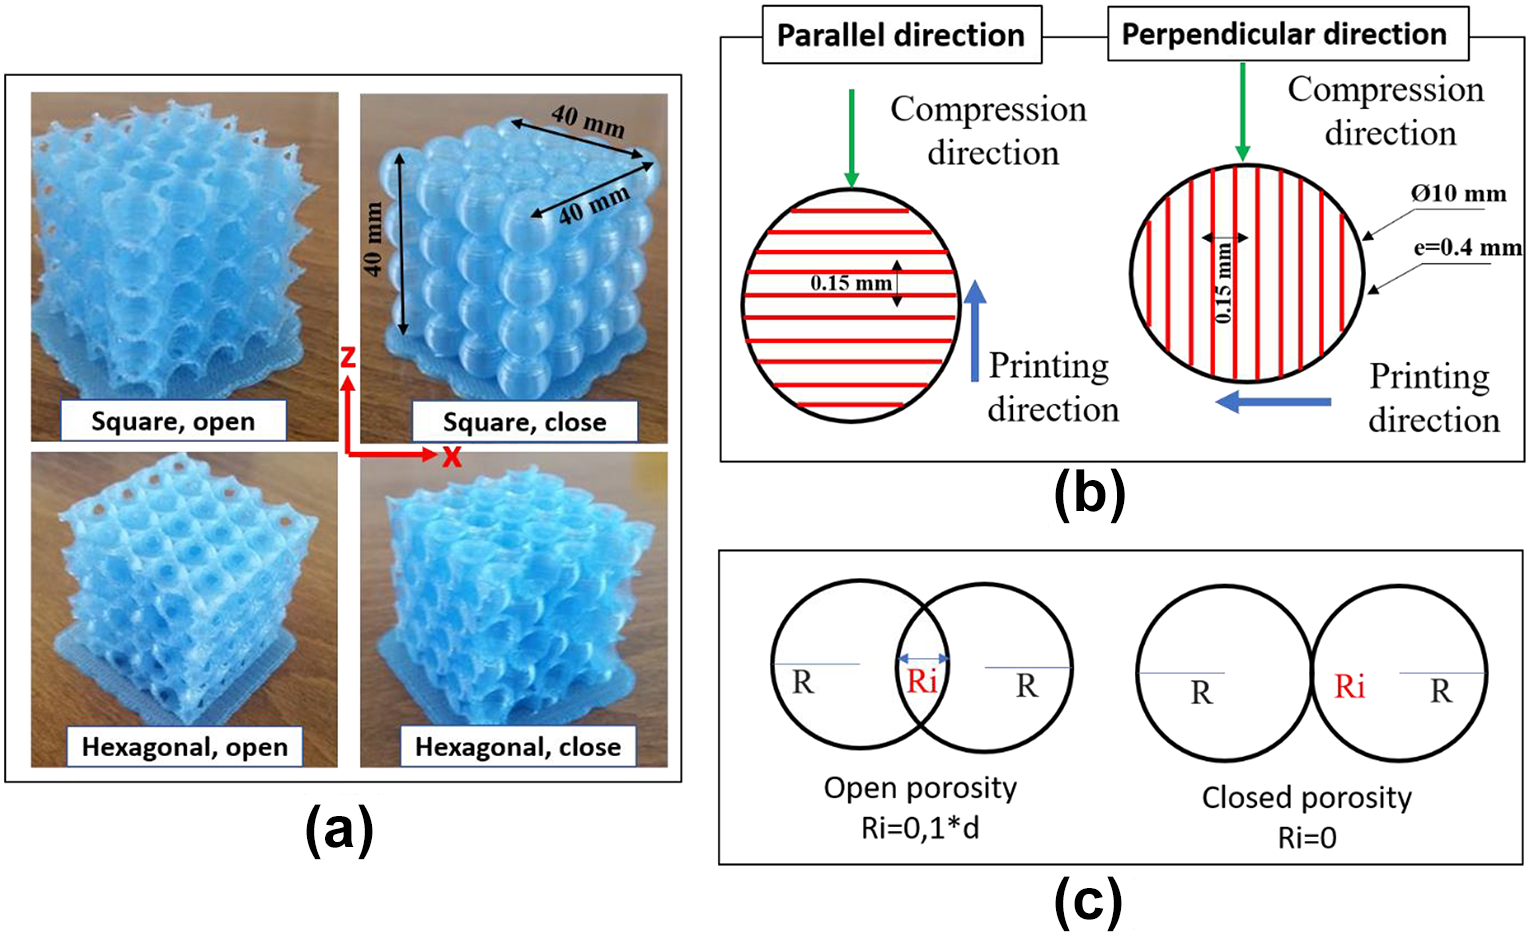
(a) Representation of manufactured structures according to the Taguchi table. (b) Direction of compression test with respect to the direction of manufacture. (c) Open and closed porosity.
Figure 4 shows specimens with different unit cell morphologies manufactured successfully using the FDM process. It could be observed that the specimens successfully approximate the pore morphology of the CAD models. As a result, a fully connected/interconnected porous cell network with all the features designed was retained in the 3D manufactured samples. It is observed that the layers of the spherical cells are solid, connected and continuous, which indicates a good melting of the PLA during the FDM process, although there are imperfections and defects. We can mention that all specimens were manufactured without support, because with FDM printing, each layer is printed as a set of heated filament threads which adhere to the threads below and around it. Each thread is printed slightly offset from its previous layer. This allows to build a model with overhang up to 45° angle, allowing prints to expand beyond its previous layer’s width. When a feature is printed with an overhang beyond 45°, it can sag and requires support material beneath it to hold it up. It can be noted that the distance between the centers of the spherical unit cells for the open-pore structures is 8 mm which is less than the diameter of the spheres. The configurations illustrated in Figure 4(a) to (d) are square stack with open-porosity, square stack with closed-porosity, hexagonal stack with open-porosity and hexagonal stack with closed-porosity, respectively.
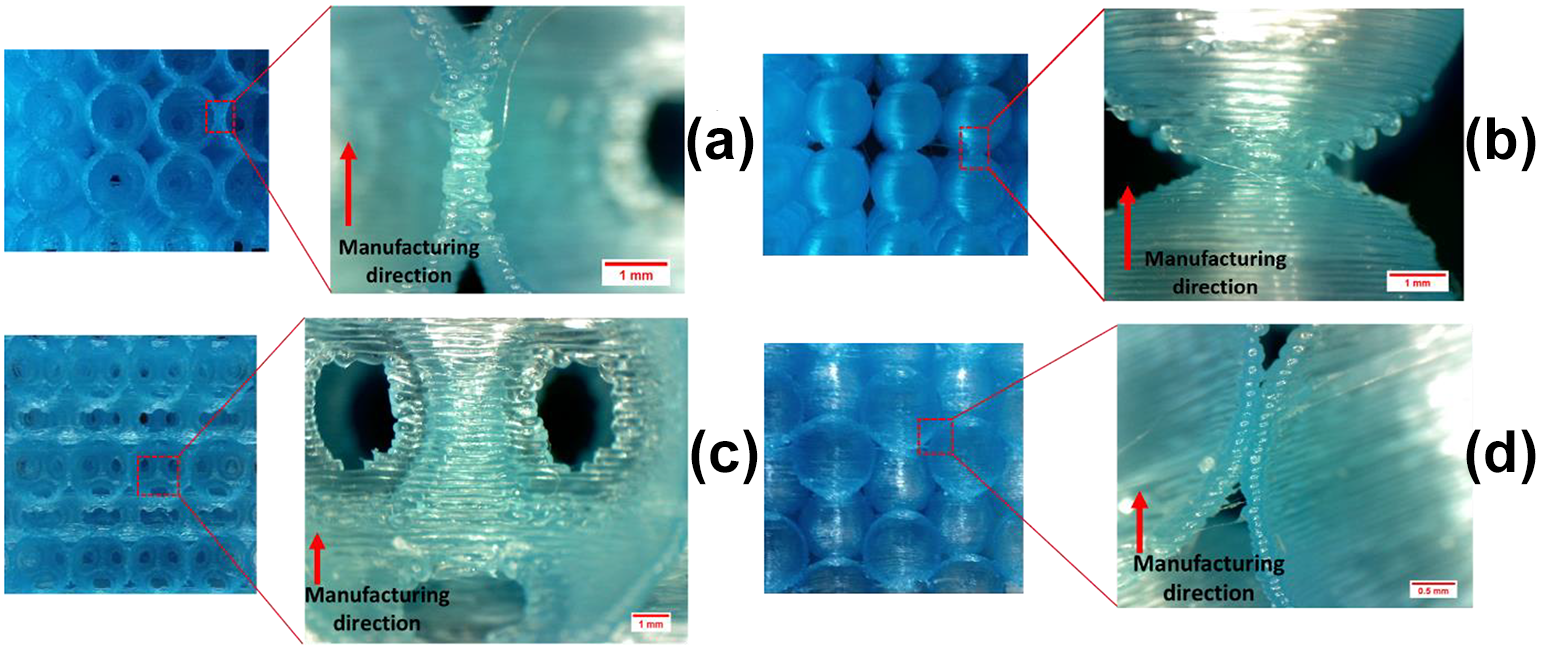
Microscopic images of 3D specimens: (a) square stack with open porosity, (b) square stack with closed porosity, (c) hexagonal stack with open porosity, (d) hexagonal stack with closed porosity.
Mechanical compressive test
Quasi-static compression tests were performed on a testing machine with a load capacity of about 5 kN. The specimens were placed on a fixed circular plate as lower holder and they were loaded using a movable plate as upper holder, the tests were implemented with 1 mm/min head speed and force displacement data were registered. 30 Stress-Strain curves were accordingly generated considering 1600 mm2 cross sectional area for calculating stress. Two cameras were used to catch pictures and videos of the structures during the test. Figure 5 shows the experimental setup used to test the structures under compressive load. Corresponding to all of the stress strain curves. Young modulus and yield strength were calculated according to the slope of resulted curves (stress-strain). In order to present the state of the microstructure, adhesion between cell layers and print defects before and after failure, pictures were taken by digital microscope.
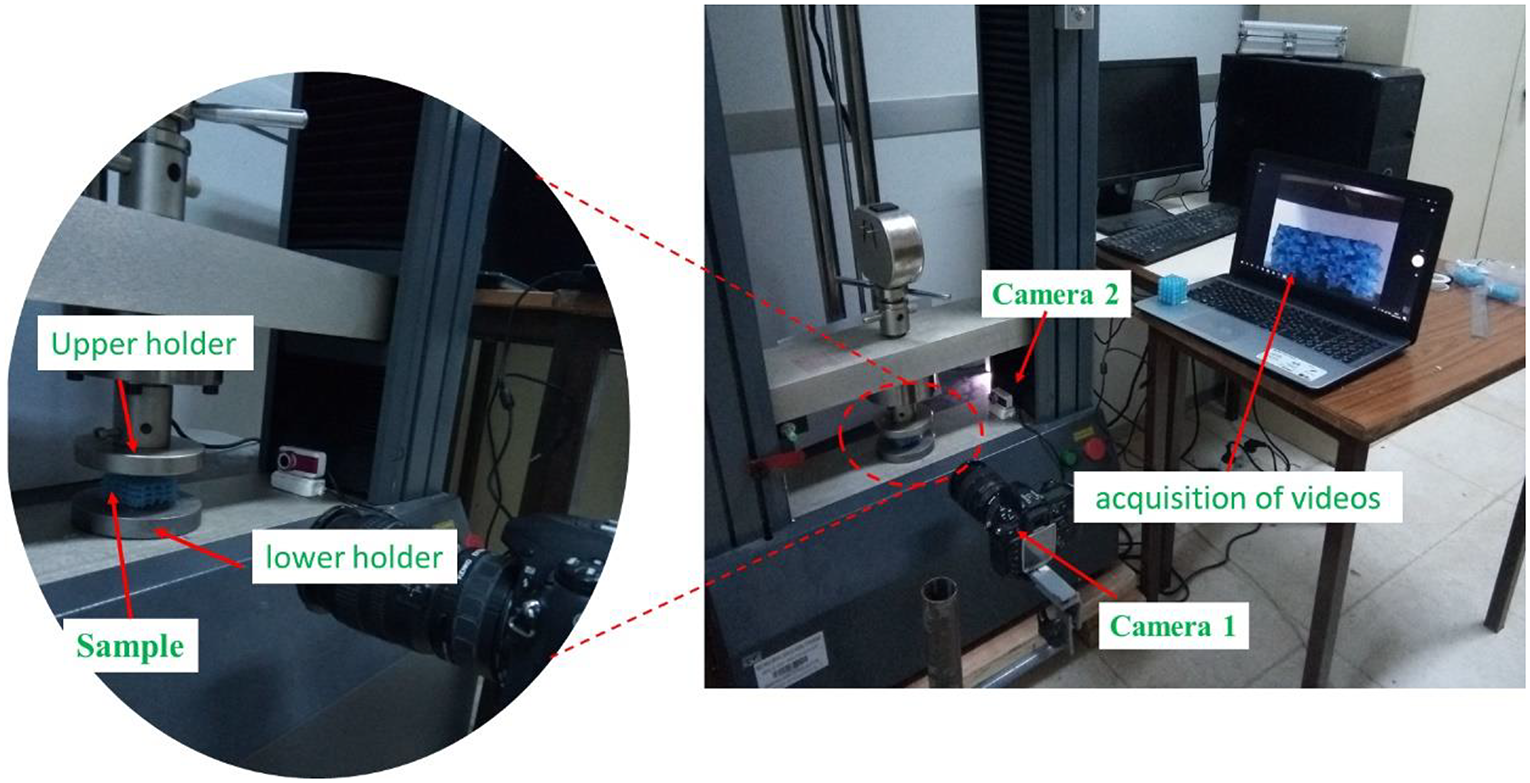
Representation of the experimental setup used for implementing mechanical compressive tests.
Statistical analyses
Analysis of variance (ANOVA) was used to study the influence of the parameters on the Young’s modulus and yield strength using MINITAB software. ANOVA analysis employs the signal-to-noise ratio (S/N) to determine the performance of the response. Depending on the purpose of the experimental response variables the signal-to-noise ratio models are classified.
In the case where the optimum is the largest value, the S/N ratio is defined as 31 :
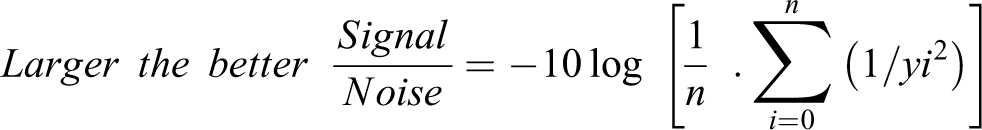
where, n is the replication number of the experiment and yi is the characteristic property. The unit of S/N ratio is decibel (dB).
Use a main effects plot to explore differences between level means for one or more parameters (factors). A main effects plot graphs the response mean for each parameters level connected by a line.
Results and discussion
The results were obtained by testing the four structures for different morphologies namely the stacking, the porosity and the direction of compression. Each structure represented each experiment of the orthogonal network (Table 2), and the results were studied using the analysis of main effects. ANOVA and the signal-to-noise ratio (S/N) using MINITAB software. The results are tabulated in young’s modulus and the elasticity limit as two responses.
Behavior of 3D structures
Figure 6 shows the compression stress-strain curves of different 3D printed parts: an elastic region is followed by a plateau stress with small fluctuations and finally by a densification region.
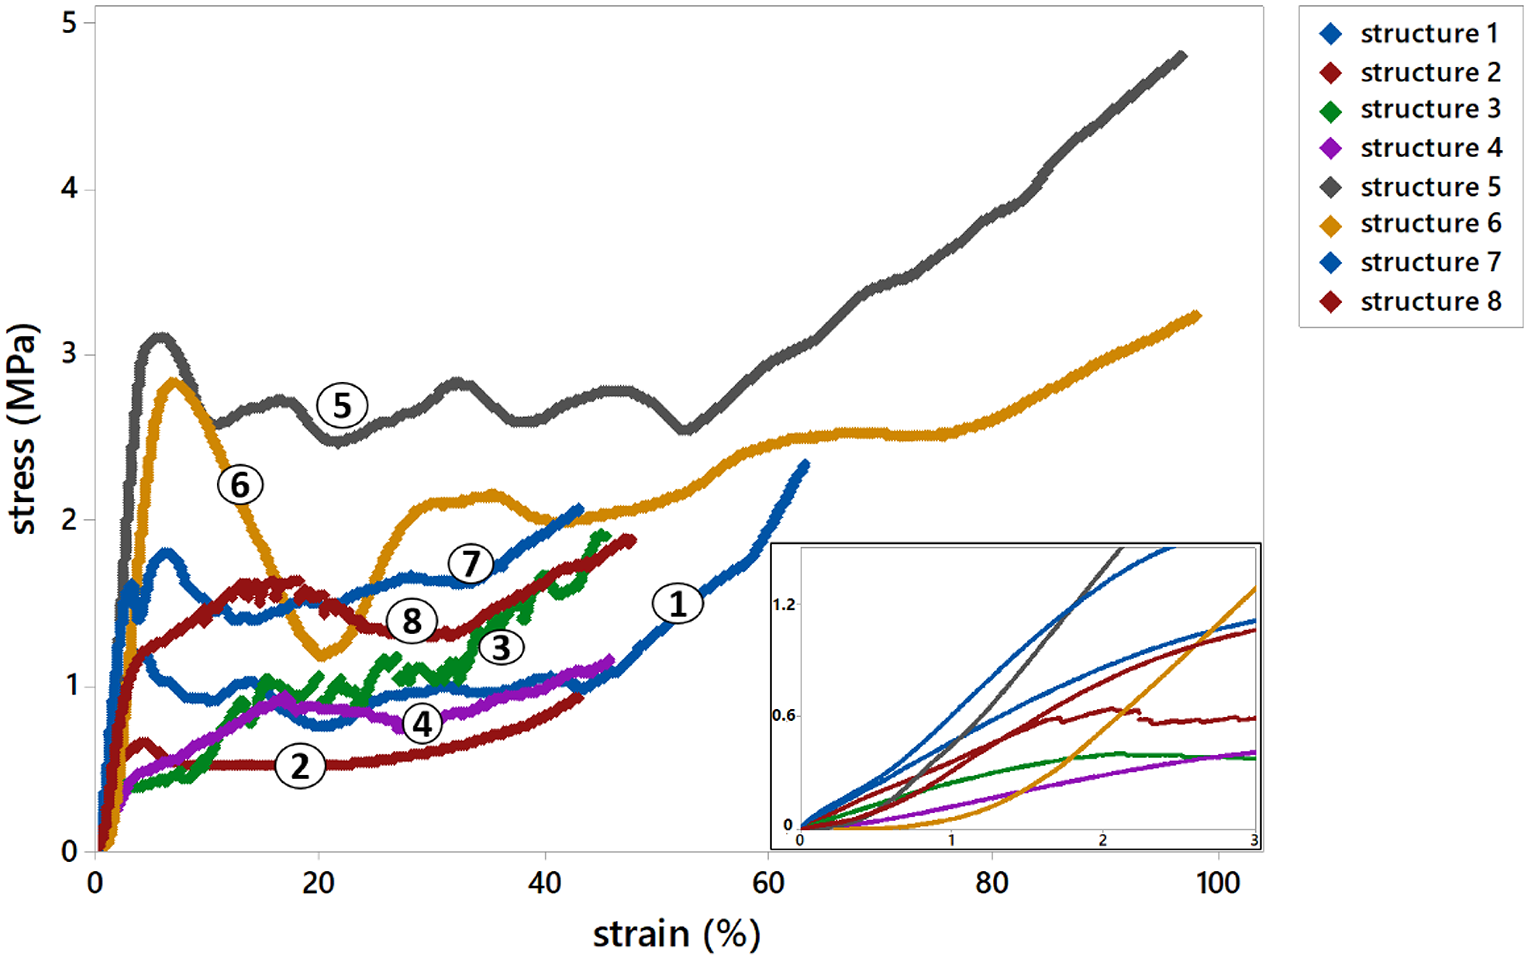
Stress–strain curves of samples with different morphologies.
The linear part was limited and ended when the cells in the middle started to collapse. The plateau part shows that the stress oscillated between the average values due to the failure of specimen cells. Moreover, large fluctuations of the stress-strain curves can be observed in the plateau stage. The strong fluctuations at the beginning of the plateau stage for different configurations are related to the plastic collapse of the cell walls. The large deformation leads to a densification of the cells, which gives us the final region of stress.
Effect of the factors retained on the mechanical properties
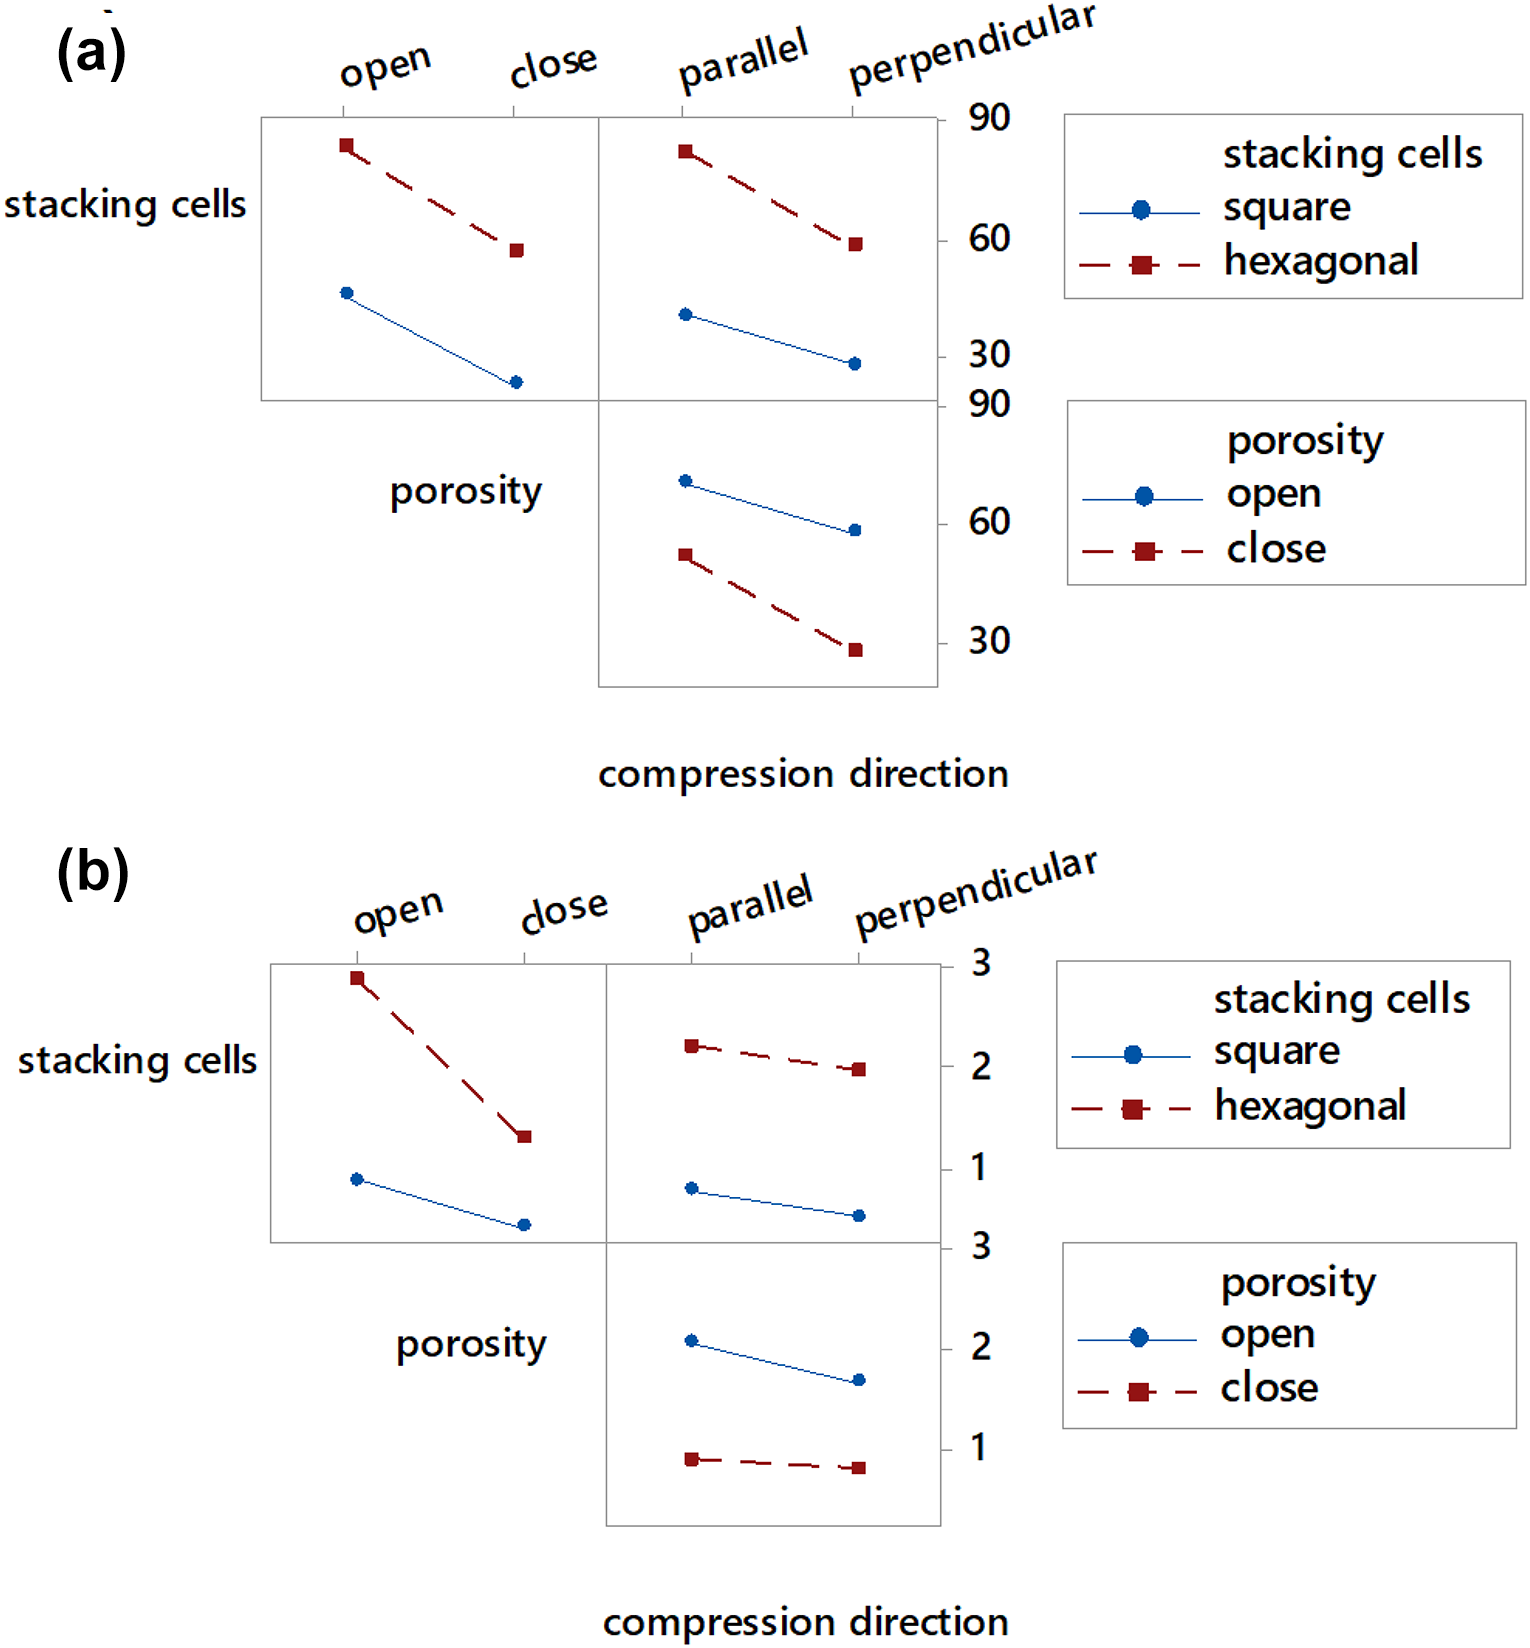
In main effects diagrams, the greater the slope of the straight, the larger the degree of the parameters influence on the response. Figure 7 shows the main effects diagrams on the Young’s modulus and yield strength. On the basis of maximizing the response. Figure 7(a) shows that the best combination of parameters and their levels for a Young’s modulus E(MPa) performance is compliant with a hexagonal stack, an open porosity and a direction of compression test parallel to the direction of manufacture. The main effect on yield strength
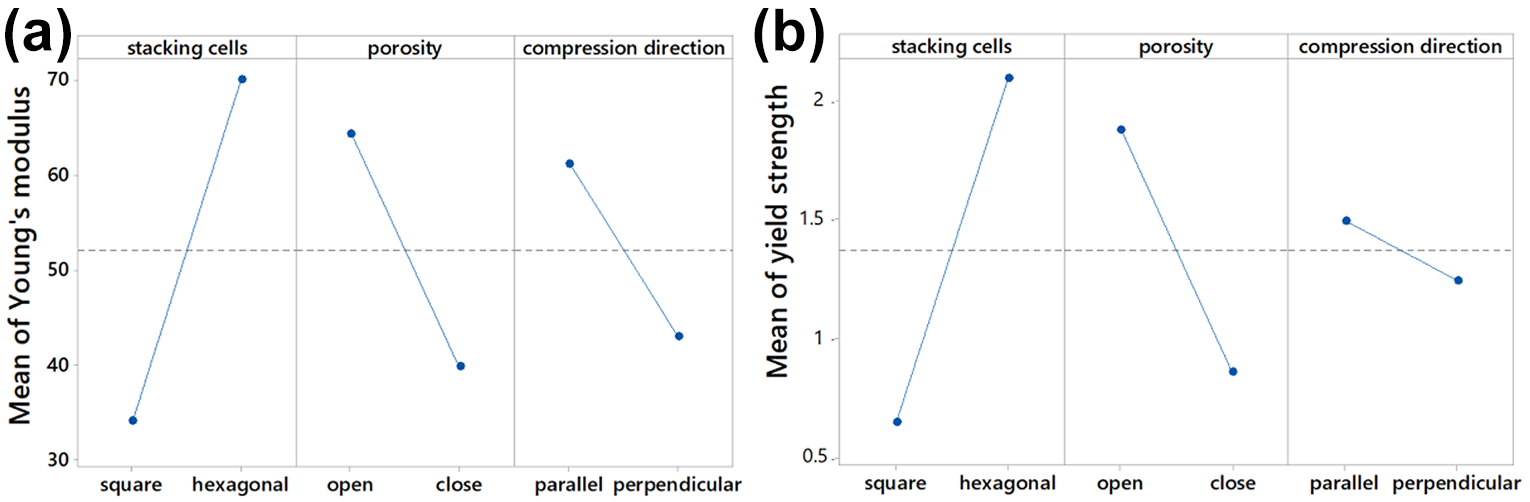
The main effect diagram of experimental factors (a) on Young’s modulus E (MPa). (b) on yield strength
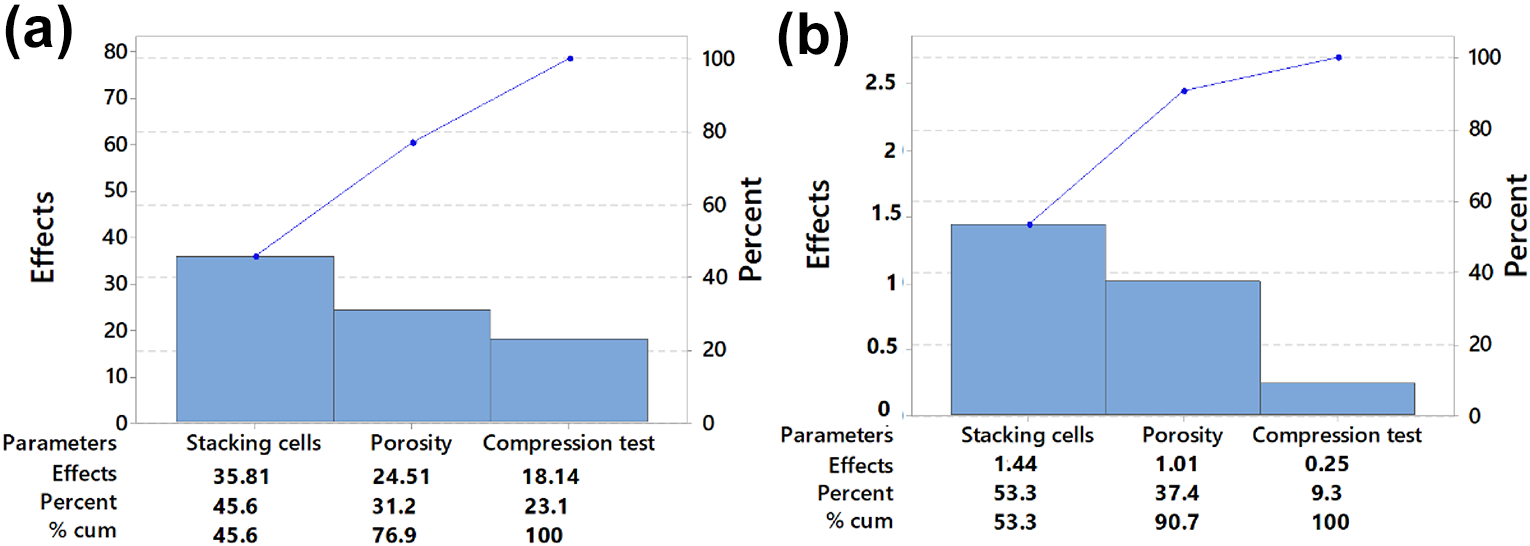
Pareto diagram for (a) Young’s modulus E (MPa). (b) yield strength
Signal-to-noise ratio (S/N)
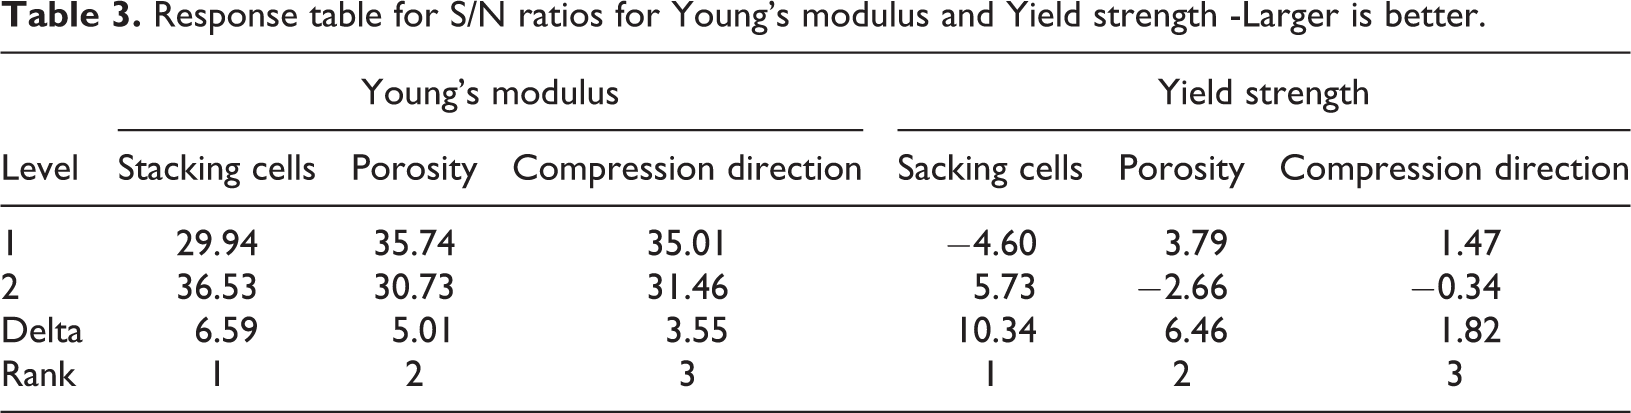
This technique uses the signal-to-noise ratio (S/N) to see the variation in the experimental design. The signal indicates the desirable response and the noise describes the undesirable value. 31 The response table of S/N ratios for on Young modulus and yield strength are presented in Table 3. For each experimental condition the mean value of Young modulus and yield strength were determined and their respective S/N ratios (larger is better) were calculated on the basis of equation (1) and the results are tabulated. The response table provides information regarding the nature of the process under consideration. The highest difference in the control factors (Delta) indicates the strongest influence on the response variable. The strongest influence on Young modulus and yield strength (Table 3) are stacking cells, porosity and compression direction, respectively. Among the factors the stacking cells has most influence on both responses, Figure 9 shows how each factor affects the response characteristic. By comparing the slopes of the straight lines, we know the relative amplitude of the factor. Based on the S/N ratio, the optimal levels are determined. For young’s modulus Figure 9(a), it is evident that the optimum levels of parameters for the performance characteristics—larger is large—are hexagonal stack, open porosity and parallel as direction. On the other hand, for the yield strength (Figure 9(b)), the optimum levels of factors for the performance characteristics are the same; hexagonal stack. open porosity and parallel direction. Figure 10 shows the interaction plots for Young modulus and yield strength. Interaction plots assess the two-way interactions among parameters to the response variable. In the case of Young modulus and yield strength (Figure 10(a) and (b)) the lines are almost parallel, since all the parameters of the structures are of qualitative types. Namely, the effect of one factor is exactly the same regardless of the level of the other: the 3 factors act independently. Which concludes that the interaction between stacking cells, porosity and compression direction are not significant (No interaction occurs). Relative influence of each parameters is determined by analysis of variance method (ANOVA) and results are detailed in Table 4. It is important to report that the 95% confidence level is used for analysis purpose. Therefore, a p-value less than 0.05 will establish the significance of parameter. Table 4 shows the results of ANOVA for Young modulus and yield strength respectively. It is evident that the effect of stacking cells (p = 0.004), the porosity (p = 0.011) and the compression direction (p = 0.033) on the young modulus is of both statistical and practical significance. Similarly, it is evident from Table 4 that the effect of stacking cells (p < 0.001) and the porosity (p = 0.006) on yield strength is significant, while the effect of compression direction (p = 0.203) is moderately significant. Figure 11 shows the contour plots, which can determine the optimum levels of stacking type, porosity and compression direction across all two responses. In this graphs, darker regions indicate higher z-values. Figure 11(a), (b) and 11(c) show how cell stacking, porosity and compression direction affect the Young modulus. The contour levels reveal a peak centered in the vicinity of level 2 (stacking cell: hexagonal), level 1 (porosity: open) and level 1 (compression direction: parallel). Young modulus in these peak regions is greater than 80 MPa. Meanwhile, for yield strength revealed that high value (>3 MPa) was obtained at the following combination: level 2 (Hexagonal stacking of cells), level 1 (Open porosity) and level 1 (a parallel loading direction), as show in Figures 11(d) to (f), respectively.
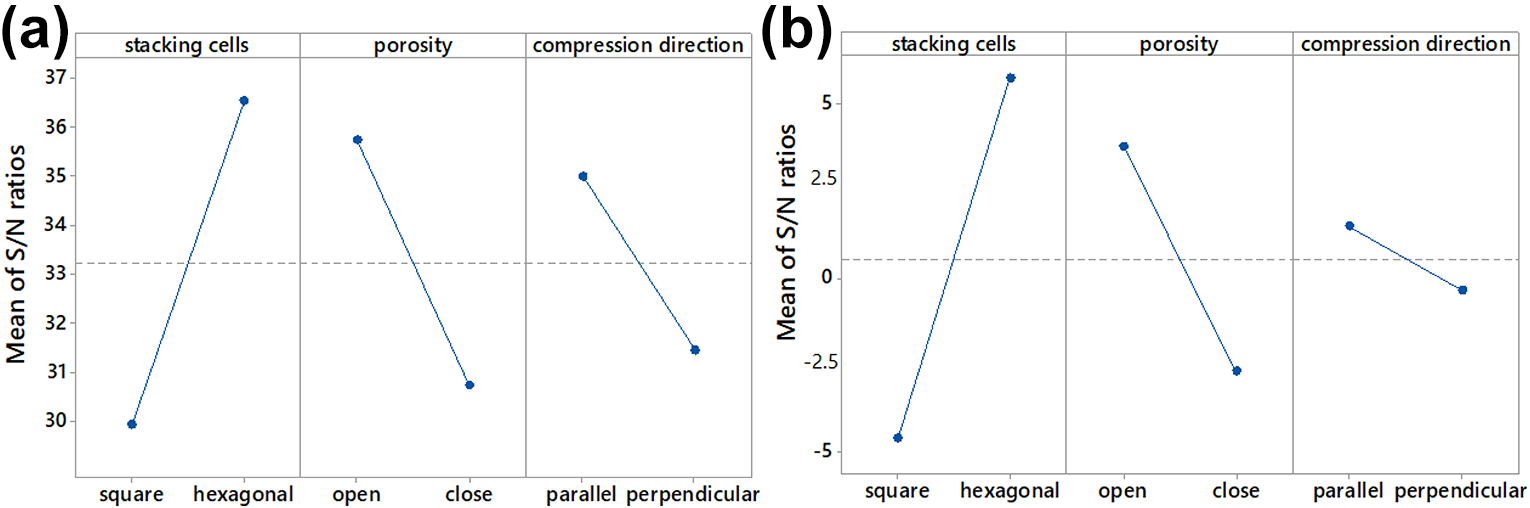
Main effect plot of S/N ratio (a) Response is Young’s modulus. (b) Response is yield strength.
Interaction plots showing the interaction among control factors on the response variables (a) Young modulus and (b) yield strength.
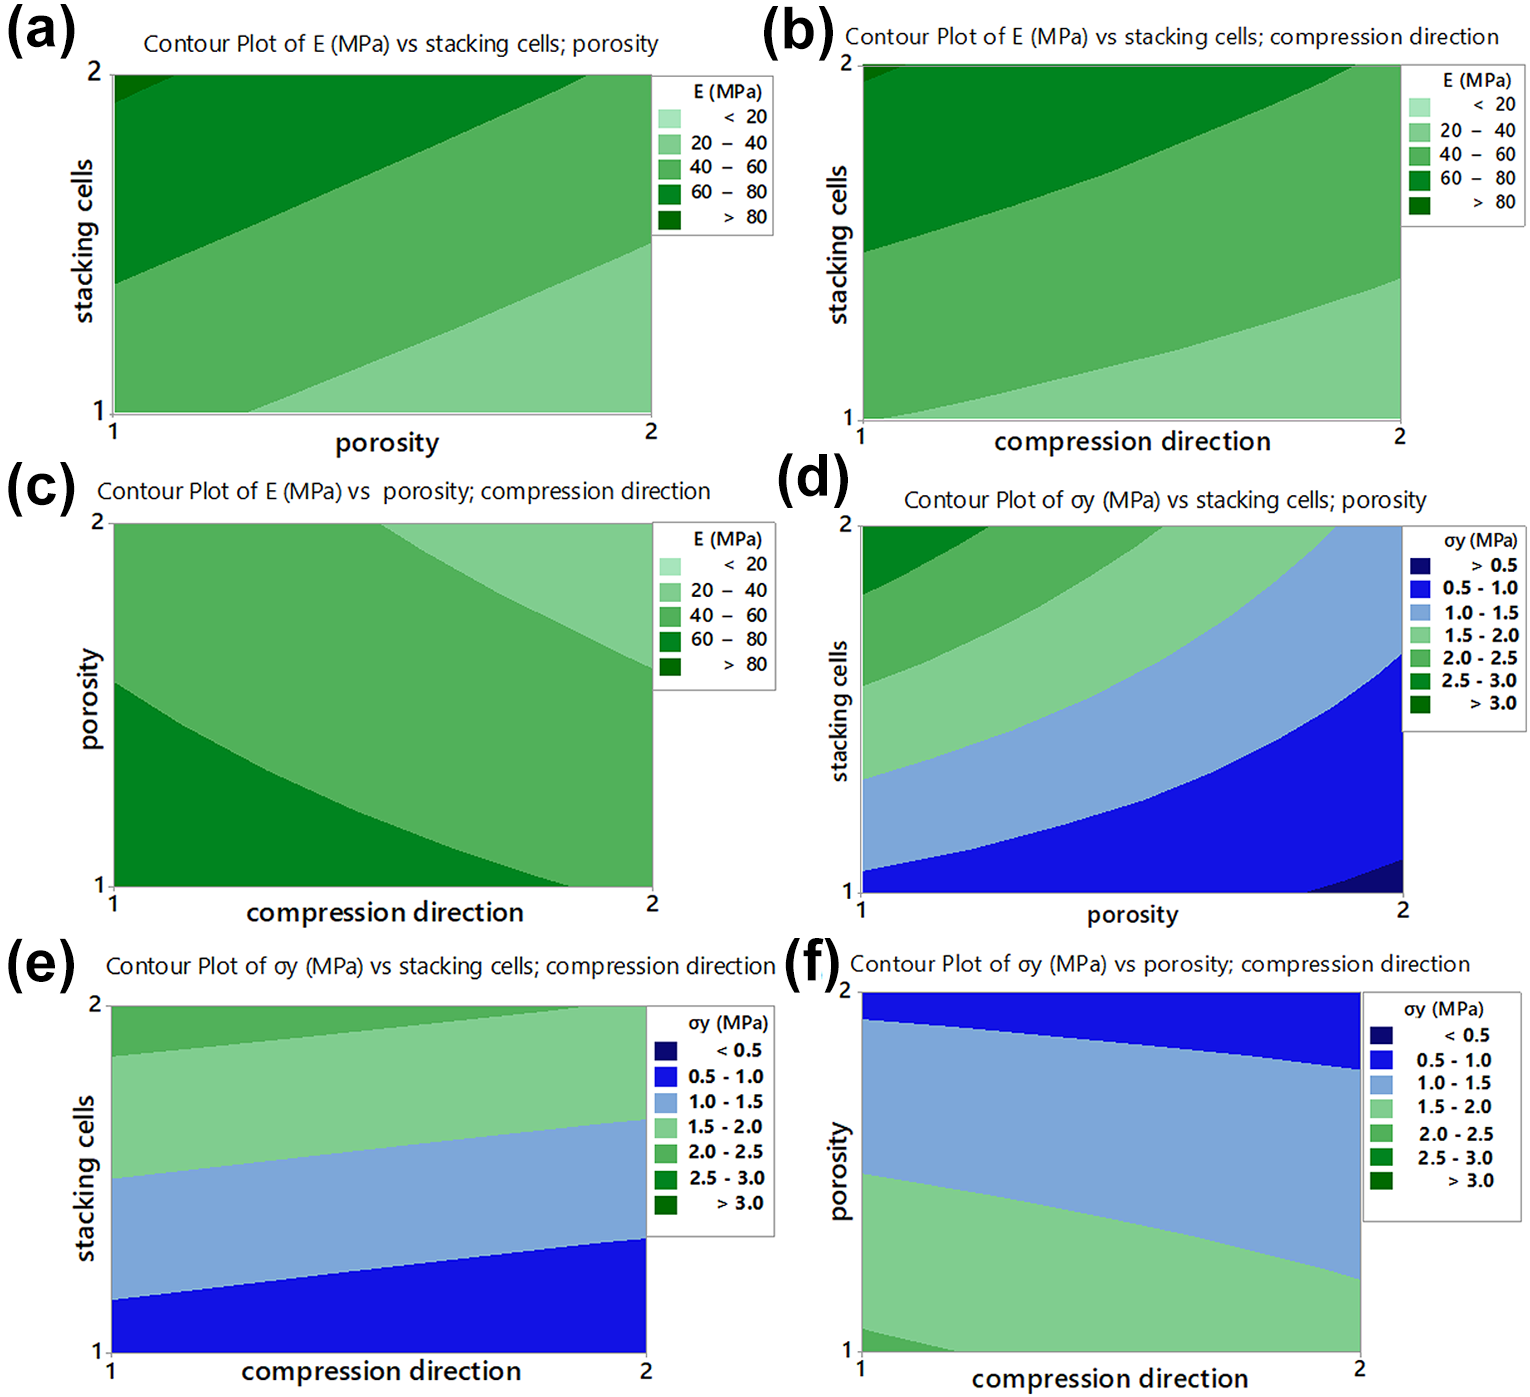
Response contour plot of elastic modulus E (MPa) and yield strength
Response table for S/N ratios for Young’s modulus and Yield strength -Larger is better.
The Analysis of Variance (ANOVA) table for Young modulus and yield strength.
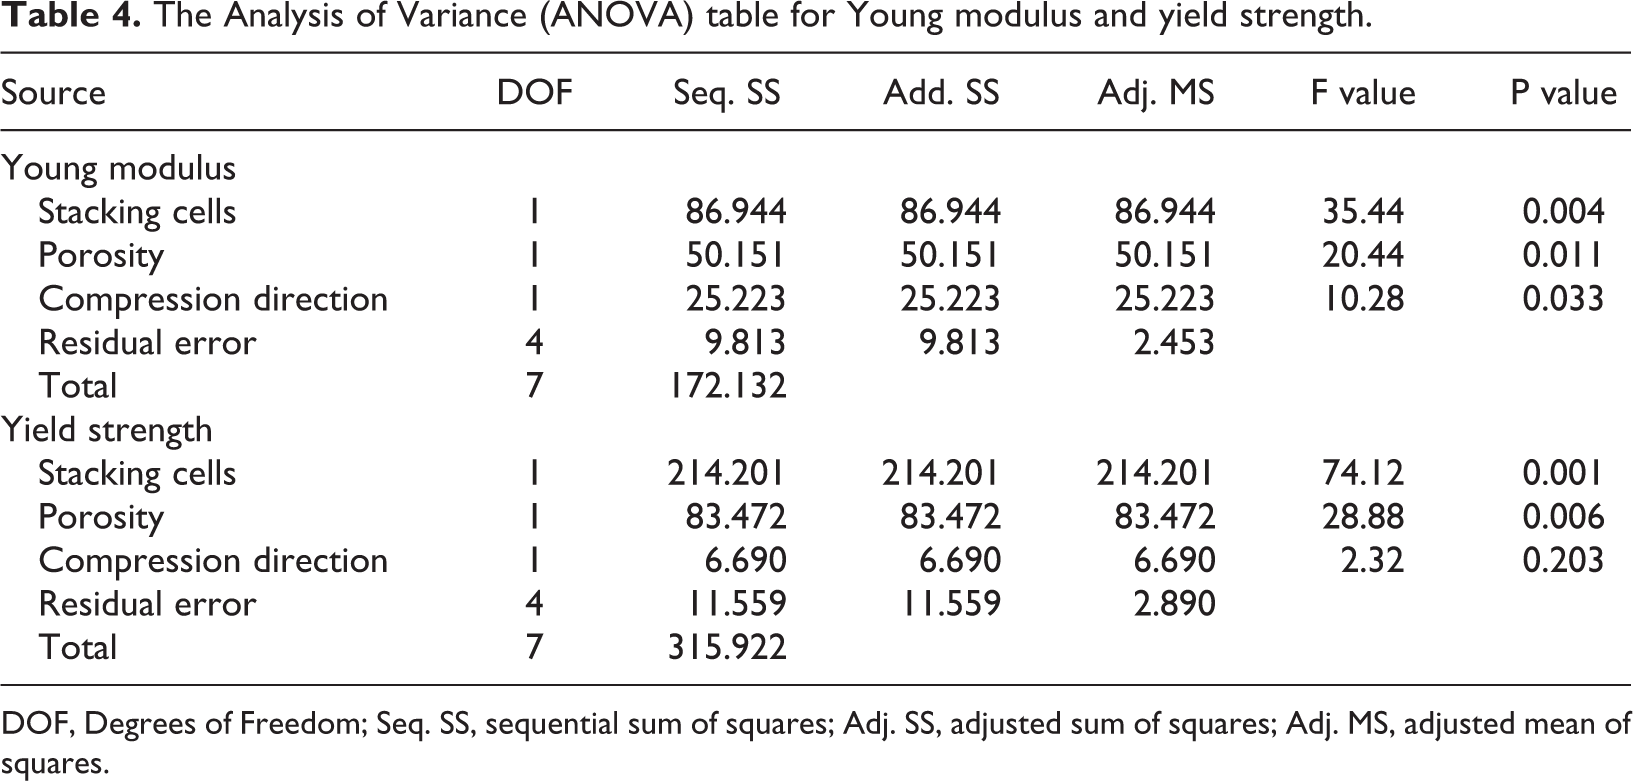
DOF, Degrees of Freedom; Seq. SS, sequential sum of squares; Adj. SS, adjusted sum of squares; Adj. MS, adjusted mean of squares.
Deformation patterns of PLA structures
The presence of meso-macro structures provides possibility for porous structures to be optimized to possess better mechanical performances. 22 With a given base material, the influence of macro- structures on the macroscopic behavior of PLA structures is studied by constructing eight specimens with different configurations. The deformation processes of the eight configurations under quasi-static loading are detailed in Figure 12. The images are organized according to Table 2 of Taguchi from 1 to 8. There exists a crushing band that initially produces in the zone where the strength of the cell wall is relatively low. As a heterogeneous stress concentration caused by cell anisotropy, the spread of the crushing band is not continuous due to an insufficient disturbance due to the buckling of the existing cell wall, and new shear bands may occur elsewhere, 32 as clearly shown in Figure 12(6) and a little in Figure 12(7). The perpendicular direction of compression compared to the deposition direction of the layers caused the creation of cracks during the test, as illustrated in Figure 12(2), (4), (6) and (8).
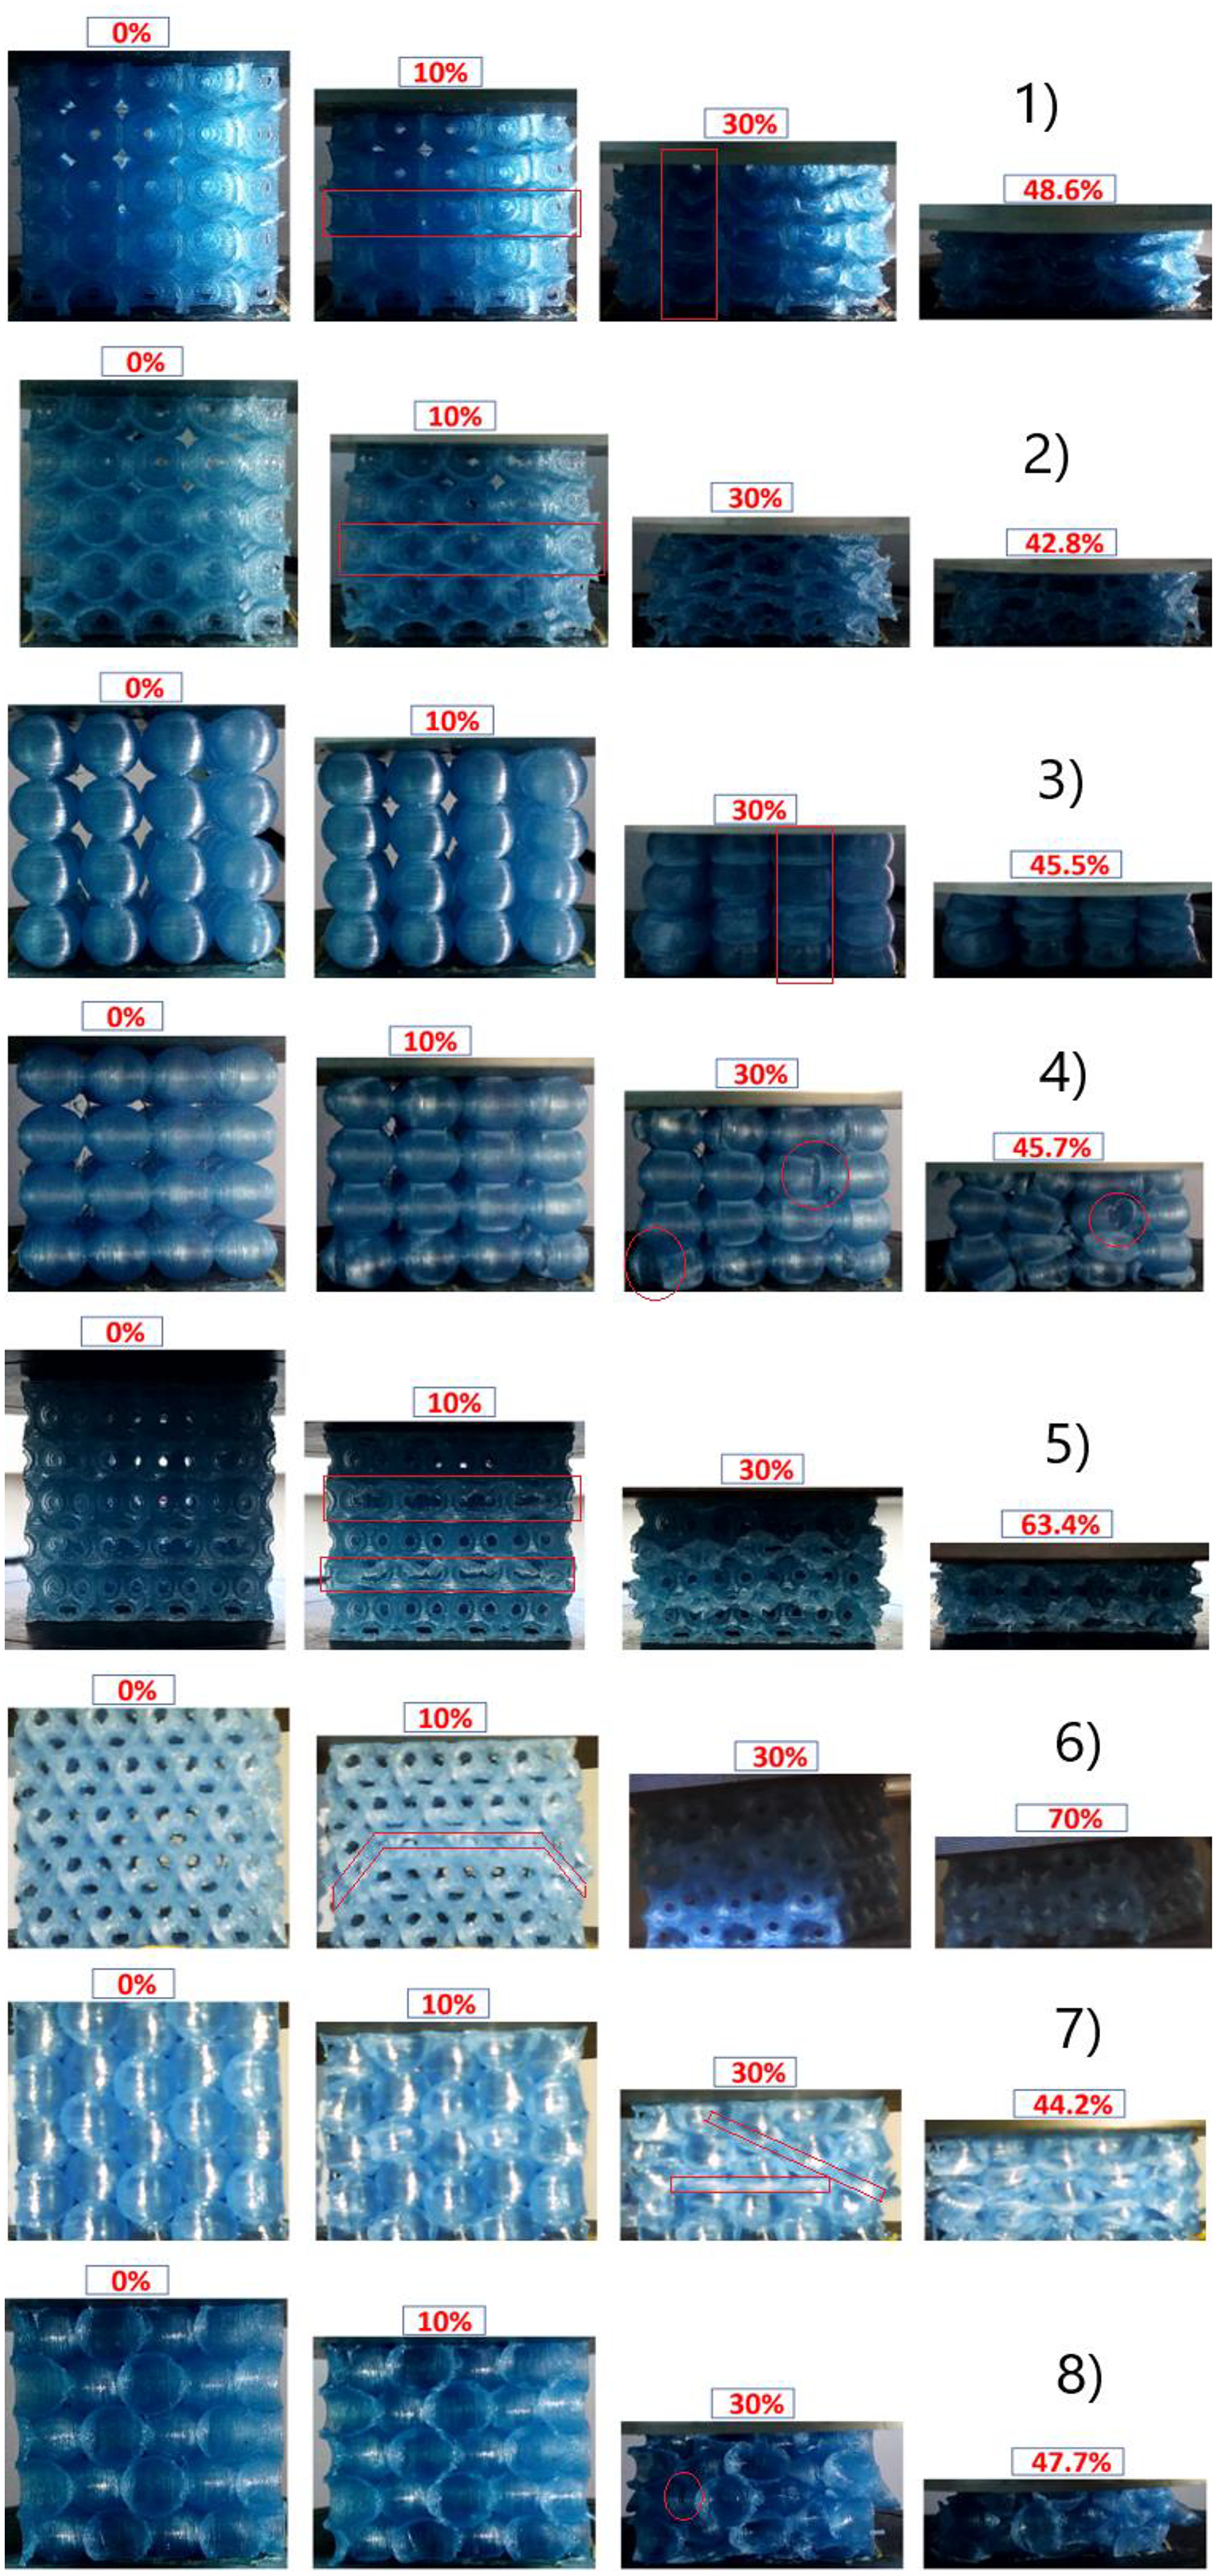
The deformation processes and the failure modes of PLA structures with different morphologies according to the Taguchi table.
Compared to the hexagonal stack, square stacking deforms more regularly, namely the collapse of the cells begins and propagates in a progressive manner, especially, square stacking with parallel compression direction, as shown in Figures 12(1) and (3). The initial failure of imperfect areas (such as punctual bonding between cells with a square stack and closed porosity) deteriorates the collapse strength of those local sites, which aggravates the imbalance in the distribution of forces, as shown in Figures 12(4) and (8).
Conclusion
In this work, effects of cell stacking, porosity type and direction compression were investigated on the compressive behavior of PLA Hollow-Sphere Structures manufactured by FDM process. It is found that the cell stacking is most effective to 45.6% and 53.3% at 95% level of significance on the Young modulus and yield strength, respectively. The other factors, porosity type and compression direction contribute to 31.2% and 23.1% for the Young modulus, and 37.4% and 9.3% for the yield strength, respectively. According to the S/N analysis, the cells stacking is most effective when it is at level 2 (hexagonal), the porosity at level 1 (open) and the compression direction at level 1 (parallel). According to the trials, sample 5 was found to give the best results. In addition, evolution of the structures during the tests shows the relationship between the deformation mechanism and the structural parameters. Specially, PLA specimens with the direction of layer deposition parallel to the loading direction have a higher strength and a gradual collapse of the cells than those with the perpendicular direction. This is attributed to the anisotropic property of cell walls introduced during loading and as a function of the fusion deposition modeling process. Generally, the mechanical properties of cellular materials are dependent on the cell morphology, but also are highly related to the material type, which must be taken into account in some works.
Footnotes
Acknowledgements
The authors would like to acknowledge the company 3DForm for the assistance in producing the 3D specimens and Belfort-Montbéliard University of Technology UTBM which helps to improve the work.
Declaration of conflicting interests
The author(s) declared no potential conflicts of interest with respect to the research, authorship, and/or publication of this article.
Funding
The author(s) received no financial support for the research, authorship, and/or publication of this article.