
Abstract
Radar absorbing materials (RAMs) have become increasingly important in modern stealth technologies due to the growing need to minimize radar signatures. However, most RAMs suffer from high weight and limited structural flexibility, which restrict their practical use in lightweight and conformal applications. Therefore, developing lightweight and structurally adaptable absorbers has become a critical research priority, and this study addresses this need by evaluating the effects of polyurethane foam (PUF) density and morphology on their electromagnetic absorption performance. PUF composites with different matrix densities (30, 80, and 120 kg/m3) were prepared by incorporating nickel-coated carbon fillers at varying loadings. In addition, to examine the effect of filler localization, additional samples with identical composition were fabricated using three preparation strategies, introducing the filler into the polyol phase, the isocyanate phase, or equally dividing it between both. These approaches resulted in distinct filler distributions, allowing the evaluation of how spatial arrangement influences electromagnetic behavior. As expected, increasing foam density progressively enhanced absorption performance, with notable attenuation observed only at densities of 80 kg/m3 and above. A well-balanced cellular morphology was obtained by equally dividing the filler between both phases, resulting in homogeneous localization across both cell interiors and walls. This strategy facilitated more regular foam formation compared to polymeric methylene diphenyl diisocyanate (pMDI) based dispersion and offered comparable absorption performance, while clearly outperforming the polyol-only method in efficiency and thickness. As a key outcome, a PUF with an experimental density of 0.553 g/cm3 achieved a minimum reflection loss (RL min ) of −41.80 dB at 4.3 cm thickness, while maintaining Reflection Loss (RL) values below −10 dB across the entire X-band. Overall, the results demonstrate that both foam density and filler localization serve as effective design parameters to tune dielectric behavior and optimize absorption in lightweight polyurethane-based RAMs.
Introduction
RAMs are a class of engineered materials designed to attenuate incident electromagnetic waves by minimizing their reflection from exposed surfaces. The underlying mechanism typically involves the conversion of electromagnetic energy into heat through dielectric and/or magnetic losses, enabling a reduction in backscattered signal intensity. 1 These materials have become increasingly important in efforts to suppress electromagnetic pollution and improve radar stealth performance, particularly in systems operating within high-frequency bands such as the X-band.2–4 As electromagnetic technologies have advanced, the expectations placed on RAMs have extended beyond absorption alone. To meet these growing demands, advanced RAMs are expected to deliver high absorption performance while maintaining lightweight structure, minimal thickness, and geometric adaptability. In terms of absorption performance, two key parameters are commonly used to evaluate the efficiency of RAMs: minimum reflection loss (RL min ) and effective absorption bandwidth (EAB). RL min represents the minimum reflection loss, expressed in decibels (dB), observed within the operating frequency band, while EAB denotes the bandwidth over which RL remains below −10 dB—a standard threshold indicating absorption of more than 90% of the incident electromagnetic wave. 5 In terms of structural and functional requirements, modern RAMs are expected to combine low density with sufficient mechanical integrity for practical deployment.6–8 Spray-coating capability over complex surfaces and supplementary infrared shielding are also considered essential for advanced stealth functionality.9,10
In earlier designs, RAMs were primarily composed of magnetic-based materials,11,12 which, despite their effective attenuation properties, often suffered from excessive weight and limited formability. To address evolving application requirements, the design paradigm has shifted toward dispersing conductive and magnetic fillers within polymer matrices.13–15 More recently, the integration of lightweight conductive fillers—particularly carbon-based materials—has gained prominence as a strategy to reduce the reliance on dense magnetic particles and lower overall material density.16–18 In line with the need for lightweight yet effective electromagnetic attenuation, the use of cellular materials such as graphene foams,19,20 carbon aerogels,21–23 hollow carbon fiber networks,24,25 and functionalized polymer foams26–28 has garnered considerable attention. These materials offer a unique combination of ultralow density and high internal surface area, which facilitates multiple internal reflections, interfacial polarization, and dielectric scattering—mechanisms known to enhance absorption efficiency across a broad frequency range. Among these, polymer-based foams filled with magnetic or conductive particles have emerged as particularly promising candidates due to their processability, mechanical resilience, and compatibility with large-area manufacturing. By tailoring the foam morphology (e.g., cell size, distribution, and wall thickness) alongside the type and distribution of functional fillers, these structures provide an ideal platform for balancing electromagnetic performance with structural and thermal requirements. 29
Among various foam-based matrices, PUFs stand out due to their unique combination of structural tunability and processing versatility. The intrinsic flexibility of PUFs allows for the adjustment of key morphological features such as cell size, porosity, and wall thickness, which collectively influence dielectric scattering, interfacial polarization, and multiple internal reflections. Moreover, PUFs can be formulated to exhibit a wide range of mechanical stiffness—from soft and flexible to rigid and load-bearing—allowing precise customization to meet specific operational requirements. Their compatibility with both magnetic and conductive fillers further enables the development of multifunctional composites with tailored absorption characteristics. Owing to their adaptability to various fabrication techniques, including spray-coating and in situ foaming, PUF-based RAMs offer practical advantages for conformal coating of complex surfaces in advanced stealth applications. Despite the numerous advantages offered by PUFs, efforts to develop high-performance RAMs based on this matrix have encountered a critical limitation associated with the incorporation of functional fillers. Specifically, when conductive or magnetic fillers are directly introduced into the liquid precursor components of the PUF system, these solid additives tend to absorb or retain the reactive polyol or isocyanate phases. 30 This undesired interaction disrupts the foaming process by preventing sufficient gas generation and uniform cell formation, thereby compromising the final structure. Although several strategies—such as reducing the viscosity of the matrix—have been proposed to mitigate this issue, the most effective approach reported thus far involves the use of surface-modified carbon fillers with magnetic coatings. These coatings help to minimize filler surface area and surface activity, thereby reducing unwanted interactions with the liquid components and preserving foam integrity. 30
In this study, special emphasis is placed on the combined influence of foam density and filler localization within the cellular architecture of polyurethane-based radar absorbers. Unlike previous efforts that primarily focused on filler type or loading level, this work systematically addresses how the localization of fillers evolves with foam density and how this structural variation potentially governs the dielectric response. To the best of the authors’ knowledge, this is among the first studies to integrate filler localization behavior into the design framework of lightweight RAM systems based on PUFs.
Material and method
Materials
PUF systems used in this study were kindly provided by PLUSKIM Kimya (Turkey) in three different formulations, designed to yield densities of 30, 80, and 120 kg/m3. The cream, gel, and tack-free times of the system were approximately 50, 220, and 380 s, respectively. The foams were produced using a polyol blend composed of polyester and polyether components, and a polymeric methylene diphenyl diisocyanate (p-MDI). Silicone-based surfactants, amine and tin catalysts, and HFC-365-based blowing agents were pre-mixed into the polyol phase. This mixture is referred to as “polyolmix” throughout the manuscript. During foam preparation, the polyolmix and p-MDI components were mixed in a 1:1 ratio. As the functional hybrid filler, a nickel-coated graphitic carbon powder (E-fill 2805, Oerlikon) was used. This filler consists of 75% nickel and 25% carbon by weight, with an average particle size of approximately 44 µm (325 mesh). In the manuscript, it is abbreviated as “NiC.”
Methods
Sample preparation
PUF samples were prepared based on a widely used method in the literature. The polyolmix containing a specified amount of hybrid filler was first mixed at 2500 rpm for 300 s using a mechanical stirrer. Then, the p-MDI component was added, and the mixture was stirred for an additional 20 s. The resulting reactive mixture was poured into silicone molds specifically designed for microwave absorption measurements using a coaxial sample holder with outer and inner diameters of 7 mm and 3 mm, respectively. The samples were allowed to rise freely within the molds and cured in an oven at 40°C for 48 h. Samples were coded using the notation D(X)-E(Y), where X represents the density of the unfilled PUF system in kg/m3, and Y denotes the filler loading in parts per hundred resin (phr). For instance, D30-E90 refers to a sample with a foam density of 30 kg/m3 and 90 phr filler. The maximum achievable filler content varied depending on the foam’s filler-carrying capacity. To systematically assess how the localization of fillers within different reactive components affects microwave absorption performance, a series of PUF samples containing 150 phr of filler were prepared via three formulation strategies. In the first (D120-E150), fillers were entirely dispersed within the polyol phase. In the second (D120-E150 (50/50)), an equal split between polyol and isocyanate was applied. The third strategy (D120-E150 (pMDI)) involved exclusive incorporation into the isocyanate phase. These variations were designed to provide insight into the relationship between filler distribution, foam microstructure, and microwave attenuation behavior.
Characterizations
The microstructural morphology of the foam samples was examined using a field-emission scanning electron microscope (FE-SEM; FEI Quanta FEG 450). Prior to imaging, the surfaces of the samples were coated with a thin layer of gold to enhance conductivity and prevent charge accumulation under the electron beam. SEM imaging was carried out at an accelerating voltage of 15 kV. Cell morphology, filler distribution, and filler–matrix interfaces were evaluated at different magnifications.
Dielectric parameters of the samples were measured using a Keysight Technologies P9373 A USB-based vector network analyzer (VNA). Measurements were performed using a coaxial sample holder with outer and inner diameters of 7 mm and 3 mm, respectively. A full two-port calibration was performed using a Keysight electronic calibration kit to ensure measurement accuracy. Before sample testing, the permittivity values of air and Teflon were measured and compared with literature values for validation. Three specimens per composition were tested in the 8.0–12.5 GHz frequency range. To ensure repeatability, sample thickness was maintained at a minimum of 10 mm. Based on the measured S-parameters, the real (ε′, μ′) and imaginary (ε″, μ″) components of permittivity and permeability were calculated using Keysight N1500 A materials measurement software. A polynomial-based modified Nicolson-Ross-Weir (NRW) method, recommended for materials with magnetic properties, was employed to improve computational continuity and ensure reliable data output.
Result and discussion
Investigation of the effect of foam density on dielectric and microwave absorption properties
Dielectric properties
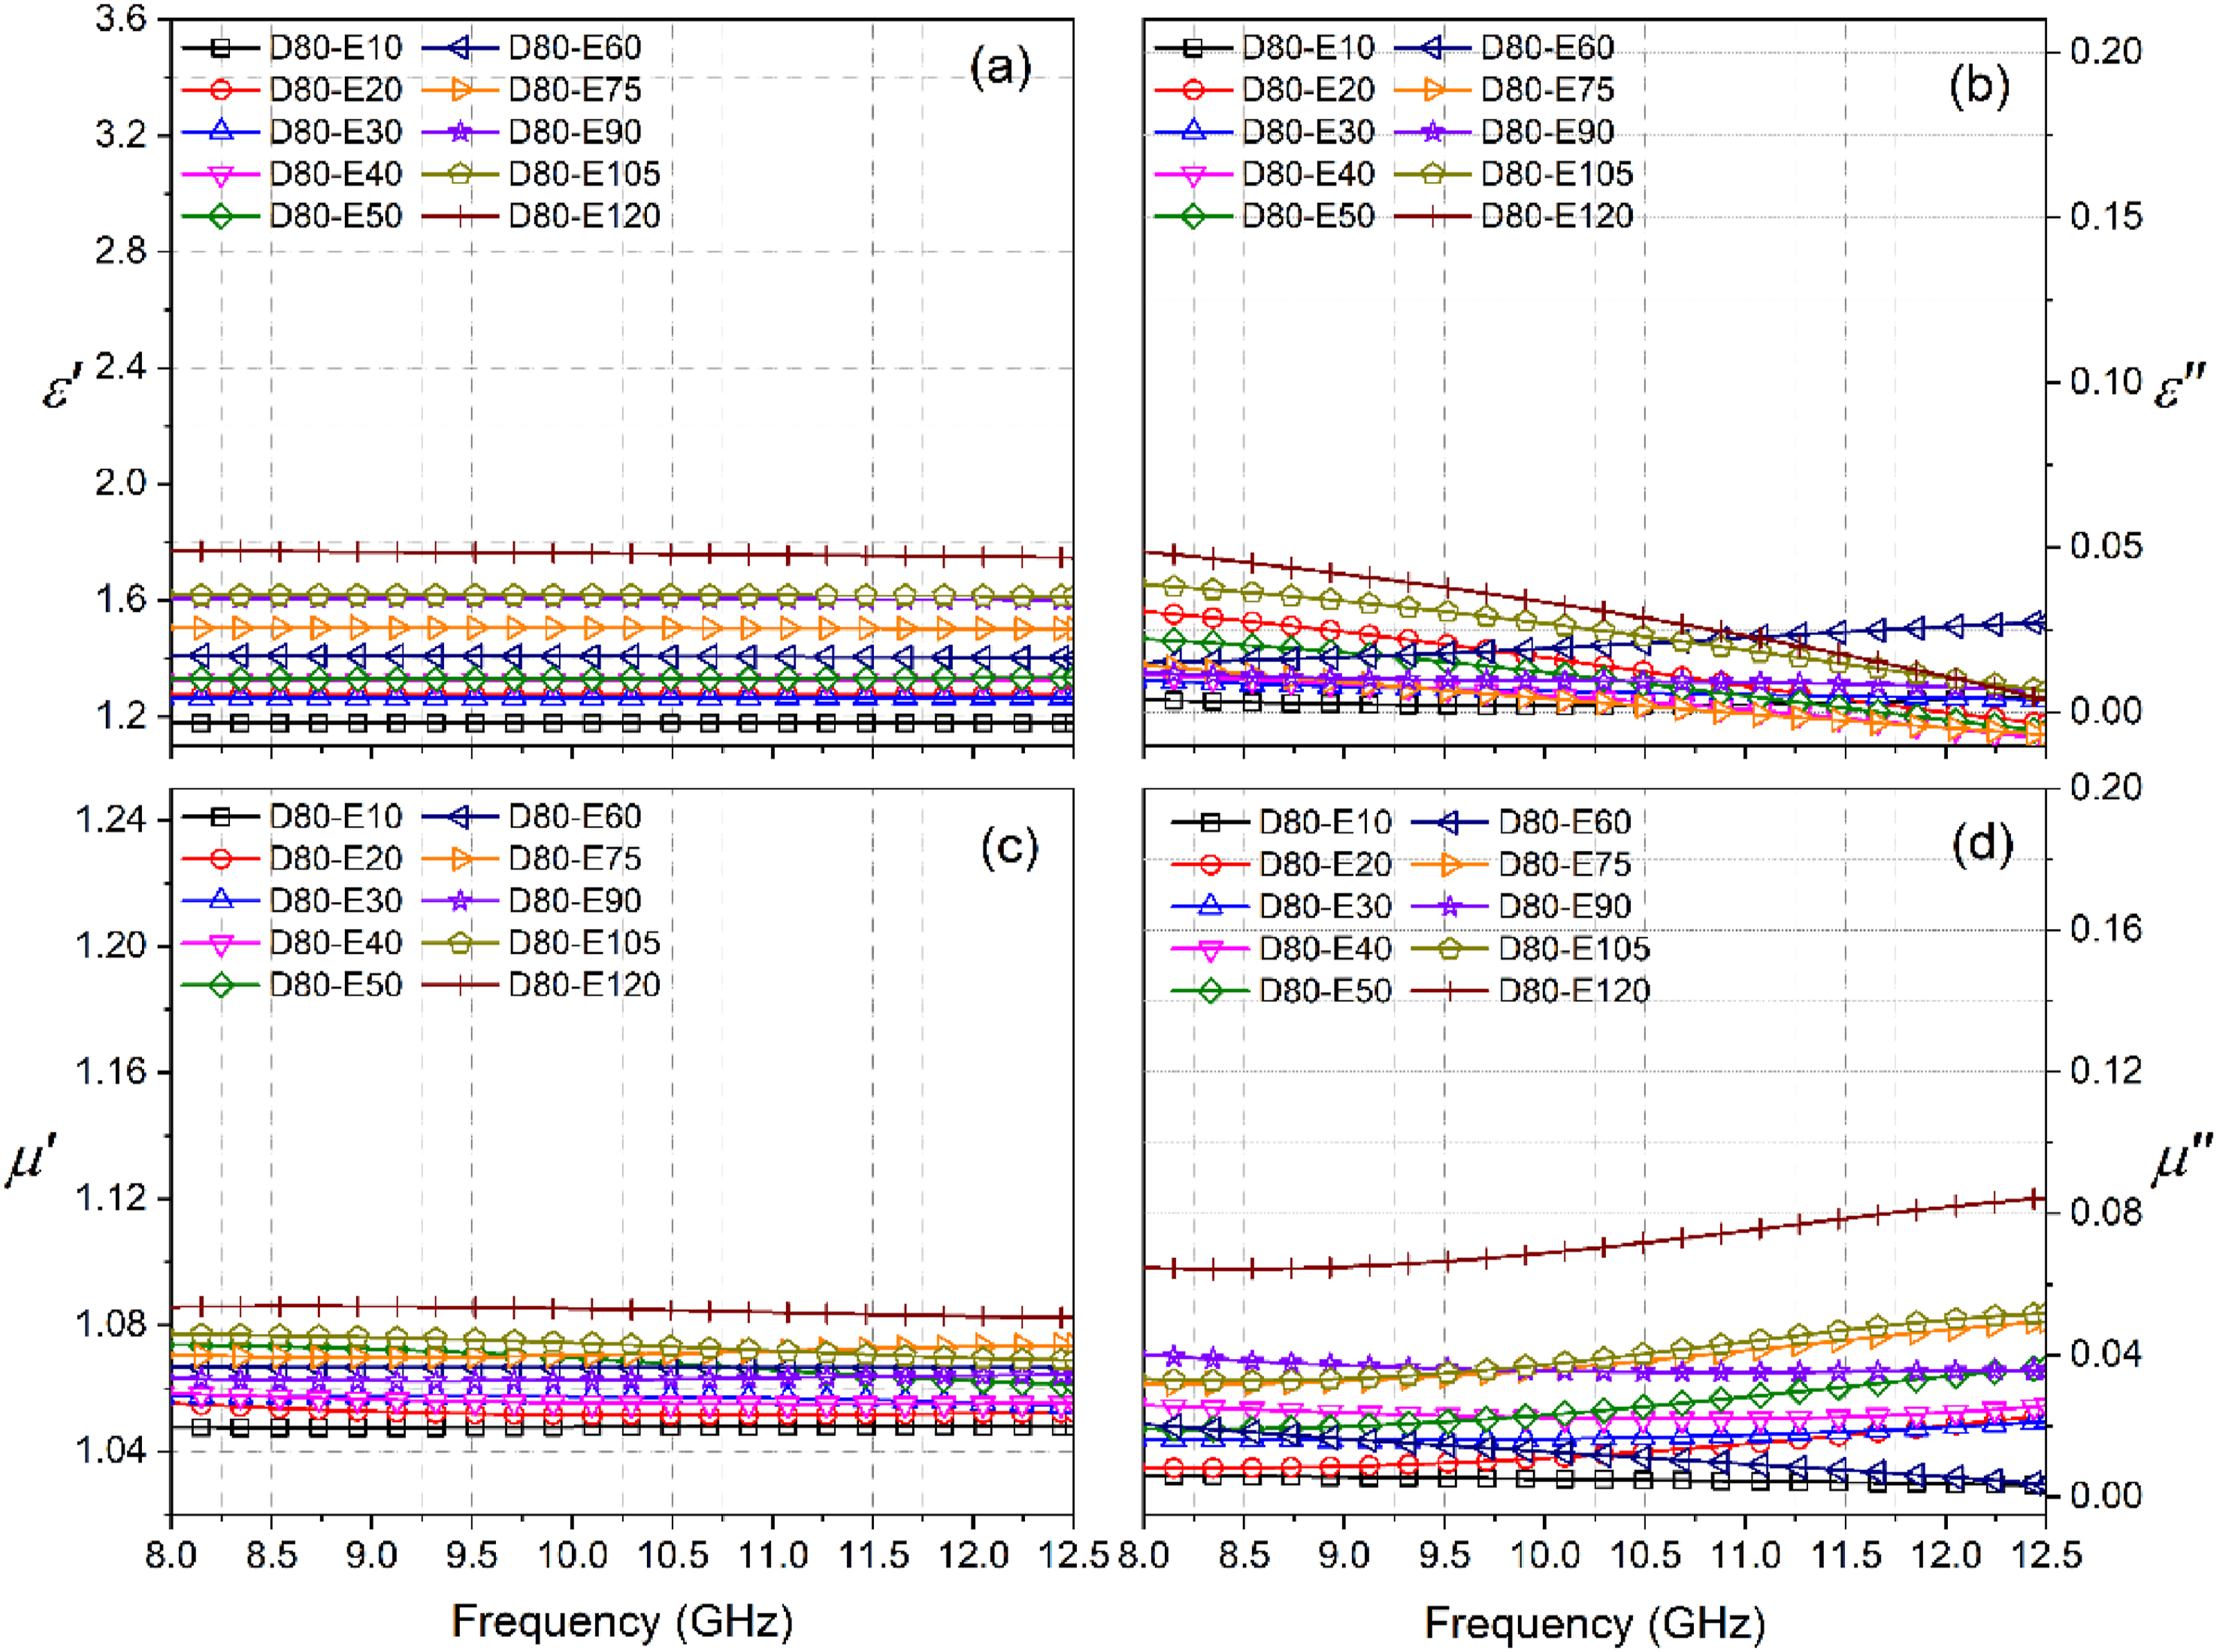
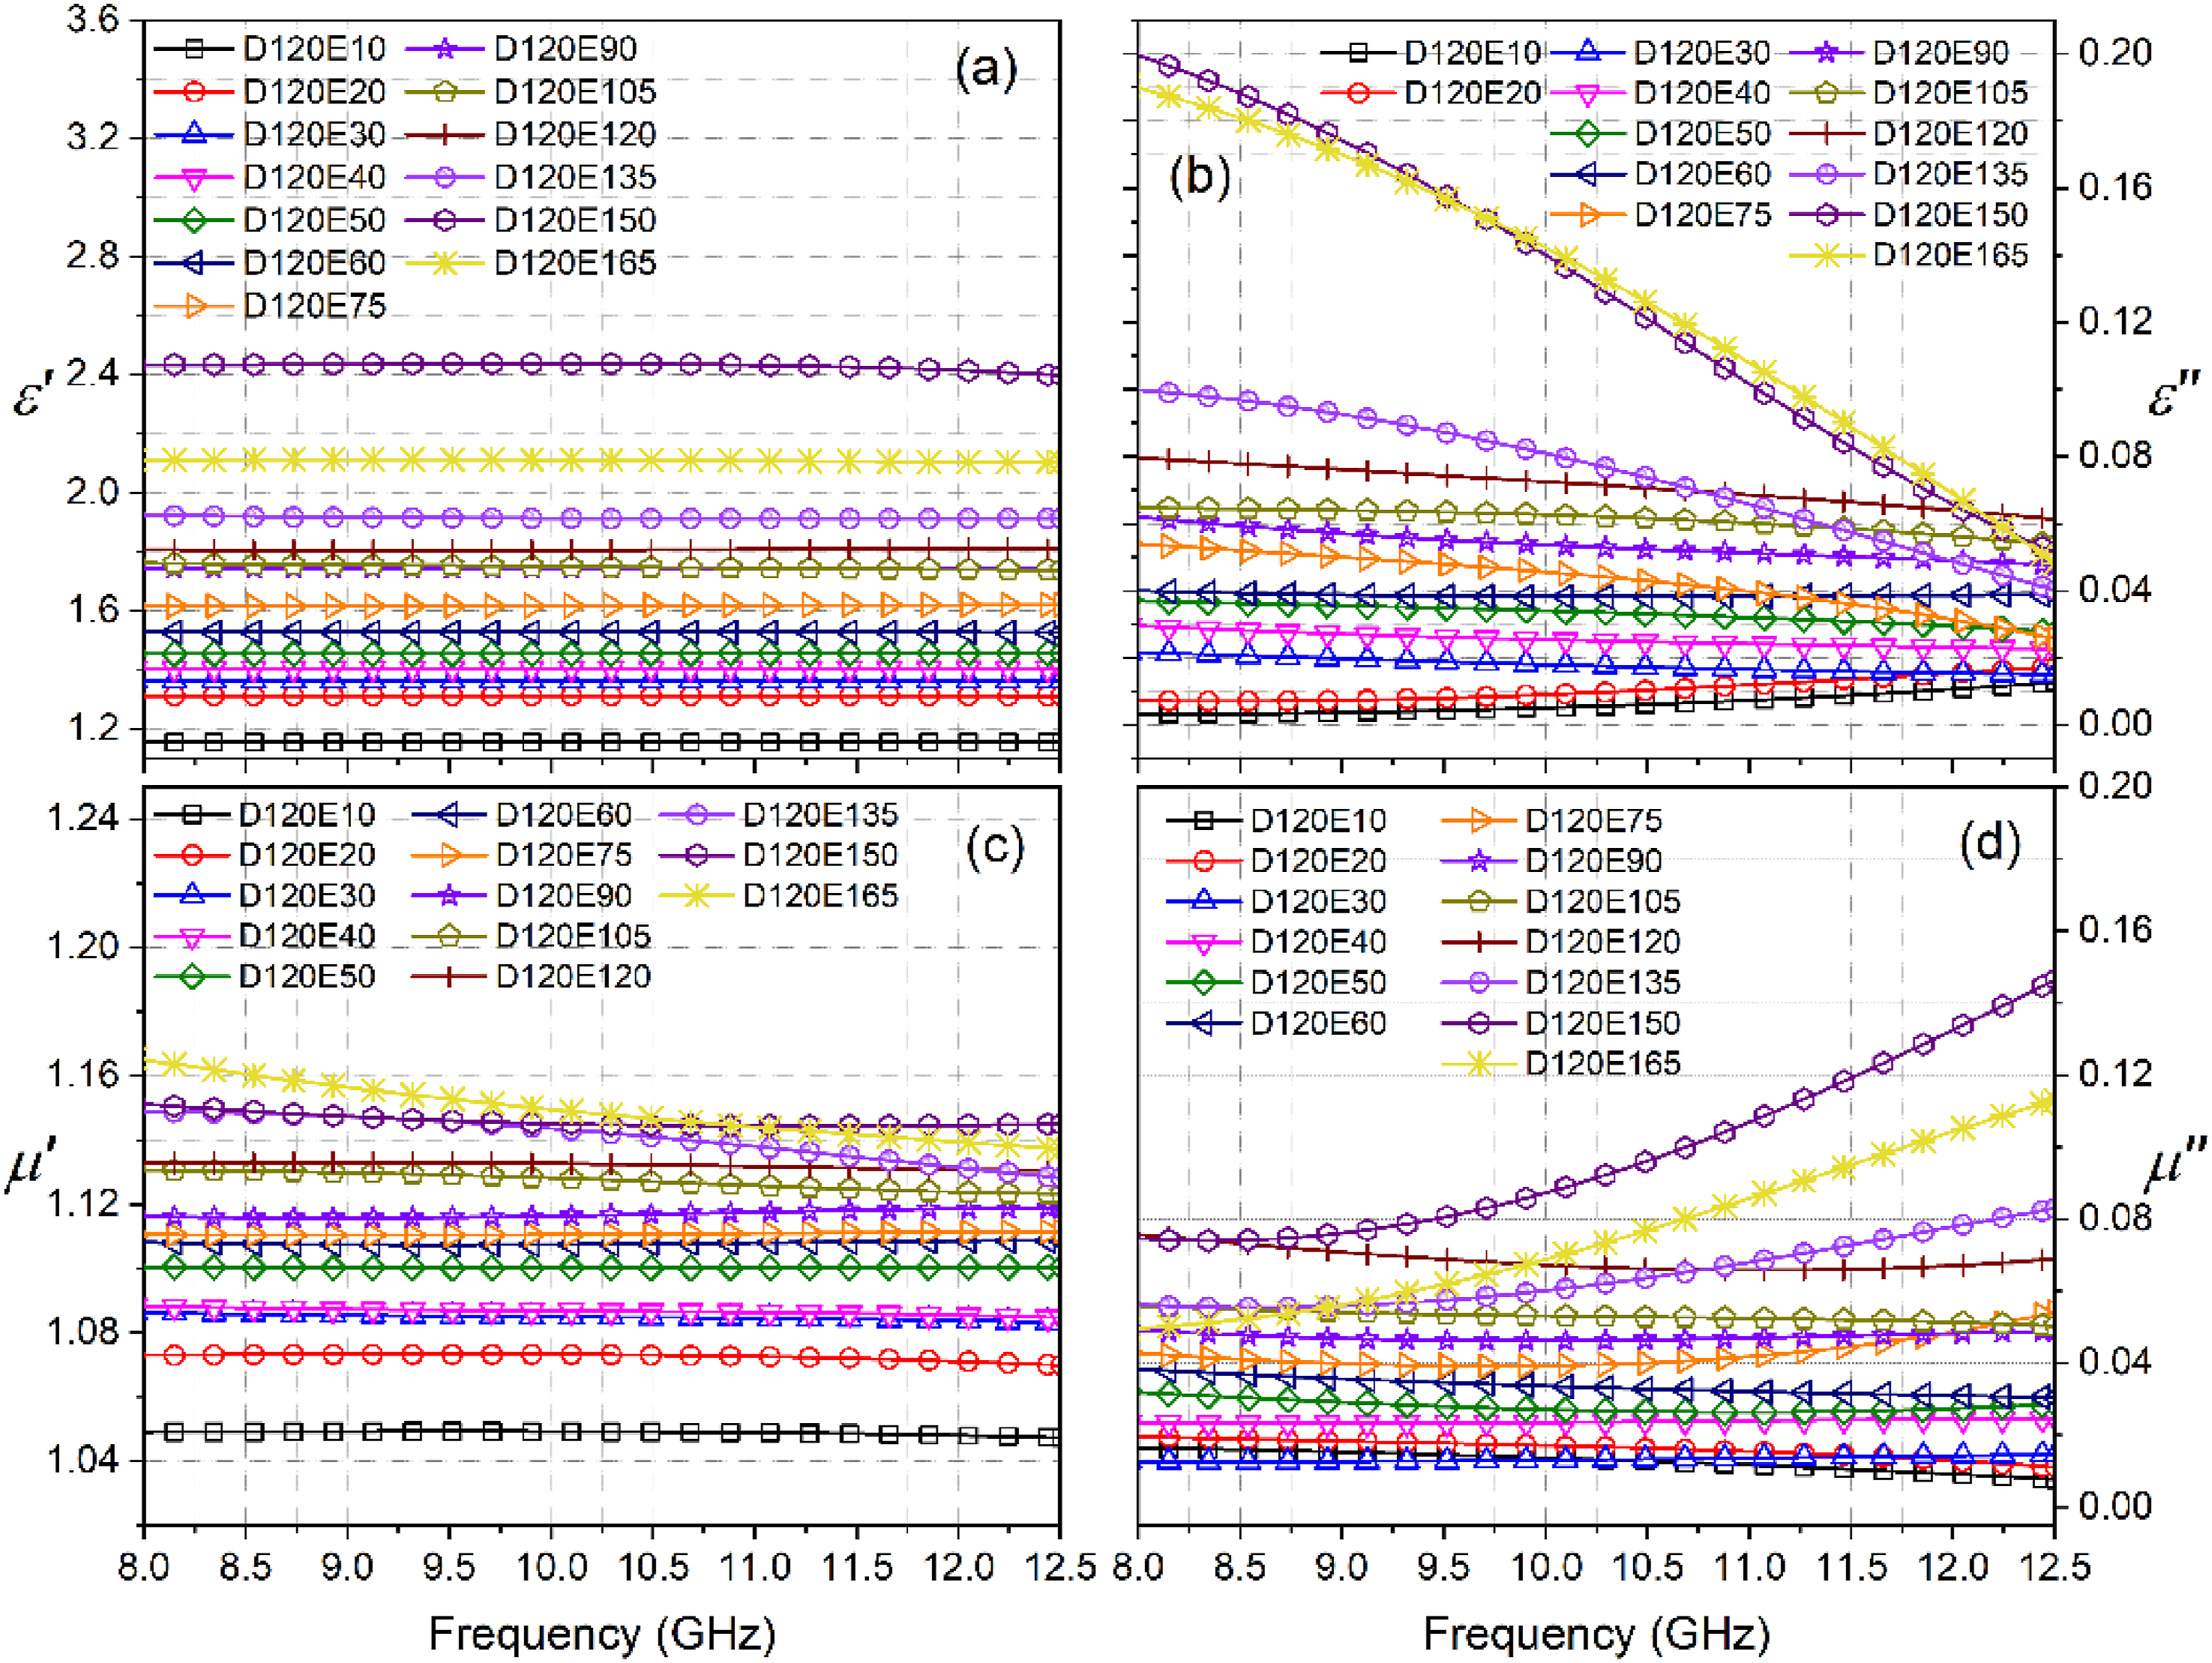
Figures 1–3 illustrate the frequency-dependent behavior of ε′, ε″, μ′, and μ″ for the D30, D80, and D120 series, revealing a general increasing trend in the real (ε′) and imaginary (ε″) parts of permittivity with increasing foam density. In polymer-based foams, bulk density becomes a key factor, as lower density is typically associated with increased porosity, meaning a higher fraction of air within the material. Air, with its relative permittivity (εr) and permeability (μr) both approximately equal to 1, contributes negligibly to dielectric or magnetic losses. Therefore, as the amount of entrapped air increases, the overall dielectric and magnetic responses of the composite are diluted. This dilution effect can lead to a reduction in both ε′ and μ′, especially in low-density foam systems where the volume fraction of functional fillers is significantly reduced due to the expanded matrix. Beyond density-related effects, the influence of filler concentration on dielectric and magnetic behavior also becomes apparent. As expected, the addition of functional filler led to a simultaneous enhancement in both dielectric and magnetic coefficients at all density levels. Notably, the real components (ε′ and μ′) exhibited a more regular and predictable trend with increasing filler concentration compared to the imaginary components (ε″ and μ″), making them more suitable for comparative evaluation. These distinctions are particularly valuable when correlating electromagnetic properties with absorption behavior, as they reflect more stable polarization and permeability contributions. (a) ε′, (b) ε″, (c) µ′ and (d) µ ″ values of D30-E(X) series samples. (a) ε′, (b) ε″, (c) µ′ and (d) µ ″ values of D80-E(X) series samples. (a) ε′, (b) ε″, (c) µ′ and (d) µ ″ values of D120-E(X) series samples.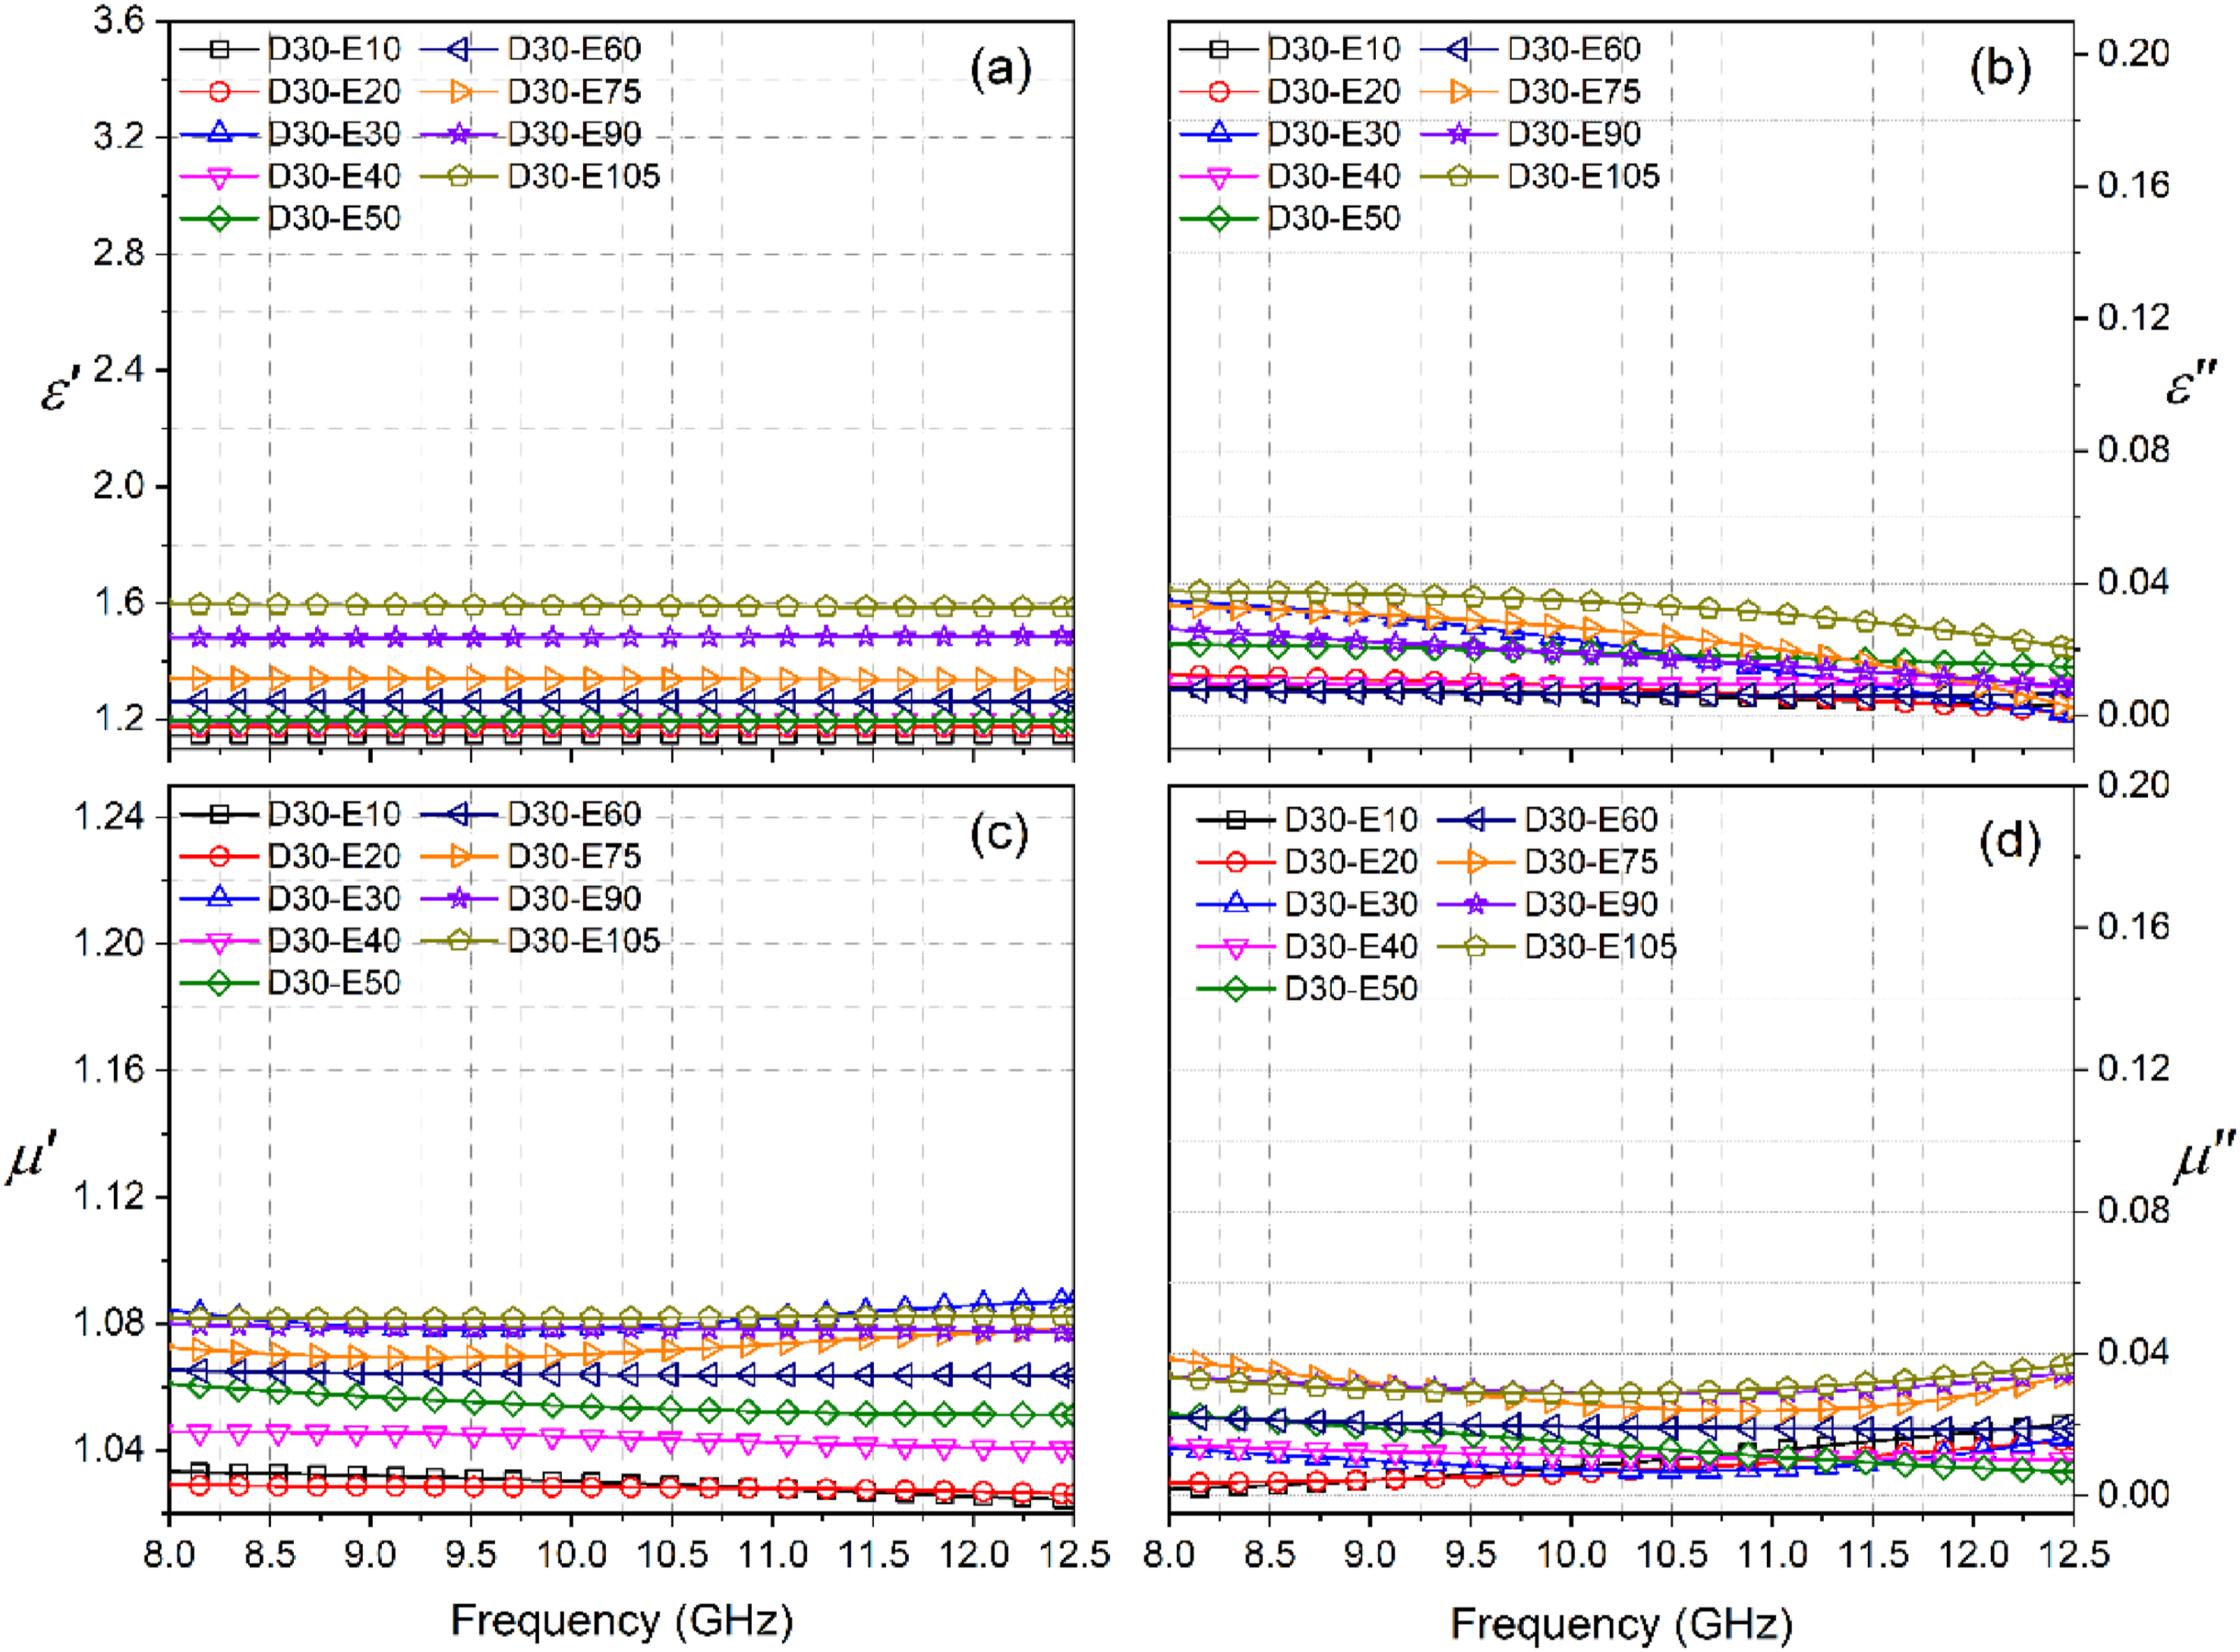
To provide a more focused comparison, Figure 4 summarizes the ε′ and μ′ values at 10.03 GHz, illustrating how filler concentration and foam density jointly influence electromagnetic properties. In the D30 series, ε′ remains relatively stable up to approximately 50 phr, beyond which a progressive increase is observed, likely indicating the formation of percolative pathways. This behavior reflects the initially limited filler connectivity in low-density foams due to greater inter-cell spacing. In contrast, the D80 and D120 series exhibit a nearly linear and continuous rise in ε′ values, suggesting that higher foam densities promote closer filler proximity and immediate interfacial interaction, resembling the behavior typically observed in thermoplastic matrices. A pronounced rise in ε′ is observed at 150 phr in the D120 series, likely due to the fillers approaching sufficient proximity to form effective interfacial polarization regions within the dense foam structure. However, at 165 phr, ε′ shows a slight decline. This reduction is attributed to the filler content surpassing the structural capacity of the foam, which leads to a deterioration in the homogeneity of filler distribution and, consequently, a disruption in dielectric continuity. As for μ′, a modest but consistent increase is observed across all densities with rising filler content. However, the magnitude of this increase is notably lower than that of ε′, which is consistent with the nature of the nickel-coated carbon fillers, contributing more significantly to dielectric polarization than to magnetic responsiveness. Variations in ε′ and µ′ values with amount of filler for the samples with different density.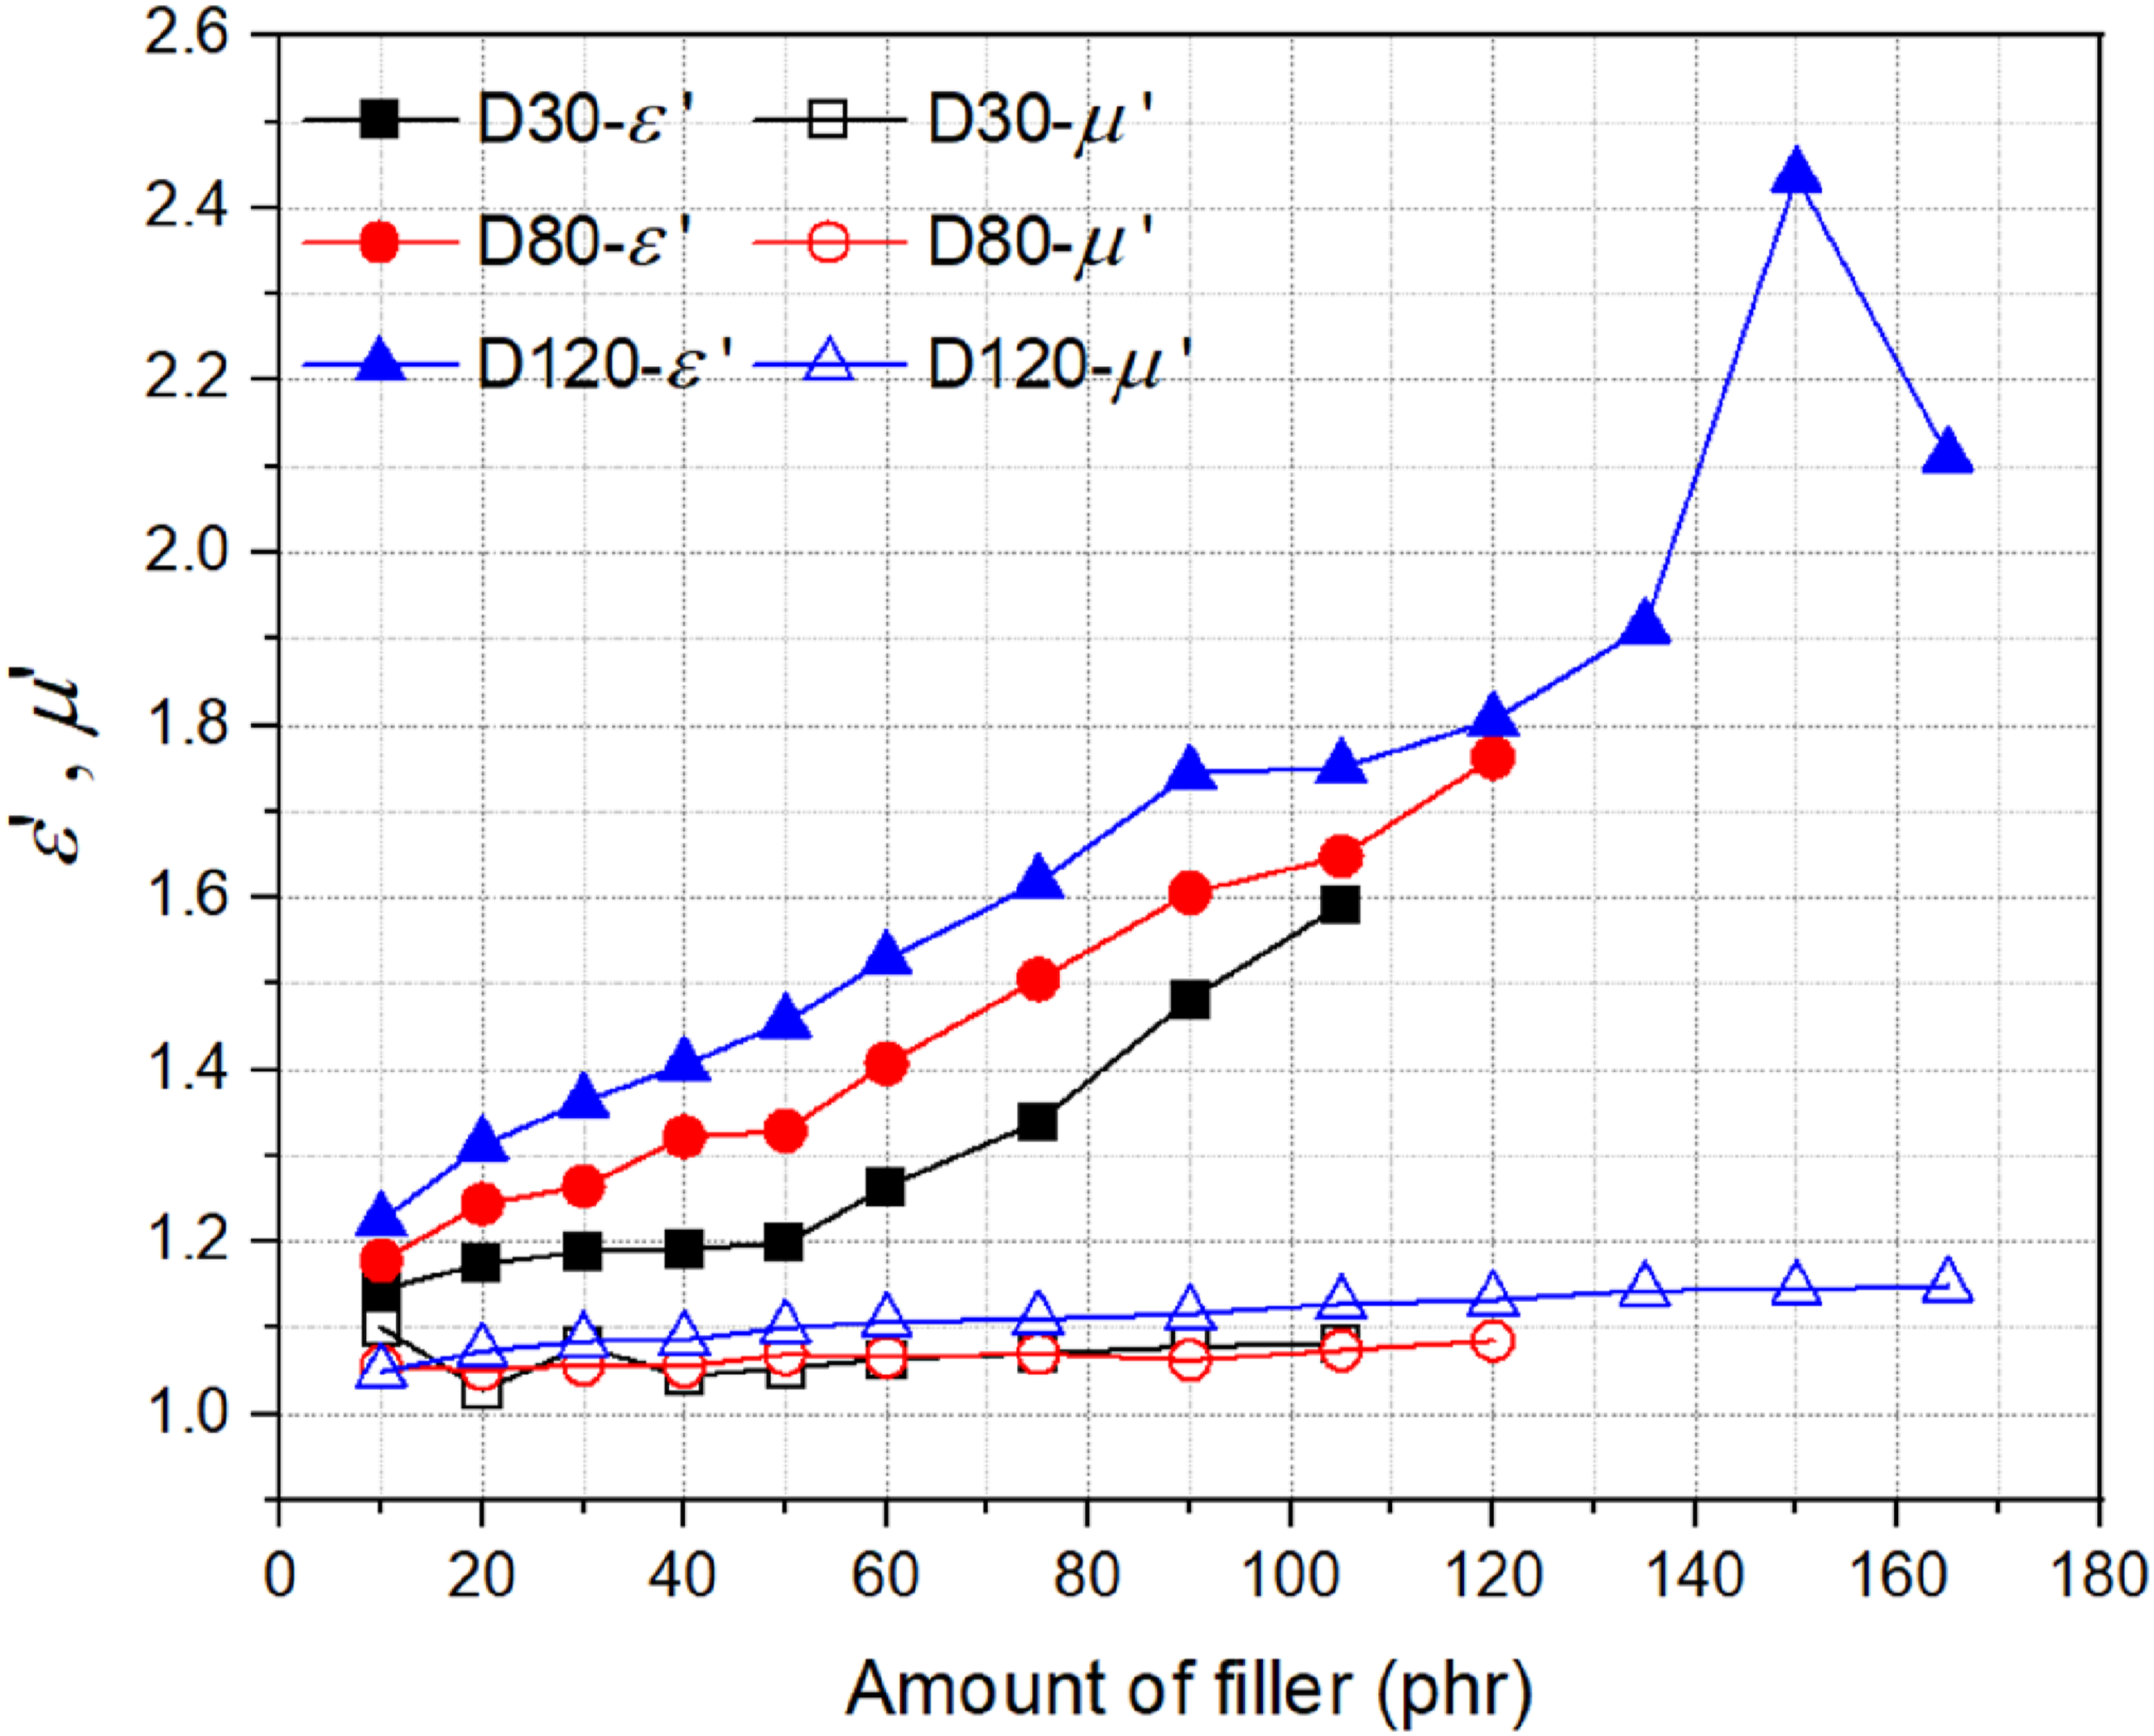
Microwave absorption properties
Throughout the study, the RL values of the samples were calculated across the entire X-band frequency range (8–12.5 GHz) for a comprehensive set of thicknesses ranging from 0.5 cm to 5 cm, in 0.5 cm increments. These results were presented as a contour map, enabling the evaluation of absorption performance not only at a fixed thickness but across a broad thickness spectrum. Consequently, the optimum thickness corresponding to maximum absorption for each sample was also identified. The detailed methodology is provided in our previous study.30–32 RL values were computed using the transmission line theory equations (Eq. 1–4), based on the measured complex permittivity and permeability data (ε′, ε″, μ′, μ″).
33
In equation (2), where the RL is calculated based on impedance values, Z
0
represents the characteristic impedance of free space (typically 377 Ω), and Z
i
denotes the input impedance of the absorbing layer. The impedance of the RAM is calculated using equation (3), where t is the material thickness and β is the propagation constant derived from the frequency and complex permittivity and permeability of the material. The parameter η
k
, representing the wave impedance of the medium, is defined in equation (4) based on the relative complex material parameters. In this context, Z
L
corresponds to the impedance of a theoretically perfect conductor (0 Ω) used as the backing layer. The contour maps of the samples are presented in Figures 5–8, where the effects of filler concentration and foam density on absorption behavior can be clearly tracked. Critical performance parameters derived from these results—including RL
min
, the frequency and thickness corresponding to RL
m
i
n
, effective absorption bandwidths, and the required thickness for full X-band coverage—are compiled in Table 1. Contour maps of (a) D30-E60, (b) D30-E75, (c) D30-E90 and (d) D30-E105 samples. Contour maps of (a) D80-E60, (b) D80-E75, (c) D80-E90, (d) D80-E105, (e) D80-E120. Contour maps of (a) D120-E60, (b) D120-E75, (c) D120-E90 and (d) D120-E105 samples. Contour map of (a) D120-E120, (b) D120-E135, (c) D120-E150 and (d) D120-E165 samples. RAM performance parameters of the samples having different composition. af: required frequency value to obtain RL
min
. bd: required thickness value (cm) to obtain RL
min
. cIn case of Abs. Bandwith <1 GHz, it was reported as not observed (n.o). dt: required thickness value of the samples (cm) to obtain absorption bandwidth covering the whole X-band.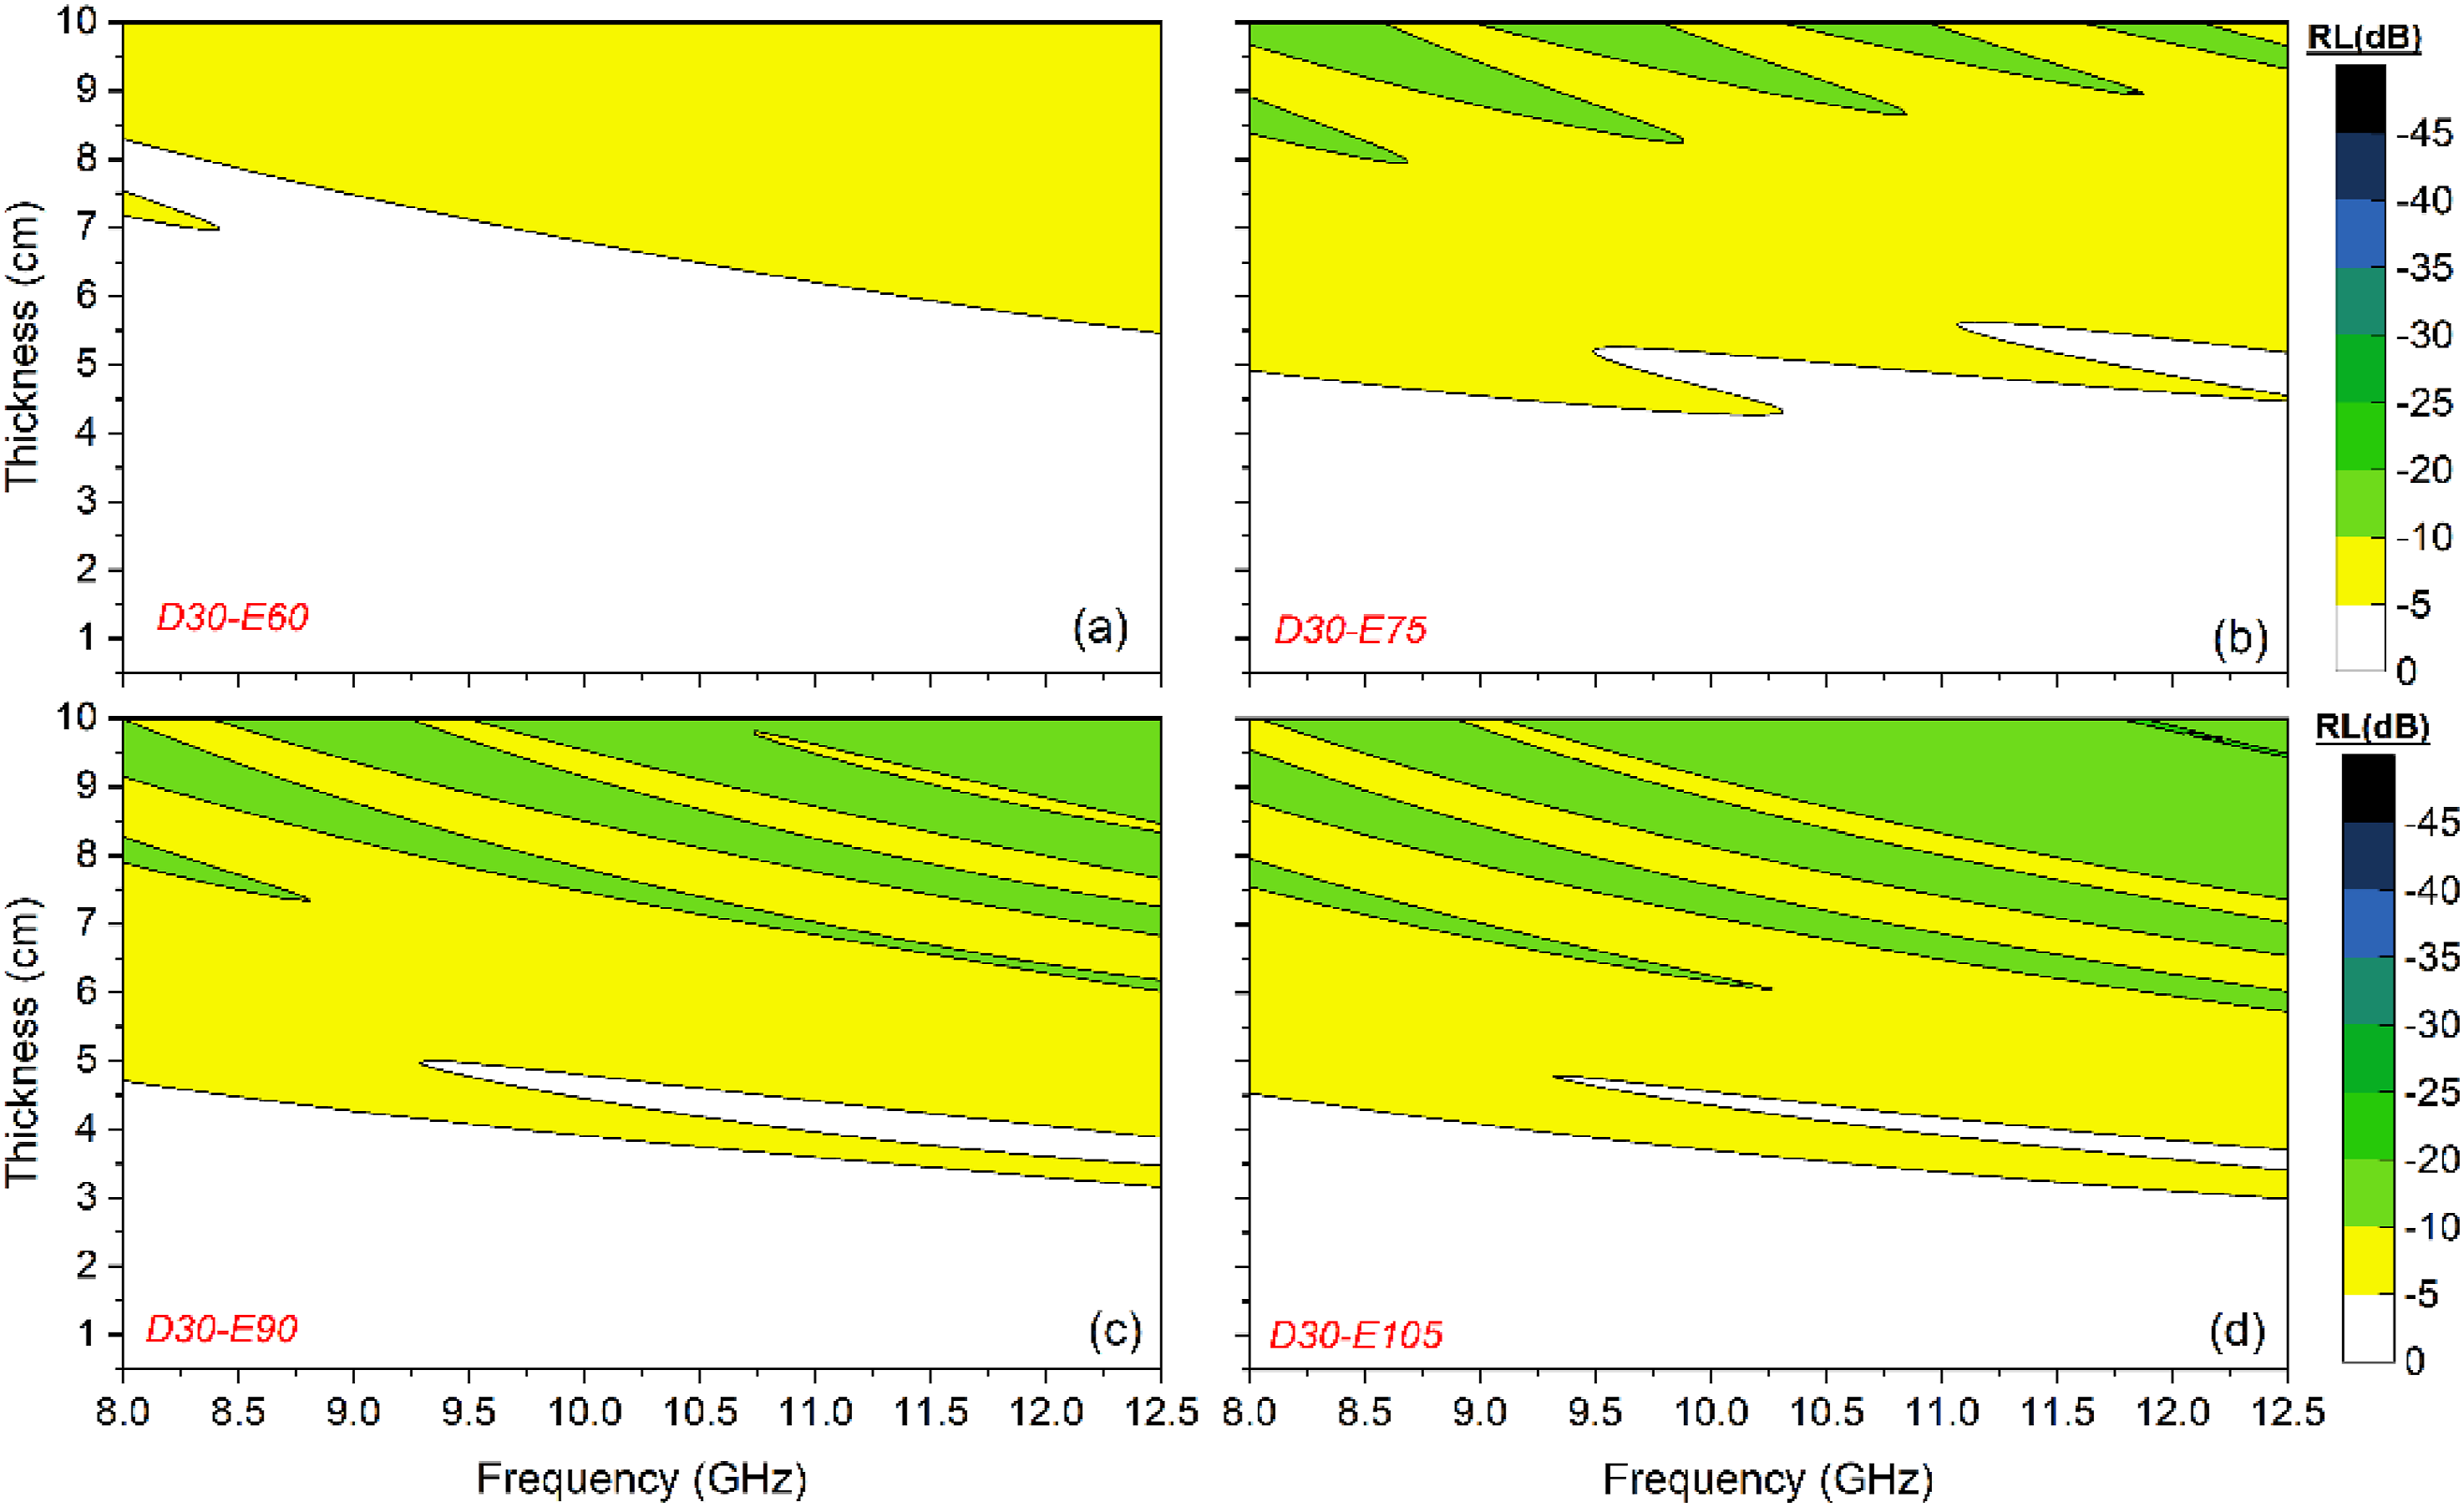
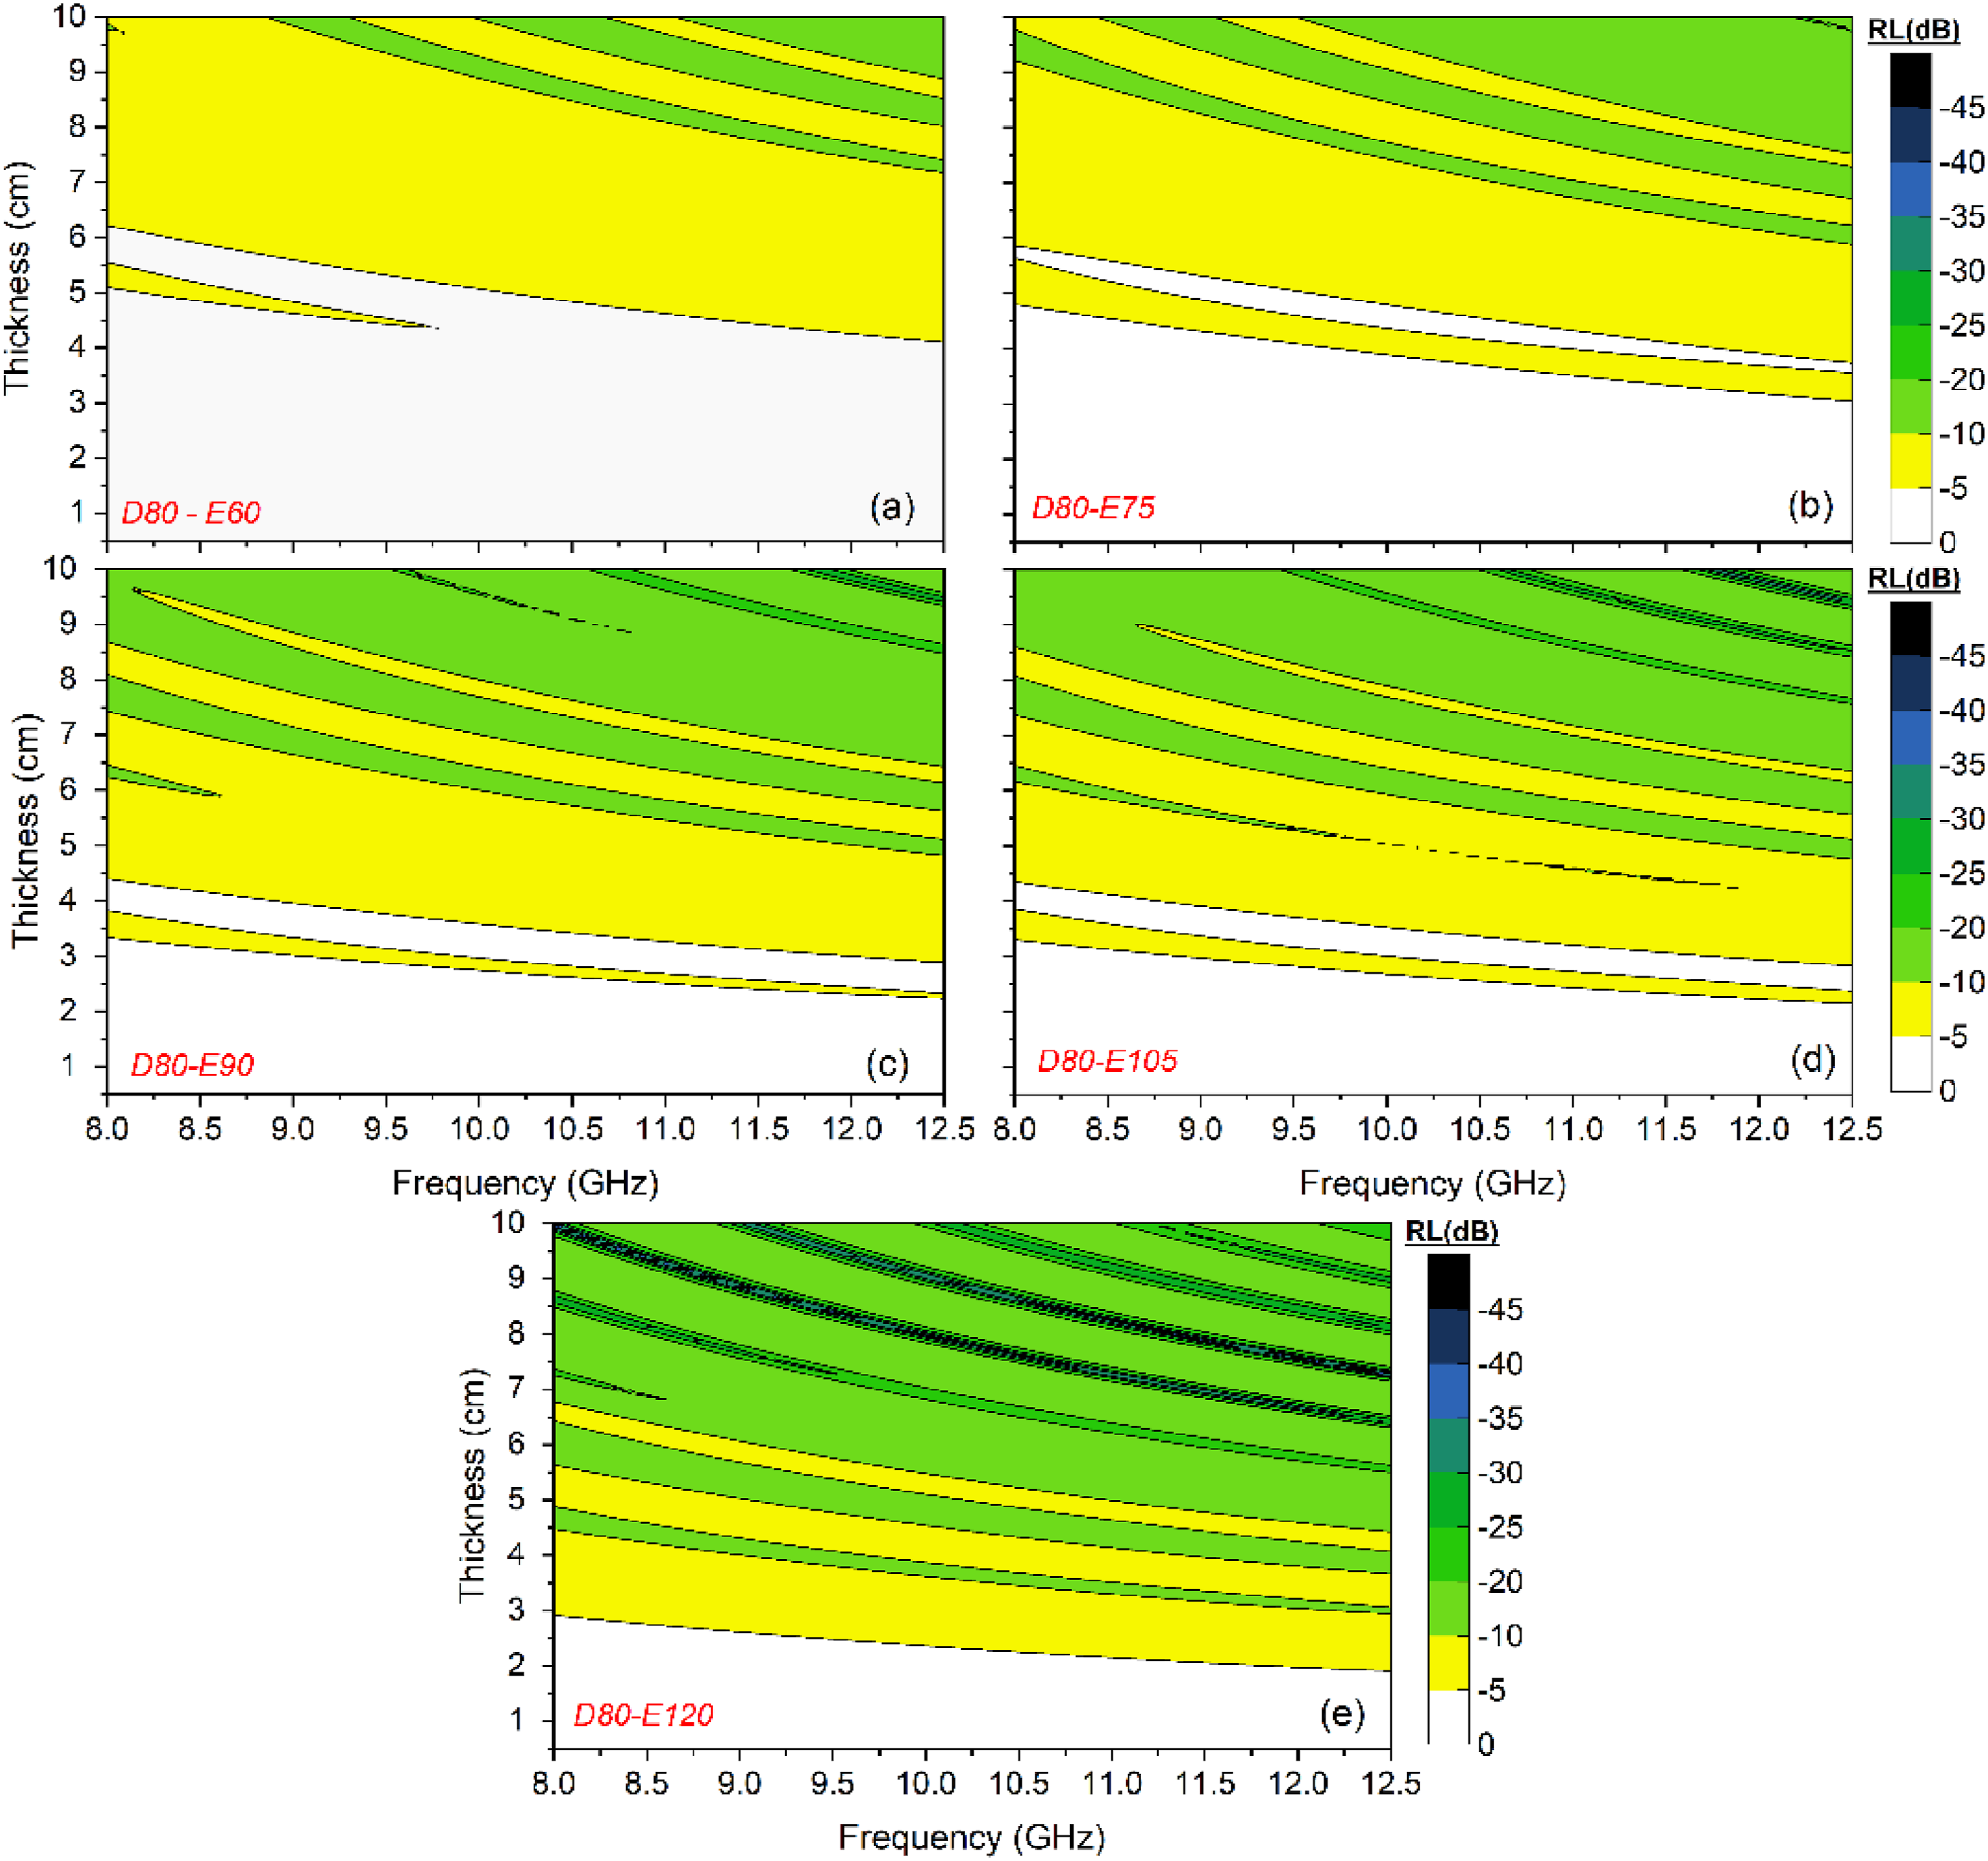
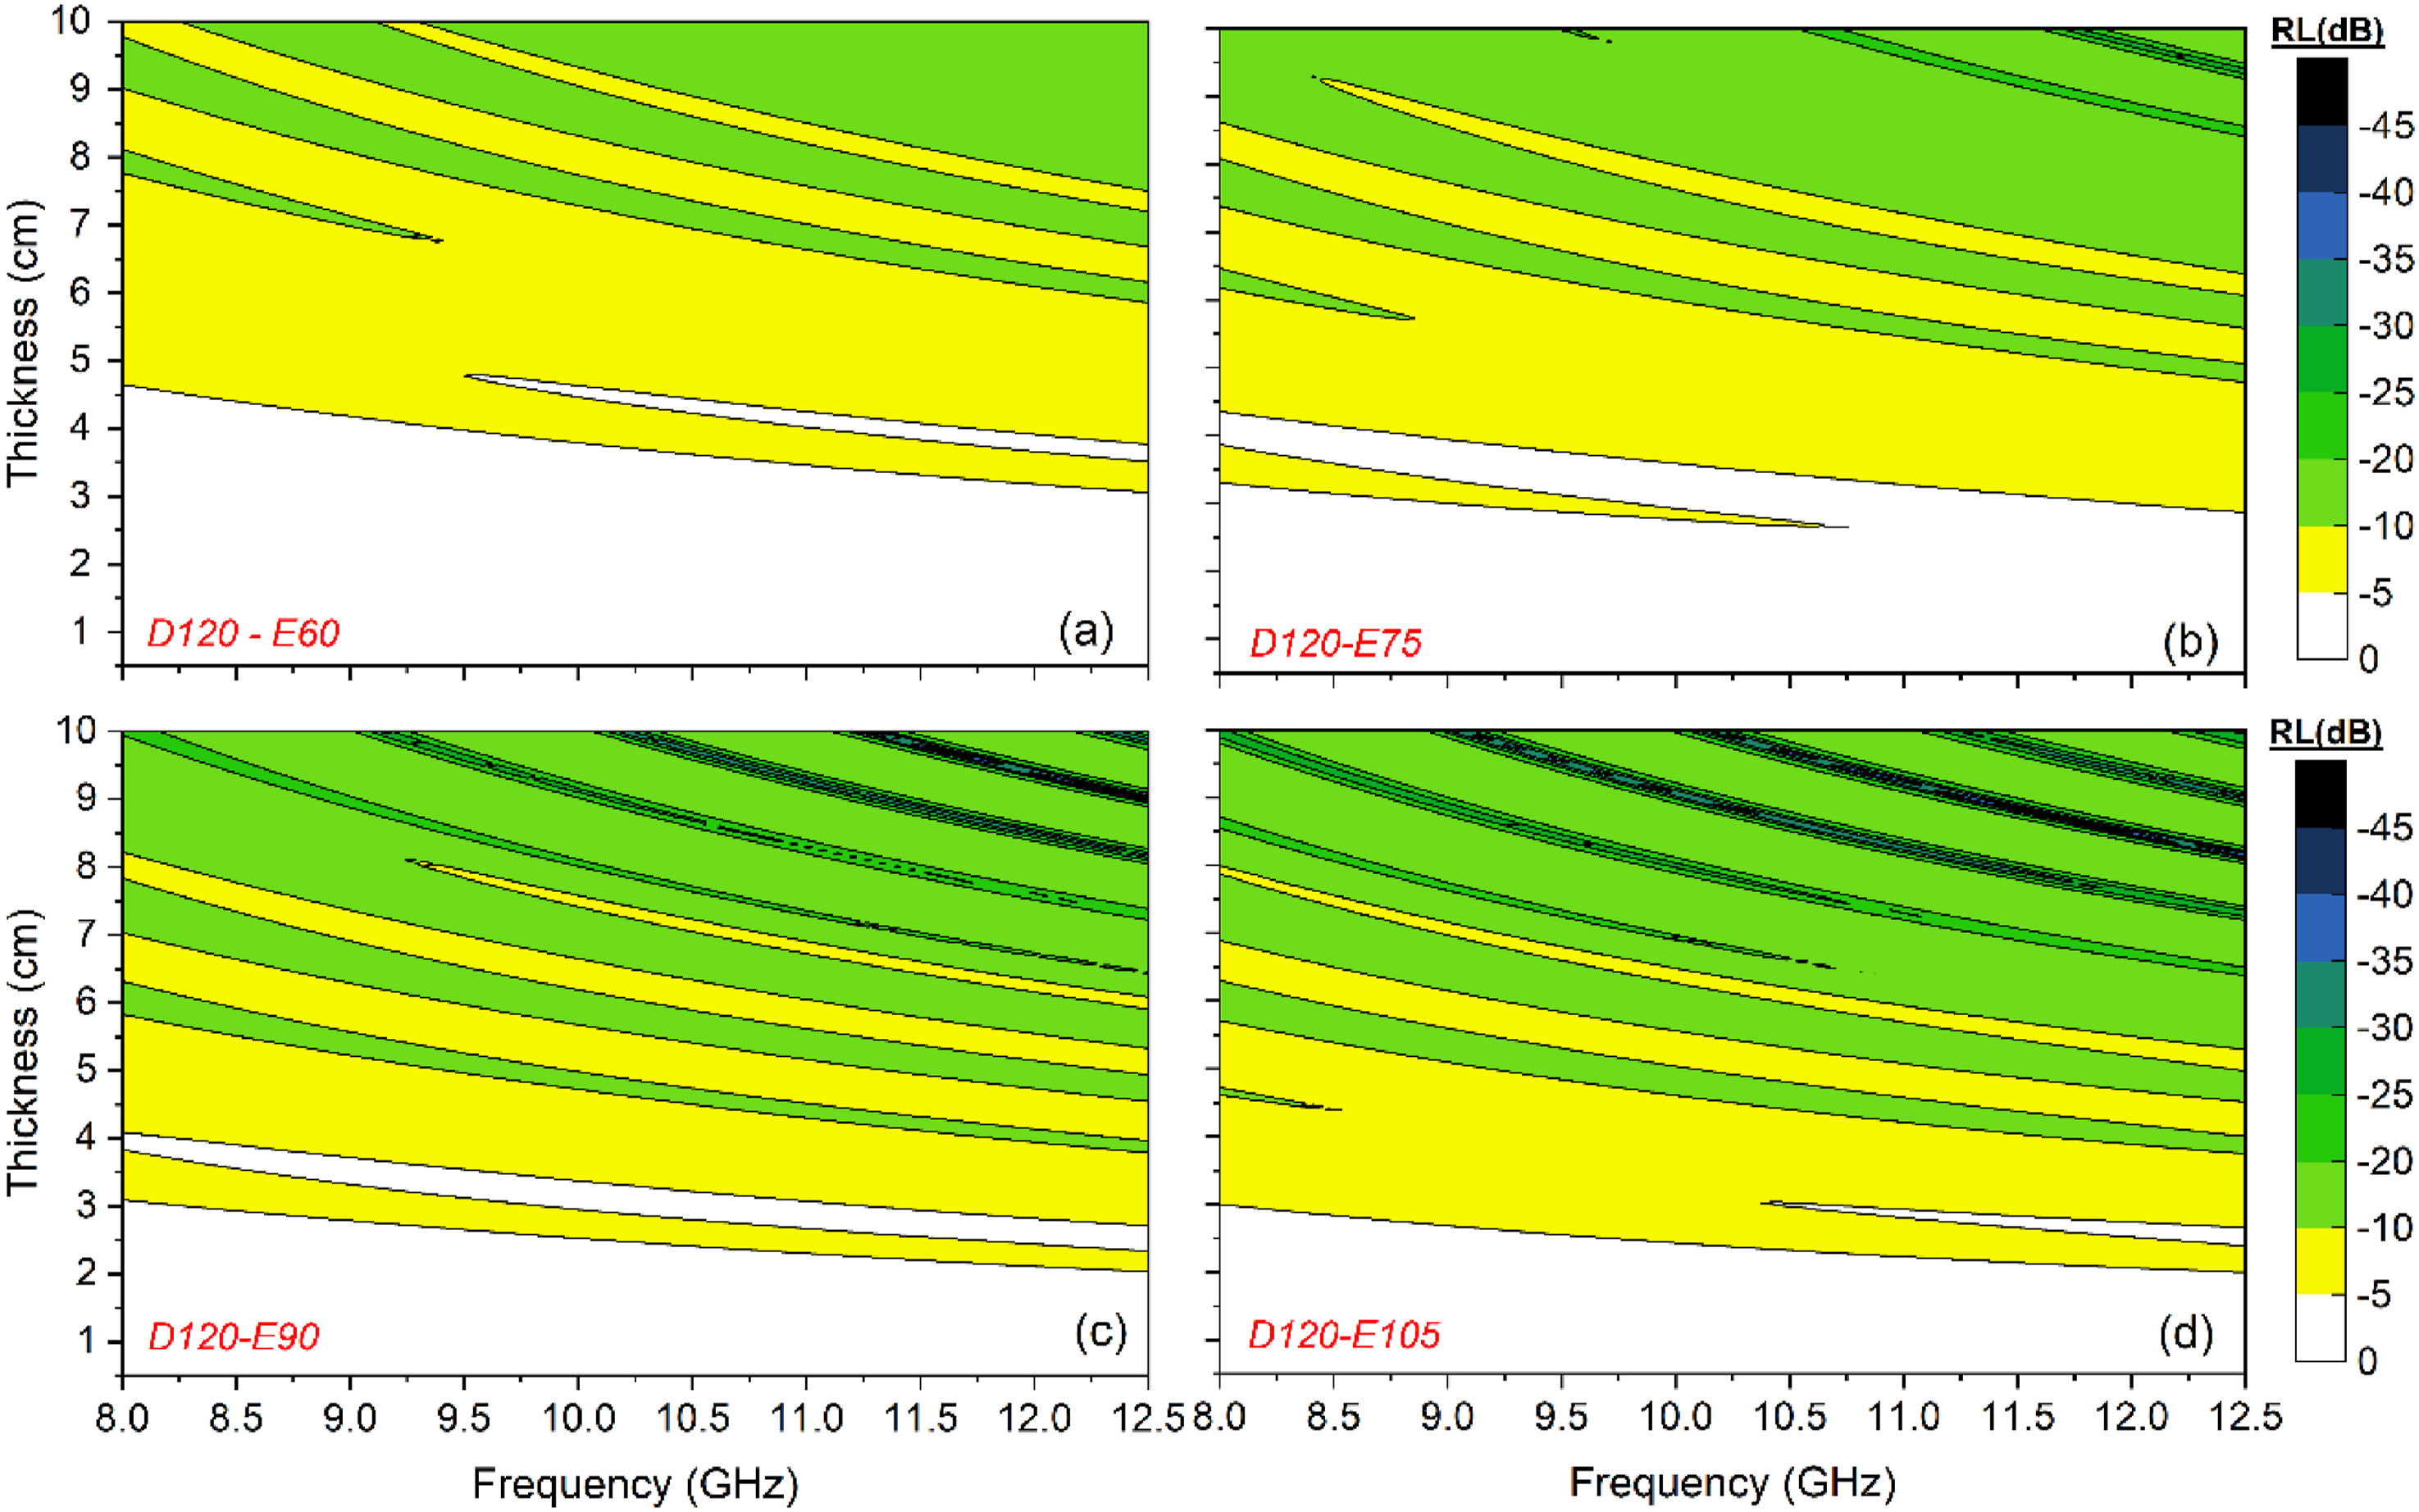
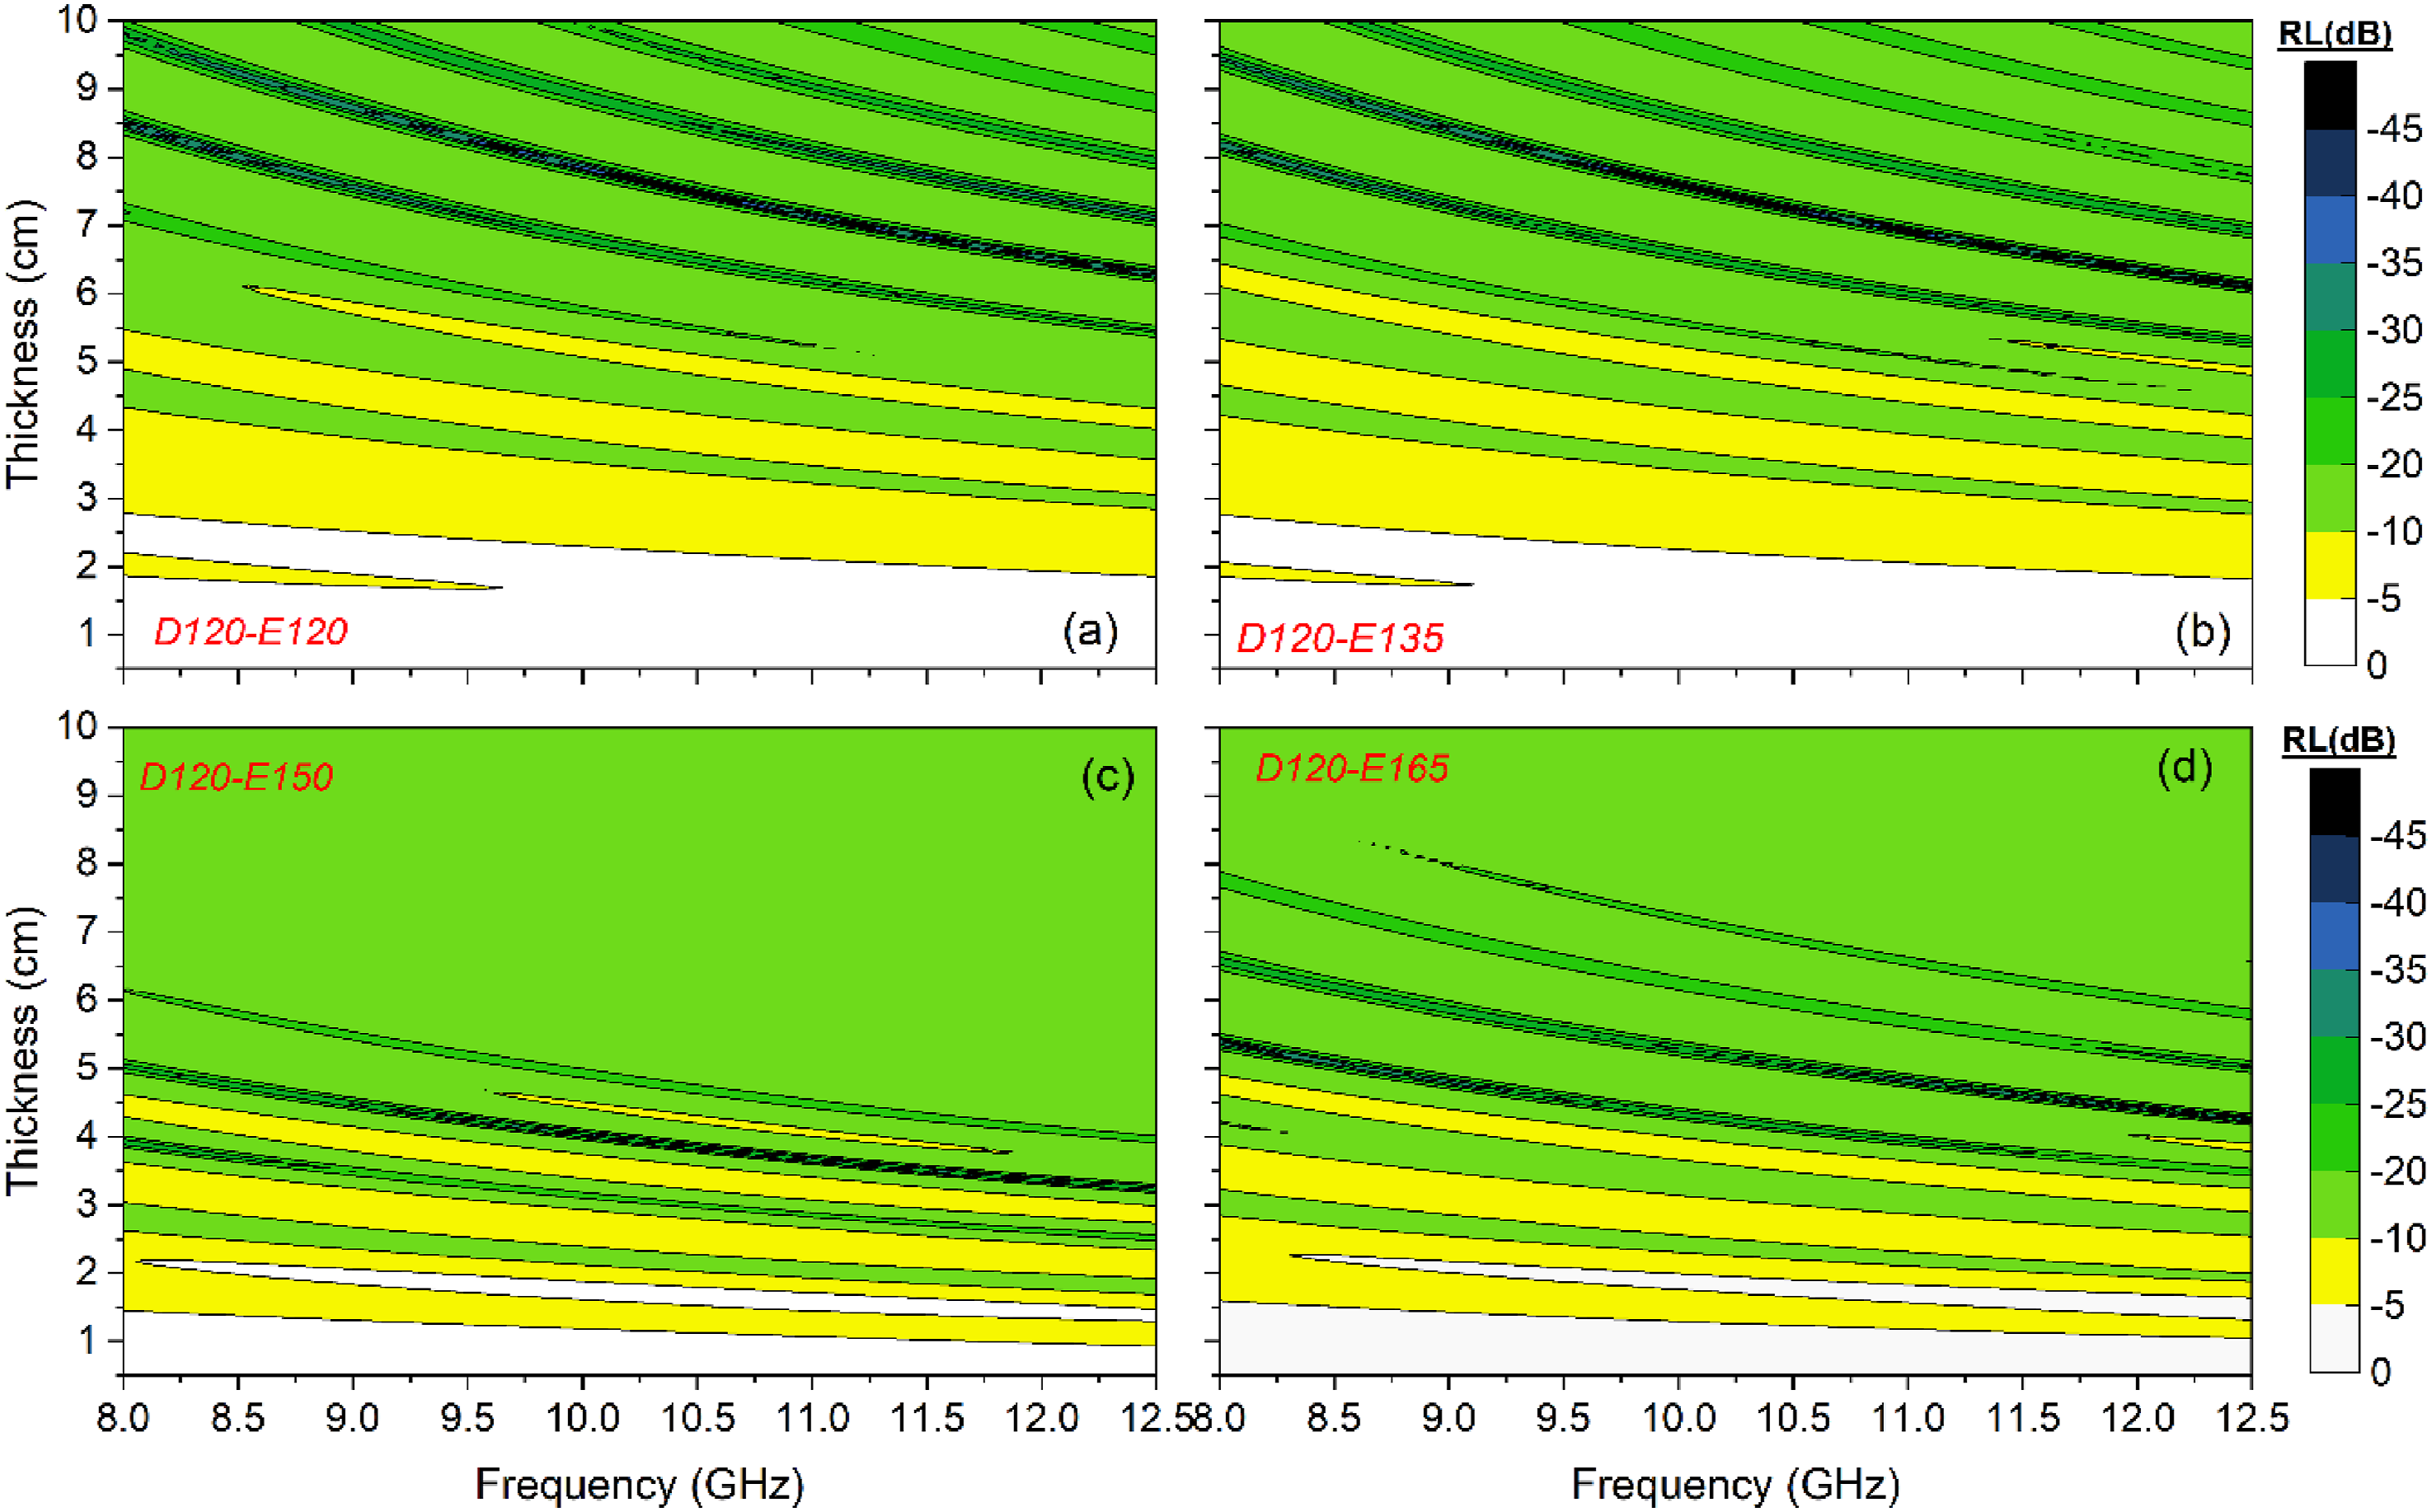
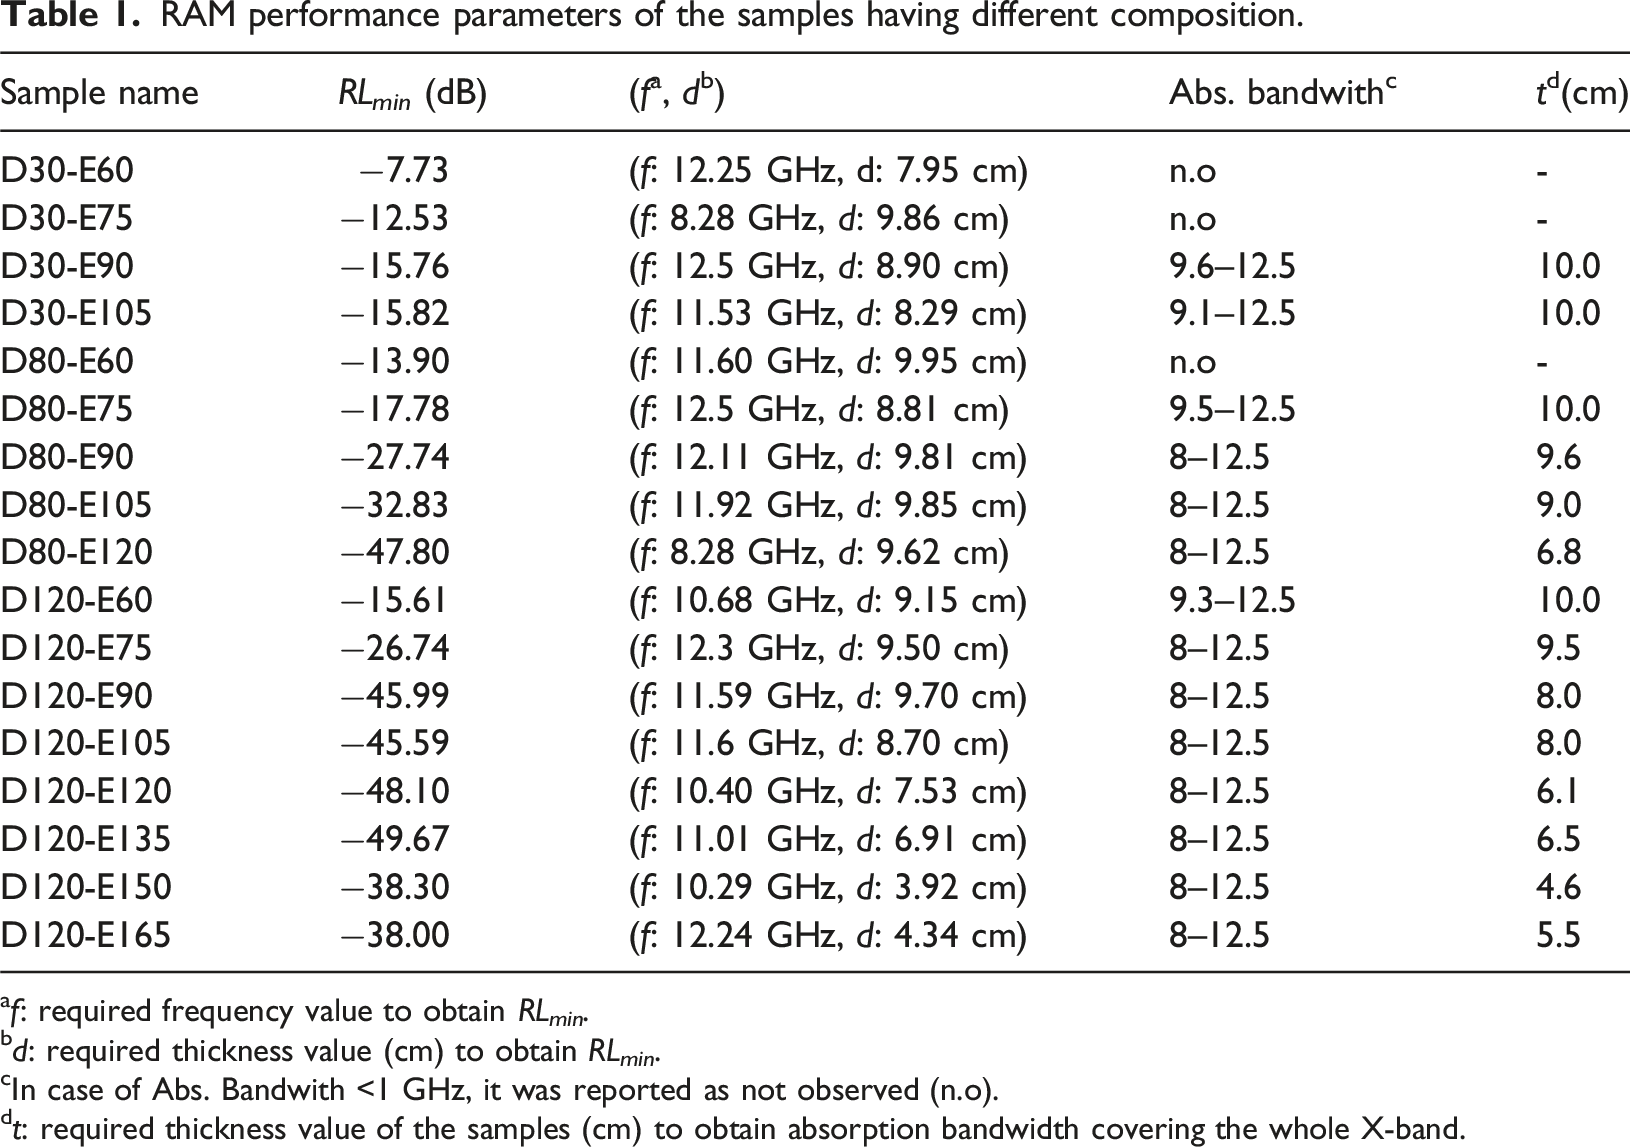


Figure 6 presents the contour maps of D80 series samples, including those with the same filler concentrations as the D30 series (60, 75, 90, and 105 phr), along with a new composition containing 120 phr of filler. Compared to their D30 counterparts, D80 series samples exhibit significant improvements in microwave absorption behavior, both in reducing the minimum thickness required to meet RL ≤ −10 dB and in achieving deeper RL min values. Figure 6(a) shows that the D80-E60 sample successfully reaches the −10 dB threshold, providing effective absorption in the 11–12.5 GHz range at a 10 cm thickness. In contrast, D30-E60 showed no substantial absorption at any thickness. Figure 6(b) demonstrates a similar enhancement for D80-E75, where the RL values fall below −10 dB over a relatively wide and uninterrupted frequency range (9.5–12.5 GHz), yielding an RL min of −17.78 dB. Figure 6(c) and (d) highlight that D80-E90 and D80-E105 achieved full X-band absorption at reduced thicknesses of 9.6 cm and 9.0 cm, with RL min values of −27.74 dB and −32.83 dB, respectively. Finally, Figure 6(e) reveals that D80-E120 offers full-band absorption from 8 to 12.5 GHz at only 6.8 cm thickness. Moreover, this sample reaches an RL min of −47.80 dB at 8.28 GHz and 9.62 cm thickness, with RL values dropping below −20 dB in select frequency intervals. This systematic enhancement across the D80 series reflects the combined effect of intermediate foam density and progressive filler content in optimizing impedance matching and broadening absorption bandwidth.
Due to the large number of D120 series samples showing strong absorption, the corresponding contour maps are presented separately in Figures 7 and 8 for clarity and organization. Figure 7 presents the contour maps for D120 series samples with filler contents up to 105 phr, specifically D120-E60 (a), D120-E75 (b), D120-E90 (c), and D120-E105 (d). The results show a clear trend: as the filler content increases, the thickness required to achieve full X-band absorption steadily decreases. For example, the D120-E75 sample achieved an absorption bandwidth of 9.3–12.5 GHz at 9.5 cm thickness. With increasing filler concentration, D120-E90 and D120-E105 reached full X-band absorption at 8.0 cm and 7.0 cm thicknesses, respectively, except for a very narrow frequency gap in D120-E105. Additionally, the RL min values improved from −27.7 dB to −46–48 dB across these samples, indicating stronger attenuation performance. These results highlight the critical role of high foam density in facilitating closer filler proximity and more efficient dielectric interaction, which in turn promotes earlier percolation thresholds and improved absorption. Notably, the D120-E60 sample, although not included in the figure, also demonstrated respectable performance with an RL min of −15.61 dB at 10.68 GHz and an absorption bandwidth spanning 9.3–12.5 GHz at 10 cm thickness. This performance not only exceeds that of all D30 samples but also reinforces the importance of matrix density in achieving uniform filler dispersion and functional synergy, even at lower filler concentrations.
Figure 8 presents the contour map of the D120 series PUF samples formulated with higher filler contents (D120-E120, D120-E135, D120-E150, and D120-E165), highlighting how the increased foam density of the D120 matrix accommodates elevated filler loadings while maintaining microwave absorption performance. The contour map reveal that with increasing filler concentration, RL values deepen and absorption regions broaden significantly, especially for D120-E135 and D120-E150. For instance, D120-E150 demonstrates full X-band coverage with RL values dropping below −45 dB in wide regions and reaching an RL min of −49.67 dB at a thickness of 6.91 cm. Furthermore, the D120-E150 sample provides this performance at a reduced thickness of approximately 4.6 cm, marking it as an optimal configuration. However, a decline in performance is observed for D120-E165. Although its filler concentration is the highest, the RL min value decreases to −38.00 dB, and the required thickness for full-band coverage increases to about 5.5 cm. This deviation suggests that beyond 150 phr, the foam matrix can no longer ensure uniform dispersion, leading to filler agglomeration and impedance mismatch. Thus, 150 phr emerges as the practical upper limit for maintaining efficient, broadband absorption in this system.
Investigation of the effect of filler localization on dielectric and microwave absorption properties
Morphological and physical observations
SEM images of the D120-E150 samples, which demonstrated the highest absorption performance among all tested formulations, are presented in Figure 9 to illustrate the morphological differences arising from three distinct dispersion strategies. In the sample where the filler was added entirely to the polyol phase (Figure 9(a) and (b)), significant agglomeration was observed along the cell walls, resulting in increased wall thickness and occasional voids due to insufficient phase integration. In contrast, in the pMDI-based sample (Figure 9(c) and (d)), fillers were predominantly embedded within the cell interiors, which restricted pore expansion and resulted in a denser and finer cellular structure. The 50/50 dispersion strategy (Figure 9(e) and (f)) led to a more homogeneous filler distribution throughout the foam matrix, minimizing agglomeration and supporting better cell integrity. Notably, almost no filler was observed within the cell walls of the pMDI-based sample (Figure 9(c) and (d)), confirming that filler localization significantly influences wall morphology. Furthermore, the observed variations in cell size and size distribution strongly depended on filler positioning. Fillers concentrated between the cells (Figure 9(a) and (b)) obstructed expansion by physically blocking foam growth. In contrast, embedding fillers within the cells (Figure 9(c) and (d)) facilitated larger and more uniform cell formation. SEM images of (a–b) D120-E150, (c–d) D120-E150 (pMDI), (e–f) D120-E150 (50/50).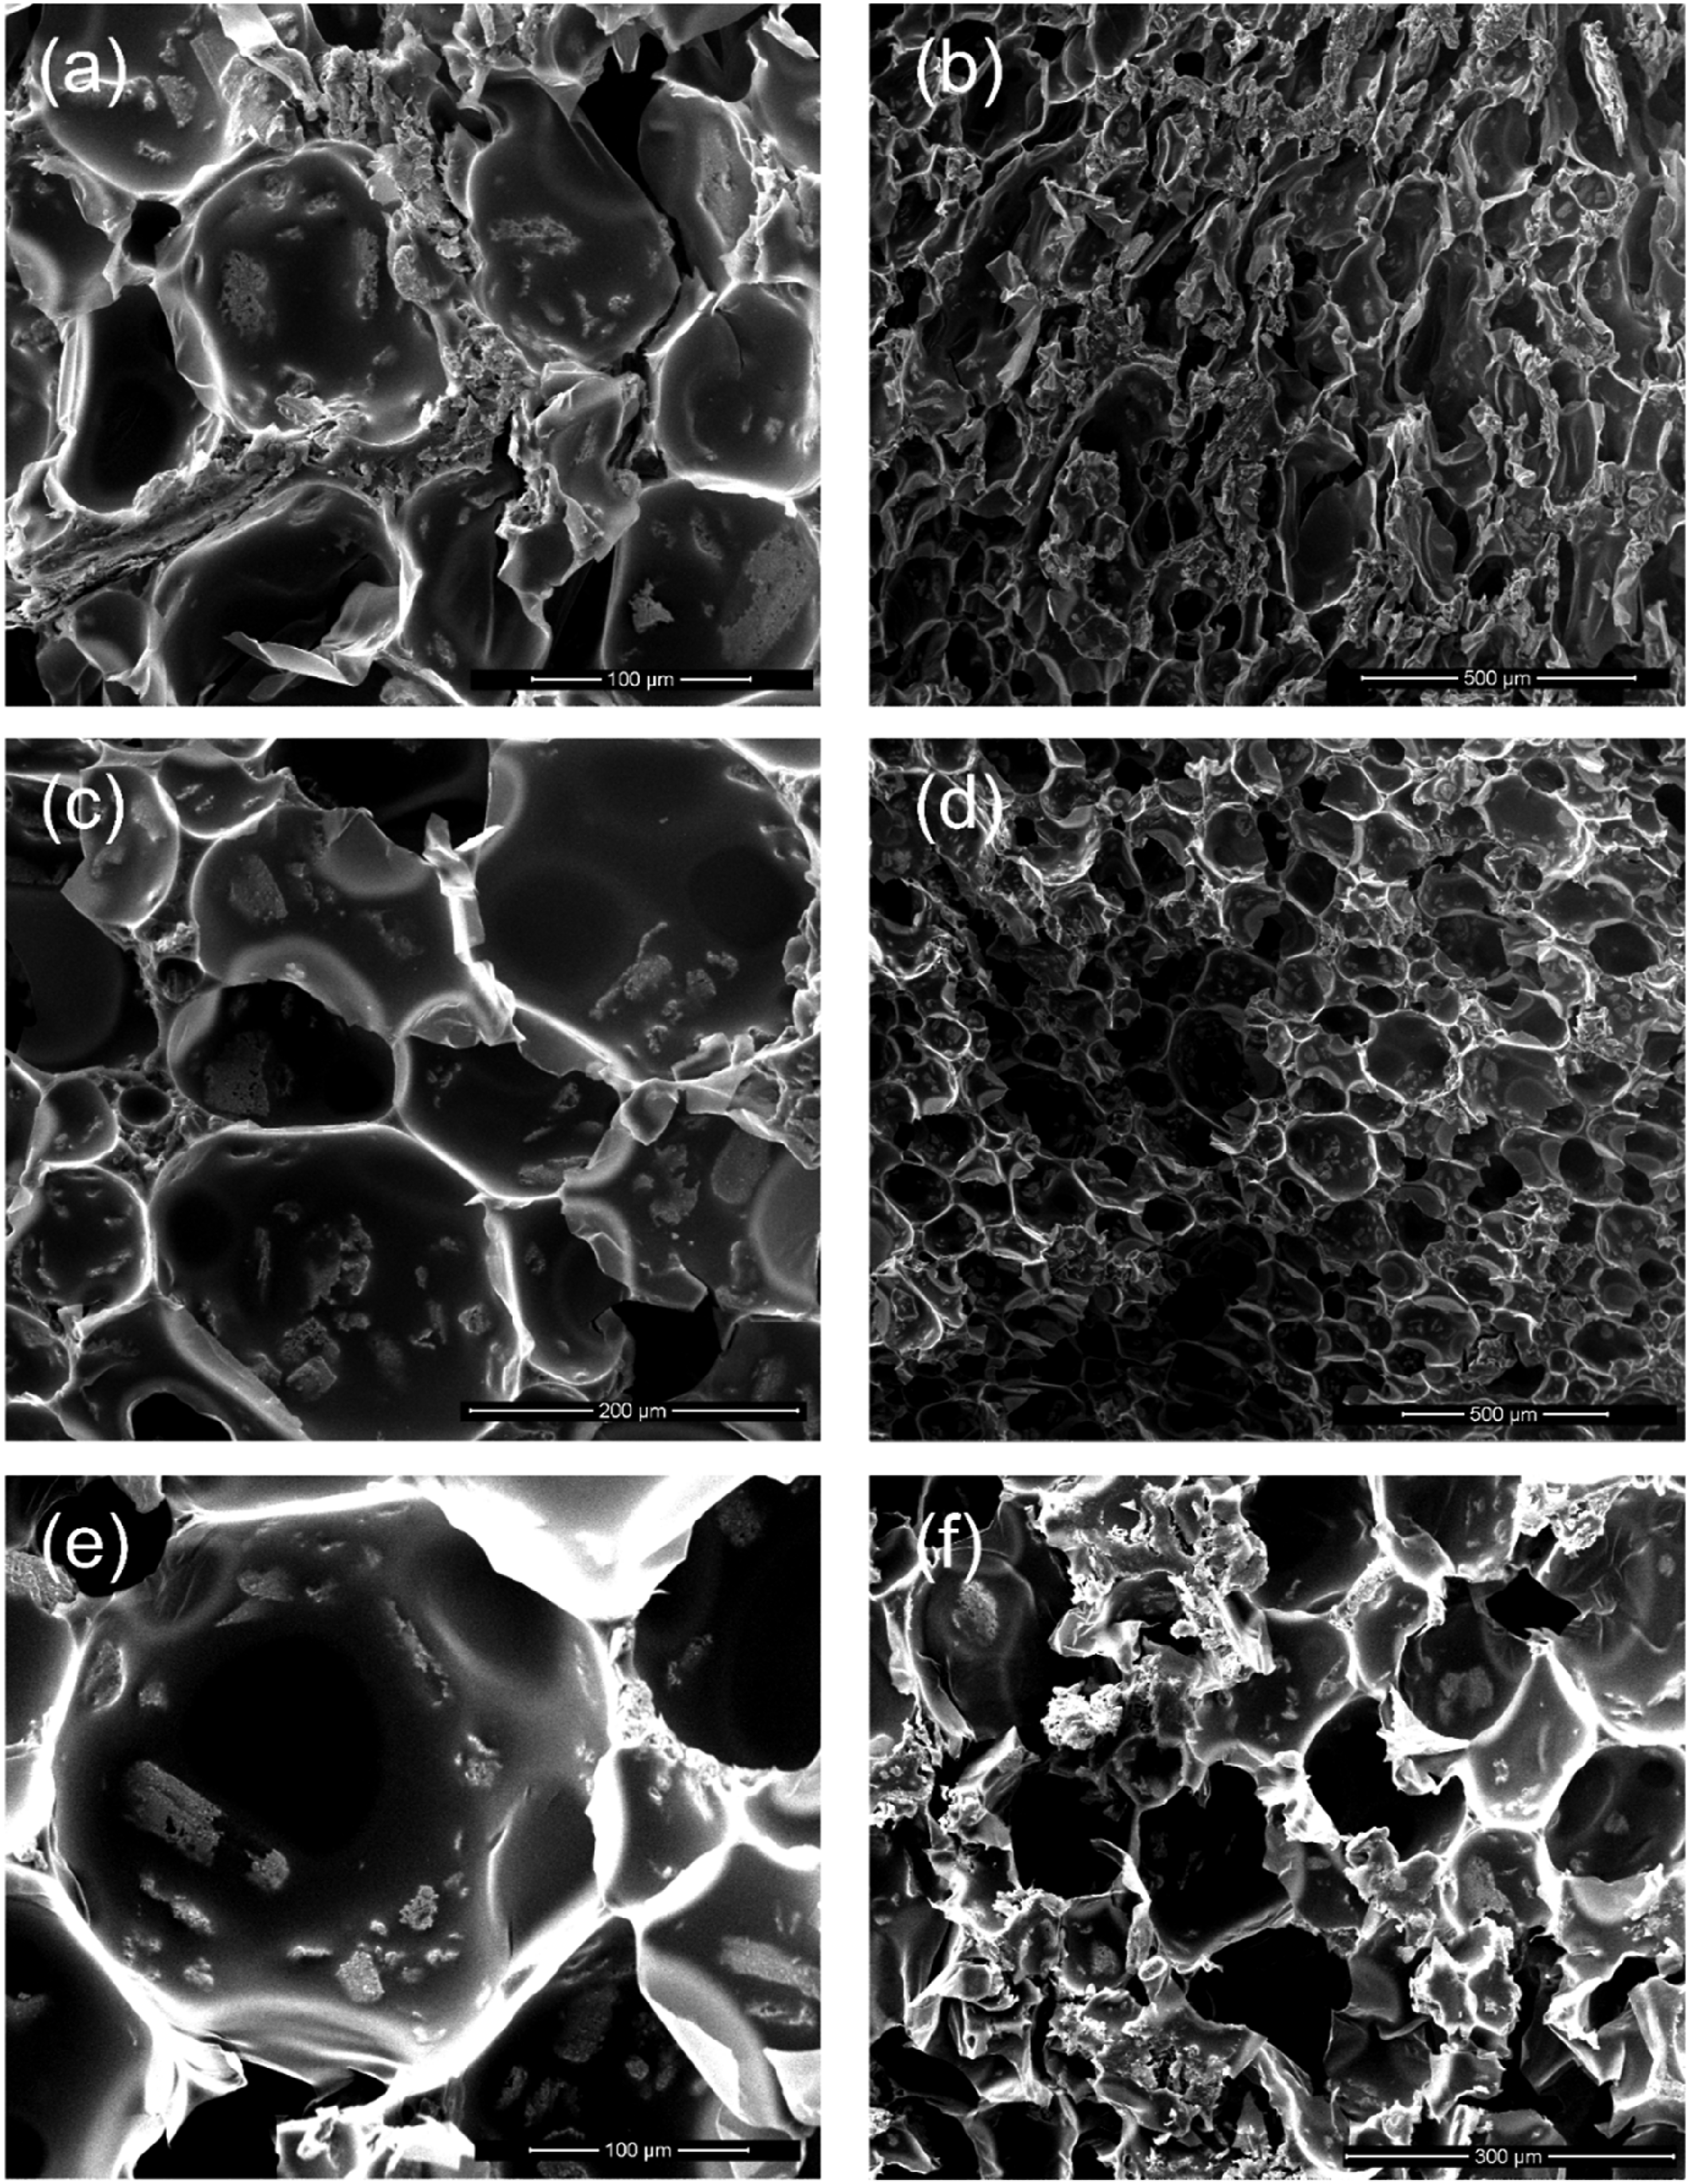
Comparison of theoretical and experimental density values.

Dielectric characterizations
Figure 10 presents the dielectric parameters of the samples. A clear trend is observed, where the sample dispersed via pMDI has the highest ε′ and ε″ values, followed by the 50/50 blend, and finally the polyol-dispersed sample. This can be attributed to the more compact and filler-dense morphology achieved with pMDI dispersion. The increase in ε″, in particular, corresponds to higher dielectric loss, which is critical for electromagnetic wave attenuation. This increase in dielectric loss (ε″) also reflects a greater conversion of electromagnetic energy into heat, enhancing the material’s absorbing efficiency. While the 50/50 sample maintains relatively high values, it provides more consistent performance due to its balanced dispersion profile. Notably, despite having identical filler type and content, the three samples exhibited significantly different dielectric properties, clearly demonstrating that filler positioning and distribution method within the same formulation are key parameters influencing the final electromagnetic behavior of polyurethane foam composites. (a) ε′, (b) ε″, (c) µ′ and (d) µ ″ values of D120-E150, D120-E150 (pMDI) and D120-E150 (50/50) samples.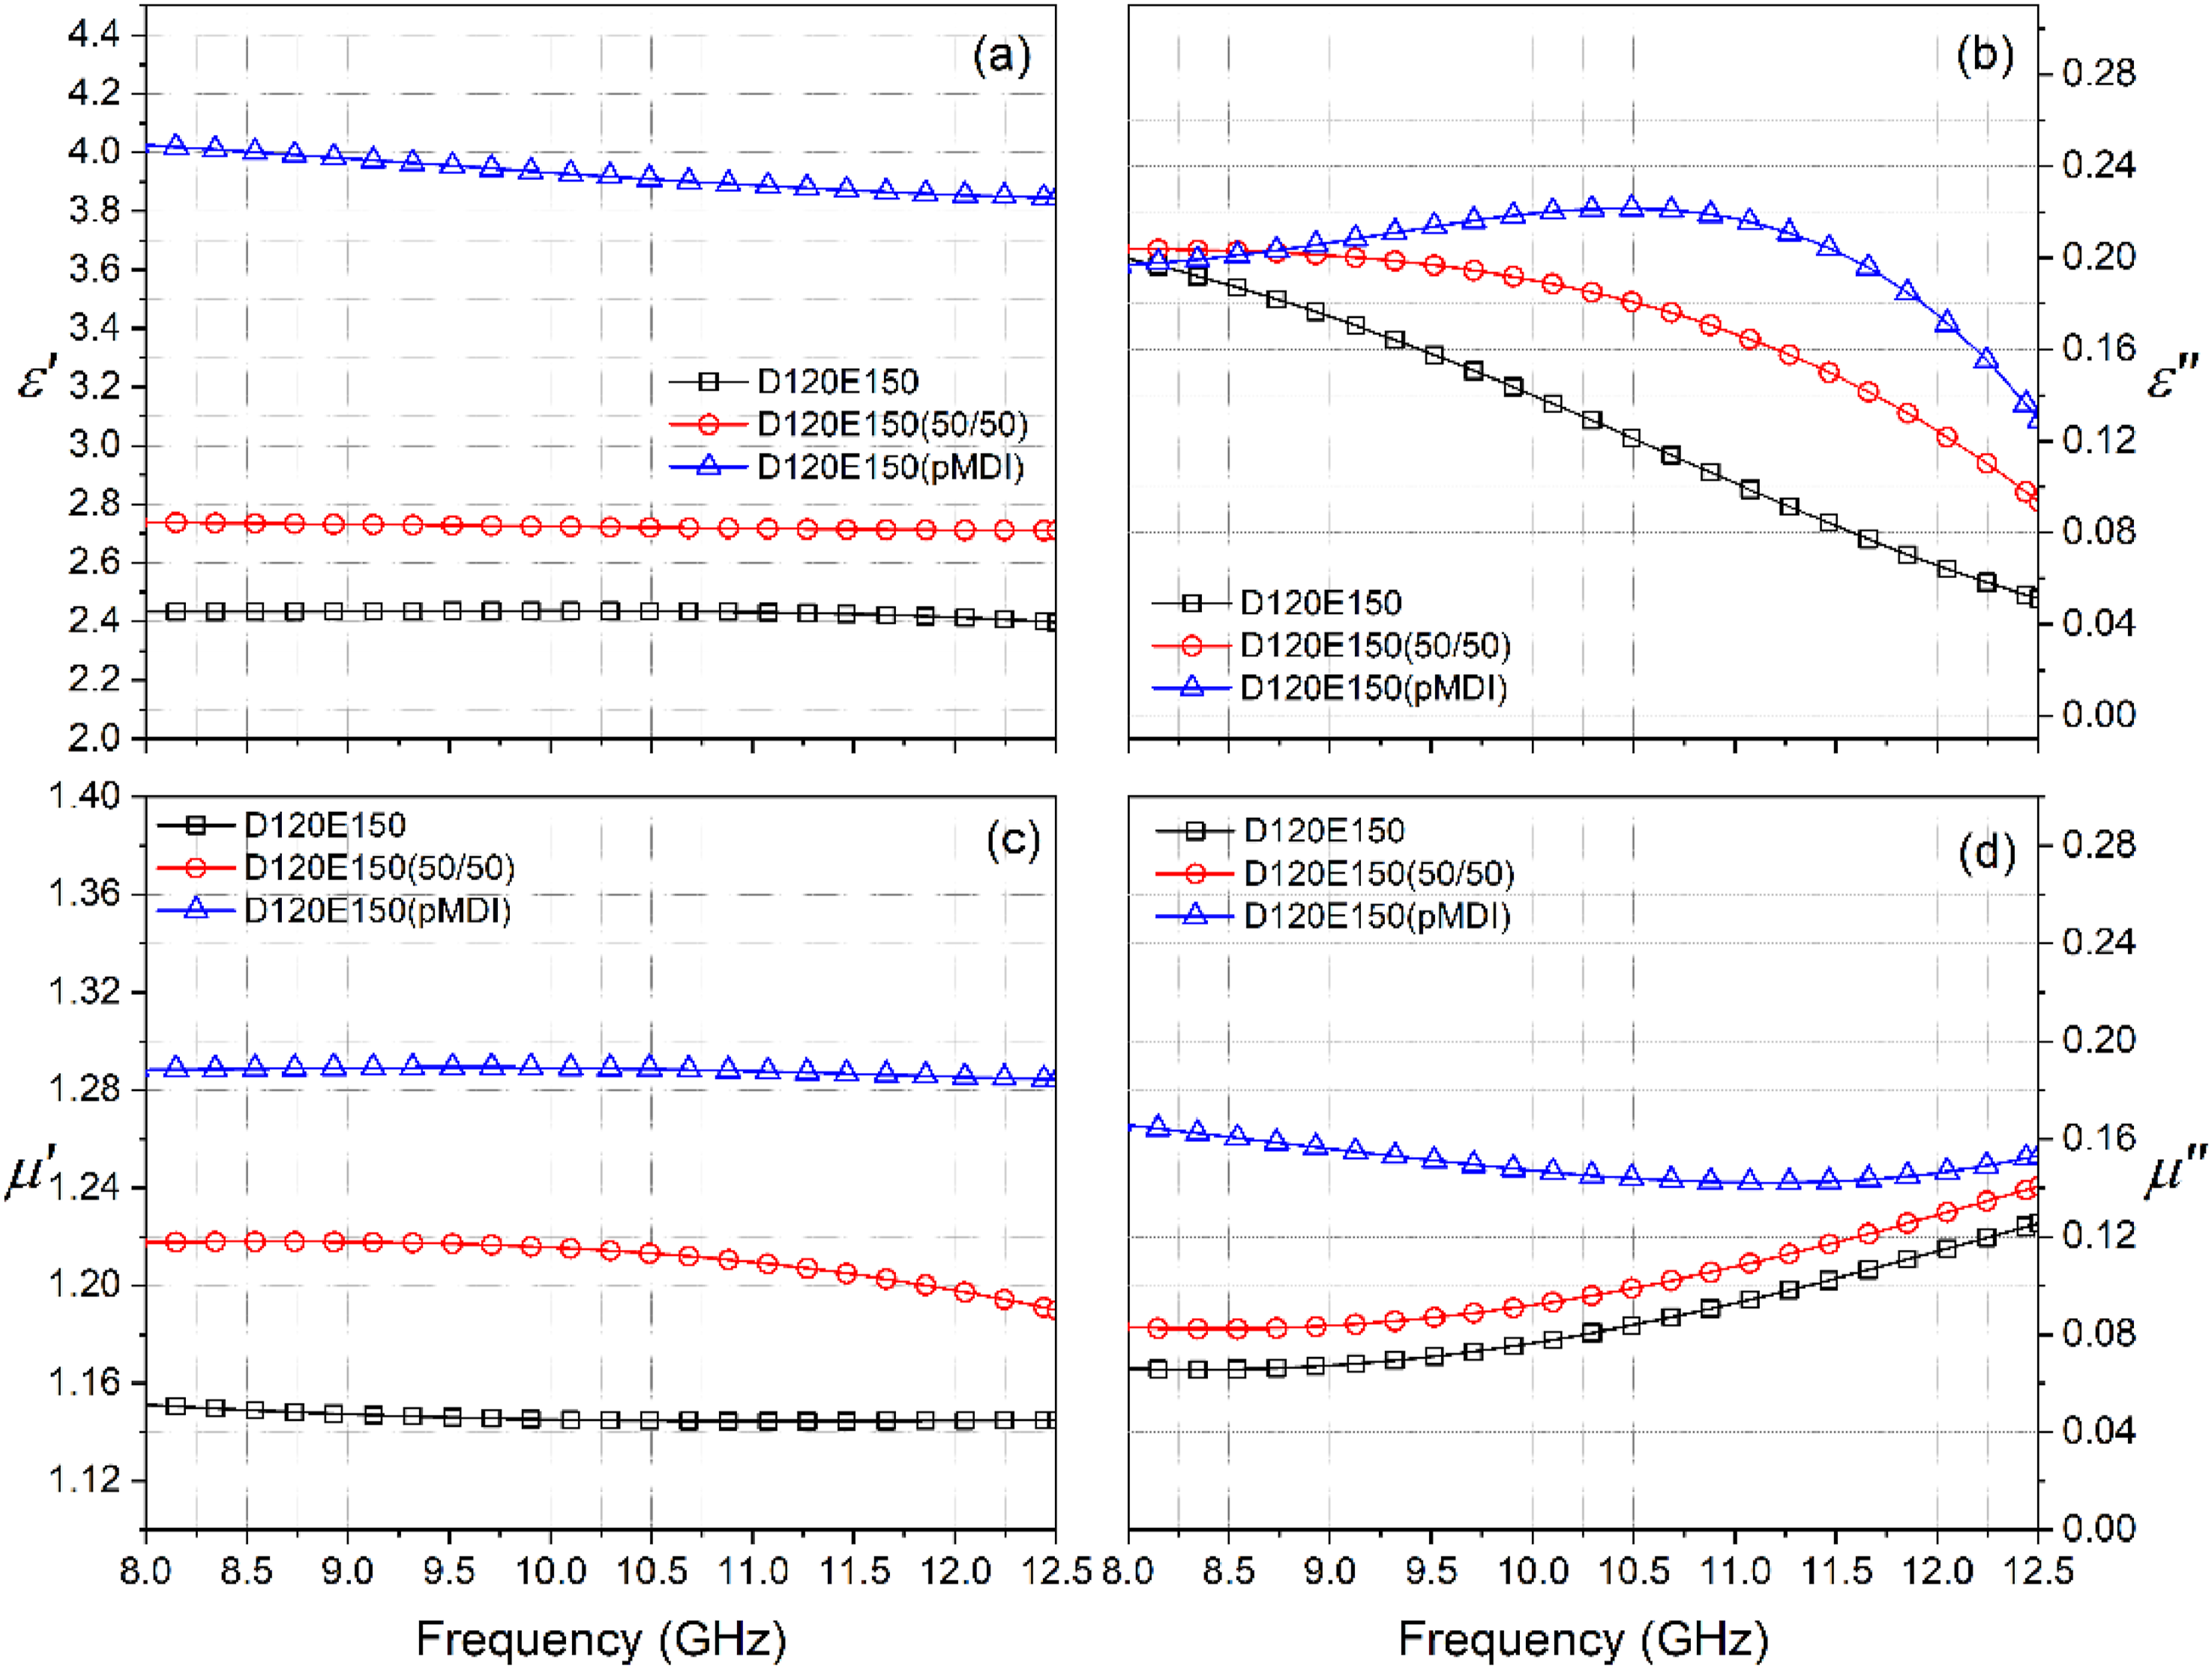
Microwave absorption characterizations
Following the contour map analysis, which visually demonstrated the absorption patterns of D120-E150 samples, a more focused evaluation was conducted to quantify the performance differences arising from filler localization strategies. Figure 11 presents the most effective absorption conditions observed for each method, while Table 3 provides a comparative summary of RL
min
values, their corresponding frequencies, and the minimum thicknesses required to achieve full X-band absorption. Despite having the same overall formulation (120 kg/m3 PUF with 150 phr nickel-coated carbon), these samples displayed distinct performance characteristics solely due to differences in filler placement. The polyol-dispersed sample showed the weakest absorption (RL
min
= −38.30 dB at 10.29 GHz, 4.6 cm). A notable improvement was seen in the 50/50 dispersion sample, achieving −41.80 dB at 10.94 GHz and requiring only 4.3 cm. The best performance was observed in the pMDI variant, delivering −42.04 dB at 11.14 GHz with a reduced thickness of 4.25 cm. Although the differences in absorption performance seem relatively small, they are primarily governed by the foam phase density and filler-induced impedance transition. These findings underscore that absorption behavior is governed not only by composition but also by the spatial arrangement of fillers. Both the pMDI and 50/50 samples maintained high absorption over the X-band at lower thicknesses, emphasizing the design potential of spatial filler control. Contour map (a)D120-E150, (b) D120-E150 (50/50) and (c) D120-E150 (pMDI) samples. RAM performance parameters of the samples prepared by different method. af: required frequency value to obtain RL
min
. bd: required thickness value (cm) to obtain RL
min
. cIn case of Abs. Bandwidth <1 GHz, it was reported as <1 GHz and it was not considered. dt: required thickness value of the samples (cm) to obtain EAB value.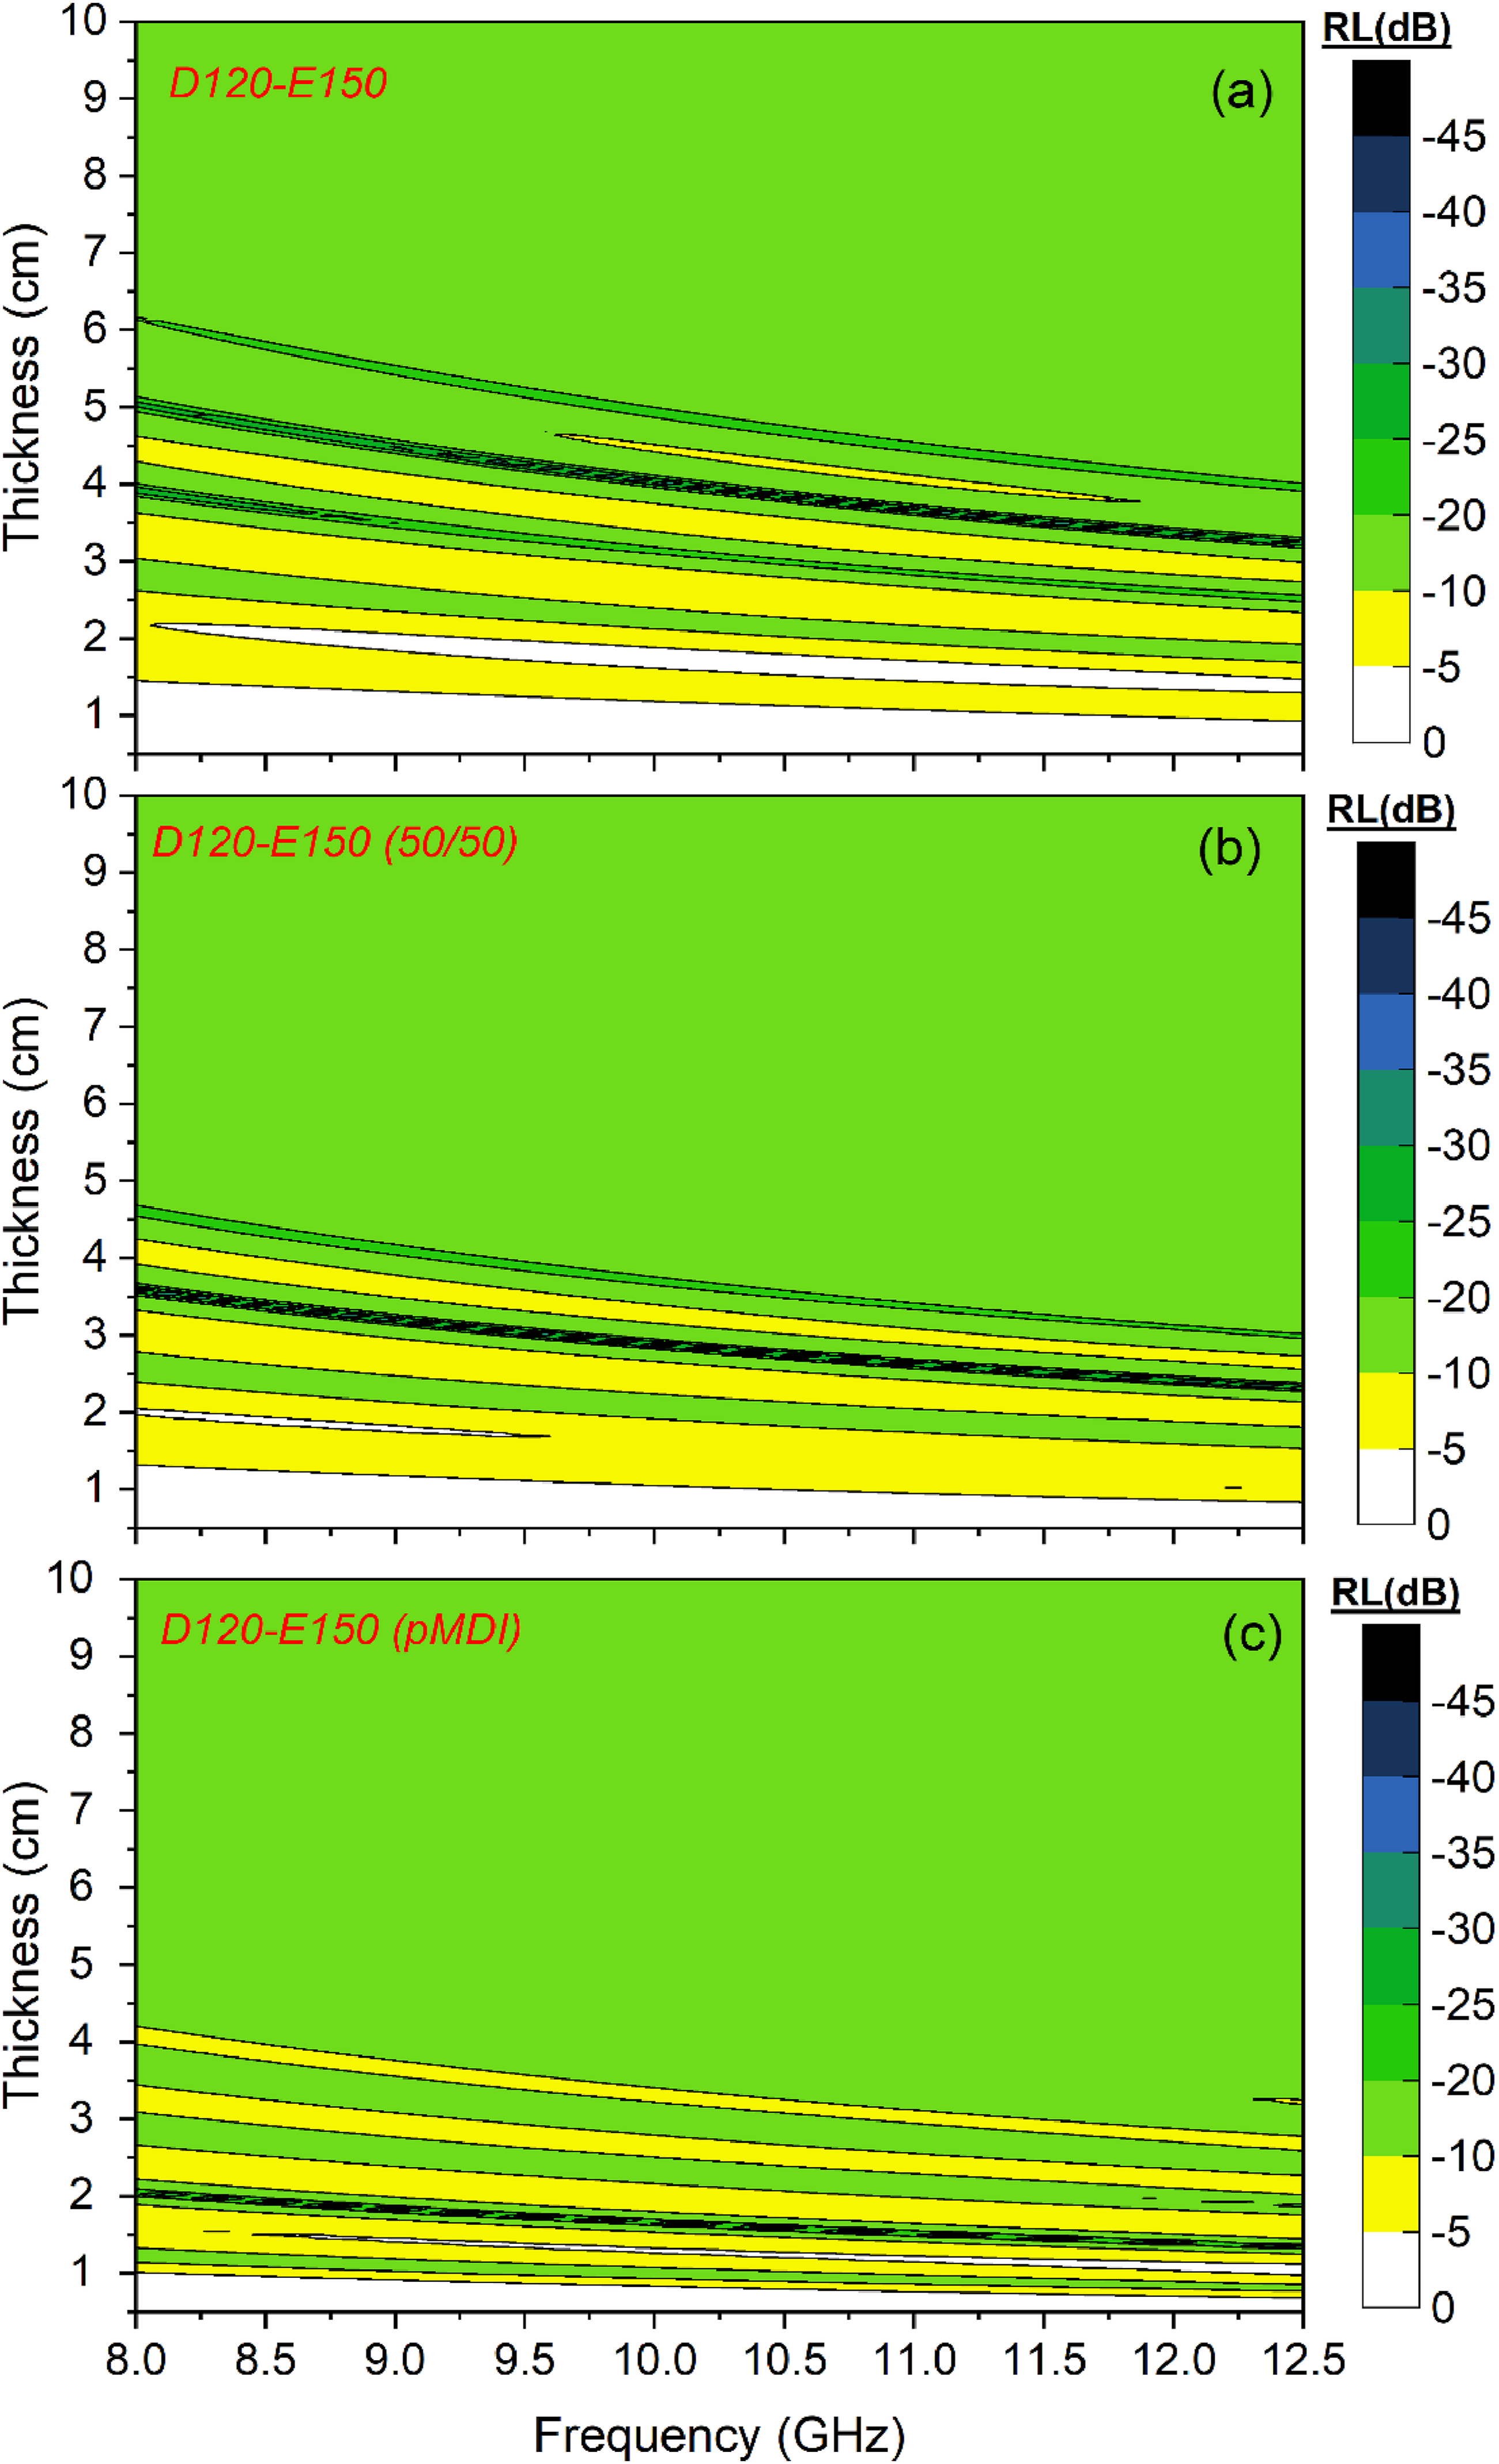

Conclusion
This study systematically examined the impact of foam density and filler localization on the dielectric and microwave absorption behavior of PUF composites containing nickel-coated carbon fillers. By systematically adjusting foam density (D30, D80, and D120 series) and filler concentration (up to 165 phr), it was found that increasing the density significantly enhanced the dielectric properties (ε′ and ε″), primarily due to the reduced air volume fraction and improved filler connectivity. This effect was most pronounced in high-density structures, where functional fillers could form more continuous and effective networks. Among the samples prepared via polyol-phase dispersion method, the D120-E150 formulation exhibited the best absorption performance, with an RL min of −38.30 dB and an effective absorption bandwidth of 4.5 GHz, fully covering the X-band at a sample thickness of 4.6 cm. Moreover, the role of filler localization was clearly demonstrated using a fixed filler content of 150 phr and three different incorporation strategies: (i) addition to the polyol phase (D120-E150), (ii) split addition to both phases (D120-E150 (50/50)), and (iii) addition solely to the isocyanate phase (D120-E150 (pMDI)). The D120-E150 (pMDI) sample achieved the lowest RLmin value of −42.04 dB and maintained full X-band absorption at a reduced thickness of 4.25 cm. However, it also exhibited the highest experimental density (0.734 g/cm3) among the dispersion strategies, due to limited foam expansion caused by filler accumulation within the cell interiors. SEM images confirmed that the compact structure originated from filler-induced constraints on cellular growth. In contrast, D120-E150 (50/50) achieved an RLmin of −41.80 dB and provided full X-band coverage (8–12.5 GHz) at a reduced thickness of 4.3 cm. Although slightly lower in peak performance compared to the pMDI-based variant, this sample exhibited a more uniform filler distribution, improved foam morphology, and better expansion stability. D120-E150, prepared via polyol-phase dispersion, showed the lowest performance within the group, requiring 4.6 cm thickness to achieve similar bandwidth with an RLmin of −38.30 dB. These findings suggest that the initial dispersion phase of the filler strongly influences not only the electromagnetic behavior but also the structural integrity of the foam. Overall, the results indicate that both foam density and filler dispersion strategy have a considerable impact on microwave absorption performance. The ability to influence dielectric behavior and absorption characteristics through morphological and processing variations highlights the potential of polyurethane foams as promising platforms for lightweight and broadband radar absorbing materials, particularly when filler localization is effectively managed.
Footnotes
Funding
The authors disclosed receipt of the following financial support for the research, authorship, and/or publication of this article: This study was supported by TÜBITAK, the Scientific and Technological Research Council of Turkey, with the grant number 219M255.
Declaration of conflicting interests
The authors declared no potential conflicts of interest with respect to the research, authorship, and/or publication of this article.