
Abstract
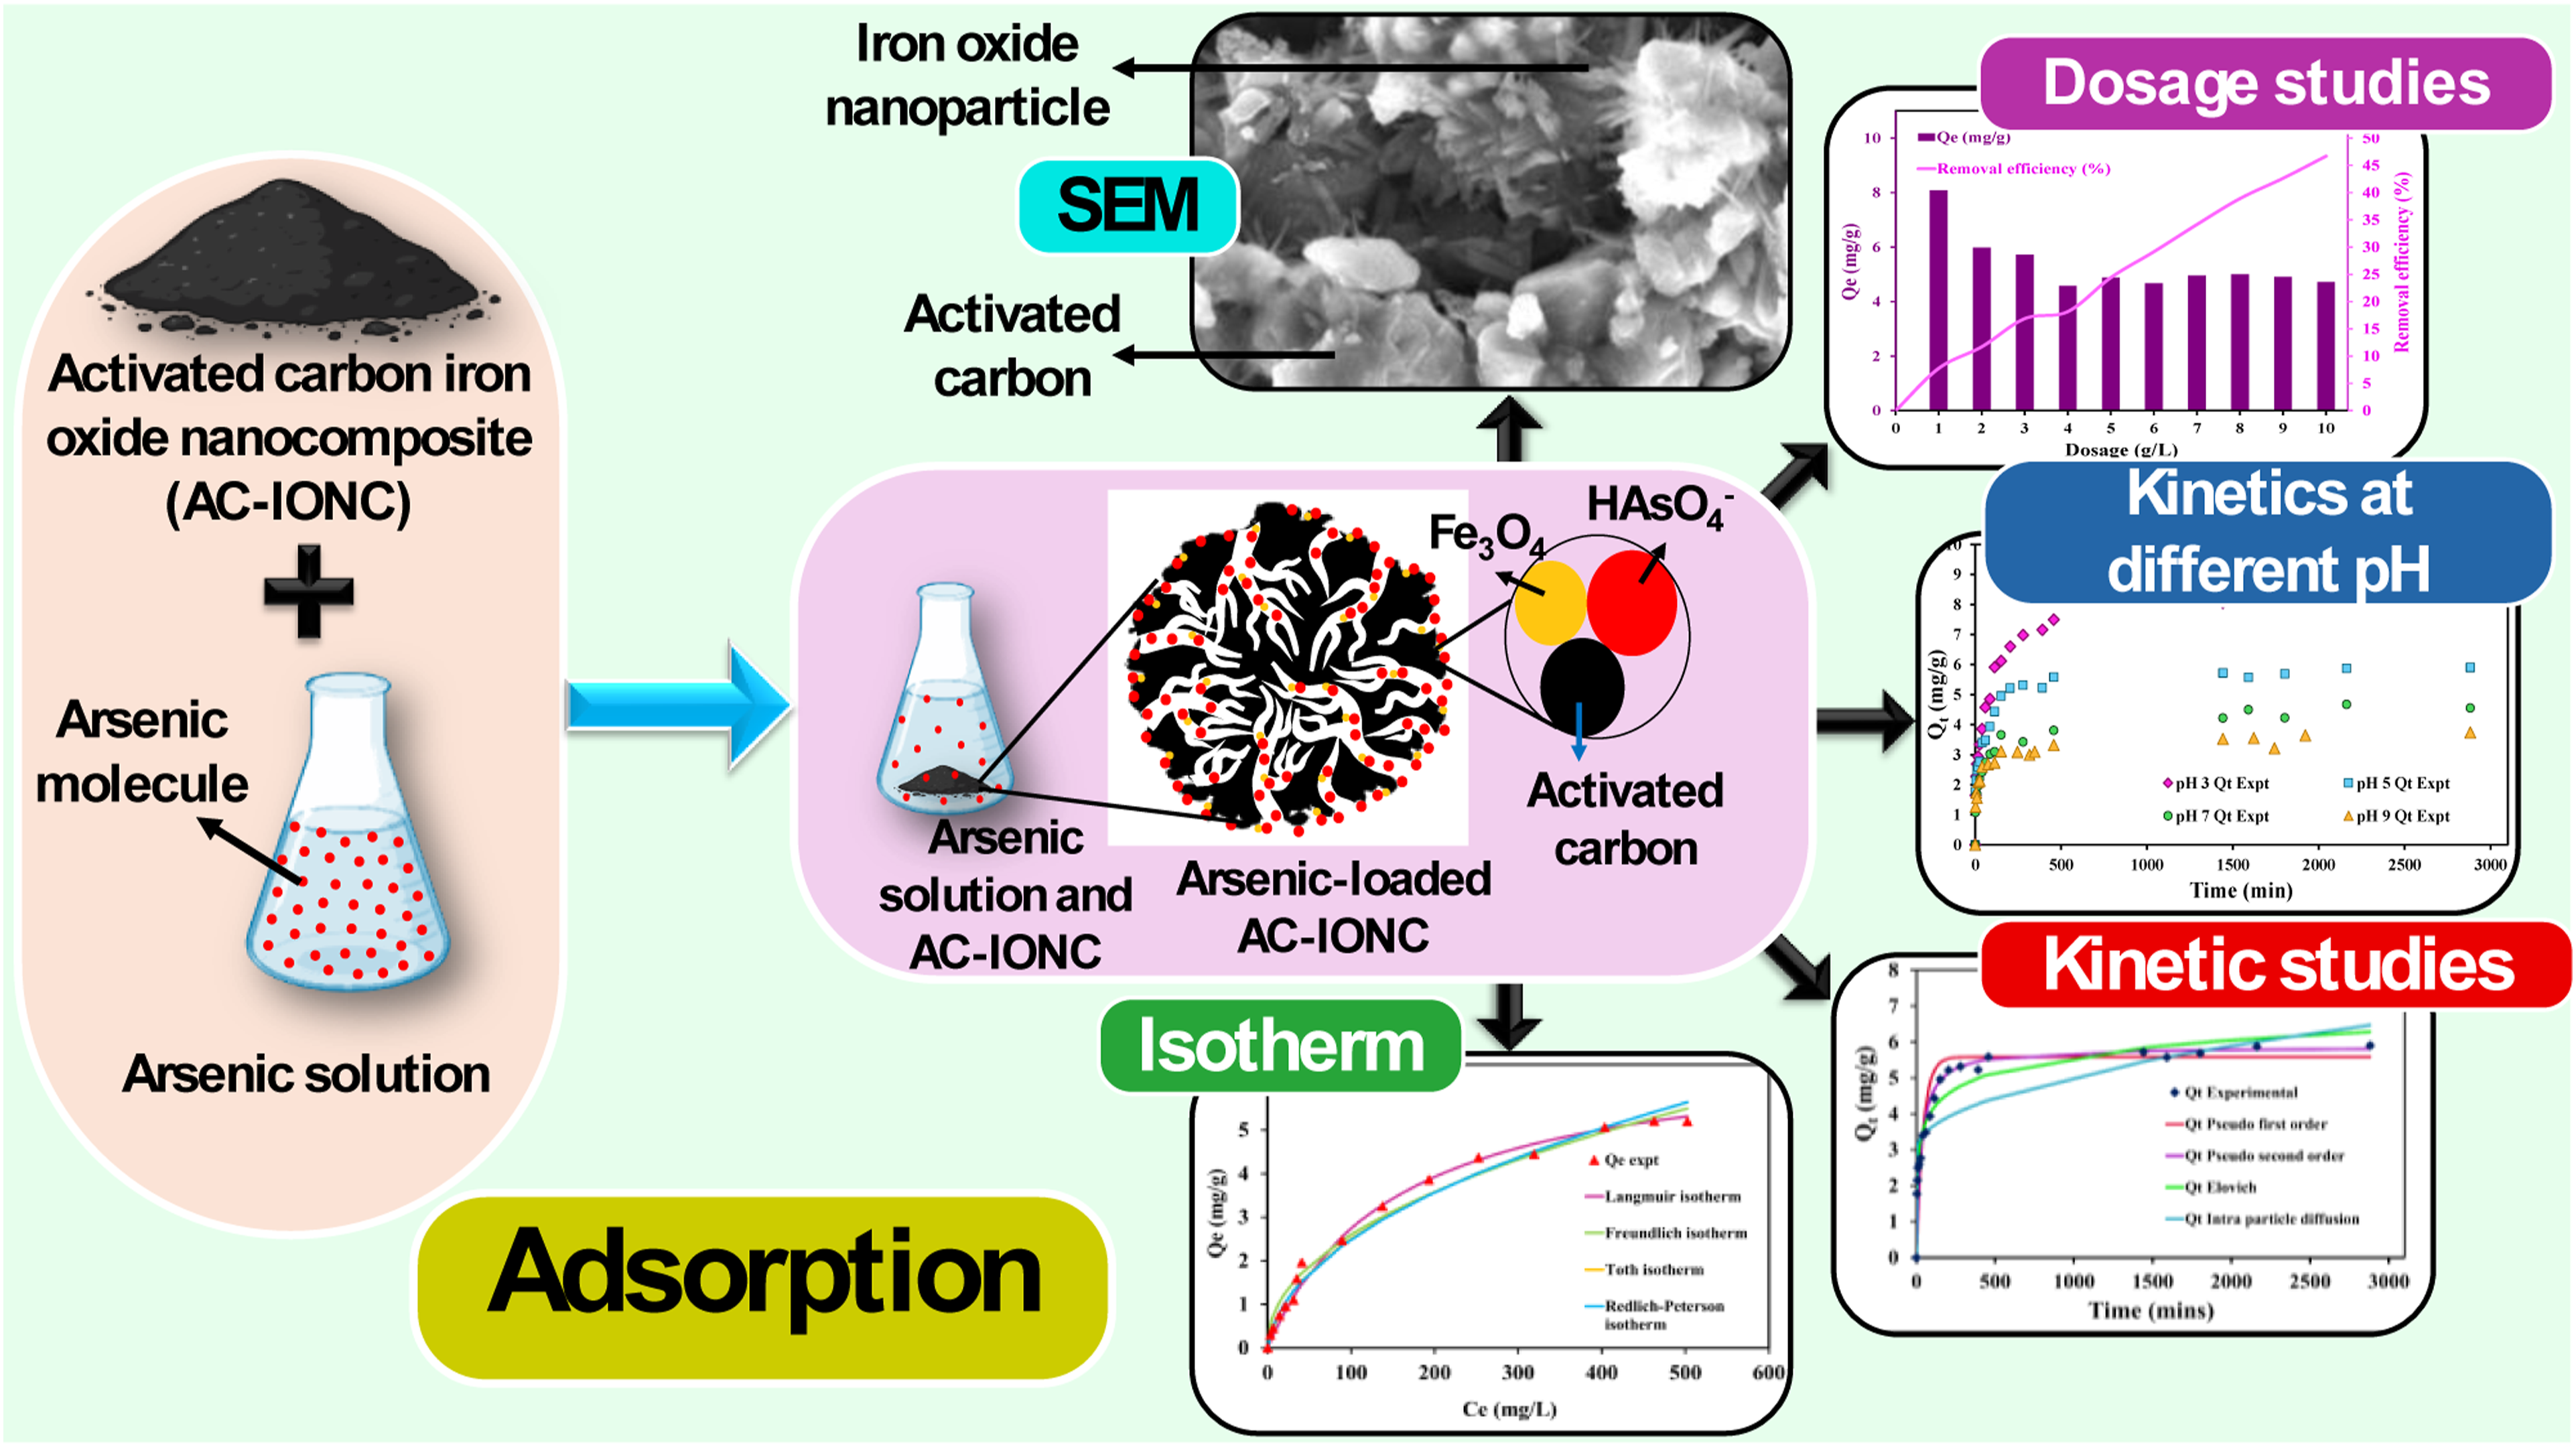
Arsenic is a widely occurring geogenic contaminant in groundwater in many places around the globe. The incorporation of high-adsorption iron oxides into activated carbon is an important area of research for arsenic removal. The present study describes an activated carbon-based iron-oxide nanocomposite (AC-IONC) synthesized via co-precipitation and evaluated for the removal of arsenic from aqueous systems. The characterization of AC-IONC using BET, SEM-EDS, FTIR, FESEM, and XRD confirmed the successful integration of iron oxide nanoparticles onto the porous activated carbon matrix, yielding a high surface area (947.97 m2/g), structural stability, and abundant functional groups, all of which are favorable for adsorption. Batch adsorption experiments were conducted to assess the influence of pH, adsorbent dosage, kinetics, and initial arsenic concentration. The kinetics of adsorption at various pH levels were investigated. The modeling studies using kinetic adsorption models revealed that the adsorption process followed a pseudo-second-order kinetics model (R2 = 0.98, NAPE = 2.6%). The adsorption equilibrium datasets were best fit by the Langmuir isotherm model (R2 = 0.99, NAPE = 2.81), suggesting monolayer adsorption on a homogeneous surface, with a maximum adsorption capacity of 8.08 mg/g. The combined adsorption kinetic and equilibrium (CAKE) model was used to predict the adsorption kinetics and equilibrium at various initial concentrations and times. The regeneration studies showed a modest decrease in adsorption capacity after repeated adsorption-desorption cycles, indicating the AC-IONC’s moderate regeneration efficiency. A spiked study conducted with real water samples showed a marked reduction in adsorption capacity, which suggested that adsorption was reduced in the presence of other co-existing ions. In summary, the AC-IONC demonstrated strong potential as an efficient method for arsenic remediation in water treatment applications.
Highlights
❖ Facile synthesis of AC-IONC via the co-precipitation method for As(V) removal. ❖ High surface area (947.97 m2/g) confirmed by BET and structural analyses. ❖ Adsorption followed pseudo-second-order kinetics and the Langmuir isotherm, which simulated using the CAKE model. ❖ Kinetic adsorption studies at different pH
1. Introduction
Groundwater is considered the most substantial source of accessible freshwater on Earth, making up about 97 percent of liquid freshwater, which highlights the need for domestic uses, irrigation, and industrial activities. 1 The increase in the dependency on groundwater results from the faster growth in population, urbanization, and expanded agricultural and industrial practices. Extensive generation of wastewater containing organic and inorganic contaminants due to the fast-paced industrialization has largely driven the groundwater degradation and emerged as a globally notable concern. 2 The contaminated groundwater consists mainly of industrial effluents, landfill leachate, heavy metals, metalloids, and excessive agrochemicals, which also raises concerns due to their non-biodegradable characteristics. The slow groundwater movement will increase the residence time of contaminants and let the pollutants stay in the subsurface for a longer duration, which results in degradation of groundwater quality. 3 As(V), which is a natural groundwater pollutant, has gained substantial global interest as a result of its widespread occurrence, toxicity, and multiple health impacts on living beings. 4
Multiple types of cancer and chronic diseases like arsenicosis can be caused due to prolonged higher exposure to As(V). 5 It is reported that over 50 million people globally are at risk of consuming drinking water that poses higher levels of As(V). The World Health Organization (WHO) has stated a safe concentration of 10 µg/L of As(V) in drinking water. 6 Severe groundwater As(V) pollution has been widely reported across Bangladesh, India, China, Hungary, Chile, Argentina, Mexico, and Vietnam. Both organic and inorganic arsenic species are present in natural water sources, in which organic arsenic generally is shown to have lower significance compared to inorganic arsenic, due to its detoxification by methylation processes in aquatic systems. Inorganic arsenic exists in four oxidation states: -3, 0, +3, and +5. The oxidation states -3 and 0 are relatively rare, whereas +3 (arsenite) and +5 (arsenate) are common based on the redox conditions and pH of the surrounding environment. Pentavalent arsenate As(V) predominates in oxidizing environments like surface waters and in oxoanionic forms H2AsO4- and HAsO42- with respective pKa values of 2.19 and 6.94, it exhibits abundance. 7 Though arsenic (III) is more mobile, As(III) oxidized to As(V) in the oxidizing environment of open water sources. 8 Certain minerals such as birnessite and MnO2 in natural water sediments can also oxidize As(III) to As(V) in natural environments. 9 As(V) is stable across a wide pH range in aqueous systems in oxidizing environments and does not reduce to As(III) in the absence of specific reducing agents or biogeochemical catalysts. 10 Therefore, pentavalent As(V) is recognized as a stable pollutant in groundwater, with significant health concerns affecting millions of people worldwide. 11
Various technologies, including coagulation, electrocoagulation, flocculation, ion exchange, electrodialysis, membrane filtration, reverse osmosis, precipitation, and adsorption, have been rigorously tested for As(V) removal from contaminated water. 12 Other treatment methods like reverse osmosis and ion exchange can achieve significant As(V) removal. But because of their significant limitations in application, such as high operational and capital costs, high energy consumption, membrane fouling, and the generation of secondary waste streams, they have received less attention. As a result, for the effective removal of As(V), adsorption-based treatment is widely employed, especially in developing regions where simpler design, high efficiency, and operational feasibility are critical. 13 Due to its reliable removal efficiency and minimal generation of secondary waste, adsorption is particularly suitable for treating waters contaminated at trace concentrations. 14 With a wide range of adsorbents employed for As(V) remediation, which includes conventional media like activated alumina, activated carbon, followed with emerging materials such as metal-organic frameworks, metal oxide nanoparticles, carbon nanotubes, clay-based composites, silica gel, zeolites, and graphene-derived systems, consequently, the adsorption technique remains one of the most extensively studied and widely applied methods for arsenic removal. 15 Iron-based nanoparticle materials have emerged as promising adsorbents due to their strong affinity for As(V) species. 6 However, the separation efficiency and reusability are affected due to its particle size, high amorphous content, and propensity for flocculation, and their practical deployment at larger scales remains challenging. The structural stability and adsorbent reusability of a variety of porous materials, such as clays, zeolites, activated carbon, polymeric substances, and biopolymers, have been investigated to improve iron oxide dispersion. 16
Activated carbon-iron oxide nanocomposites (AC-IONC) have emerged as a recent area of interest as advanced adsorbents that exhibit multiple beneficial effects. Activated carbon has a high porous structure, a high surface area ranging from 400 m2/g to 1700 m2/g, and multiple functional groups, 17 . It has a strong affinity toward arsenate species, and enhanced magnetic properties of composites are provided by iron oxide nanoparticles. 18 The nanoparticle dispersion reduces aggregation and enables rapid magnetic separation of the used adsorbent material from treated water. The presence of iron oxide active sites that facilitate surface complexation with As(V) in AC-IONC exhibits a significant As(V) removal efficiency. In contrast to metal-organic frameworks (MOFs), the AC-IONC demonstrates superior chemical stability and greater suitability for large-scale applications. 19 Additionally, AC-IONC overcomes the limitations of bare metal oxide nanoparticles, such as structural stability, difficulty in recovery and reduced reusability. Despite extensive research on iron oxide and carbon-based adsorbents for As(V) removal, the improvement of iron oxide-supported activated carbon composites remains underexplored. Specifically, the synergistic integration of iron’s enhanced chemical affinity toward As(V) with the large surface area and mechanical robustness of activated carbon has not been fully optimized. The effects of activated carbon sources on iron oxide dispersion, surface functionality, and adsorption behaviours have been less explored. Additionally, limited studies have reported a combined evaluation of surface physicochemical properties, pH-dependent adsorption behaviours, and coupled kinetic-isotherm analysis, particularly through multi-dimensional modeling. Moreover, available studies indicate a scarcity of scalable preparation methods for iron-based nanocomposites using low-cost support matrices, such as activated carbon.
Given the above-mentioned research gaps, the present study explored the synthesis of iron oxide-activated carbon composites via co-precipitation and their use for the adsorption of As(V). A key novelty of this study lies in the combined analysis of adsorption kinetics and equilibrium isotherms using three-dimensional modeling, thus providing a more detailed visualization of adsorption behavior beyond two-dimensional analysis. Lastly, by integrating kinetic-isotherm relationships, this research article provides deeper insights into As(V) adsorption efficiency and stability for multiple cycles of regeneration. This research supports sustainable development goals (SDGs), such as SDG 6 by improving access to safe water, SDG 7 by promoting sustainable, low-energy treatment materials, and SDGs 14 and 15 by protecting aquatic and terrestrial ecosystems from As(V) contamination and long-term ecological degradation.
2. Methodology
2.1. Chemicals and reagents
Ferric nitrate nonahydrate [Fe(NO3)3. 9H2O, molecular weight 404.0 g/mol], and Sodium arsenate heptahydrate (Na2HAsO4·7H2O, MW =312.01 g/mol) with 98% purity was purchased from Loba Chemicals. Nitric Acid (HNO3, MW = 63.01 g/mol, 99% purity), hydrochloric acid (HCl, MW = 36.46 g/mol, 99% purity), sodium hydroxide (NaOH, MW = 40.0 g/mol, 97% purity), and sodium bicarbonate (NaHCO3, MW = 84.01 g/mol, 99.5 % purity) were purchased from Loba Chemicals, India. Further, commercially available activated carbon powder (300-mesh particle size) was purchased from Finar Chemicals Pvt. Ltd.
2.2. Synthesis of activated carbon iron oxide nanocomposite
The commercial activated carbon obtained was thoroughly mixed with 63% HNO3 at a mass-to-volume ratio of 1:1 in a 250 mL beaker. The mixture was heated for 5 h at 80°C in a hot-air oven (KOS-3FDT) to render the adsorbent surface hydrophilic. Furthermore, 5 g of prepared activated carbon powder was immersed in a 50 mL solution of 75% ferric nitrate nonahydrate in a 250 mL beaker. The solution was subjected to ultrasonication for 2 h at 80 °C and heated in a hot-air oven at 100 °C until a dry powder was obtained. The dried powder was transferred to a silica crucible (100 mL) and heated for 2 h at 600 °C in a muffle furnace under a nitrogen atmosphere. Furthermore, the carbonised composite powder was washed using a sodium bicarbonate (5%) solution, followed by distilled water to remove ash content and impurities. The washed sample was placed in a hot-air oven for overnight drying at 80 °C to uniformly remove moisture. A schematic presentation of the synthesis procedure of the AC-IONC is presented in Figure 1. Schematic presentation of the synthesis procedure of the AC-IONC.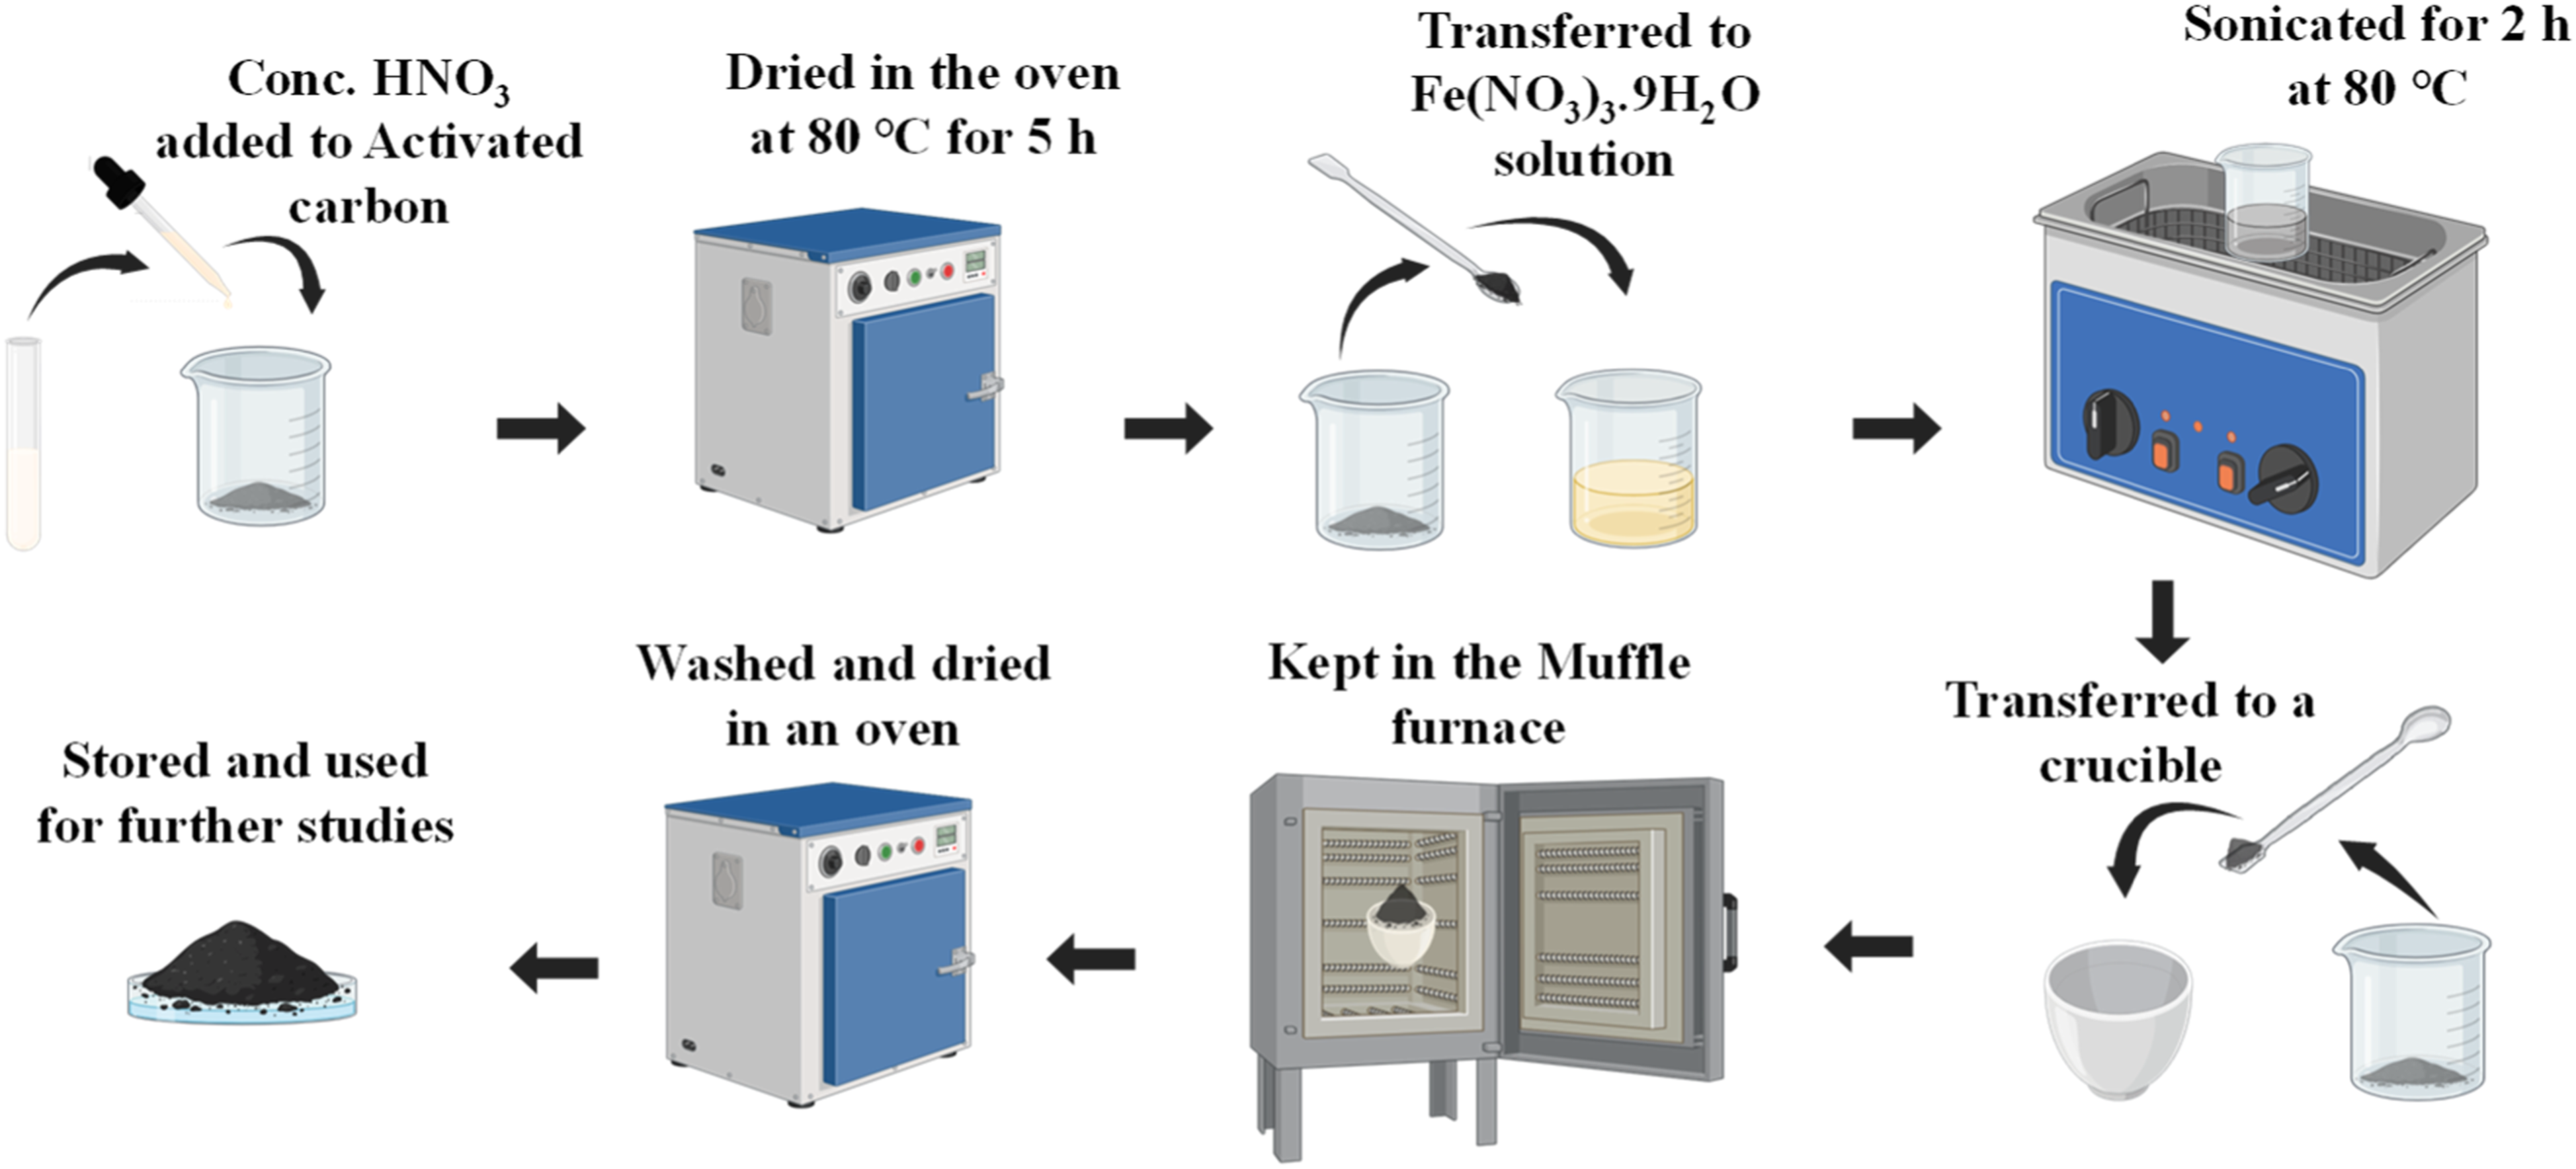
2.3. Characterization of activated carbon iron oxide nanocomposite (AC-IONC)
The surface area, pore volume, and pore diameter of the AC-IONC adsorbent are determined using the Brunauer-Emmett-Teller surface area analyzer (MICROTRAC– BELSORP MINI X) using nitrogen adsorption and desorption methods. The AC-IONC powder sample was degassed for 4 h at 200 °C and subjected to BET analysis. The surface morphology of AC-IONC was determined using Scanning Electron Microscopy (SEM) coupled with Energy Dispersive Spectroscopy (EDS) (EVO MA18 with an Oxford EDS). On the SEM tab, carbon tape was put, and a small amount of dry char was spread out on its surface. A 10 kV accelerating voltage was used to take the picture, and the carbon was used without being coated. Energy Dispersive Spectroscopy (EDS) was used to determine the percentage composition of the elements (C, O, and Fe) present in the AC-IONC. Furthermore, the functional group of AC-IONC was determined using Fourier transform infrared spectroscopy (Shimadzu IRSpirit Fourier transform infrared spectrophotometer serial no. A224057). The dried AC-IONC sample was placed on the surface of an Attenuated Total Reflectance (ATR) unit, and scanning was performed from 400 to 4000 cm-1 with 40 scans at a step size of 4 cm-1. The crystalline phase of the AC-IONC was determined using X-ray diffraction (XRD) (Rigaku Miniflex 600 [5th gen]). The experiment was conducted in a sealed vacuum glass tube at 40 V and 15 mA. The AC-IONC was placed in a sealed vacuum glass tube and kept under an X-ray diffractometer. The intensity of the AC-IONC was measured over a 2θ range of 10-800. The peak intensity and position were compared with standard JCPDS files and literature-reported data to recognize such phases.
2.4. Adsorption studies
The adsorption experiments were conducted on the AC-IONC to remove As(V) after synthesis and characterization. The adsorption studies include the effects of pH, dose, kinetics, isotherms, desorption, and spiked study.
2.4.1. pH studies
The pH study is a crucial aspect of adsorption-based wastewater treatment, as pH strongly influences pollutant solubility, surface reactivity, and the overall adsorption performance. A pH study was conducted over the range of 3 to 11, while keeping other parameters constant. To determine the effect of pH on adsorption, 1 g of AC-IONC was mixed with 100 mL of As(V) solution (prepared with distilled water) and agitated at 150 RPM for 24 h at 25 oC. To achieve acidic and basic conditions, the pH of the solution was controlled using 0.1 M HCl and 0.1 M NaOH, respectively.
2.4.2. Dosage studies
The determination of the optimal absorbent dose is essential for effective pollutant removal, as adsorption is strongly influenced by the dosage used during the experiment. At lower adsorbent doses, the adsorption capacity was higher, and the removal efficiency was lower. Increasing the adsorbent dose results in a linear increase in removal efficiency, but a decrease in adsorption capacity. During the experiment, doses ranged from 1 to 10 g/L, and other parameters were kept constant to evaluate their effects on adsorption capacity and As(V) removal percentage. The parameters like pH, temperature, and contact time were maintained at 5, 25 °C, and 24 h, respectively, with an agitation speed of 150 RPM throughout the dosage experiment.
2.4.3. Adsorption kinetics and isotherm study


Estimation of the kinetic parameters using the various models.
Estimation of isothermal parameters using various isotherm models.

2.5. Desorption and regeneration
A desorption study was conducted to evaluate the regeneration potential and reusability of the AC-IONC adsorbent. AC-IONC was first subjected to adsorption by adding it to 100 mL of As(V) solution in a 250 mL conical flask at a fixed dosage of 5 g/L. The solution pH was adjusted to 5, and the mixture was agitated in an orbital incubator shaker at 150 RPM for 24 h at 25 oC to ensure adsorption equilibrium. After the adsorption step, the As(V)-loaded AC-IONC was separated from the aqueous phase by vacuum filtration. To evaluate the effectiveness of As(V) desorption and the composite’s regeneration capability, the used adsorbent was treated with various acidic and basic desorbing agents (such as HCl and HNO3), and desorption was performed under controlled conditions to release the adsorbed As(V) from the adsorbent surface. By determining the desorption efficiency after each regeneration step, the stability and reusability of AC-IONC were assessed over successive adsorption-desorption cycles. The nanocomposite’s potential for regeneration was analyzed by the systematic evaluation of the composite’s efficiency in As(V) removal applications. The desorption efficiency was calculated using Equation 3 below, where Co and Ce are the initial and final equilibrium concentrations of As(V) in the solution, respectively.
2.6. Arsenic removal in the presence of other co-existing ions (spiked study)
The spiked study was conducted by taking water from the Udupi Sea, Manipal Lake, Tap water, well water, Swarna River water, and distilled water for adsorption experiments. The experiment was conducted using 50 mg/L of 100 mL of sea water, lake water, tap water, and distilled water in a 250 mL conical flask. Sea water was taken at Udupi beach in the Malpe region. Lake water was collected from the Manipal lake. Tap water was taken from the Manipal tap water supply. Well water was obtained from a local well in the Neelavara region. River water was taken from the Swarna River near Manipal. To each flask, a 5 g/L dose of AC-IONC was added, and the flasks were shaken in a REMI CIS-24 Plus incubator shaker. The flasks were shaken at 150 RPM at 25 °C for 24 h. After adsorption, the samples were filtered and analyzed in AAS to check the adsorption capacity of each water source.
2.7. Atomic absorption spectroscopy (AAS) analysis
As(V) analysis was conducted using an atomic absorption flame spectrophotometer (ICE 3000 series, Thermo Fisher Scientific Instruments, Mumbai). Atomic absorption spectroscopy (AAS) measures As(V) by detecting light absorption from free As(V) atoms in the gaseous state. The liquid samples can be analyzed by AAS within a limited concentration range. AAS relies on the Beer-Lambert law: free atoms absorb light at specific wavelengths from a matching light source, with the absorbance proportional to the atom concentration. As(V) atoms absorb strongly at 193.7 nm using an As(V) hollow-cathode lamp as the source.
3. Results and discussion
3.1. FTIR analysis of AC-IONC and regenerated AC-IONC
FTIR was used to identify the surface functional groups and clarify the intricate bonding interactions between the iron oxide nanoparticles and the activated carbon matrix. The AC-IONC composite exhibits several unique absorption bands indicative of rich, reactive surface chemistry (Figure 2(a)). The N-H stretching vibration of the composite is observed at 3719.07 cm-1, indicating the presence of the N-H bond in AC-IONC.
20
The broad peak at 3536.54 cm-1 corresponds to the O-H stretching vibrations, which are characteristic of activated carbon and iron oxide composite surfaces. This peak confirmed the presence of hydroxyl groups on AC-IONC.
21
The peak at 2696.61 cm-1 is the C-H stretching vibrations of aliphatic groups. Peaks at 2112.36 and 1819.60 cm-1 could belong to C≡C or C=C stretching vibrations, characteristic of alkynes and aromatics, respectively.
22
The peak at 1721.21 cm-1 is characteristic of the C=O stretching of carbonyl or carboxylic acid groups. This indicates the presence of a carboxylic acid or aldehyde group on the composite adsorbent.23,24 The peaks at 1521.56 and 1213.54 cm-1 are attributed to C=C and C-O stretching modes, which occur in aromatic rings and other oxygen-containing functional groups.
25
The intense peak at 951.15 cm-1 could be indicative of C-OH bending vibrations, as observed for phenolic or etheric functional groups.
26
The peak at 771.47 cm-1 corresponds to NO3- bending vibrations/C-H bending vibrations of aromatic ring.
27
Peaks at 660.24 and 541.88 cm-1 are generally assigned to Fe-O stretching modes, which substantiates the occurrence of iron oxide nanoparticles on the carbon surface. These peaks indicated that AC-IONC contains hydroxyl, aliphatic, aromatic, carboxylic, ether, and iron oxide functional groups, as typically observed in the literature for such nanocomposites. (a) FTIR analysis of the AC-IONC before and after adsorption, (b) FTIR analysis of the regenerated AC-IONC.
The FTIR spectrum undergoes a series of diagnostic transformations, indicating the direct involvement of specific surface sites in the sequestration process following As(V) adsorption (Figure 2(a)). The N-H stretching peak intensity at 3719.07 cm-1 has changed after adsorption. 22 The total disappearance of the hydroxyl peak at 3536.54 cm-1 suggests a vigorous chemical reaction between surface -OH groups and the As(V) species. The peak at 2112.36 cm-1 shifts to 2067.73 cm-1 after As(V) adsorption. The C=O stretching vibration peak intensity at 1721.21 cm-1 has been changed. The aromatic C=C peak at 1521.56 cm-1 has been shifted to 1560.07 cm-1. The C-OH vibration peak at 951.15 cm-1 has been shifted to 1012.47 cm-1. The aromatic C-H peak intensity at 771.47 cm-1 has been changed due to the As(V) adsorption on AC-IONC. The peak at 660.24 cm-1 shifted to 687.34 cm-1, and the peak at 541.88 cm-1 shifted to 531.90 cm-1, which is attributed to the absorption of As(V) on an AC-IONC. 28 The heterogeneous complexation behavior of As(V) on the AC-IONC surface is exhibited by the spectral variations, along with intensity changes in the N–H, C=O, and aromatic C-H bonds. 29 The Fe–OH groups within the composite are replaced by As–O species from the aqueous solution, which is largely driven by a ligand-exchange mechanism. 30 Finally, the chemical nature of AC-IONC, which provides a highly reactive environment that favors the effective removal of As(V), is reflected in the systematic shifts and intensity changes in these characteristic spectral bands. These state that the synergy between carbon support and metallic oxides facilitates efficient As(V) removal.
The FTIR analysis of regenerated AC-IONC adsorbent was conducted to identify the structural and functional changes that occurred on the surface of the composite after multiple adsorption and desorption cycles (three cycles). The FTIR spectrum of the regenerated adsorbent is presented in Figure 2(b). The major peaks were present, as seen in the previous adsorption spectrum in Figure 2(a), but their intensities and wavenumbers changed after regeneration. The N-H stretching vibration transmission intensity has been shifted to 3719 cm-1 to 3710.5 cm-1. The O-H stretching peak intensity has changed, shifting from 3536.5 cm-1 to 3606 cm-1. The peak at 1721.2 cm-1, corresponding to the C=O stretching of the carboxylic acid group, has shifted to 1712.65 cm-1. A sharp peak of the C-OH bending vibration was observed and shifted to 955.4 cm-1 from 951.1 cm-1. The peak at 771.47 cm-1, due to the NO3- bending vibrations/C-H bending vibration of the aromatic ring, has vanished in the regenerated adsorbent spectrum. The Fe-O stretching vibrations were shifted to 544.74 cm-1 and 633.15 cm-1 from 541.8 cm-1 and 660.2 cm-1.
Additionally, the new peak at 2815 cm-1 is due to aliphatic C-H stretching, 29 and the peak at 3011.76 cm-1 is likely due to water content present on the pores/surface sites of the AC-IONC after the adsorption and desorption cycle. Another possibility is that the AC-IONC surface has oxidized during the regeneration and drying after the adsorption/desorption cycle. This is because after completing the adsorption-desorption cycle, the adsorbent is washed several times to neutralize the surface. Furthermore, the composite was dried at 105 °C in a hot air oven each time. At this time, the heating in the presence of oxygen in the oven might cause unwanted oxidation on the surface of the regenerated AC-IONC.
3.2. XRD analysis of AC, AC-IONC, and regenerated AC-IONC
XRD patterns of AC and AC-IONC are shown in Figure 3(a), providing clear evidence of the phase purity and crystalline structure of the AC and the synthesised nanocomposite. Powder XRD analysis was performed using an Empyrean 3rd Gen, Malvern PANalytical X-ray diffractometer equipped with a Cu Kα radiation source to identify the various constituent crystalline phases. (a) XRD images of AC and AC-IONC and (b) XRD image of regenerated AC-IONC.
In Figure 3(a), the prominent diffraction peaks at 23.44 and 43.64 correspond to the (002) and (100) lattice planes, confirming the AC adsorbent. The broad diffraction peak at 23.44° indicates a low degree of crystallinity or an amorphous nature of the AC. A small, wide peak at 2θ of 43.64° corresponds to the in-plane carbon atom structure. AC is considered an amorphous solid with a disordered structure according to the broadness of the peak. 12 The absence of well-defined, sharp peaks in the XRD pattern of AC indicates the absence of crystalline phases or other impurities. 31
In Figure 3(a), the diffraction pattern clearly shows distinct peaks at 2θ values of 23.82° and 40.58°, characteristic of the activated carbon matrix. The sharpness and comparable intensities of these peaks indicate a well-ordered, crystalline nature within the activated carbon present in the composite adsorbent, which contributes significantly to the structural stability of the AC-IONC cluster. 32 Furthermore, the clearly significant diffraction peaks at 32.86°, 49.19°, and 63.77° correspond to the crystalline planes of the iron oxide nanoparticle. The dominant intensity of the reflection at 32.86° relative to the higher-angle peaks supports the presence of a highly crystalline, thermally stable ferric oxide (hematite) phase anchored to the carbon support. 33 The diffraction peaks, with 2θ values of 30.00°, 35.33°, 43.18°, 53.79°, 57.10°, and 62.72°, correspond to the hkl values (220), (311), (400), (422), (511), and (440), respectively. The distinct diffraction peaks correspond to the crystallographic phases of iron oxide within the magnetite-activated carbon composite, signifying the successful synthesis of AC-IONC. These diffraction peaks that confirm crystallinity are very important because adsorption often depends on the surface structural properties of the nanocomposite, like a large surface area, more active surface sites, and great magnetic properties. All these things have to do with the composite’s crystal structure. 34 These peaks align well with the JCPDS standard for 24-0072, confirming the formation of a magnetite-activated carbon composite. 35 Here, the peak at 2θ = 30.00° has less intensity than the other peaks. 22 The next peak, at 35.33°, has a much higher intensity than all other peaks present on the XRD data. 27 The remaining peaks (43.18°, 53.79°, 57.10°, and 62.72°) have lower intensity than the 35.33° peak. 36 These diffraction patterns are sharp and intense, indicating a strong crystalline structure. This is important for giving the material the mechanical strength it needs to work. 37 Additionally, a comparison of AC and AC-IONC in Figure 3(a) reveals the differences in the XRD patterns. The AC peaks in the AC-IONC composite cluster exhibit reduced intensity compared to raw AC, with increased sharpness at 2θ values of 23.44° and 43.44°. This shift indicates enhanced crystallinity in AC upon composite formation with IONP, attributable to the incorporation of crystalline IONP phases that modified the AC lattice structure. Hariani et al. (2018) synthesized activated carbon/Fe3O4. BET, XRD, FTIR, and SEM with EDX were used to characterize the materials. To assess the composite’s adsorption behavior, kinetic and isothermal investigations were carried out. The obtained removal efficiency of 94% was validated by the results. Also, similar peaks were found in the XRD results of AC and AC-IONC, which are comparable with the present study. 38
The XRD analysis of regenerated adsorbent (AC-IONC) was performed to ensure the presence of major iron oxide peaks and is presented in Figure 3(b). The peaks obtained after regeneration were perfectly aligned with the diffraction peaks of AC-IONC before adsorption, but with reduced peak intensity. This confirms the reusability and efficiency of the AC-IONC adsorbent over multiple regeneration cycles.
The Scherrer equation was used to calculate the structural dimensions and the average crystallite size. The Scherrer equation relates the full width at half maximum (FWHM) of the diffraction peaks to the mean crystalline diameter, and it is presented in Eq. (4).39,40 Using the Scherrer equation, the average crystallite diameter for the AC-IONC was calculated to be 24.70 nm.
37
This nanoscale dimension, combined with the interplay between the composite’s magnetite crystalline phase and its carbonaceous matrix, underscores the successful synthesis of a stable, high-surface-area composite. This structural configuration is highly favourable for environmental remediation, where a balance between crystalline and reactivity is essential for efficient adsorption. Smaller crystallite sizes, such as 24.70 nm, promote greater dispersion and reduce aggregation, thereby exposing more nanocomposite edges that favour As(V) chemisorption via electrostatic attraction or surface complexation. As demonstrated in earlier literature, this size range frequently correlates with better adsorption capabilities than larger crystallites (>30 nm).
41

3.3. BET surface area analysis of AC, AC-IONC, and regenerated AC-IONC
The surface area, pore volume, and pore diameter of AC-IONC were evaluated using a MICROTRAC-BELSORP MINI X BET analyzer. The textural properties of the adsorbent play a crucial role in determining its pollutant removal efficiency. The surface area reflects the availability of active adsorption sites, while the pore volume indicates the extent and accessibility of pores on the AC-IONC surface. 42
The surface area of the raw commercial powder-activated carbon was examined using a BET apparatus, showing a high surface area of 1414.63 m2/g, pore volume of 0.7364 cc/gm and average pore diameter of 2.08 nm. The high surface area, pore volume, and pore diameter emphasize the AC’s greater surface properties. Compared to the surface area of raw AC, the surface area of AC-IONC is reduced. This decrease in surface area upon composite formation can be attributed to the incorporation of iron oxide particles onto the activated carbon matrix. The iron oxide likely occupies and blocks some of the pores on the activated carbon surface, reducing the overall accessible surface area. Additionally, the deposition of iron oxide may partially block or fill pores, limiting the available surface area for adsorption or reactions. The comparative surface area value graph is presented in Figure 4 below. Surface area comparison of AC, AC-IONC, and regenerated AC-IONC.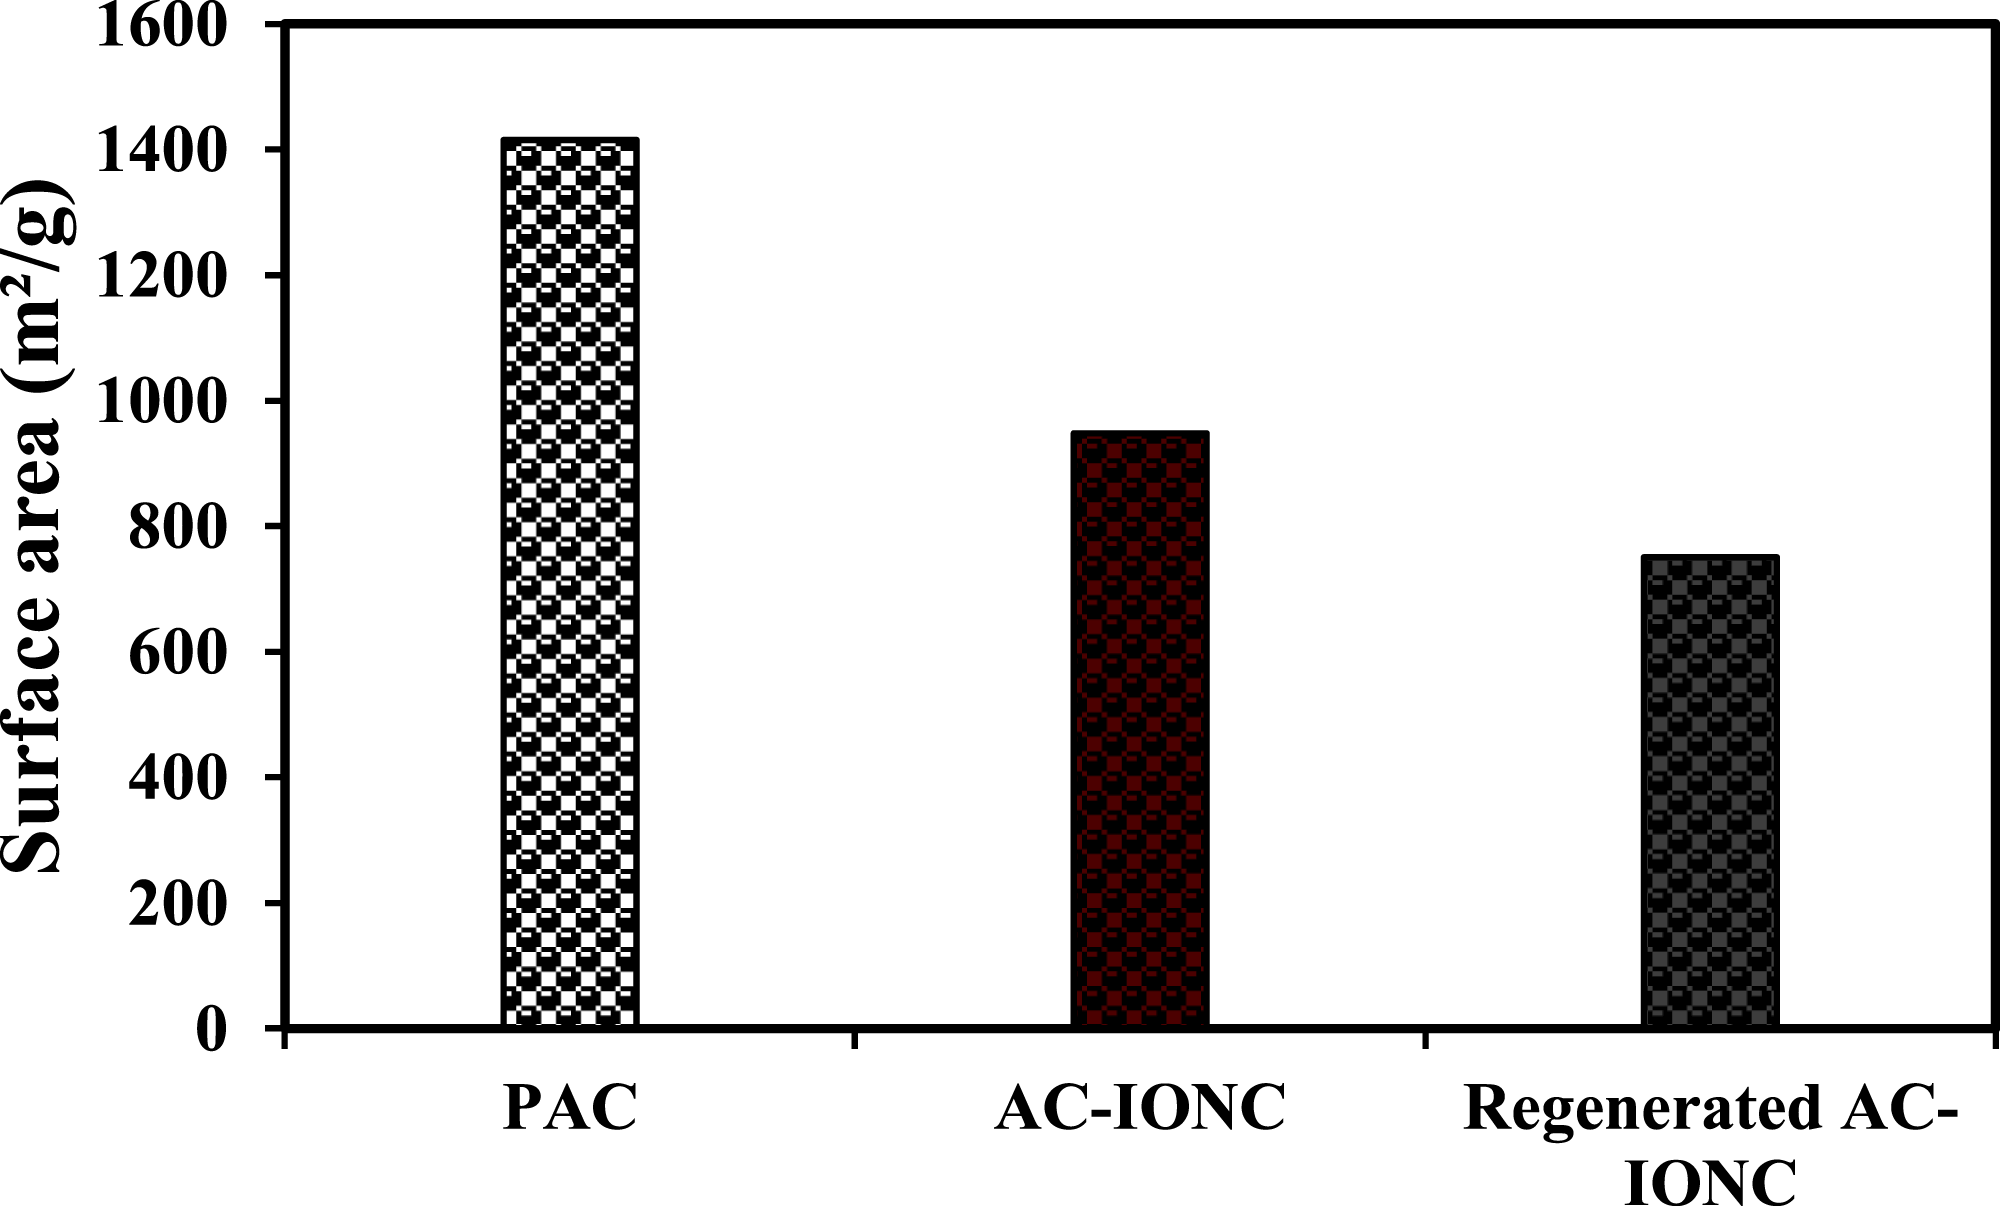
The AC-IONC (treated at 200 oC) exhibited a slightly lower BET surface area and total pore volume, 947.97 m2/g and 0.3825 cc/g, respectively, indicating a well-developed porous structure. 43 The average pore diameter was found to be 1.614 nm, confirming that the material predominantly falls within the microporous range. The microporous structure is advantageous for the effective capture of small-molecule adsorbates, including As(V) species, due to the high density of accessible active sites. 44
The surface area of the regenerated composite was analyzed using a MICROTRAC-BELSORP MINI X BET surface area analyzer. The regenerated composite exhibited a good surface area of 751.05 m2/g (Figure 4). This is clear evidence that the composite’s surface area, active surface sites, and surface properties were reduced and altered after it was regenerated three times. This is confirmed by the approximate 20% reduction in surface area after the first desorption cycle. The high surface area after three regeneration cycles demonstrates the AC-IONC adsorbent’s reusability across multiple adsorption cycles. Similar textural characteristics and adsorption behavior have been reported in earlier studies, further supporting the suitability of AC-IONC for adsorption-based water treatment applications.27,43,45
3.4. High-resolution imaging (SEM and FE-SEM) of AC, IONP, and AC-IONC
The surface morphological and structural evolution of AC-IONC was examined using scanning electron microscopy (SEM). Figure 5(a)–(c) presents SEM micrographs of activated carbon (AC), iron oxide nanoparticles (IONP), and the AC-IONC composite, allowing a clear comparison of their distinct surface morphologies. Figure 5(a) confirmed a rough and irregular surface with the presence of macropores and micropores at a scale of 2 µm and a magnification of 8000X. This inherent surface roughness and porous structure are favorable for the initial adsorption and physical entrapment of adsorbate molecules within the carbon matrix.
18
Figure 5(b) shows the SEM image of iron oxide nanoparticles recorded at a magnification of 50,000X, where nano rod-like structures with sharp and well-defined edges are clearly visible, confirming the successful formation of IONP.46,47 The formation of nanorods can be attributed to controlled nucleation and anisotropic growth, both of which are influenced by synthesis conditions and external fields. The formation of primary spherical nanocrystals is followed by directed attachment into chains and recrystallization into single-crystal rods.
48
SEM images of various adsorbents. (a) Activated carbon before nanocomposite preparation, (b) Iron oxide nanoparticles (IONP), and (c) Activated carbon-iron oxide nanocomposite (AC-IONC) before adsorption.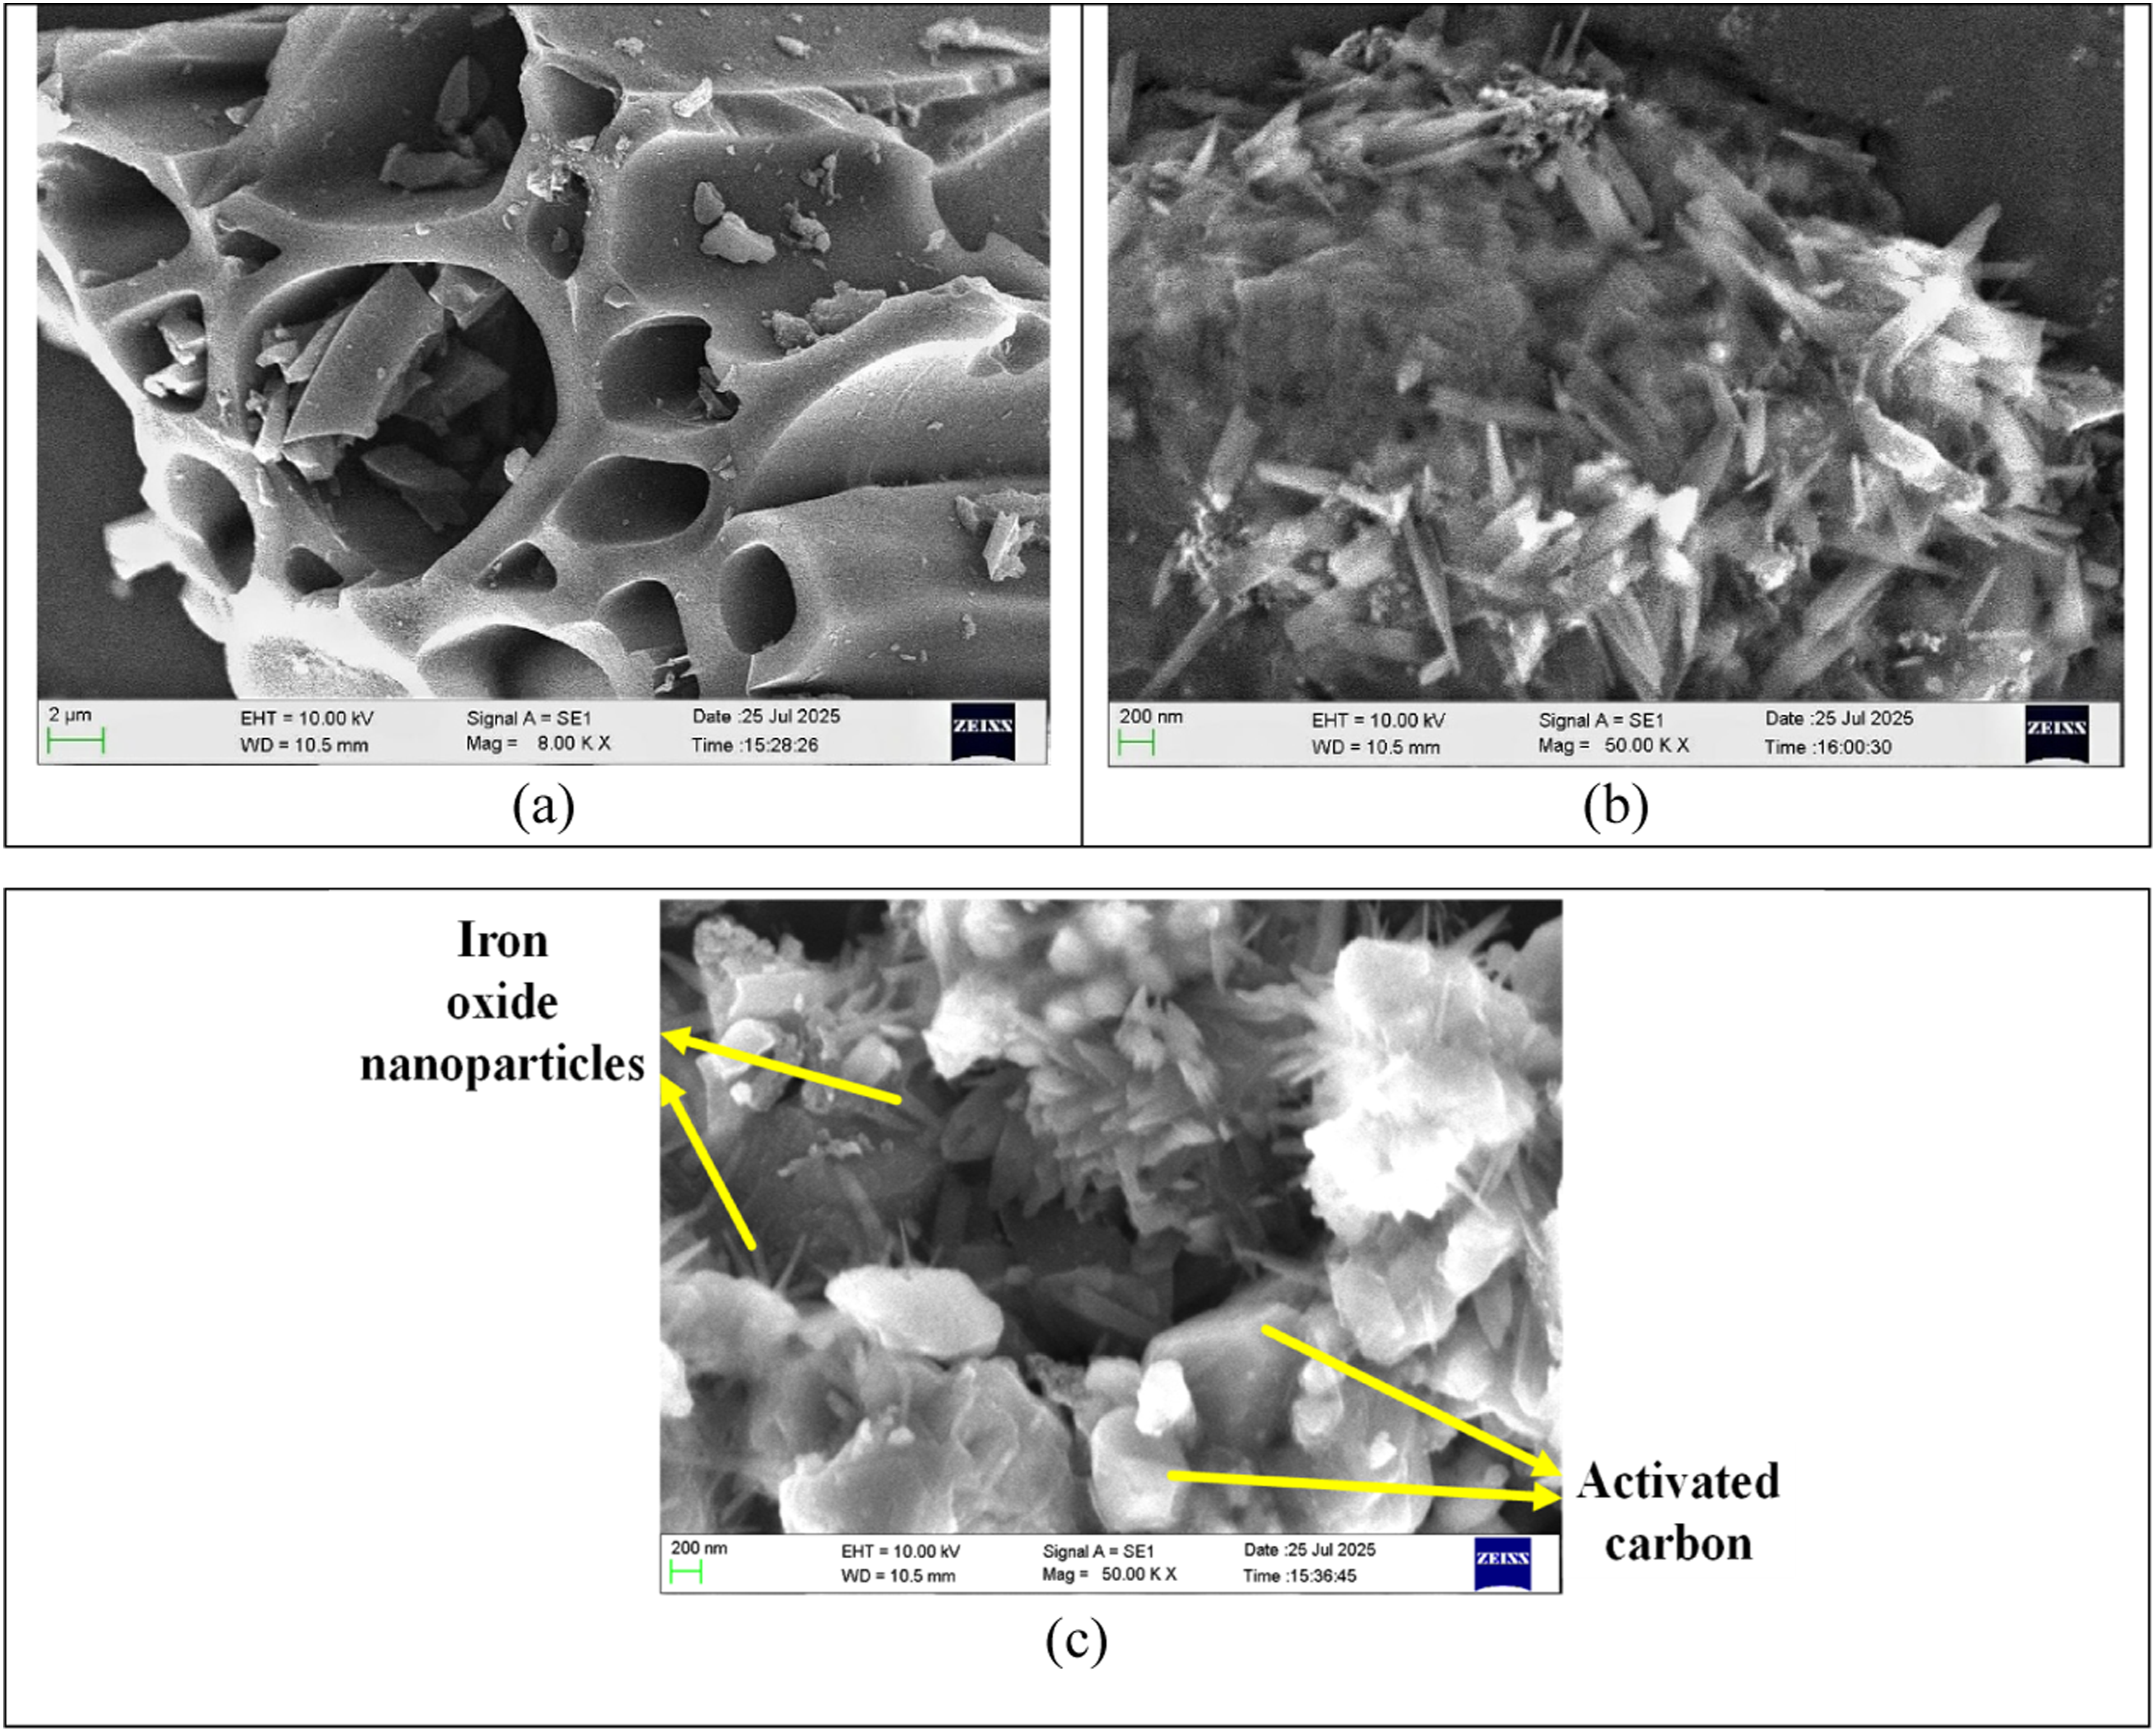
Figure 5(c) reveals significant structural reorganization following coating of nanoparticles on activated carbon. The captured images at 50,000X to 60,000X magnification show spherical particles in close contact with the nano-rod-like iron oxide structures, indicating effective integration of IONP onto the AC surface.49,50 Additionally, the AC-IONC shape distribution is highly heterogeneous, demonstrating that the dynamics of the synthesis process alter the size and shape of the nanorod-like nanoparticles and the spherical activated carbon present on the nanocomposite. The nanorod particles were randomly aligned, approximately 2 μm long, on the surface of the activated carbon in the nanocomposite cluster. This combined cluster forms large voids, increasing the surface area (as seen in the BET analysis) and thereby increasing the adsorption capacity for As(V) removal.39,51–55 This hybrid morphology results in a heterogeneous distribution of micropores, mesopores, and macropores across the AC-IONC surface, enhancing pore accessibility and interfacial interaction. The coexistence of high microporosity and a diverse morphological framework confirms the successful synthesis of AC-IONC and underscores its potential for high-efficiency functional and adsorption-based applications.26,45,51,52
The surface morphology of the AC-IONC after regeneration was analyzed using field emission-scanning electron microscopy (FE-SEM). Figure 6(a) and (b) presents the FE-SEM image of AC-IONC before adsorption, and after regeneration, respectively. Figure 6(a) confirms the rough surface of AC covered with iron oxide nanoparticles. Figure 6(b) shows the surface modification of AC-IONC after regeneration. The images suggest that the surface roughness decreased and became smoother after multiple desorption cycles. Also, the amount of iron oxide coating has reduced due to the dissolution by acids during the regeneration. This is due to oxidation and corrosion of the AC-IONC surface by the acids used for desorption. EDS also showed that the iron % has reduced from 10.57 % to 6.2% after regeneration (Figures 7 and 8). FE-SEM images of AC-IONC of (a) before adsorption (b) after the three adsorption and desorption cycles. (a) EDX image of the composite before adsorption, (b), (c), and (d) elemental mapping images of elements C, O, and Fe, respectively. (a) EDX image of regenerated AC-IONC; (b), (c), and (d) elemental mapping images of C, O, and Fe, respectively, present on the surface of regenerated AC-IONC.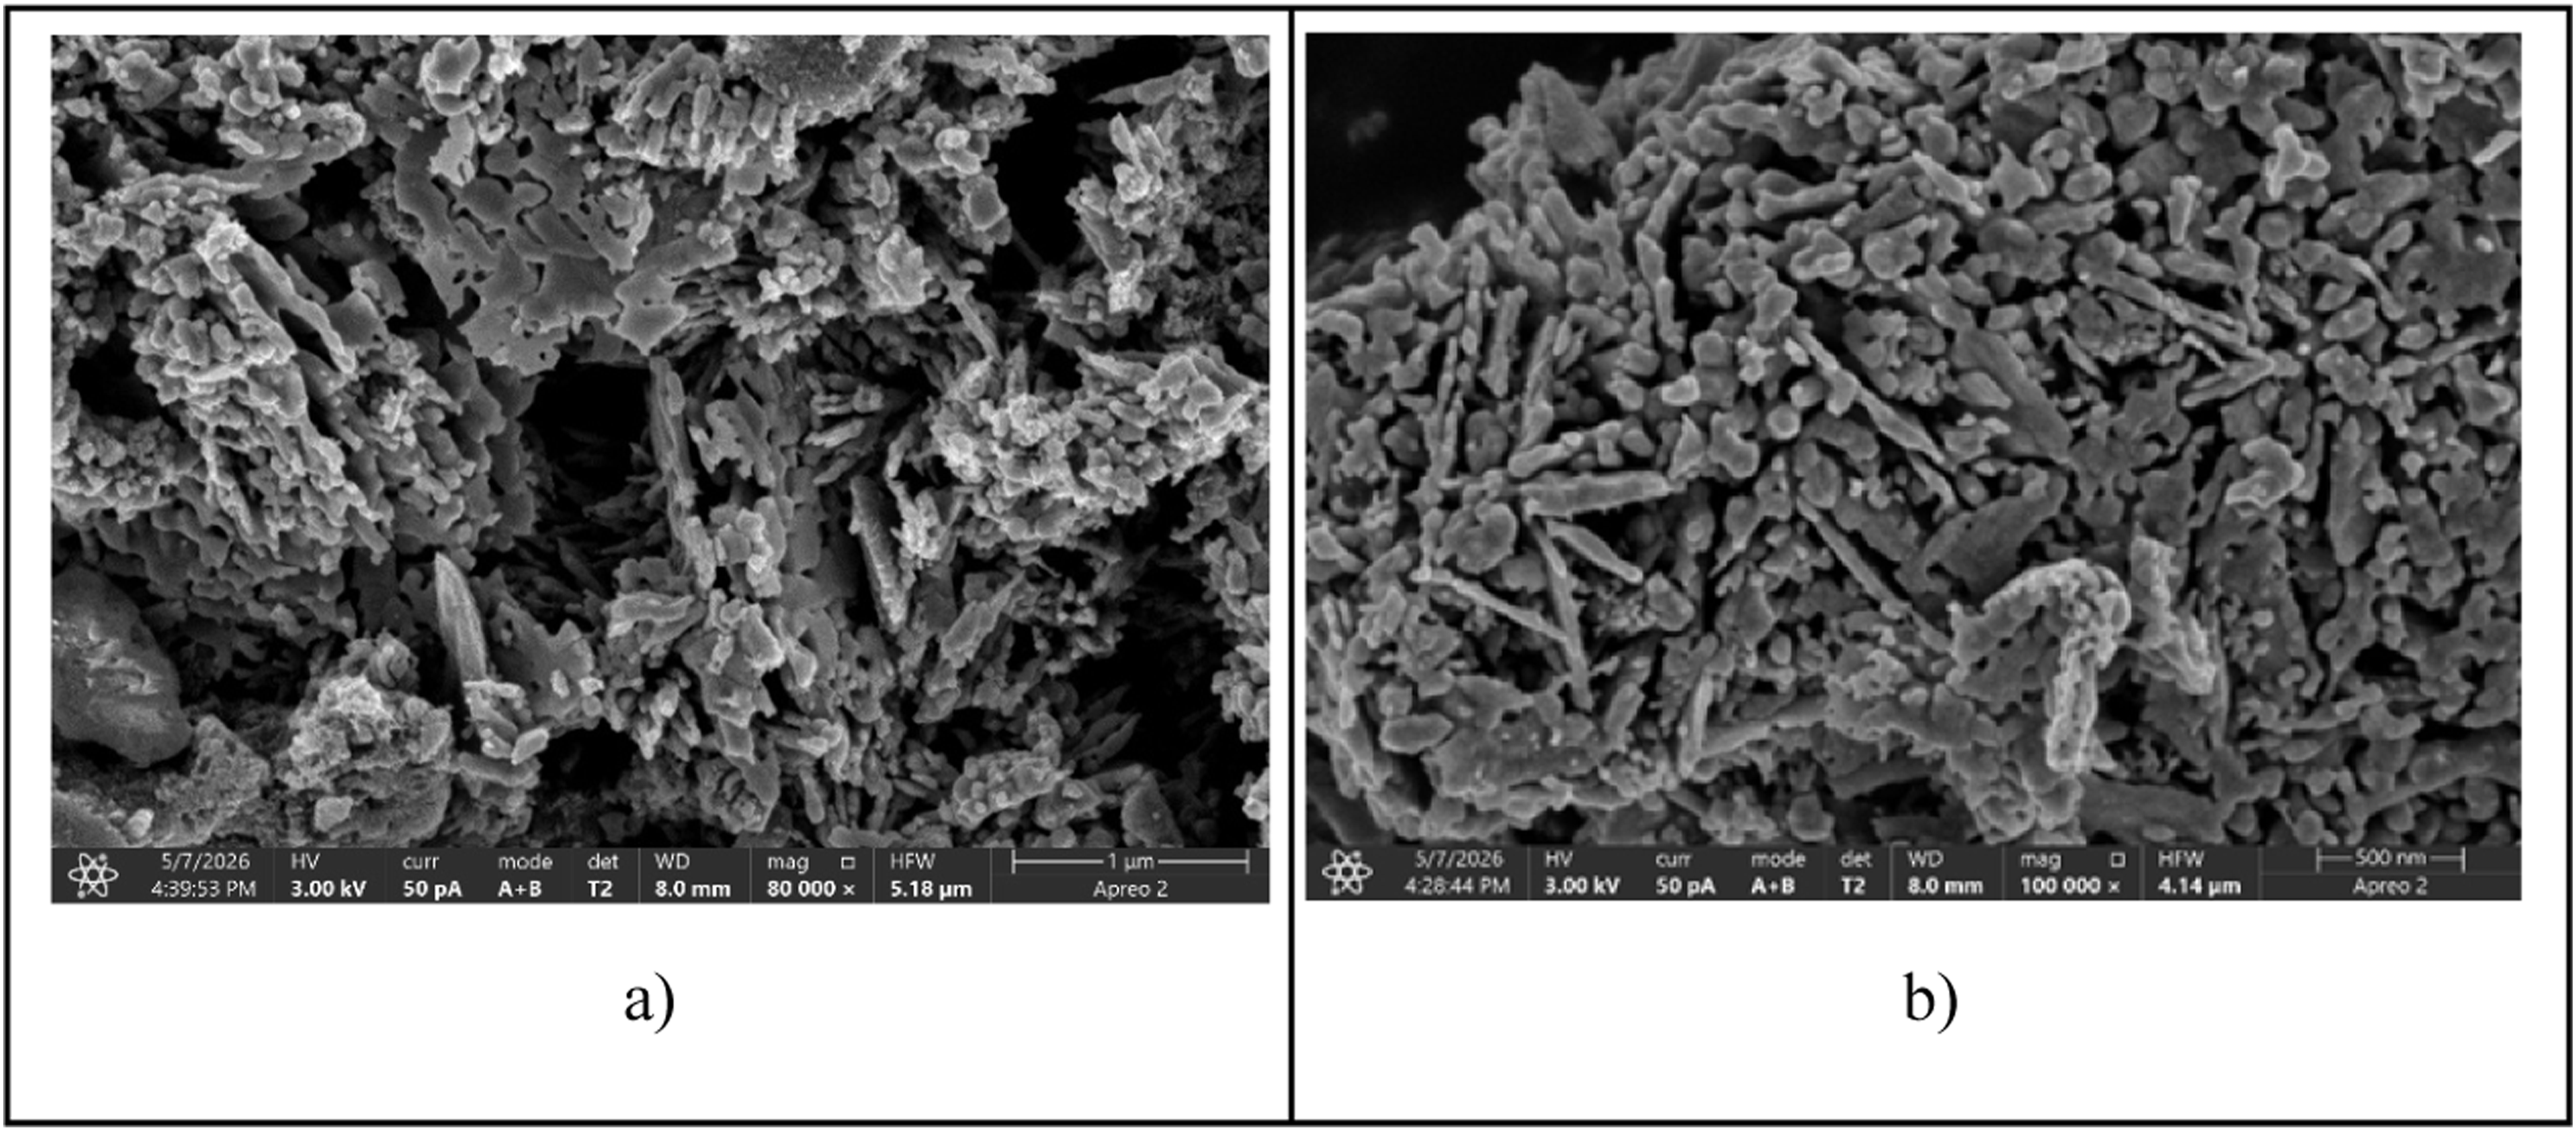
3.5. Energy-dispersive X-ray spectroscopy (EDS) of AC-IONC before and after regeneration
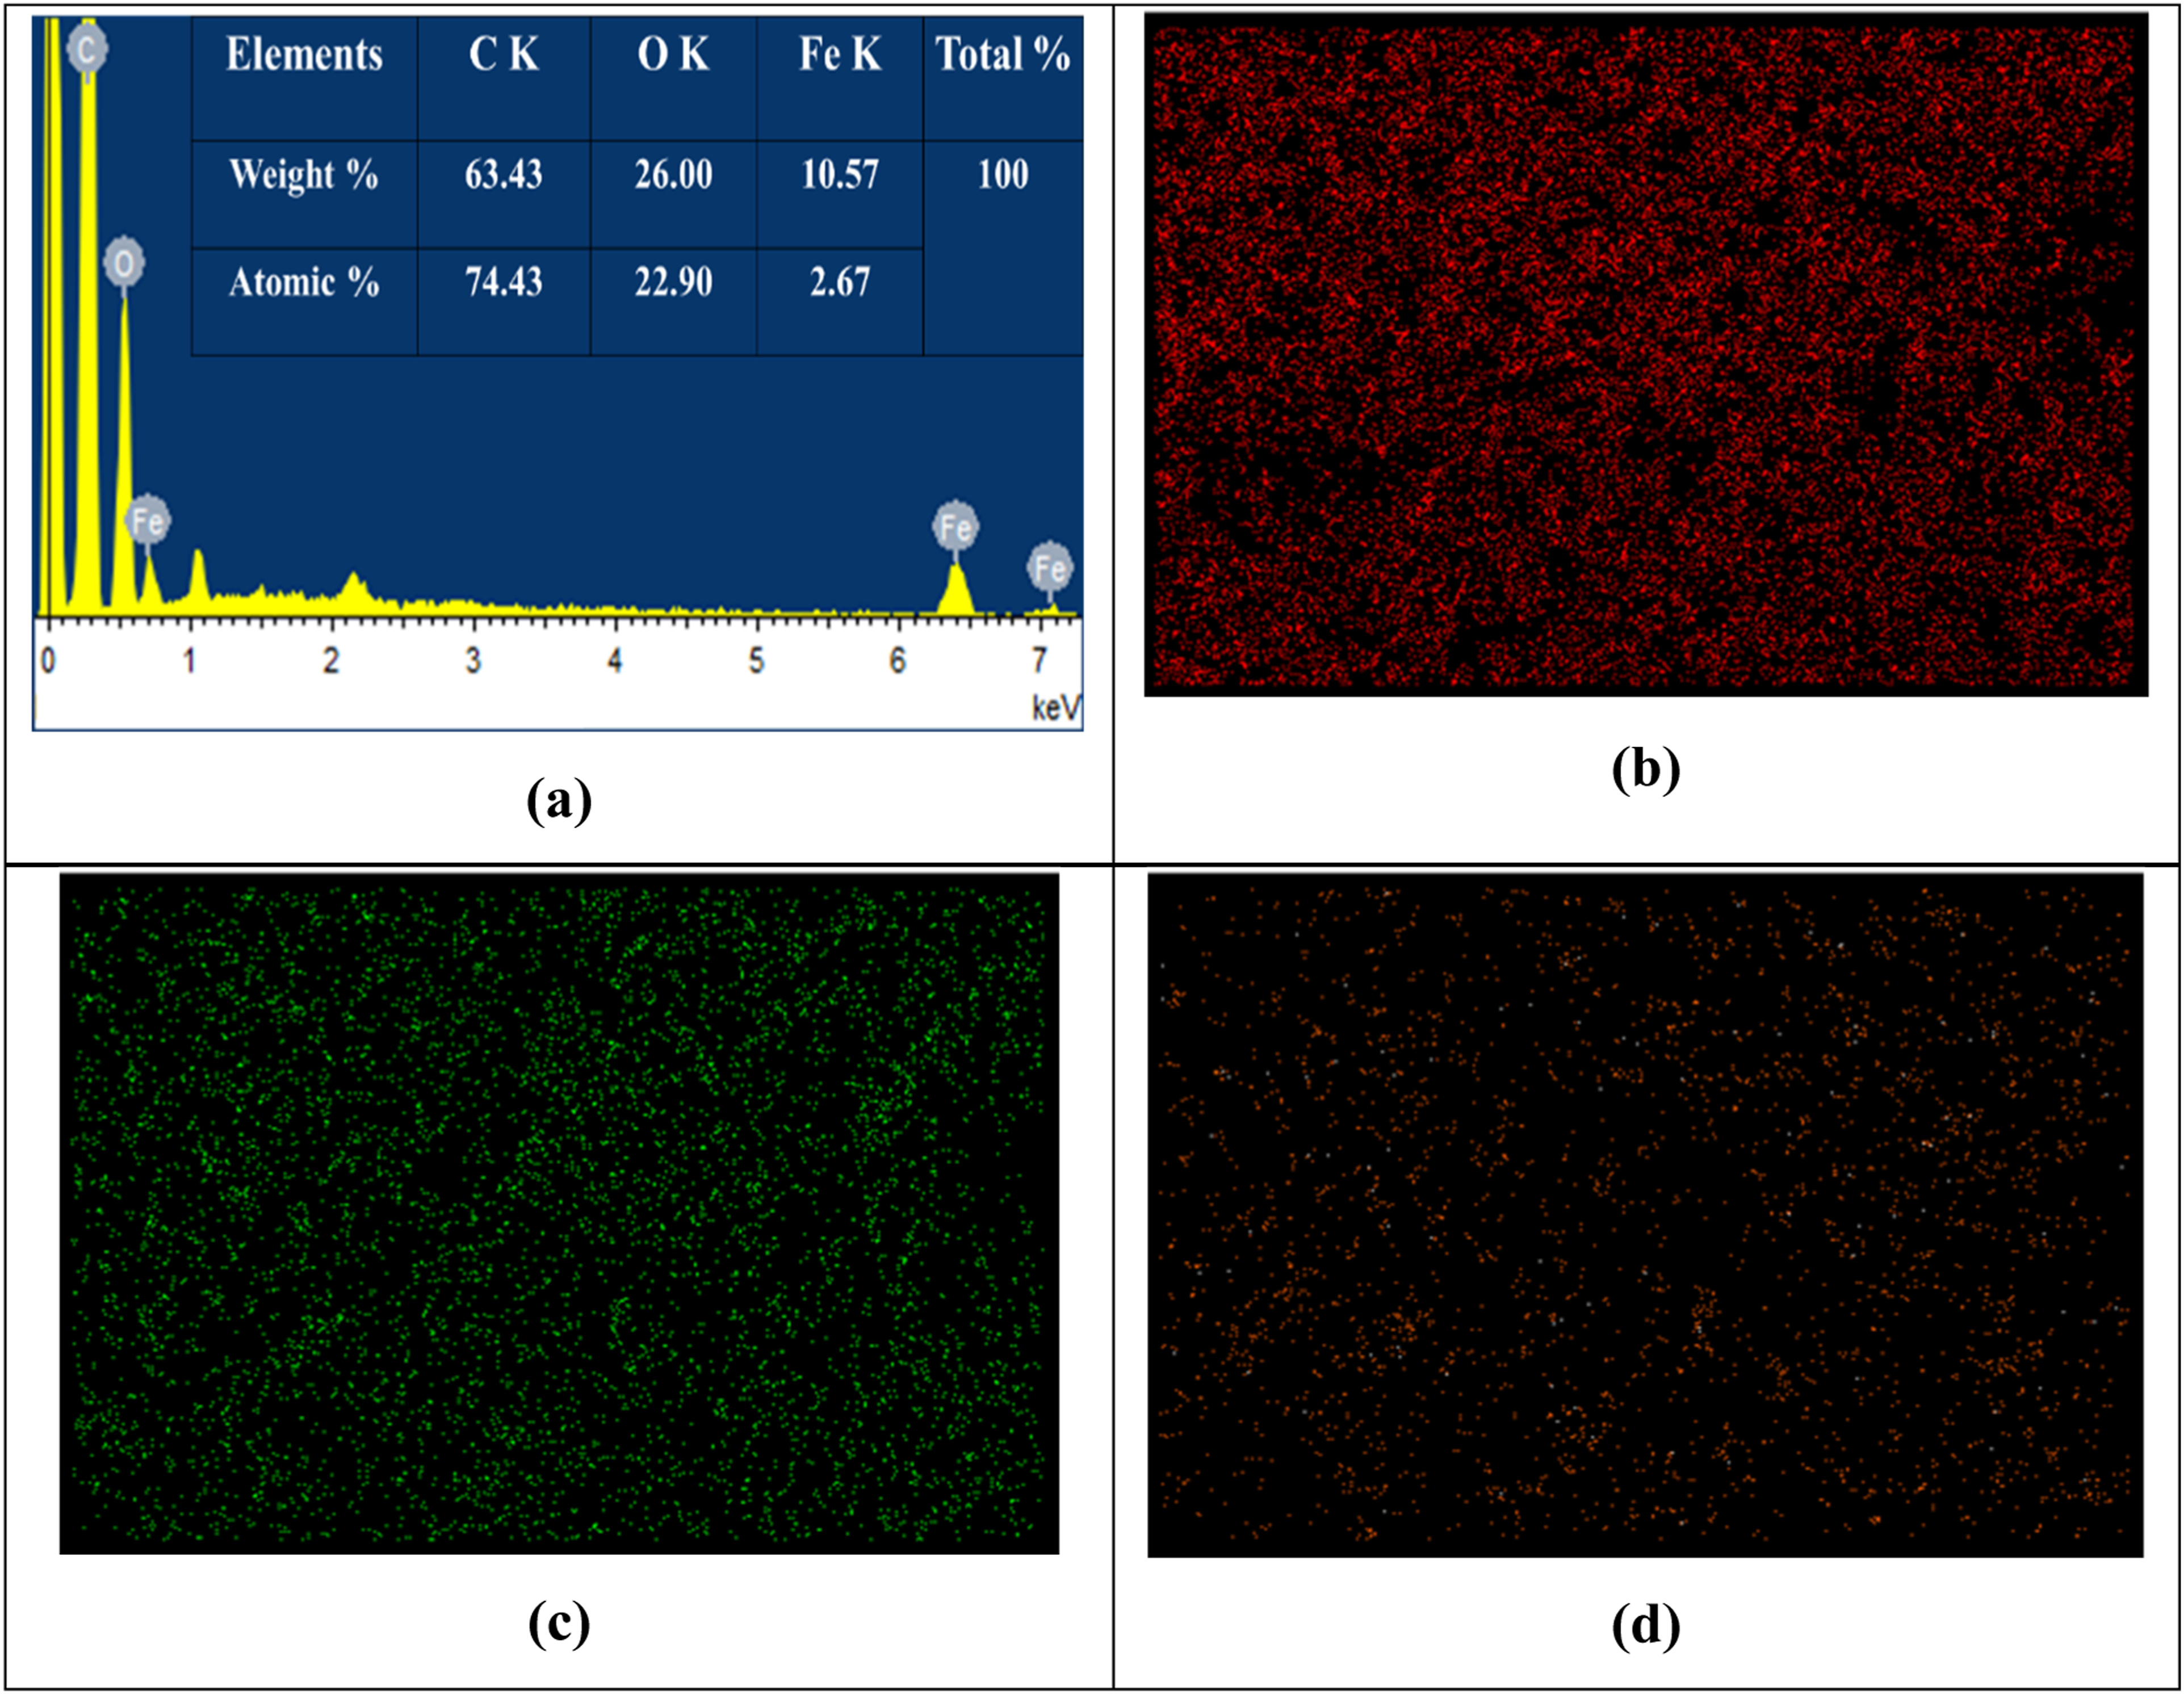
Energy-dispersive X-ray Spectroscopy (EDS) was used to fully characterise the surface elemental composition of AC-IONC. EDS spectrum of composite material, carbon, oxygen, and iron is presented in Figure 7 (a)–(d). The characteristic energy signatures of carbon (C), oxygen (O), and iron (Fe) in the AC-IONC are evidenced by three distinct peaks in the EDS spectrum (Figure 7(a)), predominantly within the 0-1 keV region. 18 The quantitative elemental analysis indicates that the composite is largely carbonaceous, comprising 74.43% carbon, while oxygen and iron account for 22.90% and 2.67% of the atomic composition, respectively (Figure 7(b)–(d)). 27 The concurrent presence of iron and oxygen confirms the successful incorporation and stabilisation of iron oxide species on the activated carbon surface, whereas the high carbon-to-iron ratio reflects a robust carbon matrix. Elemental mapping reveals a uniform spatial distribution of C, O, and Fe across the adsorbent surface, with no evidence of localised agglomeration. 53 Such homogeneity is critical for ensuring consistent adsorption performance. The findings confirmed that the effective synthesis of a well-integrated AC-IONC, in good agreement with previously reported studies.43,54,55 The EDX results are consistent with the earlier literature, where Quyen et al. (2025) synthesized an activated carbon/magnetic iron oxide composite for the removal of ciprofloxacin and Tetracycline from a binary system. 43 The close correlation between quantitative elemental composition and qualitative mapping further supports the structural integrity of the functionalized adsorbent for As(V) removal applications. 54
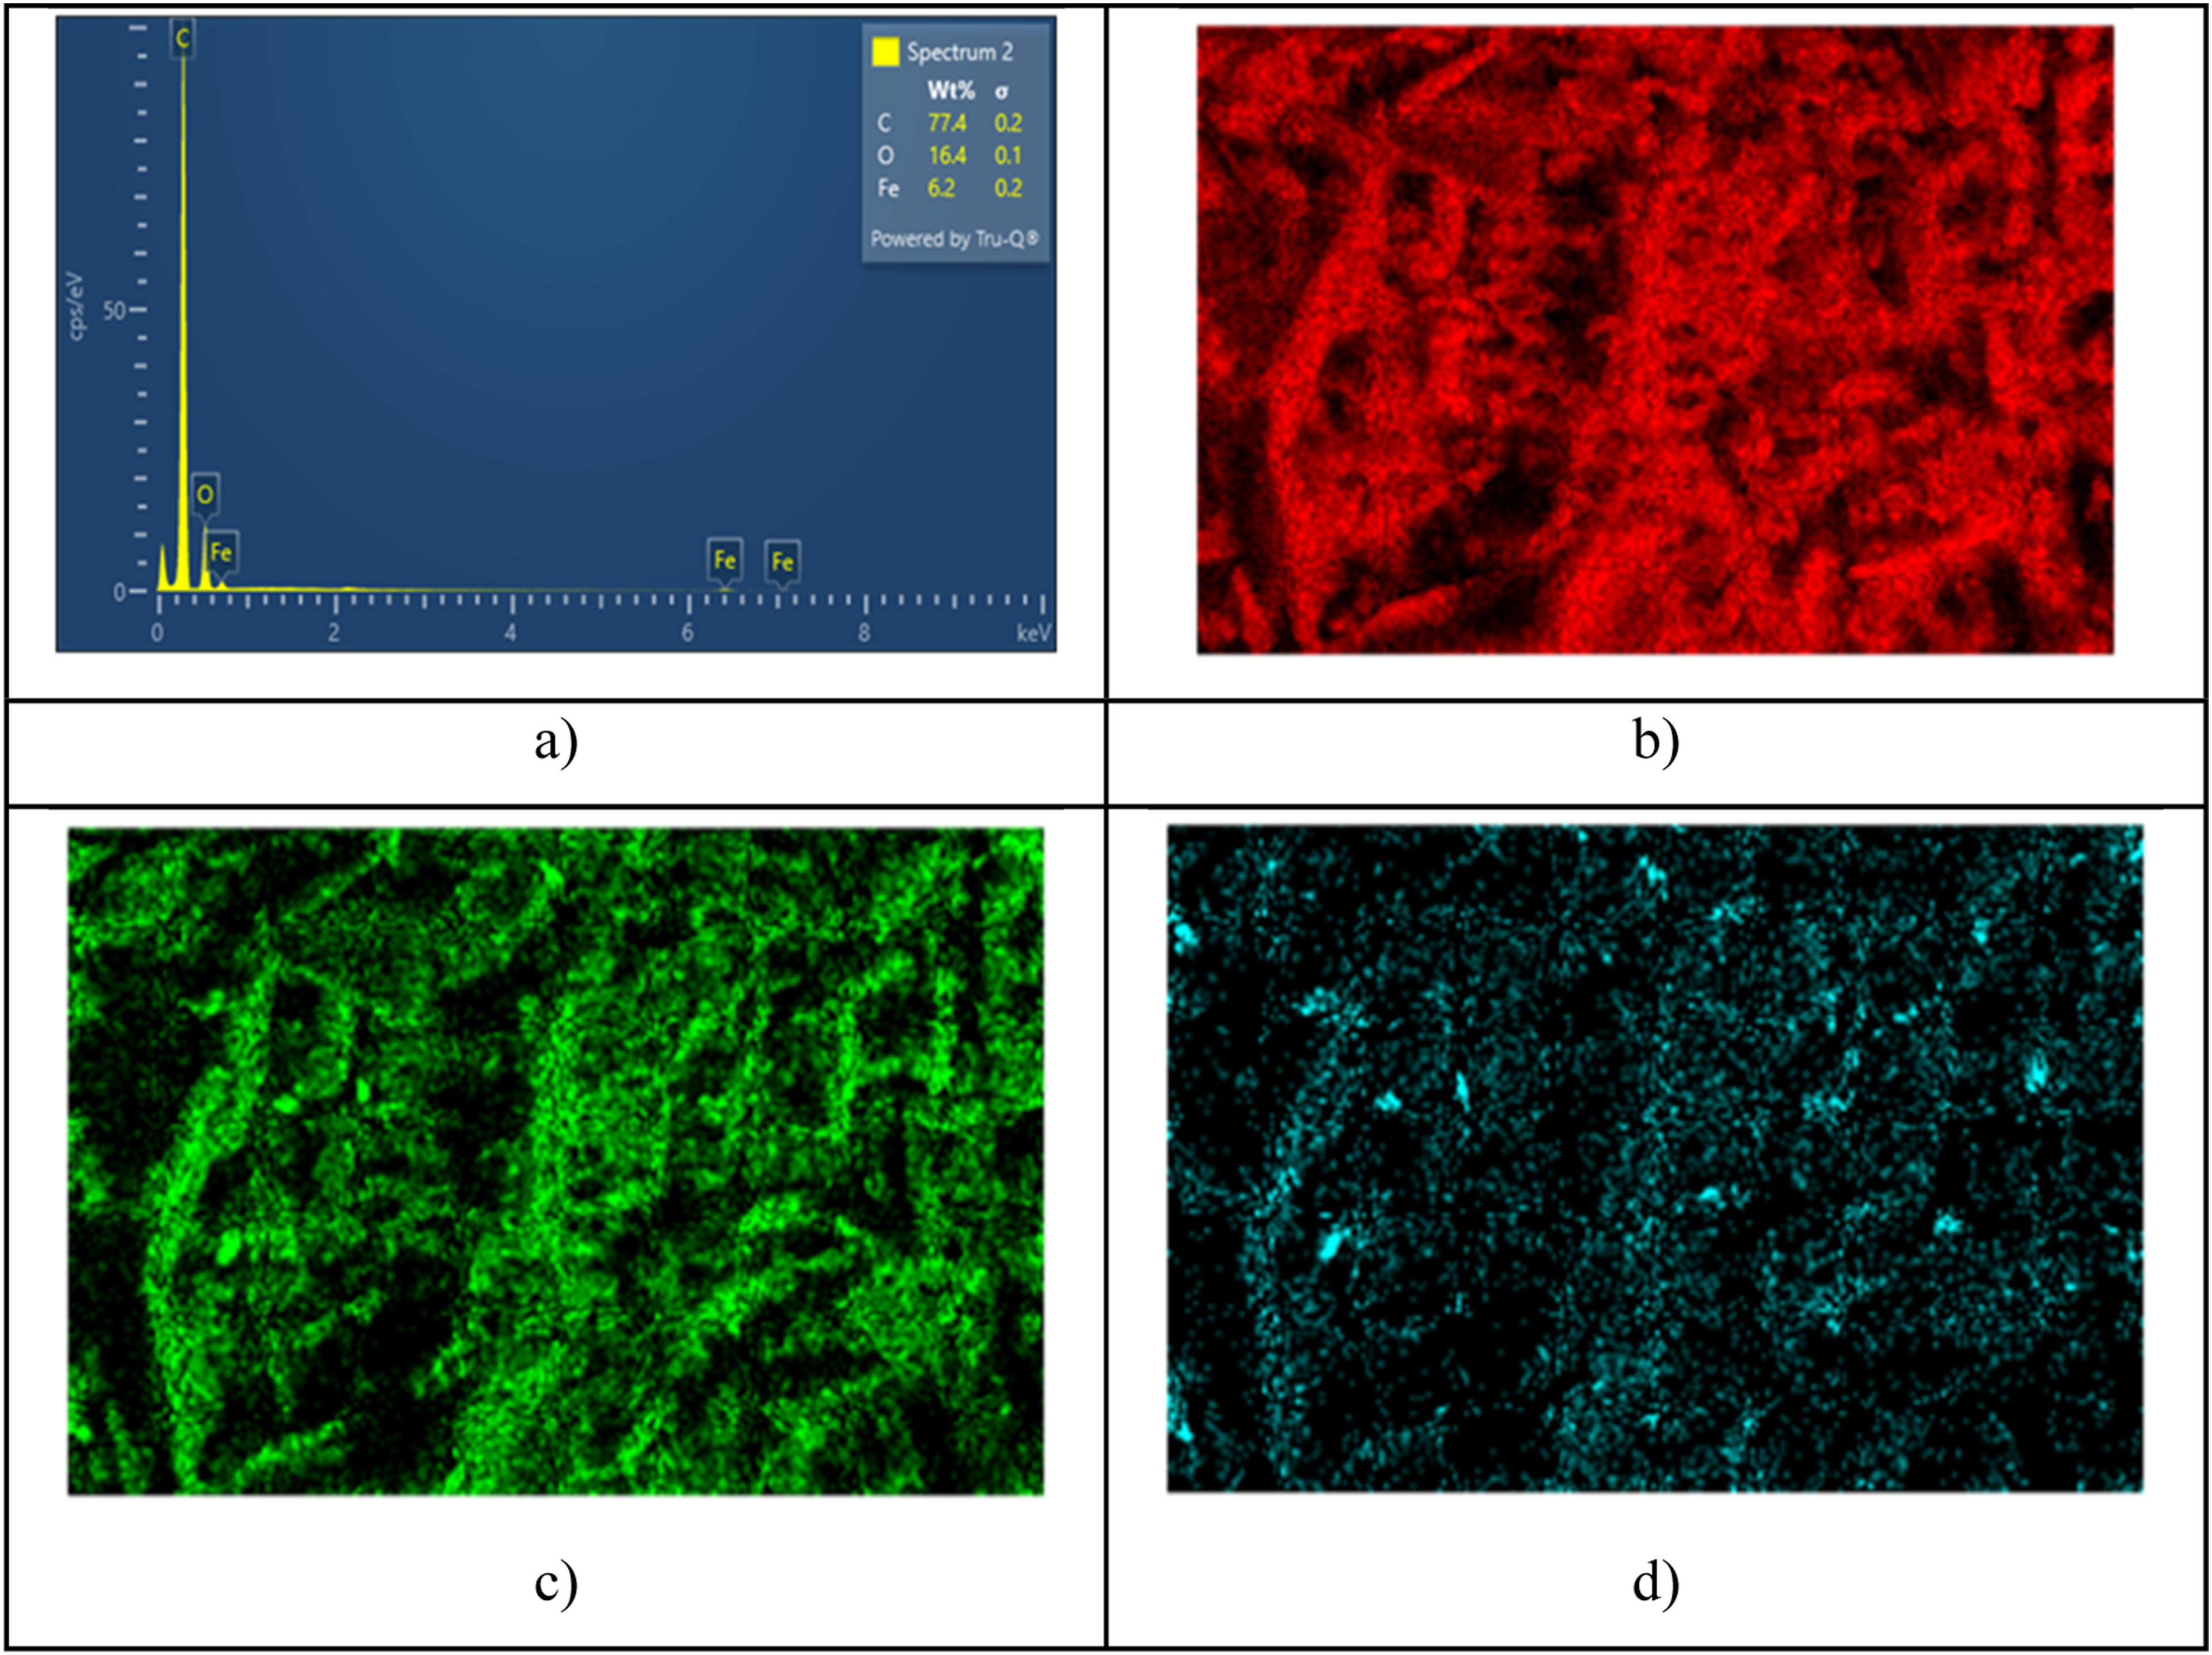
Further, the Energy-Dispersive X-ray spectroscopy was conducted to analyze the changes that occurred in the regenerated adsorbent surface morphology. The EDS analysis image and the elemental mapping image of carbon (C), oxygen (O), and iron (Fe) are presented in Figure 8(a)–(d). The clear change in the surface functional groups and the iron oxide morphology on the surface of the composite was observed in the image. Three sharp peaks were observed in the EDS spectrum in the 0-1 keV region. These peaks confirm the presence of C, O, and Fe in the AC-IONC matrix. The percentages of C, O, and Fe were 77.4%, 16.4%, and 6.2%, respectively. This increase in the weight percentages of C and decrease in the weight percentage of Fe and O represent the changes that occurred on the surface of AC-IONC after the adsorbent was regenerated multiple times (three). Figure 8 (a)–(d) presents the elemental mapping images of the regenerated AC-IONC adsorbent. Elemental mapping demonstrates the uniform distribution of C, O, and Fe over the regenerated adsorbent surface. For the adsorbent to undergo multiple adsorption cycles, homogeneous surface components are extremely important. The EDS image and elemental mapping reveal structural alterations to the AC-IONC surface after three desorption cycles. The difference between the EDS image of the AC-IONC surface before and after regeneration was very little.
3.6. Adsorption studies of arsenic(V) on AC-IONC
3.6.1. Comparative study of the adsorption capacity of arsenic using AC and AC-IONC
The comparative adsorption experiments were conducted to evaluate the As(V)-removal capacities of AC and AC-IONC. The experimental results demonstrate a clear and significant difference between the raw AC and the AC-IONC for As(V) adsorption, as displayed in Figure 9. The raw AC exhibited an As(V) adsorption capacity of 3.46 mg/g, whereas the nanocomposite achieved a significantly higher capacity of 8.08 mg/g. The main cause of this improvement is the synergistic effect of adding IONPs to the AC cluster. Through specific interactions such as surface complexation and electrostatic attraction, iron oxide incorporation on AC increases the affinity for As(V) species and provides more active sites. Additionally, increased contact between the adsorbent and As(V) ions is enabled by the nanocomposite’s higher porosity and surface area, thereby enhancing removal efficiency. Additionally, iron oxide increases the overall adsorption capacity by facilitating processes such as ligand and ion exchange, which are less common in pure activated carbon. Consequently, the AC-IONC demonstrates greater effectiveness as an adsorbent for water purification applications than raw commercial activated carbon. Arsenic adsorption capacity (mg/g) comparison of powdered activated carbon and AC-IONC.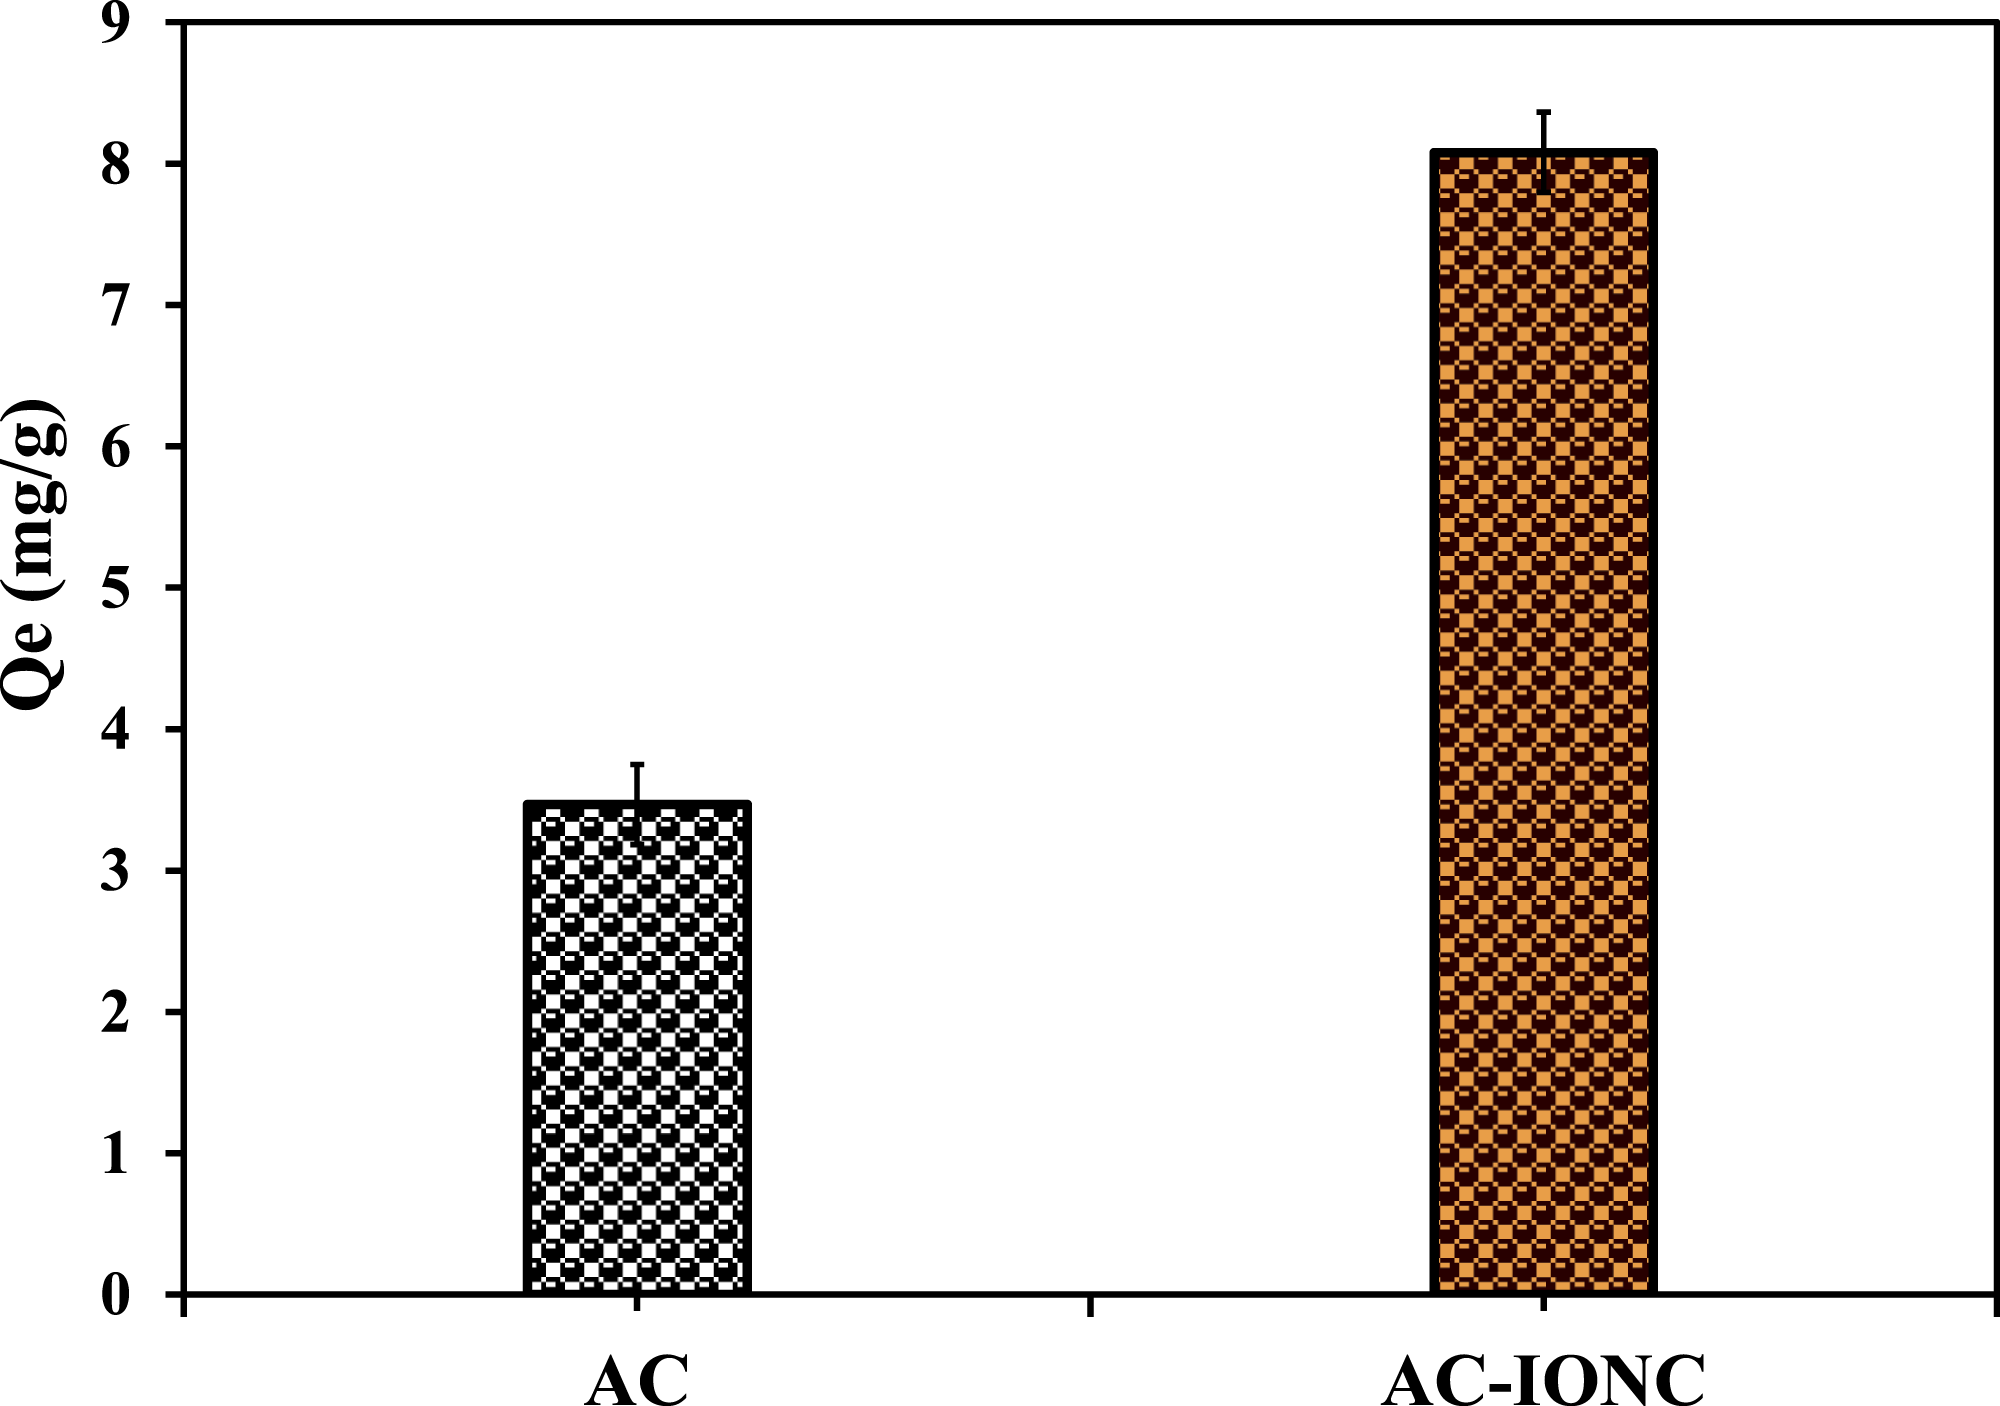
3.6.2. Determination of the point of zero charge
The zero-point charge/point of zero charge is very important for explaining the adsorption mechanisms. The adsorption of As(V) on AC-IONC is greatly affected by solution pH because it alters the chemical nature of the sorbent and sorbate.
56
The point-of-zero-charge experiment was conducted using 50 mL of 0.1 M NaCl in multiple conical flasks, with 5 g/L AC-IONC added. The solution pH was adjusted over the range of 2-11 using 0.01 N NaOH and 0.01 N HCl. AC-IONC was added to 50 mL of 0.1 M NaCl solution, and the suspension was agitated at 150 rpm and 25 °C for 24 h. Following equilibration, the final pH of the solution was measured using a calibrated pH meter. The reaction equation for acidic pH is given below (Eqs. 5 and 6). The point of zero charge (pHzpc) was determined from the difference between the initial and final pH values (ΔpH), and the pHzpc was obtained from the plot of ΔpH versus initial pH.
47
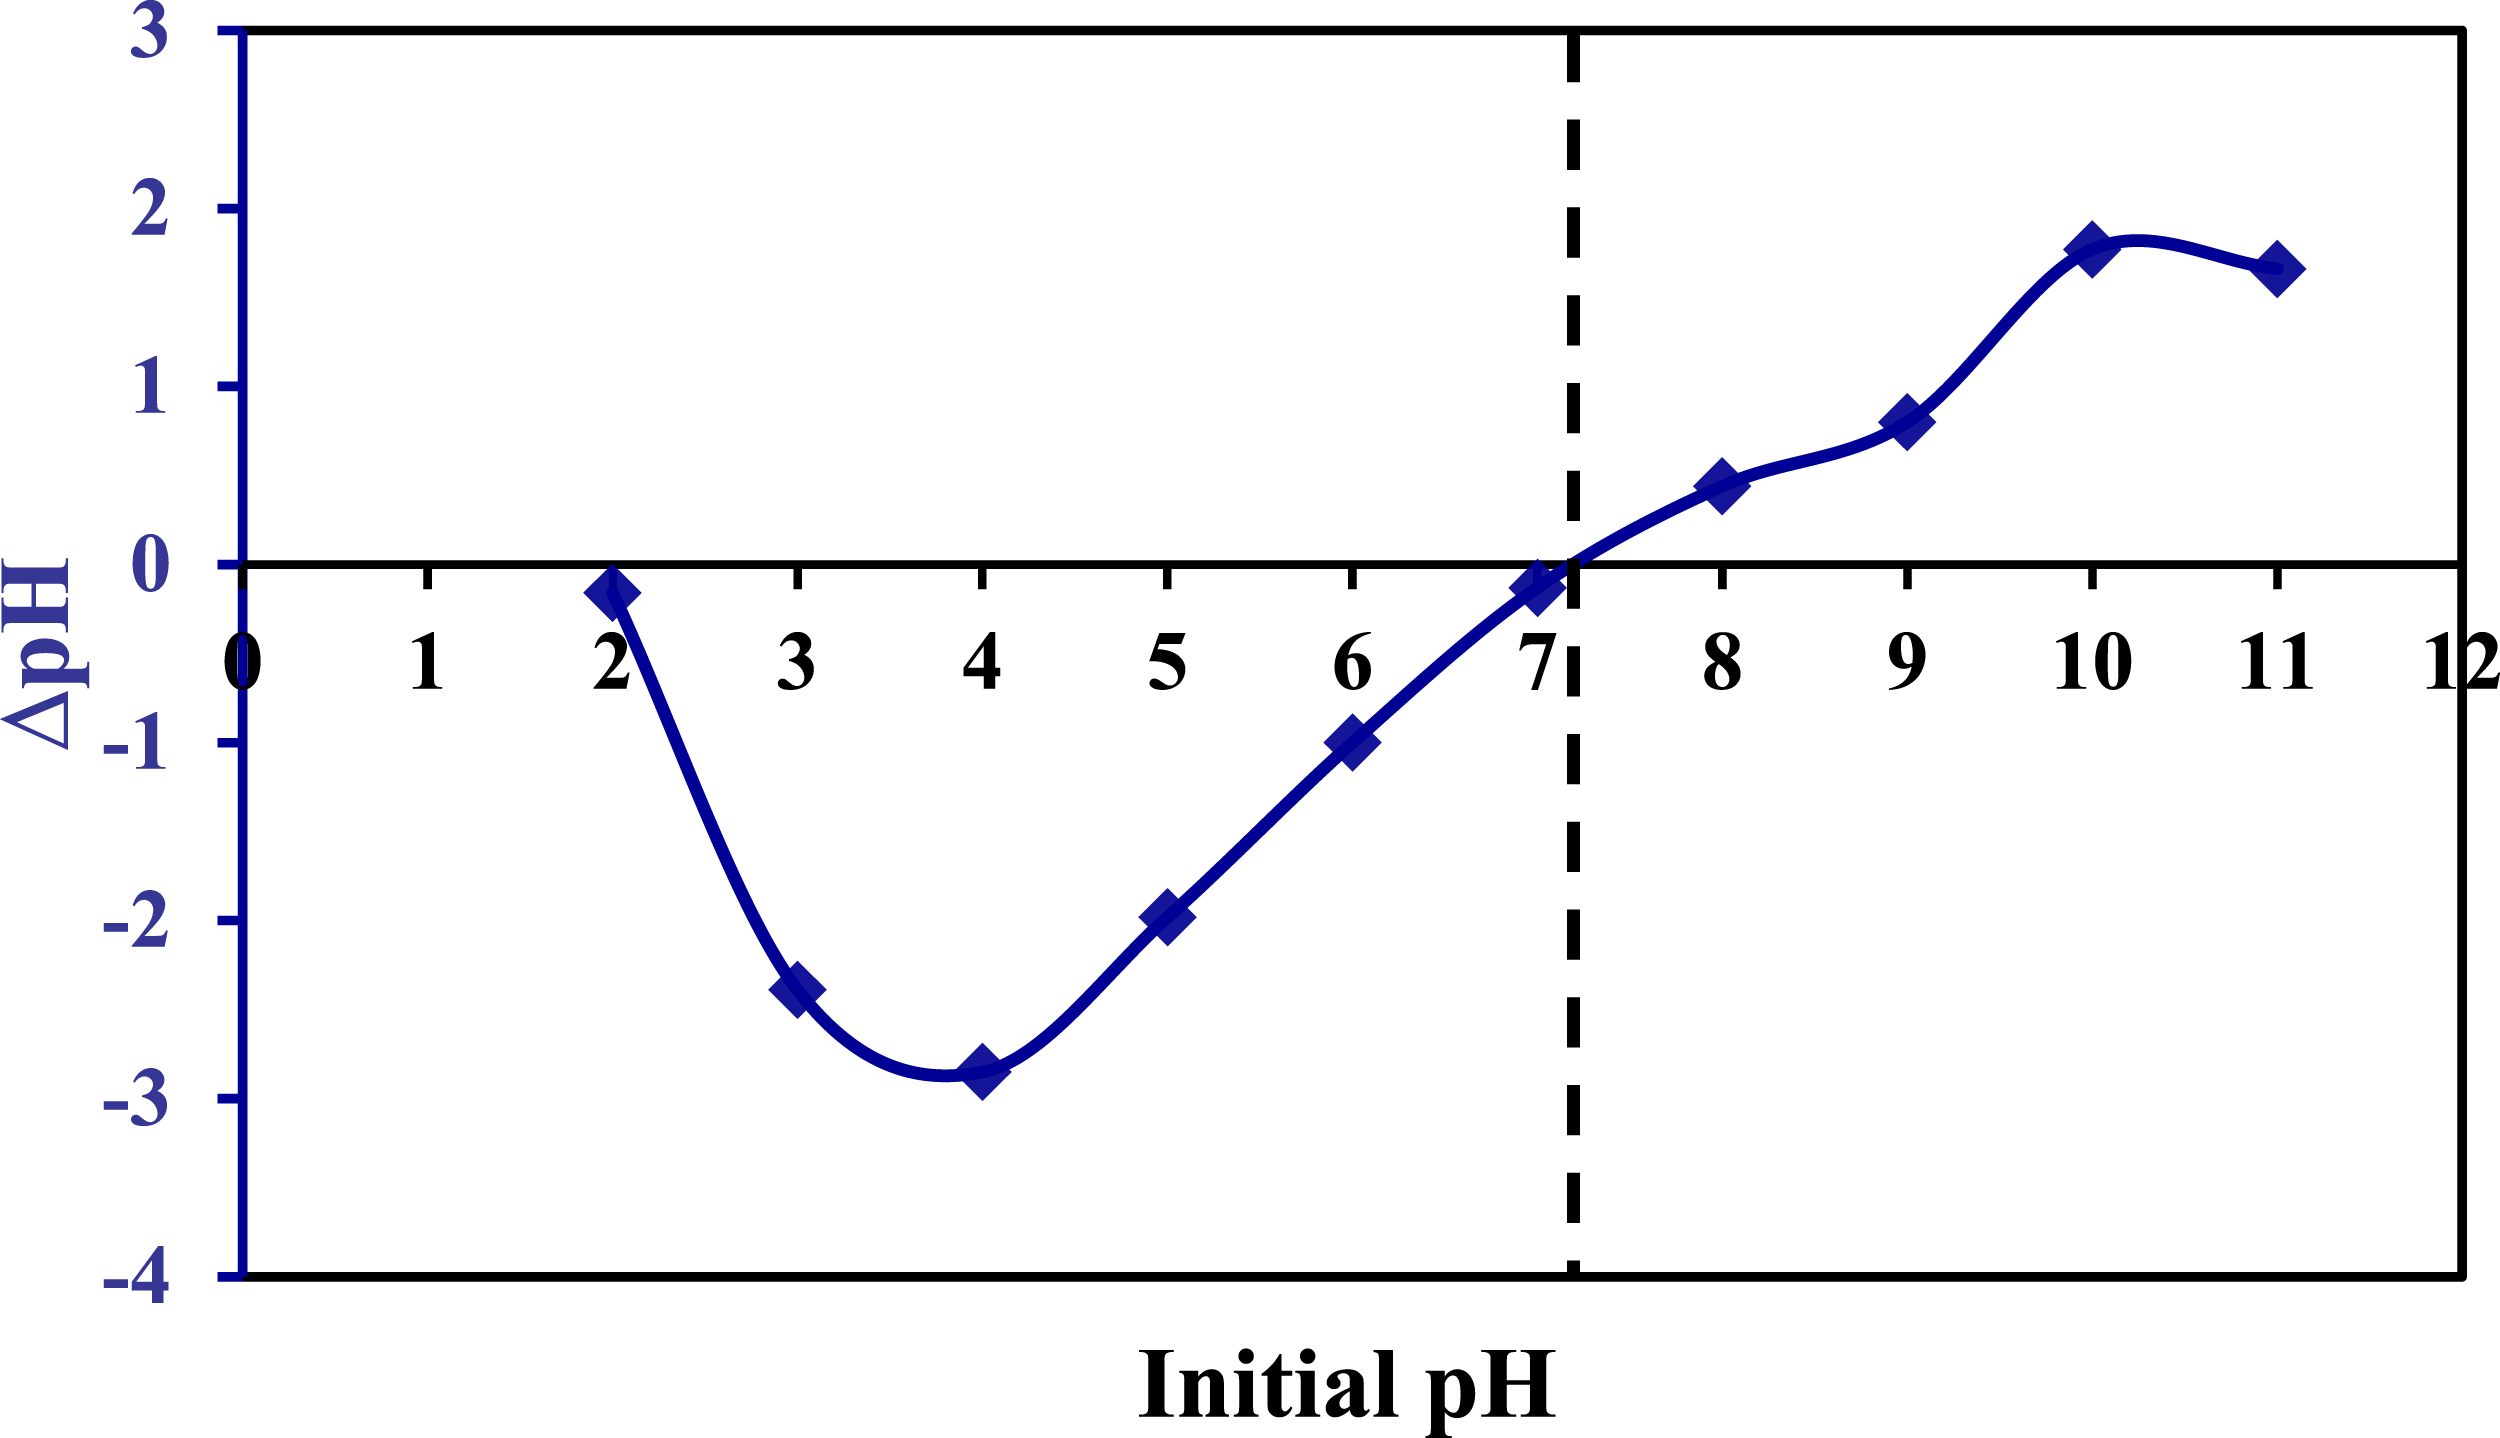
The experimentally determined pHzpc is presented in Figure 10. Furthermore, the effect of solution pH on As(V) adsorption was investigated over the pH range of 2-11. The ΔpH value was negative at pH 2, near zero (-0.16), and decreased further to -2.39 and -2.85 at pH 3 and 4, respectively. The lower value (-2.85) was observed at pH 4; however, pH and ΔpH increased linearly from -1.98 to -0.13 at pH 5 and 7. The intersection point was found to be 7.15 pH for AC-IONC, where the surface net charge was zero. Furthermore, from pH 8 to 11, the ΔpH value increased gradually from 0.44 to 1.66. The surface of the AC-IONC was found to be negatively charged at pH values greater than 7.15 and positively charged at pH values lower than 7.15. Furthermore, it was observed that the pH exceeded 7.15 and that the AC-IONC surface became negatively charged, repelling As(V) electrostatically.
27
The reaction equation of basic pH is mentioned below in Eqs. 7. The pH of the As(V) solution was less than 7.15 under acidic conditions. The surface of AC-IONC is positive and adequate for the adsorption of predominant forms of As(V) species like the dihydrogen arsenate H2AsO4- and monohydrogen arsenate HAsO42-.
7
The surface was positively charged, and the AC-IONC absorbed As(V) via electrostatic attraction. Similar results were obtained in earlier literature, where As(V) was removed from an aqueous solution using a polyaniline microsphere-Fe3O4 nanocomposite adsorbent.
57
The pKa values for H2AsO4- and HAsO42- are 2.19 and 6.94, respectively.
58
Adsorption is expected to occur between pH 2.2 and 6.9, based on the pKa value. Point of zero charge (pHpzc) determination of the composite. (V=50 ml, T=25 °C, pH= 2 – 11, Dosage = 5 g/L, Co= 0.1 M NaCl at 150 RPM for 24 h). Duplicate with an average standard deviation of ± 0.02.


3.6.3. Effect of pH on adsorption
The pH studies for the adsorption system were conducted over the pH range of 3-11 and are presented in Figure 11. The impact of the initial solution pH on the sequestration of As(V) by the AC-IONC composite reveals a significant dependence on the aqueous environment. It was observed that the adsorption capacity and removal efficiency were maximum at pH 3, reaching 3.9 mg/g and 36%, respectively. This phenomenon is logically explained by the high concentration of H+ ions in the solution, which leads to the extensive protonation of the AC-IONC surface functional groups. At pH 3, the As(V) species maintain their negative charge, while the adsorbent surface becomes positively charged. As a result, electrostatic attraction governs the system, facilitating rapid binding of As(V) to the AC-IONC surface-active sites.
59
The pH increased from 3 to 5; a transition in performance was observed: the removal efficiency decreased linearly, along with the adsorption capacity. This divergence is attributed to a reduction in hydronium ion concentration, which lowers the positive charge density at the composite surface and begins to alter the adsorption equilibrium.
60
Furthermore, increasing the pH from 7 to 11 resulted in a gradual reduction in adsorption capacity and removal efficiency. This decline is driven by the increasing abundance of OH- ions, which create a dual inhibitory effect.
61
It directly competes with As(V) oxyanions for available active sites and promotes the deprotonation of surface hydroxyl and carboxylic groups. The resulting negative charge on the AC-IONC surface and the As(V) species induces a dominant electrostatic repulsion, effectively blocking the approach of the As(V) species to the nanocomposite surface.
59
This behavior is consistent with the Point of Zero Charge (PZC) theory, where the adsorbent’s affinity for anions is maximized when the solution pH remains below the PZC value. Quantitatively, the sharpest reduction in performance occurs in the alkaline range, highlighting the sensitivity of the iron-oxide-carbon interface to hydroxyl interference.
62
However, maintaining a pH of 3 is not feasible for large-scale reactions. Hence, the pH of further experiments conducted was maintained at pH =5. These results align with the established literature on As(V) removal using activated carbon, which typically requires acidic to near-neutral conditions to maintain high surface reactivity and prevent the formation of unfavorable complexes.
12
Similar results align with earlier literature on arsenic and fluoride removal, in which Acharya et al. (2024) conducted a study on binary adsorption systems for their removal from groundwater using commercially available activated carbon. The maximum adsorption capacities for arsenic and fluoride were 3.58 mg/g and 2.32 mg/g, respectively, at pH 5. The optimum conditions in this adsorption system were a concentration of 100 mg/g, a dosage of 5 g/L, a temperature of 25 °C, and an agitation speed of 150 RPM.
12
Effect of pH on the adsorption of As(V). (V=50 mL, T=25 °C, pH=3-11, Dosage = 5 g/L at 150 RPM for 24 h).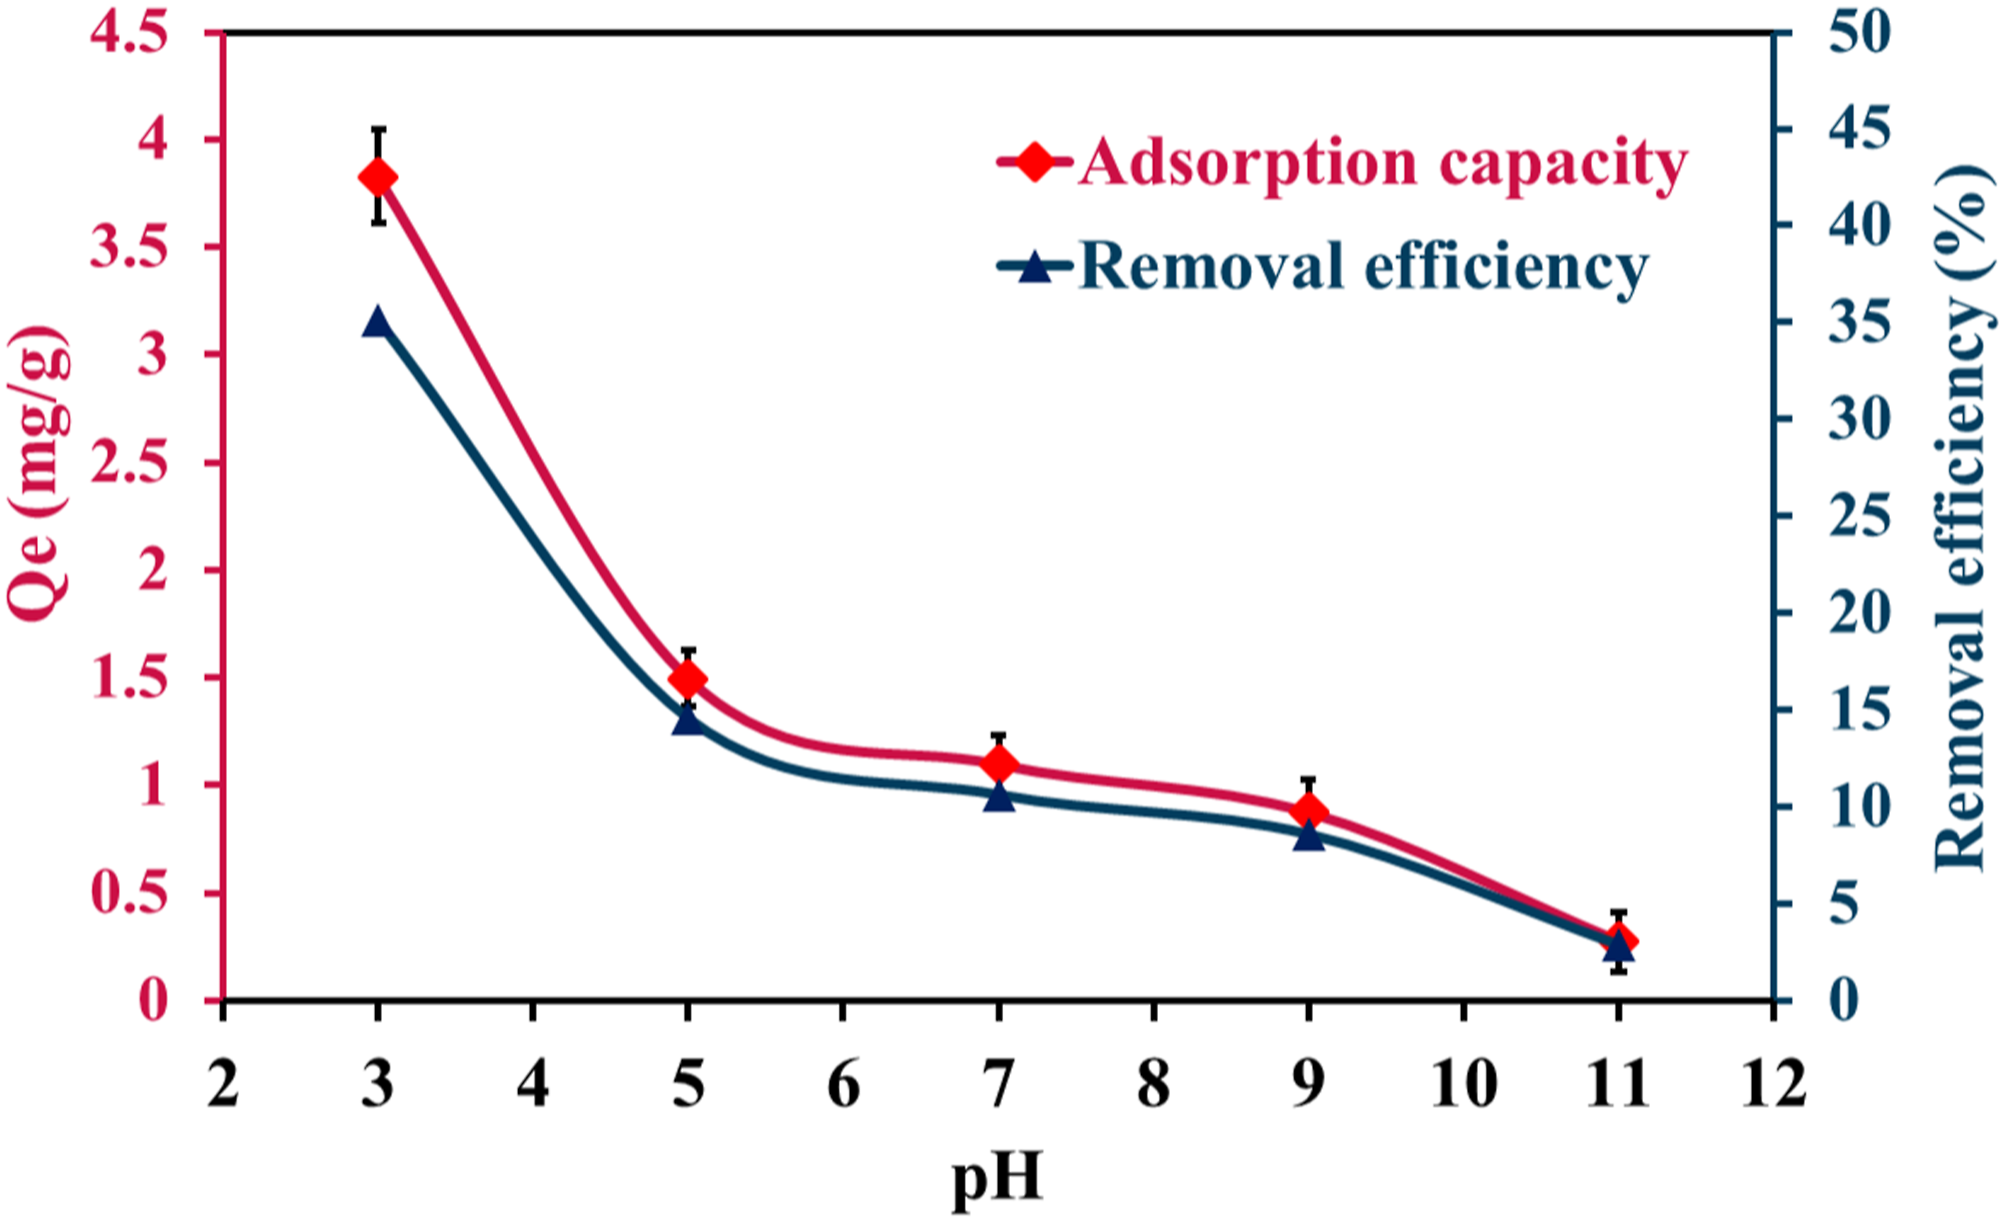
As(V) exists in different oxidation states depending on the solution pH. At acidic pH (pH<2) As(V) is in H3AsO4 species, at higher pH (pH 3-6) As(V) is in H2AsO4- species, at pH neutral to alkaline (pH 7-11) As(V) is in HAsO42- species and at basic pH (pH>12) As(V) is in AsO3- species. Among these species, the H2AsO4- species is most stable and most favorable due to the single-charged anion balancing electrostatic repulsion with a hydrogen bond and its pKa value, as explained earlier in this article. 20
3.6.4. Effect of adsorbent dosage on adsorption
The effect of AC-IONC dosage was employed to determine the relationship between adsorption capacity and varying adsorbent dosages. The impact of varying the composite dosage on adsorption capacity was determined. The effect of dosage on the Adsorption of As(V) onto AC-IONC was investigated with an initial concentration of 50 ppm, a composite dosage of 1-10 g/L, a temperature of 25 °C, and at 150 rpm for 24 h. Figure 12 shows the effect of AC-IONC’s dosage on the efficiency of As(V) in a batch experiment. The results reveal a classic inverse relationship between the specific adsorption capacity and the adsorbent dose (Figure 12). The total removal efficiency (%) increases significantly as the dosage increases from 1 to 10 g/L due to the availability of more active adsorption sites and a larger effective surface area, which enhances pollutant-adsorbent interactions. At higher dosages, the increased number of binding sites enhances mass transfer and collision frequency between the adsorbent and contaminants, leading to greater uptake and improved overall removal efficiency.
63
At the lower dosage of 1 g/L, the system presents a high specific capacity but limited removal. This occurs because the number of available active sites is insufficient to capture most As(V) ions, leading to high site occupancy but incomplete pollutant removal.
64
Furthermore, increasing the dosage from 2 g/L to 4 g/L increases the removal efficiency linearly from 10 % to 20 %, respectively, as the proliferation of vacant active sites enables the capture of more pollutants.
7
The system reaches an optimal threshold at a dosage of 5 g/L, where capacity and removal efficiency are at their maximum. At this juncture, the available As(V) molecules in the solution become limited relative to the adsorbent surface, leading to near saturation of the accessible pores.
12
Also, the dosage is increased from 6 to 10 g/L, while the removal efficiency remains high and the specific capacity remains constant. This is a common mass-normalization effect where the same amount of adsorbate is distributed over an increasingly larger mass of adsorbent. Furthermore, higher dosages can lead to particle aggregation and overlapping of active sites, reducing the effective surface area and weakening the concentration gradient that drives adsorption.
64
Ultimately, these results highlight the need to balance high removal percentages with optimal material utilization to ensure the practical efficiency of the AC-IONC composite in water treatment applications. Effect of adsorbent dosage on As(V) removal efficiency. (V=50 mL, T=25 °C, pH=3-11, Dosage = 1-10 g/L at 150 RPM for 24 h).
3.6.5. Adsorption kinetics study
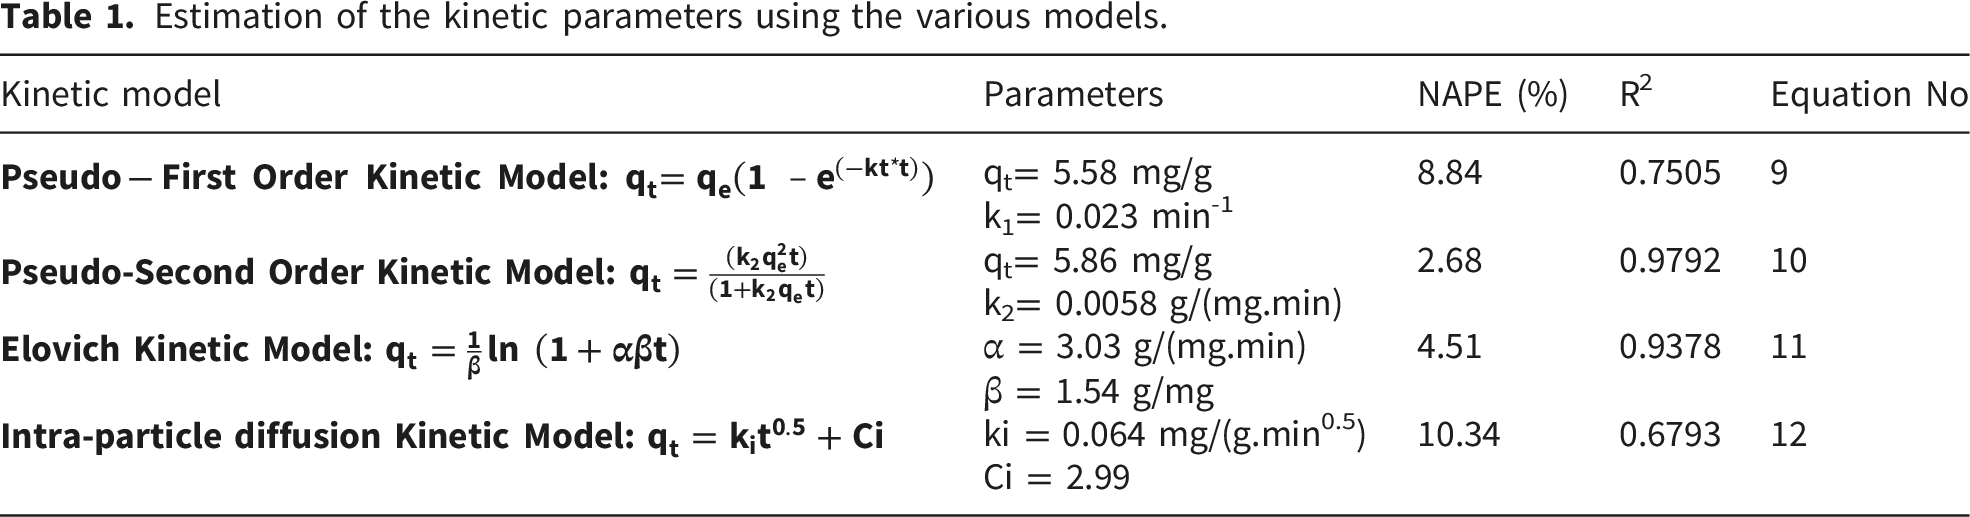
Kinetic analysis examines the rate at which the As(V) is adsorbed onto the AC-IONC. The experimental conditions for the kinetics were as follows: initial Co concentration = 50 ppm, volume of solution = 250 mL, pH = 5, AC-IONC dose = 5 g/L, agitation speed = 150 rpm, and temperature = 25 °C. Adsorption initially proceeded slowly but eventually reached equilibrium within 48 h. The non-linear kinetic plots of model and experimental points of As(V) adsorption on AC-IONC are presented in Figure 13. The kinetic parameters, parameter values, NAPE (%), and R2 are presented in Table 1. The experimental data reveal a characteristically rapid initial adsorption phase within the first 60 min of contact. This swift uptake is primarily attributed to the high density of vacant active sites and the strong interfacial affinity of the functionalized composite for As(V) oxyanions.
65
After the initial stage, the adsorption rate gradually decreases as the surface sites become progressively saturated, eventually reaching a stable equilibrium state at approximately 400 min.
65
The adsorption kinetics were determined using the pseudo-first order (PFO), pseudo-second order (PSO), Elovich (EV), and intra-particle diffusion (IPD) models. Among the evaluated models, the PSO curve shows the best agreement with the experimental trend. The correlation coefficient (R2) was found to be closer to 1 (0.9792). The pseudo-second-order model describes adsorption via electron-sharing between As(V) and AC-IONC. It is based on a chemisorption mechanism, in which the adsorbate species forms chemical bonds with the surface.
18
The rate constant in the pseudo-second-order equation is usually denoted by k2. A larger rate constant indicates a faster reaction rate. Notably, the calculated rate constant (k2) was relatively low, suggesting that the overall attainment of total equilibrium is a somewhat deliberate process, despite the rapid initial phase. The values of adsorption capacity (qt) and the rate constant (k2) were calculated for this model using Kinetic study model fitting. (V=250 ml, T=25 °C, pH=5, Dosage = 5 g/L, Co = 50 ppm at 150 RPM for 48 h).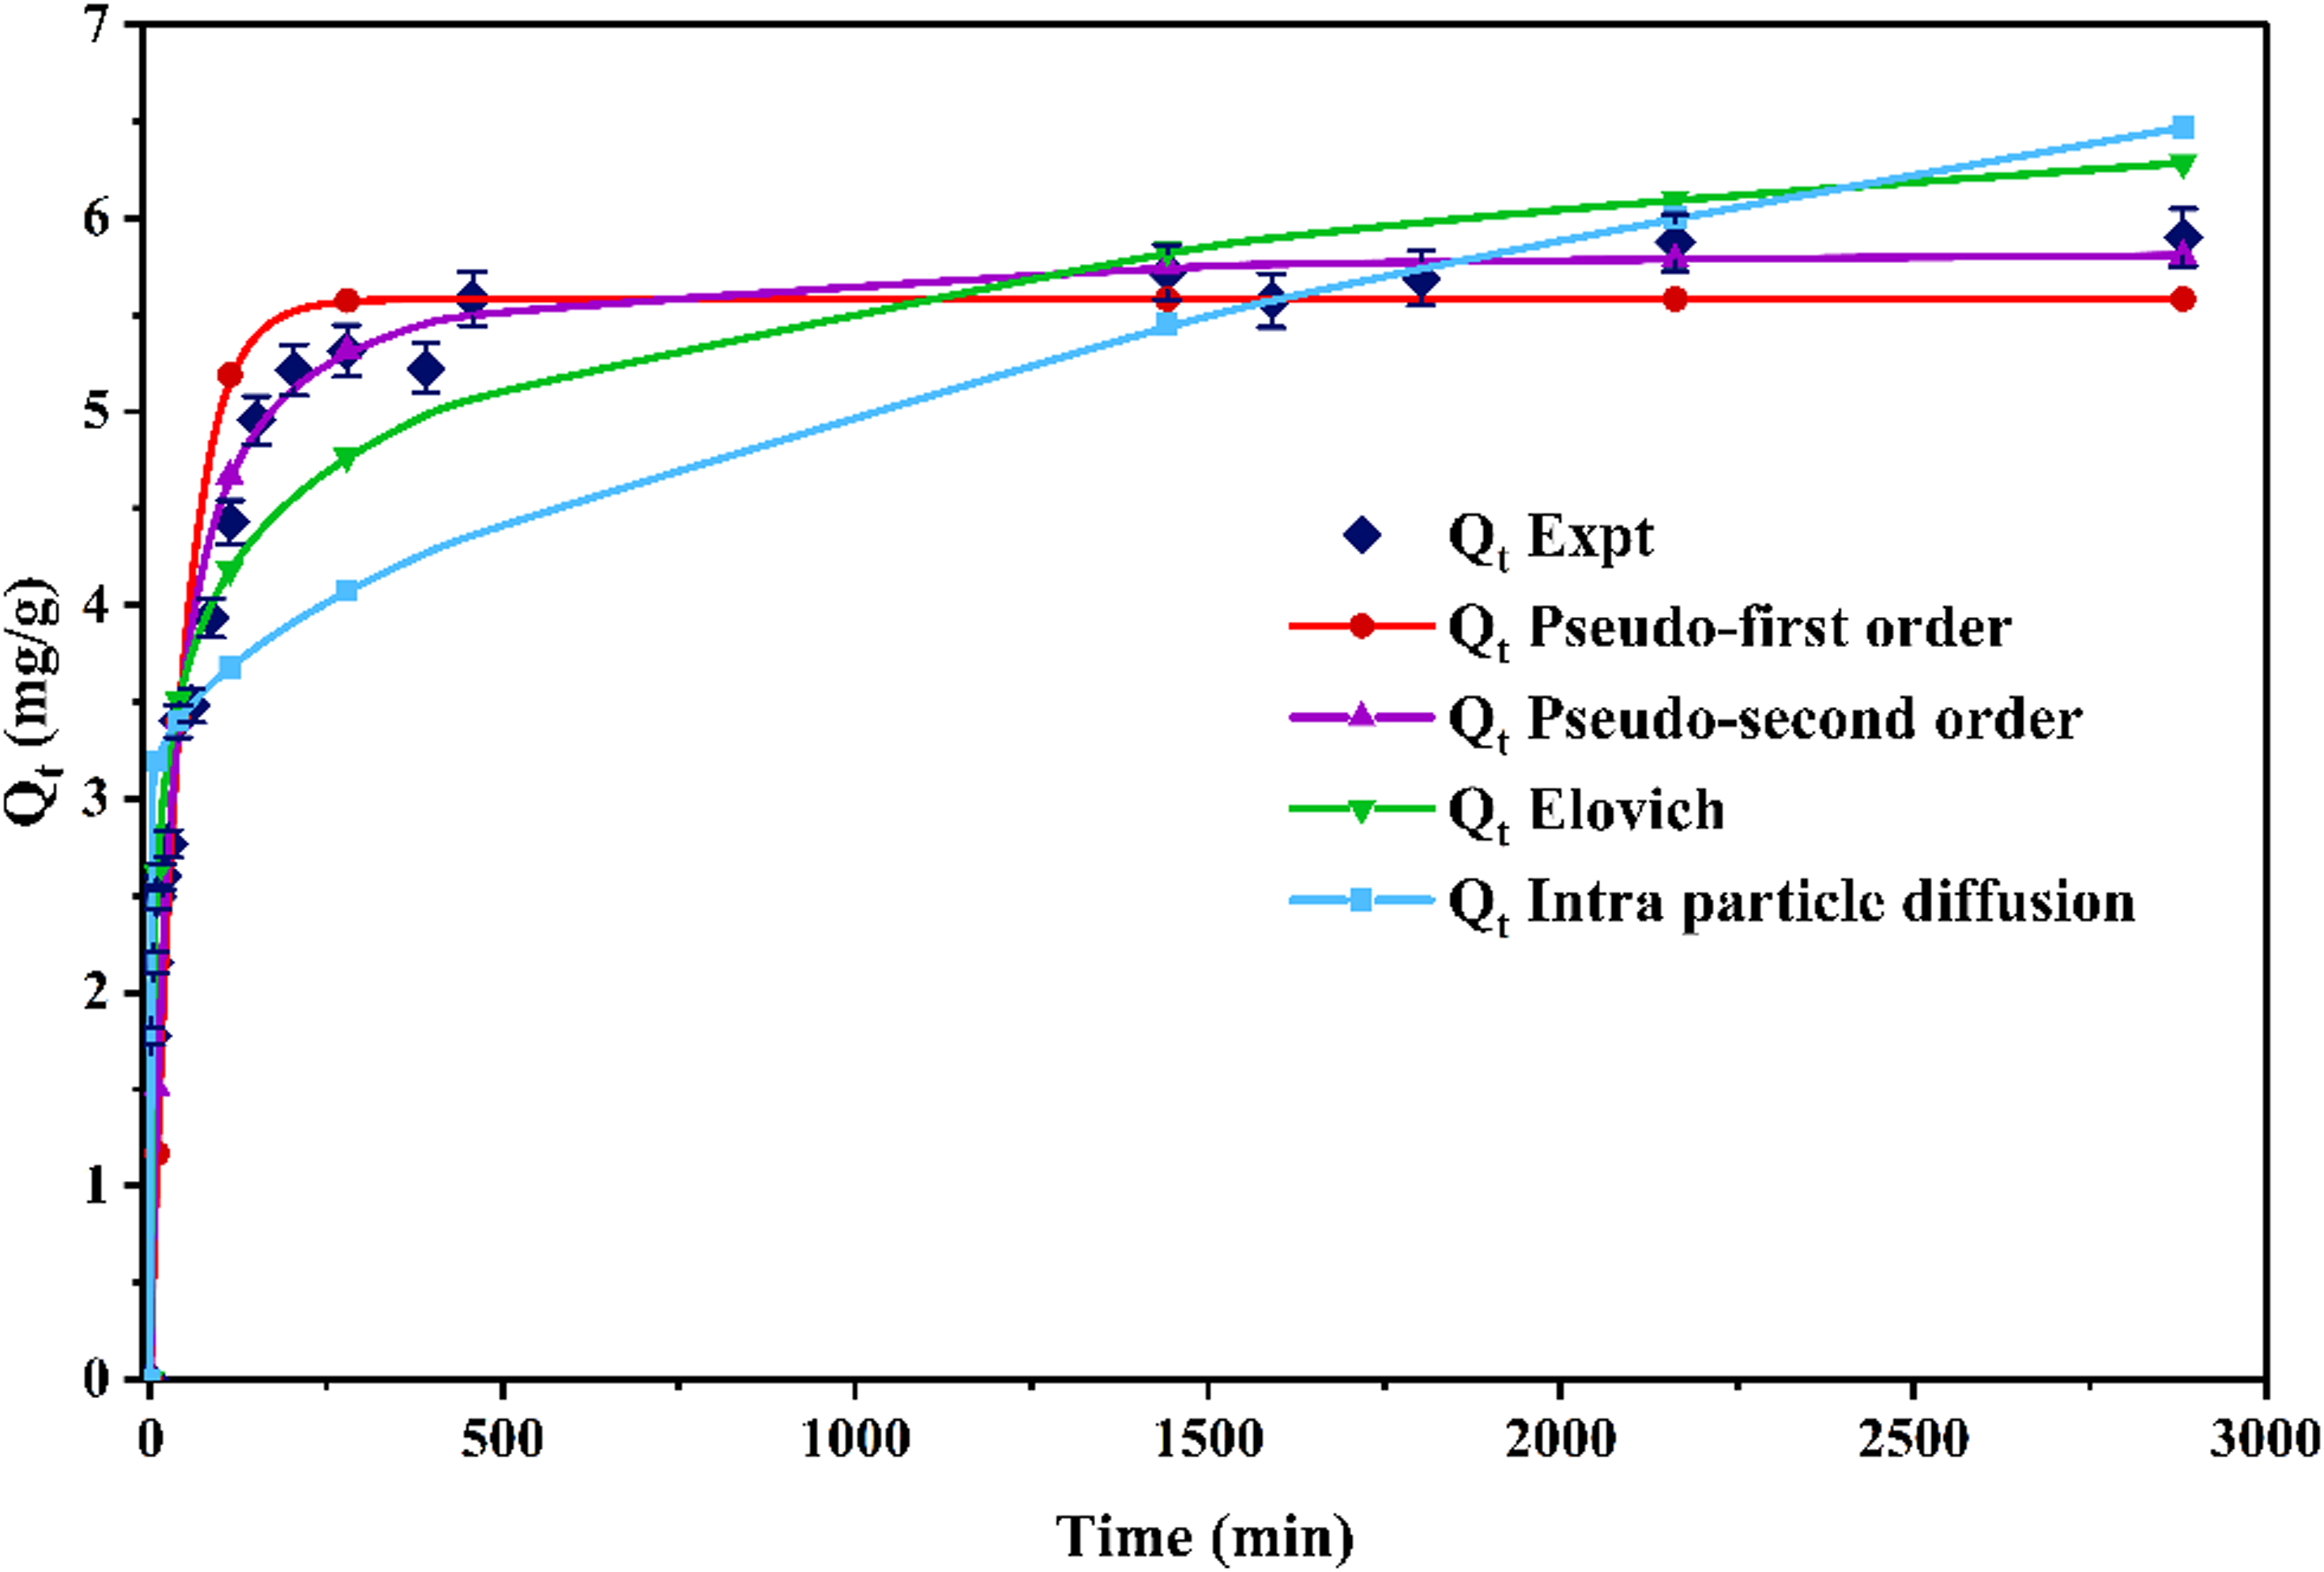
Figure 13 confirmed that the PFO model failed to provide a satisfactory fit. The experimental values compared with the model values reveal that, initially, the two converge, particularly at prolonged contact times, where the model values diverge significantly from the experimental data. The percentage error (NAPE) was found to be 8.84%, and R2 was 0.7505. The calculated values of qt and k1 from
Lastly, the Intraparticle Diffusion (IPD) model clarifies the mass transfer resistance within the system. The constant in the intra-particle diffusion model, parameter Ci, is a measure of the boundary layer thickness surrounding the adsorbent particles. The greater the value of Ci, the thicker the boundary layer, and hence, this suggests that external resistance to mass transfer (film diffusion) plays a more significant role. For the adsorption of As(V) on AC-IONC, the experimental values were compared with those predicted by the IPD model. It was noticed that for the first 60 min, the experimental and model values are nearly identical. After 60 minutes, larger differences between the experimental and model fitting were found resulting in lower fitting (R2 = 0.6793 and NAPE = 10.34%), which were calculated using
3.6.6. Effect of pH on the adsorption kinetics
The influence of solution pH on the adsorption kinetics of As(V) onto the AC-IONC composite was rigorously evaluated, revealing a significant dependency of the removal efficiency and rate parameters on the aqueous environment. Figure 14 presents the variation in pH during kinetic studies of As(V) adsorption on AC-IONC. The experimental data indicate that As(V) sequestration is most robust at acidic pH (pH 3), where a maximum removal efficiency of 81.57% was achieved. This peak performance is characteristically attributed to the favorable surface charge of the adsorbent, which facilitates strong electrostatic attraction between the positively charged AC-IONC surface and the predominantly anionic As(V) species. Furthermore, the acidic environment appears to stabilize the iron-oxide phases by retarding rapid oxidation and surface passivation, thereby maintaining the high density of reactive sites essential for efficient capture. However, the removal efficiency decreased significantly with increasing pH, falling to 58.44% at pH 5 and to 45.47% at pH 7. This performance attenuation is explained by the progressive deprotonation of surface functional groups, leading to a loss of positive charge and a concomitant reduction in electrostatic affinity for arsenate. Furthermore, at pH 7, the presence of H+ and OH- ions creates a neutral solution, in which the adsorption of As(V) is partly inhibited by the increased availability of hydroxide ions, which compete for active sites. The pH increased by 9, and the removal efficiency decreased sharply to 39.72%, a phenomenon driven by severe electrostatic repulsion. In these conditions, the AC-IONC surface and the As(V) oxyanions carry negative charges, creating a repulsion that prevents effective binding.
67
Additionally, the high availability of OH- ions effectively hinders adsorption through direct site competition and increased surface hydration. Interestingly, while the total removal decreased with increasing pH, the pseudo-second-order rate constant (k2) increased gradually. This implies that while the total capacity is suppressed at higher pH, the rate at which the remaining accessible sites are occupied is accelerated. Ultimately, the systematic analysis reinforces the conclusion that acidic environments provide the optimal balance between surface chemistry and site availability for the AC-IONC system.
68
Adsorption kinetics for As(V) adsorption on AC-IONC at different pH. (V = 250 ml, T = 25 °C, pH = 3-9, Dosage = 5 g/L, Co = 50 ppm at 150 RPM for 48 h).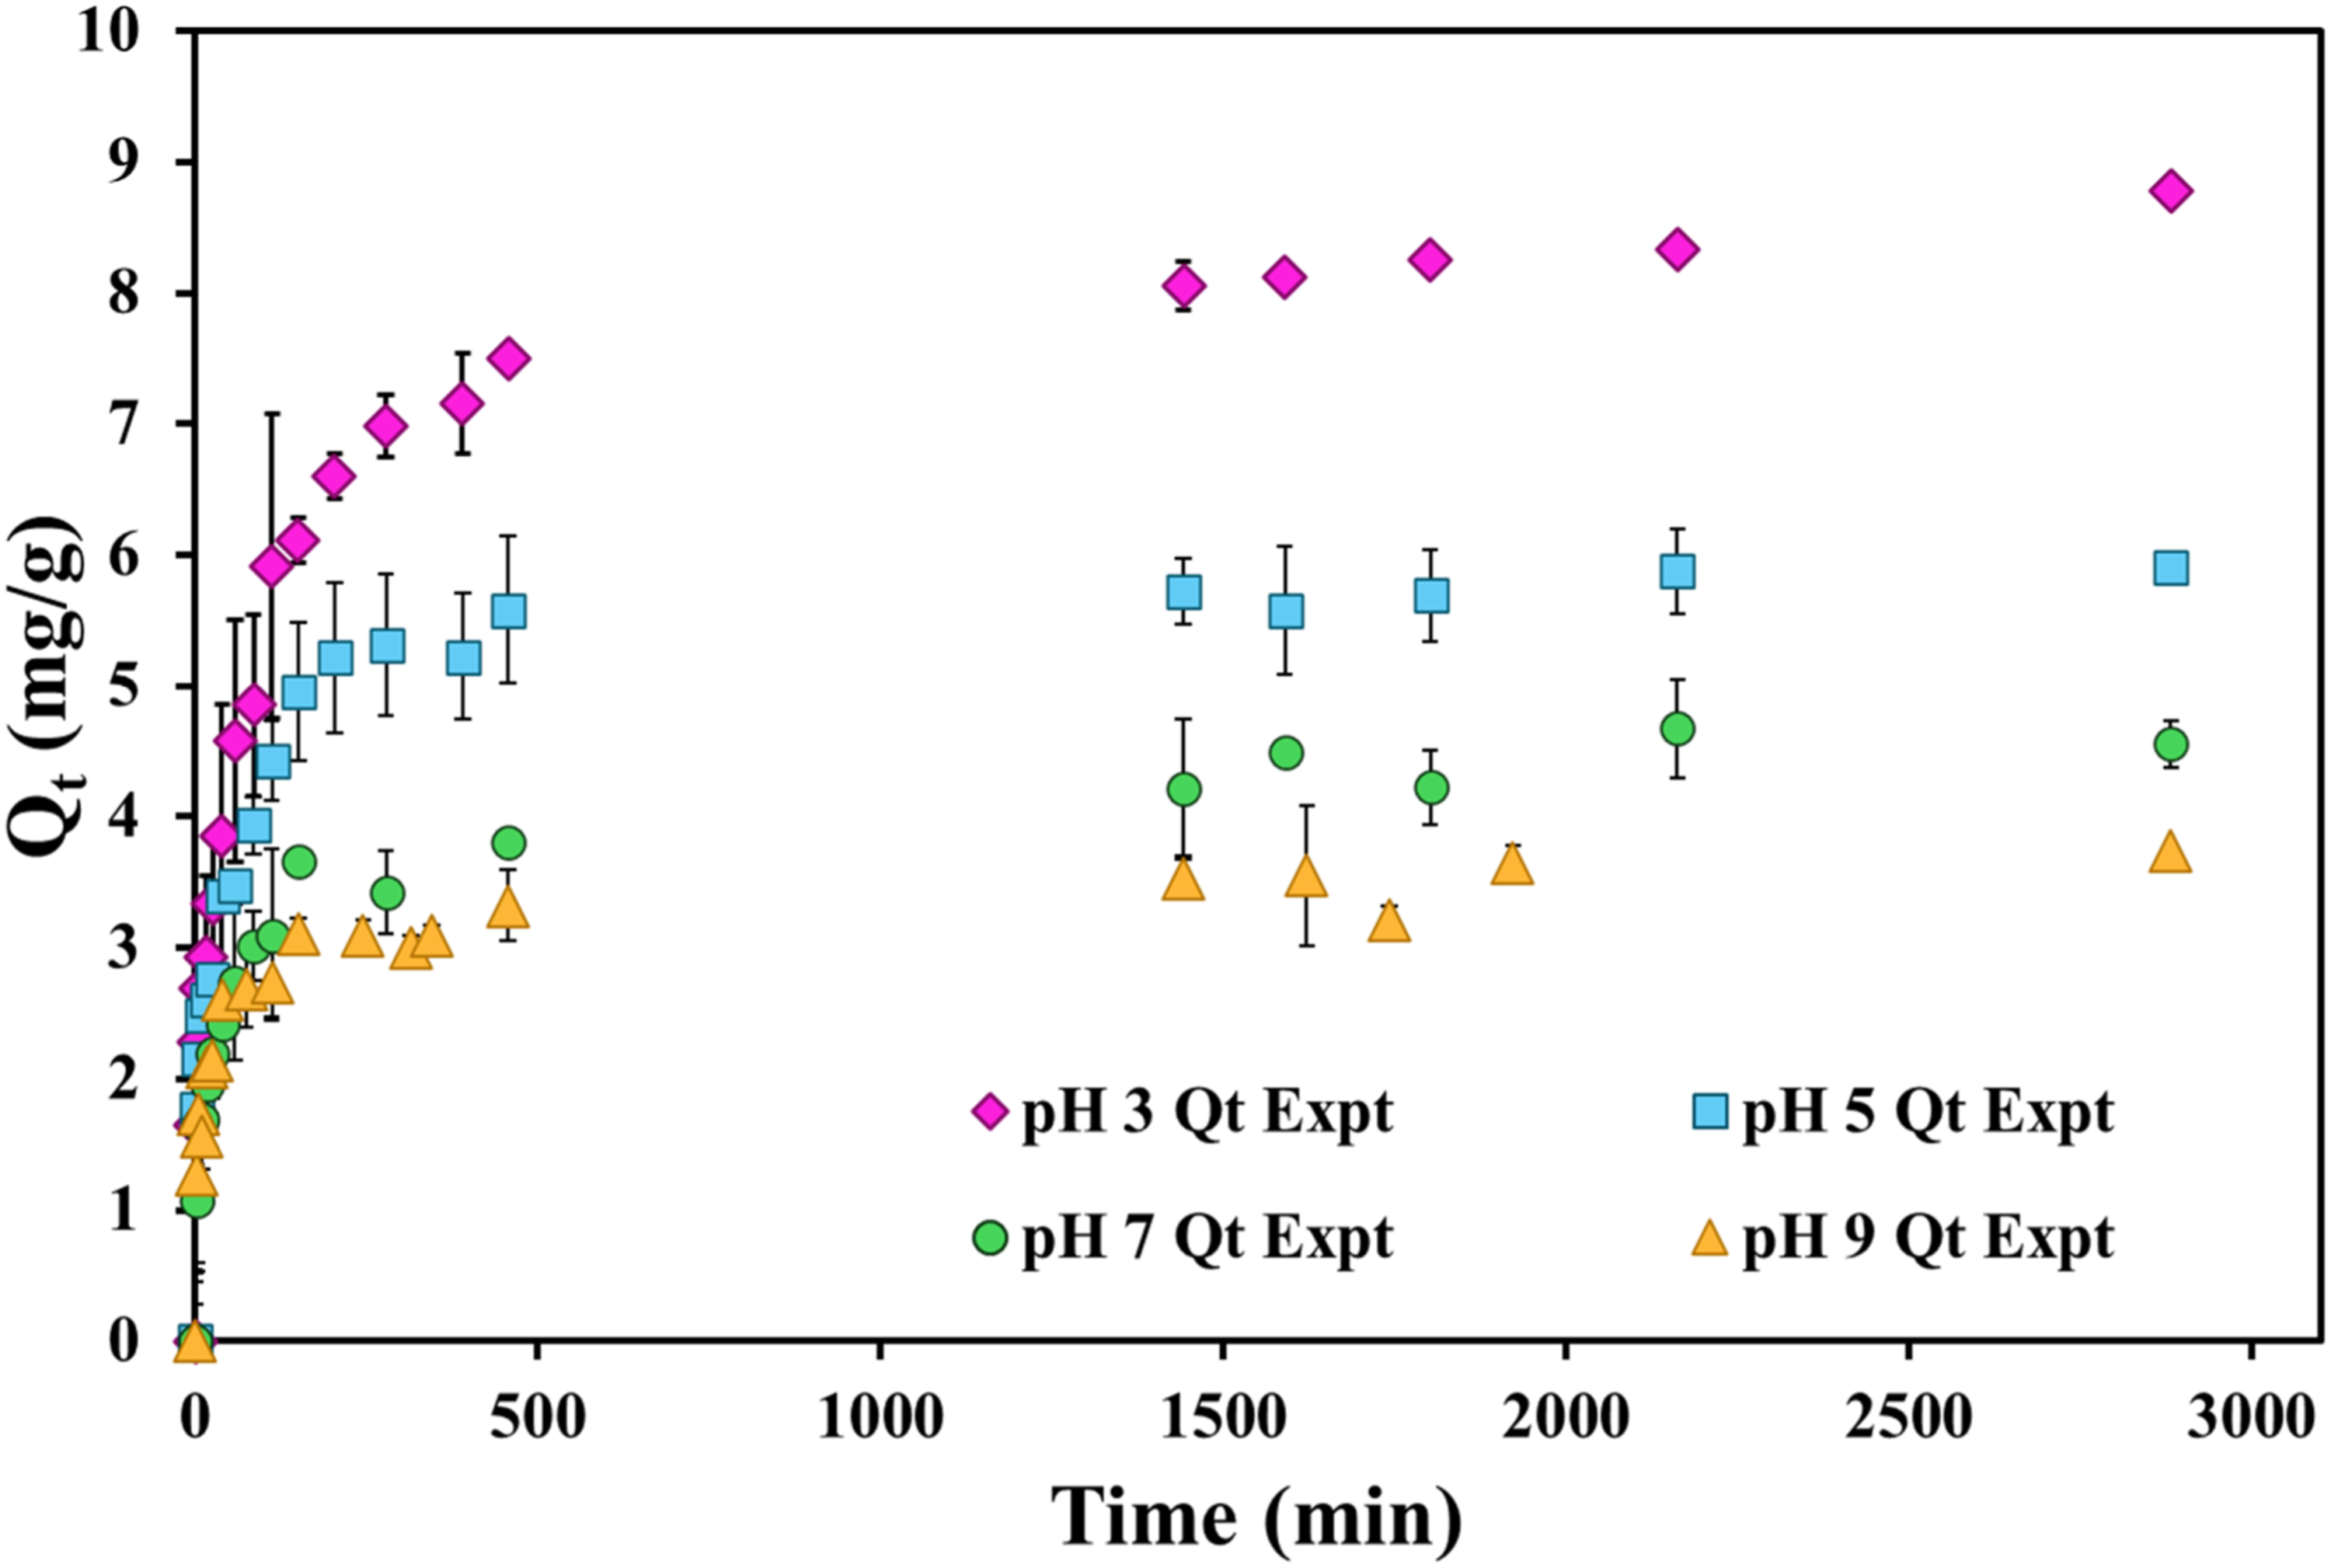
3.6.7. Adsorption isotherm studies
The adsorption isotherm study of As(V) on the AC-IONC composite is shown in Figure 15. The experimental results exhibit a gradual, concave curve at lower equilibrium concentrations, indicating a strong initial affinity between the adsorbent sites and As(V) oxyanions. This behavior is characteristically driven by the abundance of vacant, high-energy active sites in an environment of minimal competition. As the concentration increases from 5 to 100 mg/L, the curve steepens progressively due to the heightened concentration gradient, eventually leveling off into a distinct plateau that represents site saturation and the onset of adsorbate-adsorbate repulsion. Among the tested models, the Langmuir isotherm model essentially overlays the experimental data points with high precision, yielding an R2 of 0.9893 and a remarkably low NAPE of 2.81%. This excellent agreement indicates that As(V) sequestration follows a monolayer adsorption mechanism on a finite number of energetically equivalent sites. Mechanistically, once a surface site is occupied, no further adsorption can occur at that specific location due to the complete occupation of As(V) onto the surface-active site of AC-IONC.
69
That implies once As(V) binds, the site sterically hinders additional molecules and alters local coordination, preventing further attachment at that exact position.
70
The Langmuir model isotherm parameter values were calculated using Isotherm model fits for As(V) adsorption on AC-IONC compared with experimental adsorption data. (V = 25 ml, T=25 °C, pH = 5, Dosage = 5 g/L, Co = 5 - 500 at 150 RPM for 24 hours).
Adsorption occurs as a multilayer adsorption on a heterogeneous surface, confirmed by the Freundlich isotherm model. The values of n (the Freundlich empirical constant) and kf (the Freundlich isotherm constant) were calculated by
Redlich-Peterson isotherm model is an empirical three-parameter model suitable for both homogeneous and heterogeneous systems. Higher kRP values indicate greater potential for the adsorbent to capture the adsorbate, demonstrating a strong affinity between the adsorbent and the adsorbate and leading to high adsorption at low concentrations.
73
The non-linear RP model equation (
3.6.8. Combined adsorption kinetic and equilibrium (CAKE)
The Combined Adsorption Kinetic and Equilibrium (CAKE) equations constitute a new analytical modeling framework.
76
The equilibrium and kinetics concentrations of adsorption systems conducted in batch mode can be predicted using this coupled equation. The equations were obtained by solving the standard kinetic rate equations, specifically the pseudo-first-order equation combined with the Freundlich and Langmuir isotherms. The adsorption reaches a constant value; equilibrium is just a matter of time. For example, the equation automatically provides equilibrium concentrations when a large time (such as 600 min) is entered. The following is the combined kinetic and equilibrium (CAKE), the Langmuir model, and the pseudo-first order kinetic model (Eq. 17).
The above formulas predict adsorption at any given time using the initial concentration Co, the Langmuir constant, and the kinetic constant. From these formulas, the adsorption rate at any initial concentration can be calculated.
76
Figure 16 depicts a 3D surface plot showing the combined adsorption kinetics and equilibrium (CAKE) behaviour for As(V) uptake onto AC-IONC. This plot shows adsorption capacity (Qt, mg/g) as a function of both initial As(V) concentration (Co, mg/L) and contact time (minutes). The adsorption capacity increases rapidly with increasing initial As(V) concentration and contact time, eventually reaching equilibrium conditions.
77
This plot visually illustrates that increased As(V) concentrations and extended contact times increase the amount of As(V) adsorbed until the adsorbent is saturated. Such a combined kinetic-equilibrium plot provides insight into both the removal rate of As(V) and the maximum removal capacity under a wide range of conditions, an approach necessary for optimizing adsorption processes in water treatment applications.
76
Figure 16 confirms that the adsorption rapidly reaches equilibrium at higher concentrations. However, the adsorption affinity constant (Ka) is lower, and the maximum adsorption capacity in the isotherm is reached only at higher concentrations >300 mg/L. The affinity constant depends on the surface properties of the ionic species and the surface properties of the adsorbent.
76
CAKE model simulation of the adsorption of As(V) on AC-IONC.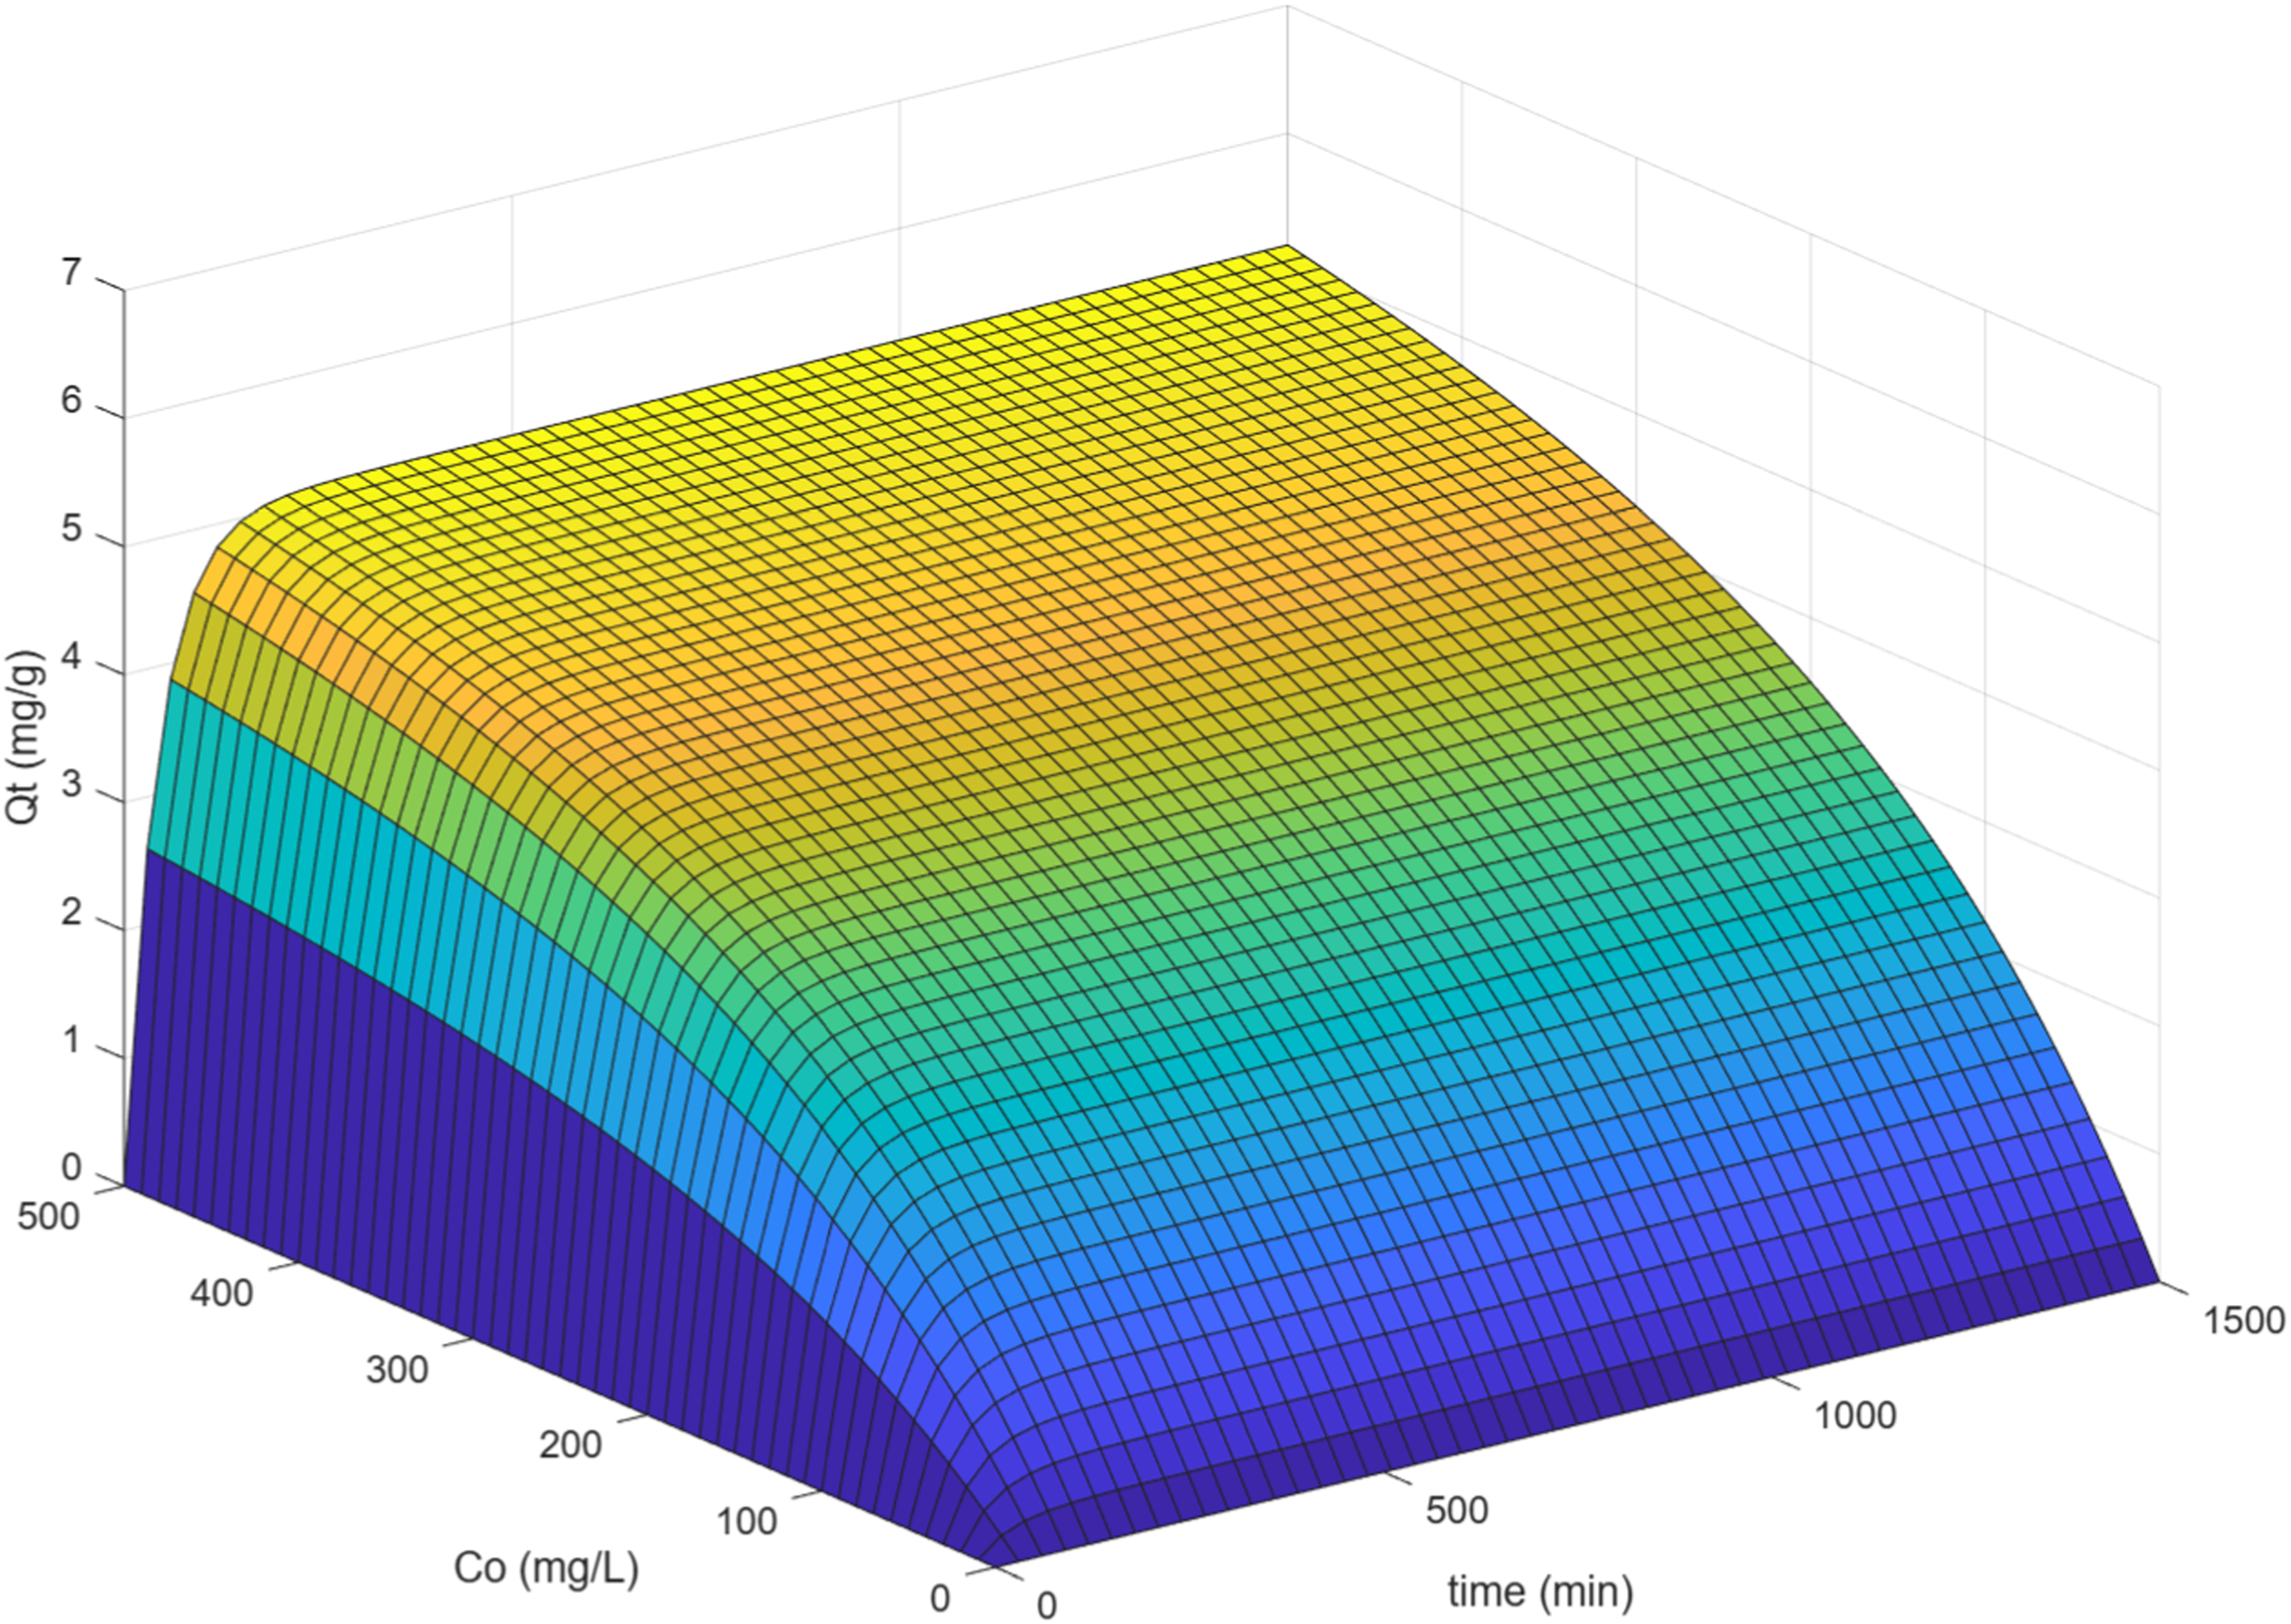
3.6.9. Adsorption mechanism
The adsorption of As(V) on AC-IONC depends on the pH of the As(V) solution. The major adsorption mechanisms of As(V) adsorption on AC-IONC are represented conceptually in Figure 17. The adsorbent (AC-IONC) surface carries positive charges that attract negatively charged arsenate ions via electrostatic interactions or chemical bonding at pH < pHpzc.
78
Pore filling is another adsorption mechanism that occurs when the adsorbent material has a massive surface area and contains micropores, macropores, and mesopores.
79
As(V) species diffuse and occupy the mesopores and/or micropores of the nanocomposite, leading to pore filling and an increase in adsorption capacity.
75
Surface hydroxyl groups, such as Fe-OH on iron oxide, bind As(V) oxyanions specifically, forming strong surface complexes. As(V) directly bonds to surface Fe atoms by displacing hydroxyl groups to form complexes with specific Fe-O-As linkages. This is also known as the ion-exchange reaction in the adsorption mechanism.
80
As(V) oxyanions may form weak hydrogen bonds with surface functional groups. The hydrogen and oxygen present on the arsenate anions form intermolecular hydrogen bonding with the phenolic, carboxylic, and hydroxyl groups on the surface of the AC-IONC. This interaction contributes to overall adsorption and thus represents a secondary interaction that supports other mechanisms.
64
Possible adsorption mechanisms of As(V) on AC-IONC.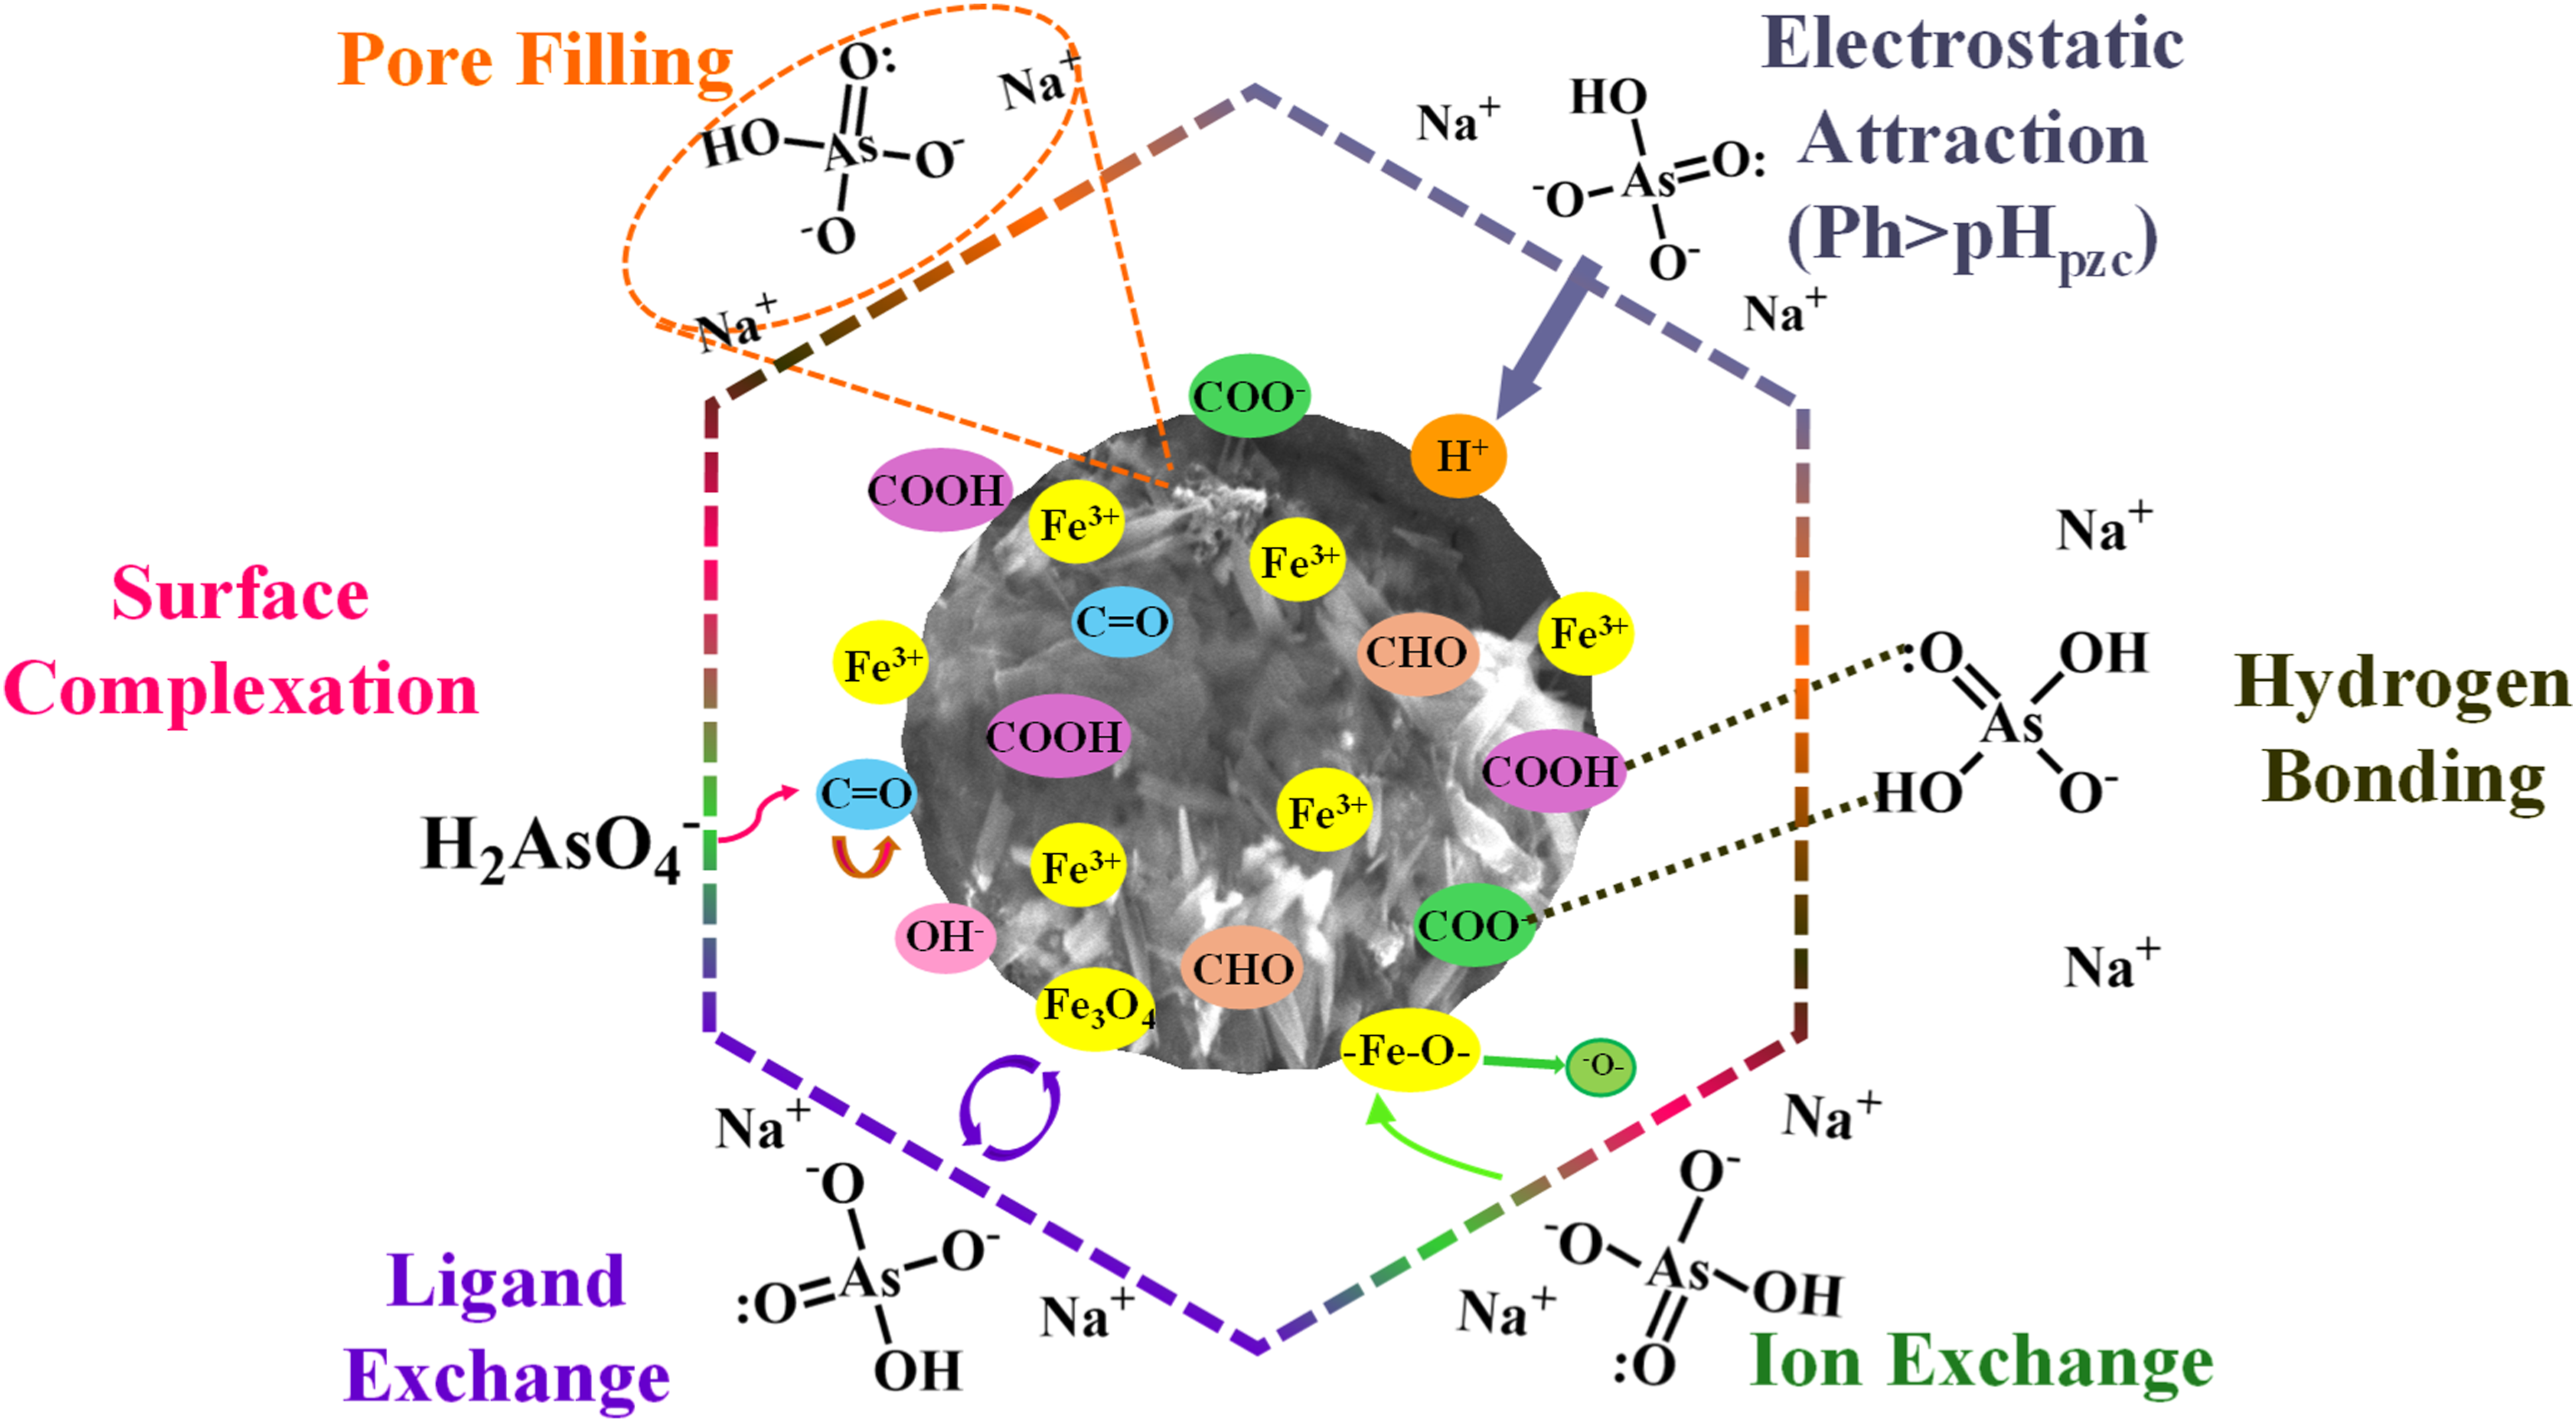
3.6.10. Desorption studies
The desorption characteristics and regeneration potential of the AC-IONC composite were systematically investigated to assess its reusability for As(V) remediation. Initially, adsorption experiments were conducted using a 100 mg/L As(V) solution concentration and a dosage of 5 g/L at pH 5. To identify the most effective desorbing agent, the spent adsorbent was treated with various 1 M desorbing solutions, including acids (H2SO4, HNO3, H3PO4, and HCl), alkaline bases (NaOH, KOH, and NaHCO3), and distilled water. These acids have inherent dipole moments arising from electronegativity differences: HCl (1.08 D), HNO3 (2.17 D, higher due to nitro group), H2SO4 (2.2–2.7 D in solvated forms), H3PO4 (multiple partial dipoles from P-OH bonds). Stronger dipoles (HNO3, HCl) lead to enhanced ion-dipole interactions with polar adsorbent sites during adsorption, influencing desorption.
81
The comparative desorption efficiency of these eluents is illustrated in Figure 18(a), where the residual As(V) concentration was quantified using Atomic Absorption Spectroscopy (AAS). The experimental results indicate that the desorption rate is highly dependent on the eluent’s chemical nature. Notably, HNO3 and HCl exhibited superior performance compared to their basic or neutral counterparts, suggesting that a highly acidic environment is necessary to protonate the adsorbent surface and facilitate the displacement of As(V) oxyanions. Following the desorption experiments, the AC-IONC was washed multiple times to neutralize the surface, and the nanocomposite was dried in a hot-air oven for subsequent adsorption cycles. (a) Percentage adsorption of desorbed adsorbent (first cycle) using various acids, bases, and distilled water, and (b) Regeneration study image of AC-IONC for 3 cycles using 1N HNO3 and 1N HCl: Percentage adsorption vs. number of cycles.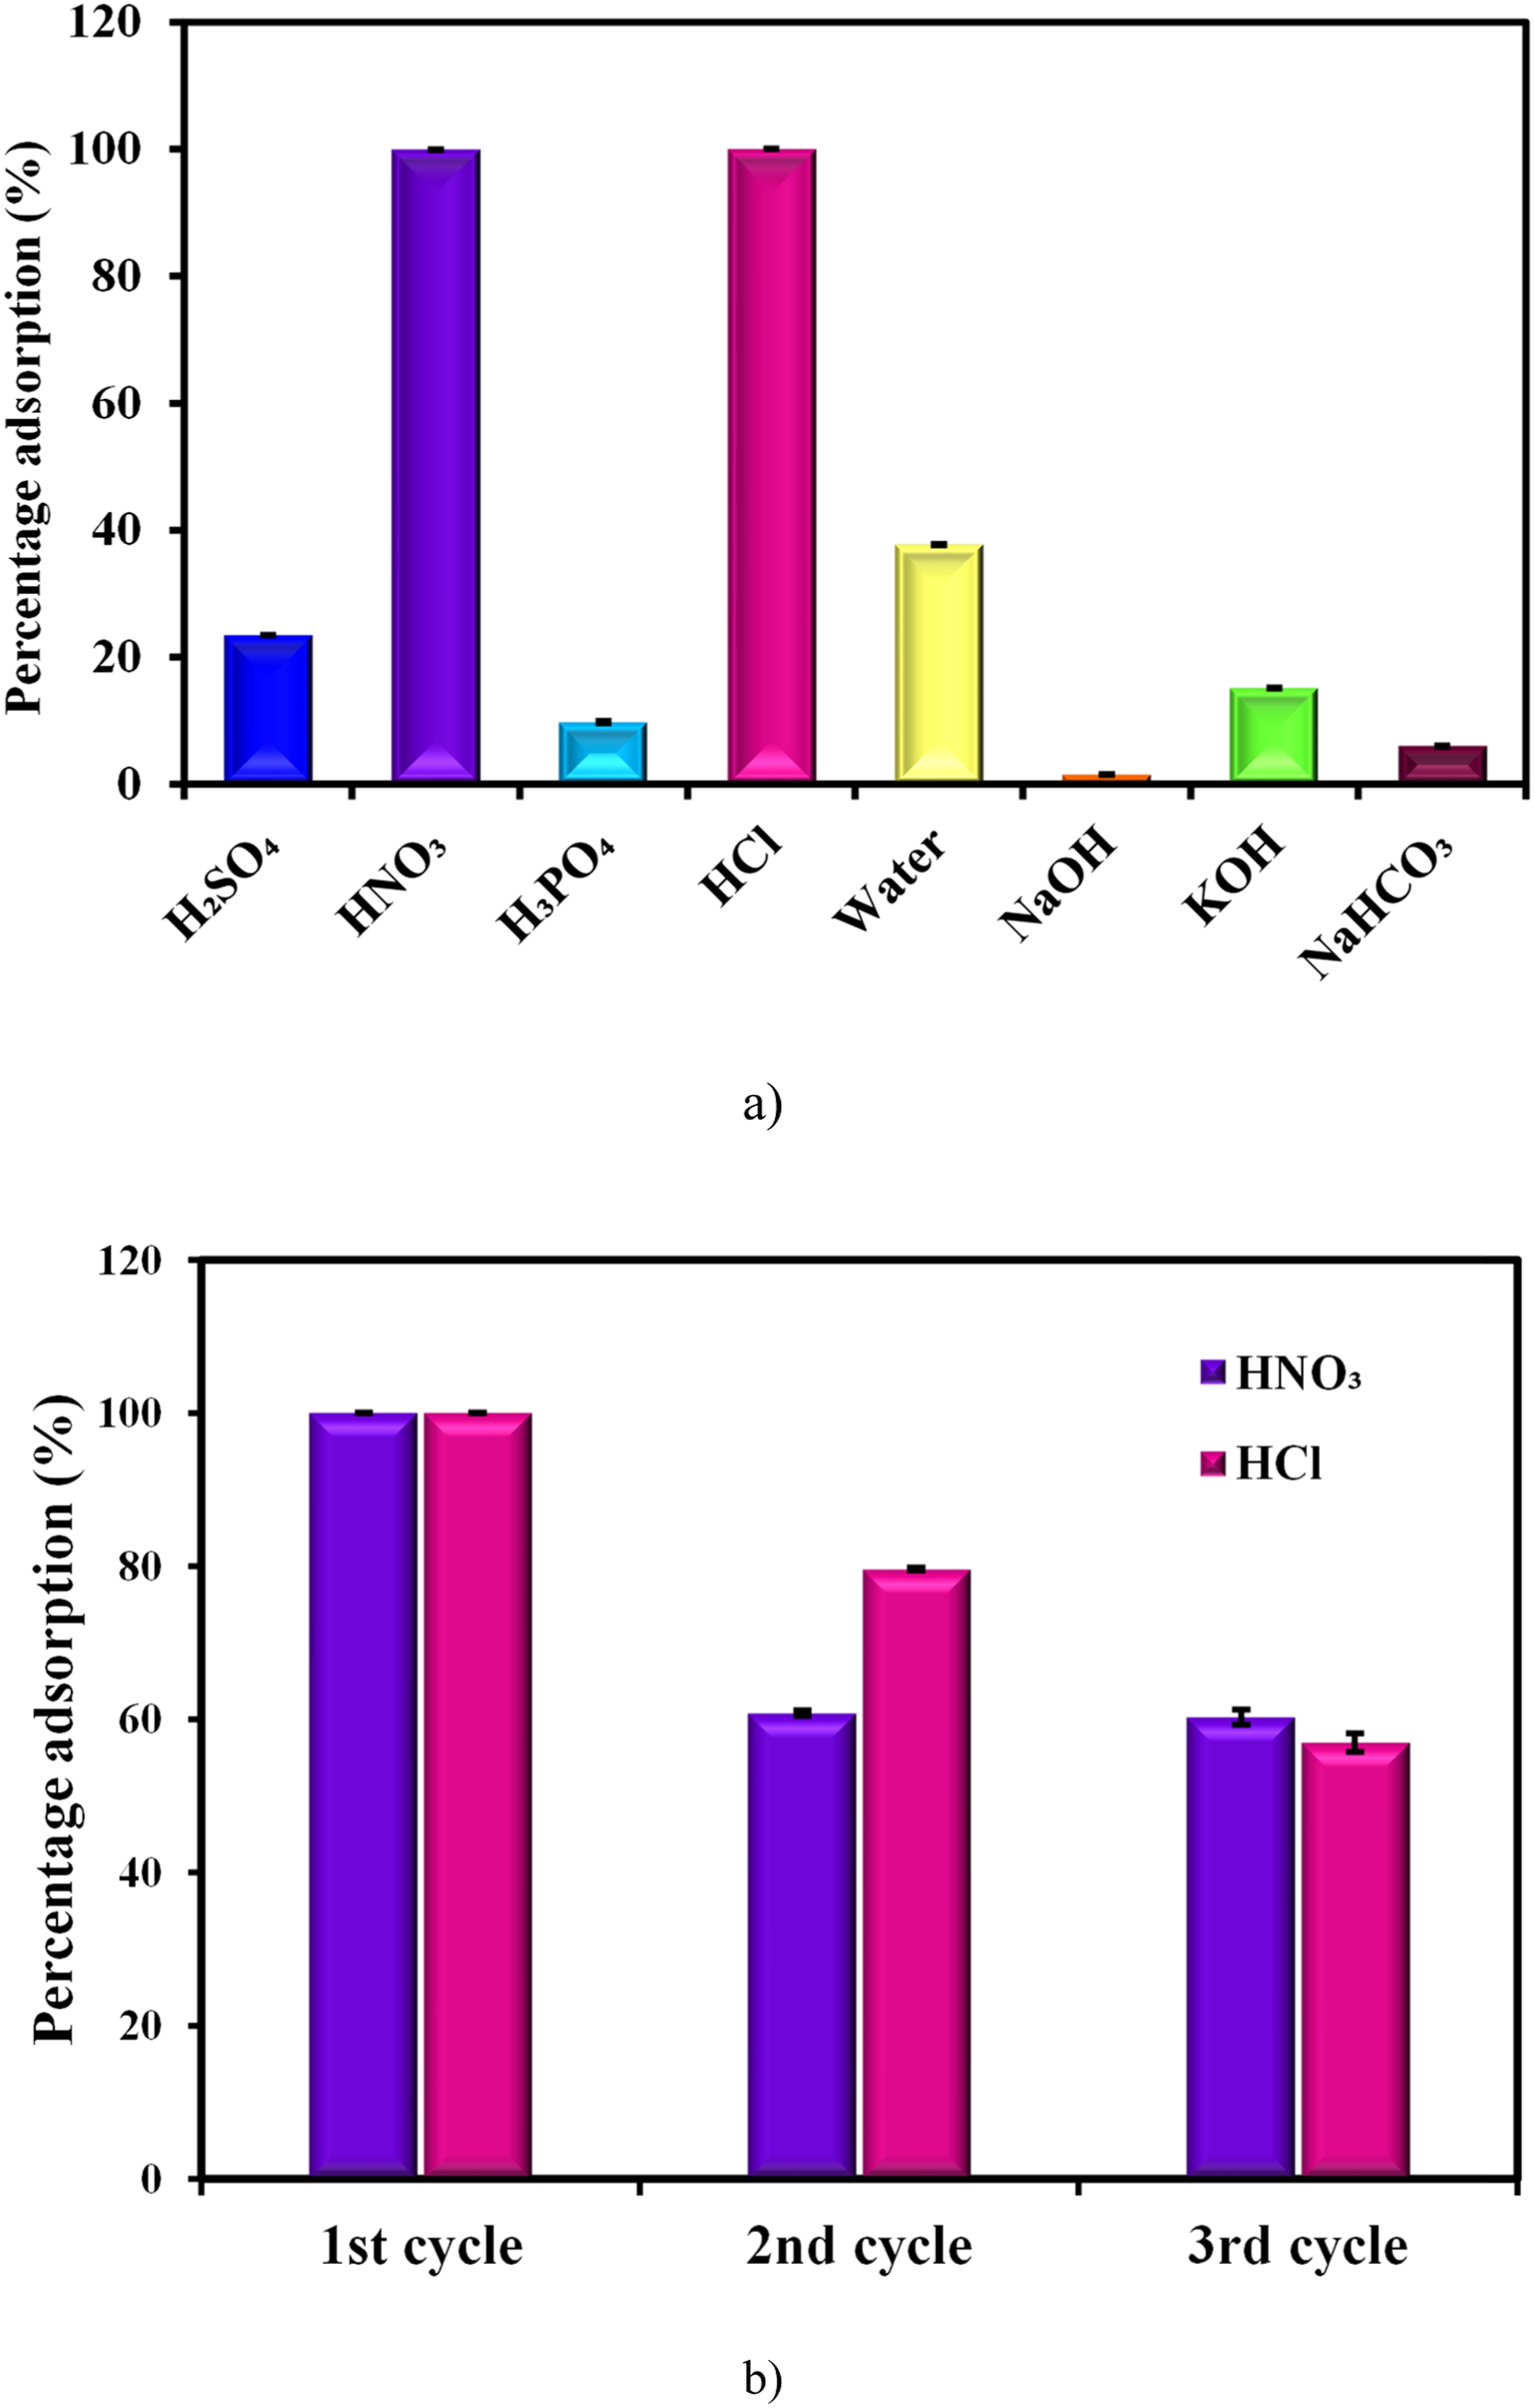
3.6.11. Regeneration studies
The regeneration studies conducted for adsorption-desorption cycles revealed a linear difference between consecutive cycles (Figure 18(b)). The first cycle achieved adsorption cycle showed good adsorption capacity; the second cycle showed a decline, with adsorption percentages plummeting to approximately 60.7% and 79.6% for the HNO3 and HCl systems, respectively. The third cycle showed a further decrease in percentage absorption to 60.2% and 57% for the HNO3 and HCl systems, respectively. The acids may dissolve some of the iron present on the activated carbon, causing reduced adsorption in the next cycles. This is confirmed by the EDS elemental composition of iron, which has reduced from 10.57% to 6.2% after regeneration. Another major reason for the reduction in adsorption percentage in the next consecutive cycles is the reduction in surface area of the regenerated AC-IONC, as mentioned in the earlier section. Surface area was measured after first regeneration and showed approximately 20% reduction in surface area of the regenerated AC-IONC, as shown in Figure 4. Correspondingly, a 20% reduction in adsorption percentage was observed for the regenerated adsorbent, suggesting that surface area is correlated to the adsorption capacity. Additionally, the possible reason for the higher decrease in the adsorption percentage of HNO3 compared to HCl is the formation of a passivation layer on the iron oxide surface, causing a reduction in the number of active sites, which may block the composite surface during the next adsorption cycle. 82 Furthermore, the desorption experiment showed modest results, with approximately a 20% reduction in adsorption capacity from one cycle to the next. This result shows the stability of AC-IONC and moderate reusability across multiple adsorption cycles.
3.6.12. Spiked studies for the investigation of As(V) removal from various ground and surface waters using AC-IONC
The spiked study of As(V) adsorption from different water sources (tap water, well water, river water, lake water, and sea water) is presented in Figure 19. The bar chart comparing adsorption capacity and removal efficiency is shown in Figure 19. The data reveals promising As(V) removal, along with coexisting ions and pollutants, in sea, well, lake, and tap water using AC-IONC. The adsorption capacity and removal efficiency of AC-IONC were tested across different water sources. The adsorption of arsenic for various water sources was as follows: distilled water (4.5 mg/g), tap water (3.37 mg/g), lake water (3.5 mg/g), well water (2.7 mg/g), river water (3.6 mg/g), and sea water (3.12 mg/g). These results suggest that AC-IONC performs better in distilled water samples. This is because there are no other competing ions. Adsorption in various other water sources, such as Lake water, tap water, well water, river water, and seawater, shows decreased adsorption performance due to the presence of coexisting ions. This is due to minerals and other ions hindering the adsorption performance of As(V) on the surface of AC-IONC.
83
When other ions or contaminants are present in the water sources, they also adsorb onto the composite surface along with the As(V). This is the major reason for the decrease in As(V) removal efficiency in the presence of other contaminants in real surface and groundwater samples.
84
Spiked study of As(V) adsorption on AC-IONC using distilled water, tap water, lake water, well water, river water, and seawater.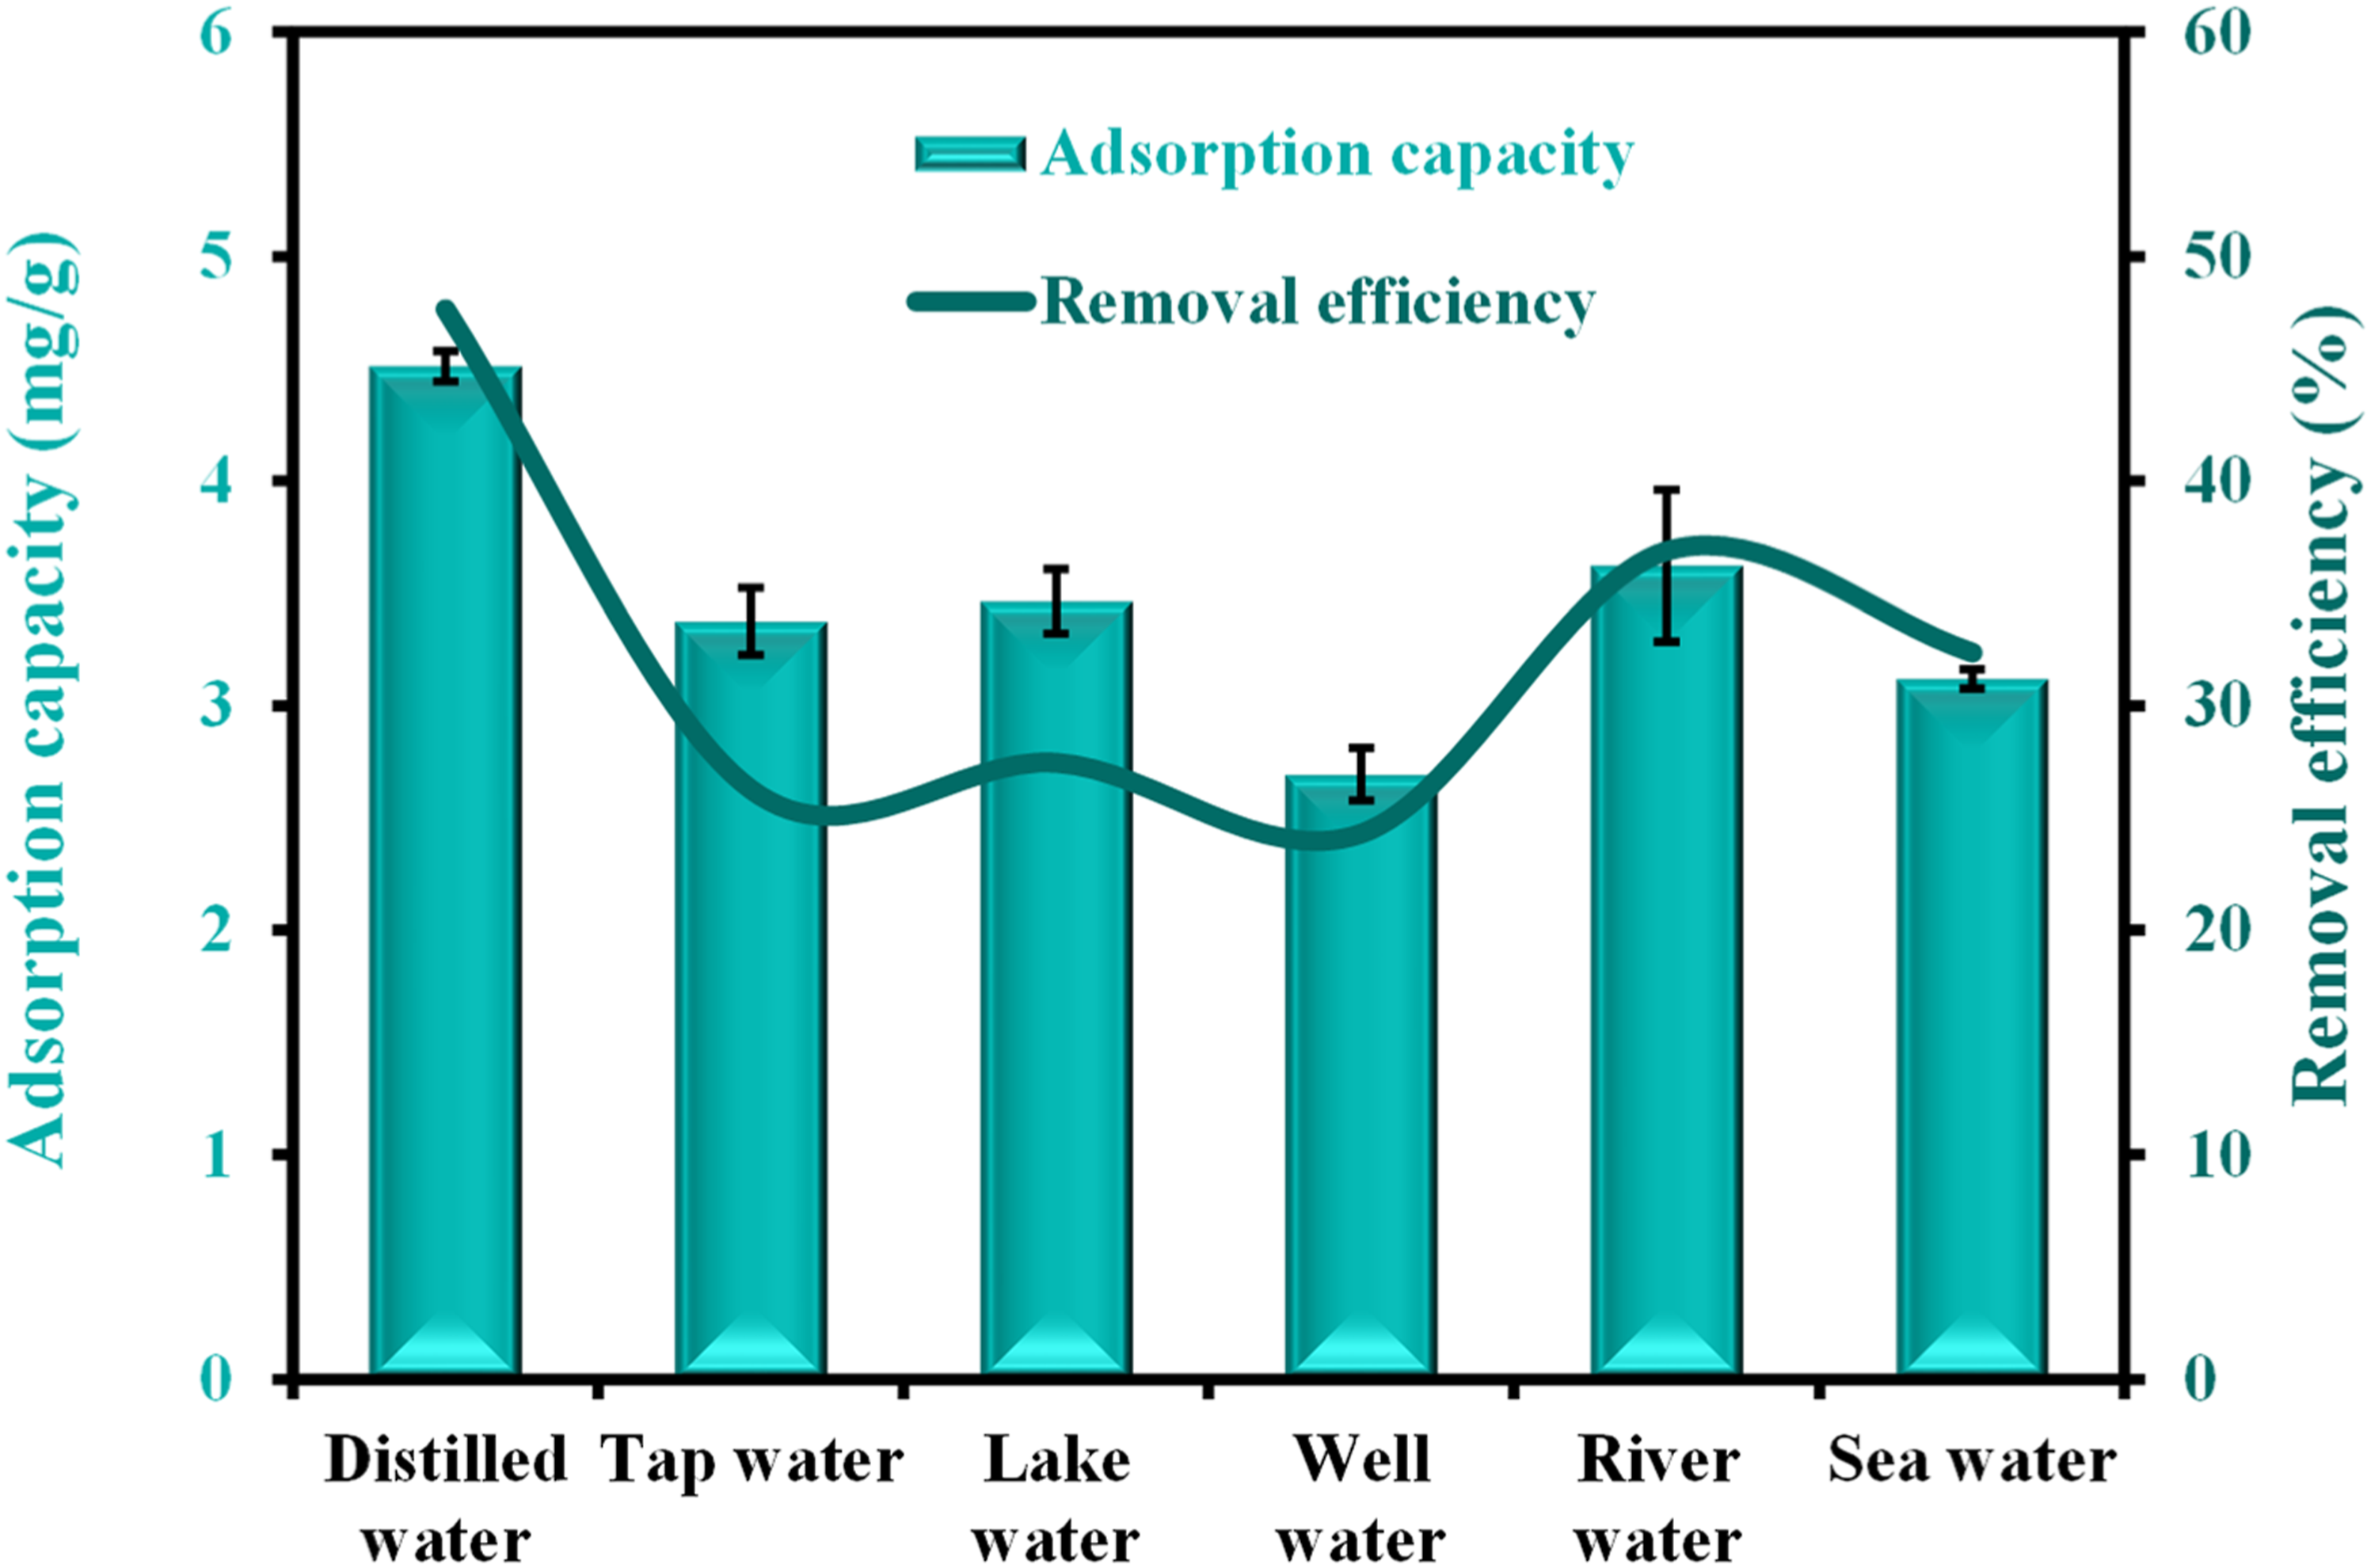
4. Limitations of the study
The present study demonstrates the potential of AC-IONC for As(V) removal, whereas several limitations should be considered before interpreting the results. All adsorption experiments were carried out under controlled batch conditions using synthetic As(V) solutions. The presence of competing anions such as phosphate, silicate, sulphate, and bicarbonate, along with natural organic matter in real groundwater systems, can strongly influence adsorption behaviour, which has not been investigated here. Also, the regeneration efficiency of our AC-IONC is moderate, and the adsorption capacity is reduced by 20% with each cycle. In addition, the adsorption process required relatively long contact times to reach equilibrium, which could limit its application in continuous, high-flow treatment systems. The study also focused exclusively on batch-scale experiments; column studies, long-term operation, and iron leaching behaviour were not evaluated. Addressing these aspects is essential before the material can be reliably translated from laboratory-scale investigations to practical water-treatment applications.
5. Conclusion
This study confirms the effective removal of As(V) from aqueous systems using an activated carbon-iron oxide nanocomposite. The successful incorporation of iron oxide nanoparticles onto the activated carbon matrix resulted in a high surface area (947.97 m2/g) nanocomposite with well-developed porosity, high crystallinity, and abundant surface functional groups, which collectively enhanced As(V) adsorption performance. Furthermore, the batch adsorption experiments demonstrated that As(V) removal was strongly influenced by solution pH, adsorbent dosage, and contact time. Adsorption kinetics followed the pseudo-second-order model, indicating that chemisorption was a prominent mechanism. The equilibrium data were best fit by the Langmuir isotherm, suggesting monolayer adsorption on a homogeneous surface with a maximum adsorption capacity of 8.08 mg/g. The combined adsorption kinetic and equilibrium (CAKE) analysis illustrated the interdependence of adsorption rate and capacity across varying As(V) concentrations. The regeneration studies showed a slight linear decrease in adsorption capacity after repeated desorption cycles, indicating the AC-IONC’s moderate regeneration efficiency over multiple regeneration cycles. A spiked study conducted with real water samples showed a clear reduction in adsorption capacity in the presence of other co-existing ions. In summary, this study presents a facile synthesis method for activated carbon-based nanocomposites with high surface area, strong adsorption capacity, and mechanical stability, which can be used for water filtration to remove As(V). The AC-IONC emerges as a promising adsorbent for As(V) remediation, with potential for application in sustainable water treatment systems.
Footnotes
Ethical considerations
The authors declare that ethical considerations were considered in the preparation of the manuscript.
Consent to participate
The experimental paper does not involve human subjects.
Funding
The authors received no financial support for the research, authorship, and/or publication of this article.
Declaration of conflicting interests
The authors declared no potential conflicts of interest with respect to the research, authorship, and/or publication of this article.
Data Availability Statement
All the data will be available on request.