
Abstract
We evaluate the effect of innovation support programs on output innovation by small and medium enterprises in traditional manufacturing industry. This focus is motivated by a definition of traditional manufacturing industry that includes capacity for innovation, and by evidence of its continued importance in European Union employment. We conducted a survey in seven European Union regions to generate the data needed to estimate pre-published switching models by means of the copula approach, from which we derived treatment effects on a wide range of innovation outputs. We find that for participants the estimated effects of innovation support programs are positive, typically increasing the probability of innovation and of its commercial success by around 15%. Yet, we also find that a greater return on public investment could have been secured by supporting firms chosen at random from the population of innovating traditional sector small and medium enterprises. These findings indicate the effectiveness of innovation support programs while suggesting reform of their selection procedures.
Keywords
Introduction
The broad context of this article is the European Commission’s (2014a) “key priorities for industrial policy” (2). Innovation has now been joined by reindustrialization and a corresponding emphasis on manufacturing industry embracing not only high-tech sectors but also traditional industries, while continuing to “mainstream” small and medium enterprises (SMEs) (European Commission, 2013, 2014a). The particular contribution of this article is to report the first evaluation of the effectiveness of public innovation support programs in the European Union (EU) for SMEs in traditional manufacturing industries. 1 In the absence of best practice evaluation, such public support is of unknown effectiveness, which precludes identification and spreading of best practice (Organisation for Economic Co-operation and Development (OECD), 2007, 11, 27; also 50, 52; see also Lenihan et al., 2007).
In recent years, empirical analysis of the impact of public support on firms’ innovative activities has been mainly concerned with additionality/crowding out. Most empirical studies investigate input additionality, i.e. the effect of subsidies on firms’ R&D expenditure. 2 Our study, in contrast, focuses on output additionality, by which we mean the effect of subsidies on firms’ innovation: product, process, marketing, and organizational innovations (i.e. operational innovations) 3 ; and sales resulting from product and/or process innovations (i.e. innovative sales) (Callejón and García-Quevedo, 2005).
In principle, support may be endogenous to innovation either because firms that are more innovative are more likely to apply for a subsidy (self-selection of firms) and/or firms that are more innovative are more likely to receive a subsidy (government agencies select firms for participation by “cream skimming”) (Curran and Storey, 2002; Merito et al., 2010). 4 This introduces selection bias into program evaluation. To address program endogeneity and consequent selection bias in policy evaluation, various empirical strategies are employed. The major distinction between them lies in the treatment of the unobservable heterogeneity of firms. Matching methods, which are most commonly used, can only control for observables, whereas selection models control for both selection on observables and selection on unobservables (Cerulli and Potì, 2008; Czarnitzki and Lopes Bento, 2013).
We contribute to the literature on the evaluation of innovation support programs. Our focus on output measures of “broad” innovation (as defined in OECD, 2005) by SMEs in traditional manufacturing industries defines successively less populated research areas, together identifying both a gap in the literature and a topic of interest to policy makers at both national and EU levels. Methodologically, we contribute to the evaluation of innovation support not only by using a switching model rather than the more common matching approach as our preferred approach to estimation but also by introducing the copula approach to the estimation of our switching models, which has advantages beginning to be appreciated in the wider evaluation literature. We also contribute to the wider evaluation literature associated with economics by estimating a pre-published model, a procedure that precludes ex post specification search and so helps to validate our findings. A further benefit of pre-publishing our model is that it was developed prior to designing the questionnaire that generated the primary data analyzed in this study. Consequently, questions were included to provide instruments for the anticipated estimation of a switching model to address the endemic problem of selection bias as well as to obtain “quasi-fixed effects” to come as close as possible to controlling for firm-level unobserved effects—other than selection bias—with cross-section data.
In the next section, we provide context on traditional manufacturing industry—characteristics and continued importance—together with background on publicly financed innovation support programs for SMEs. In “Literature review” section, we discuss the existing literature on input and output additionality, although we focus on those studies that investigate output additionality. “The model, estimation, and data” section explains the methodology, model, and the data. “Results and discussion” section discusses the results. “Conclusion: Summary and policy implications” section concludes with policy recommendations.
Context
Traditional manufacturing industry: Definition and enduring importance
Our definition of a traditional manufacturing sector is different from the OECD classification of “high,” “medium-high,” “medium-low,” and “low-tech” industries, which is based on the average R&D intensity of industries. Instead, we adopt a multi-dimensional approach reflecting both measurable characteristics as well as a range of concerns or anxieties. Traditional industries are those manufacturing industries for which the majority of the following characteristics hold. Traditional industries should be “long established,” as traditional implies history. One interpretation would be that the industry should have been established at least during the inter-war years (1918–1939) if not before. This is sufficiently broad to include, e.g., the automotive industry but to exclude, e.g., computing. Traditional industries should once have been a “main source of employment” at the sub-regional level. These industries should be in the “mature or declining phase of their industry life-cycle,” with recent decline typically associated with globalization where the diffusion of knowledge has enabled production to develop in new foreign locations at lower costs. Traditional industries should be “labor intensive,” making it more likely that repetitive, low-skilled, manual work is out-sourced to other countries. In particular, traditional industries should “retain a capacity for innovation,” through which they continue to be important sources of wealth creation and employment. Indeed, it is this characteristic that creates the potential for public policy instruments to promote innovation in traditional manufacturing industries. Traditional industries as identified in this article and the GPrix project include the manufacture of food products and beverages, textiles and textile products, leather and leather products, ceramics and other non-metallic mineral products, mechanical/metallurgy or basic metals and metal working and manufacturing, and automotive (motor vehicles etc.).
Our approach to developing a usable concept of “traditional manufacturing industry” was to remain close to common usage among policy makers while providing greater clarity as to our criteria for inclusion and exclusion, thereby making the concept more precise as a unit of analysis. Accordingly, our definition is close to that of the European Commission’s European Service Innovation Centre (ESIC) (European Commission, 2015). Traditional manufacturing industries can be understood as sectors involved in the processing and production of goods and services that have existed for a long time without much disruption or change. Classical examples of such traditional manufacturing industries are automotive, food and beverage, textiles, consumer goods, chemicals and metal production.
The research reported in this article took place over 27 months—November 2009 to February 2012—and investigated seven EU regions noted for concentrations of traditional manufacturing industry: West Midlands (UK), North Brabant (Netherlands), Saxony-Anhalt (Germany), Emilia-Romagna (Italy), Comunidad Valenciana (Spain), North/Central (Portugal), and Limousin (France). In each of these, traditional manufacturing industries continue to be important in the regional employment structure. Figure 1 shows that upwards of 40% of all manufacturing jobs in these regions are accounted for by these six traditional manufacturing industries.
Employment in traditional industries in the seven regions.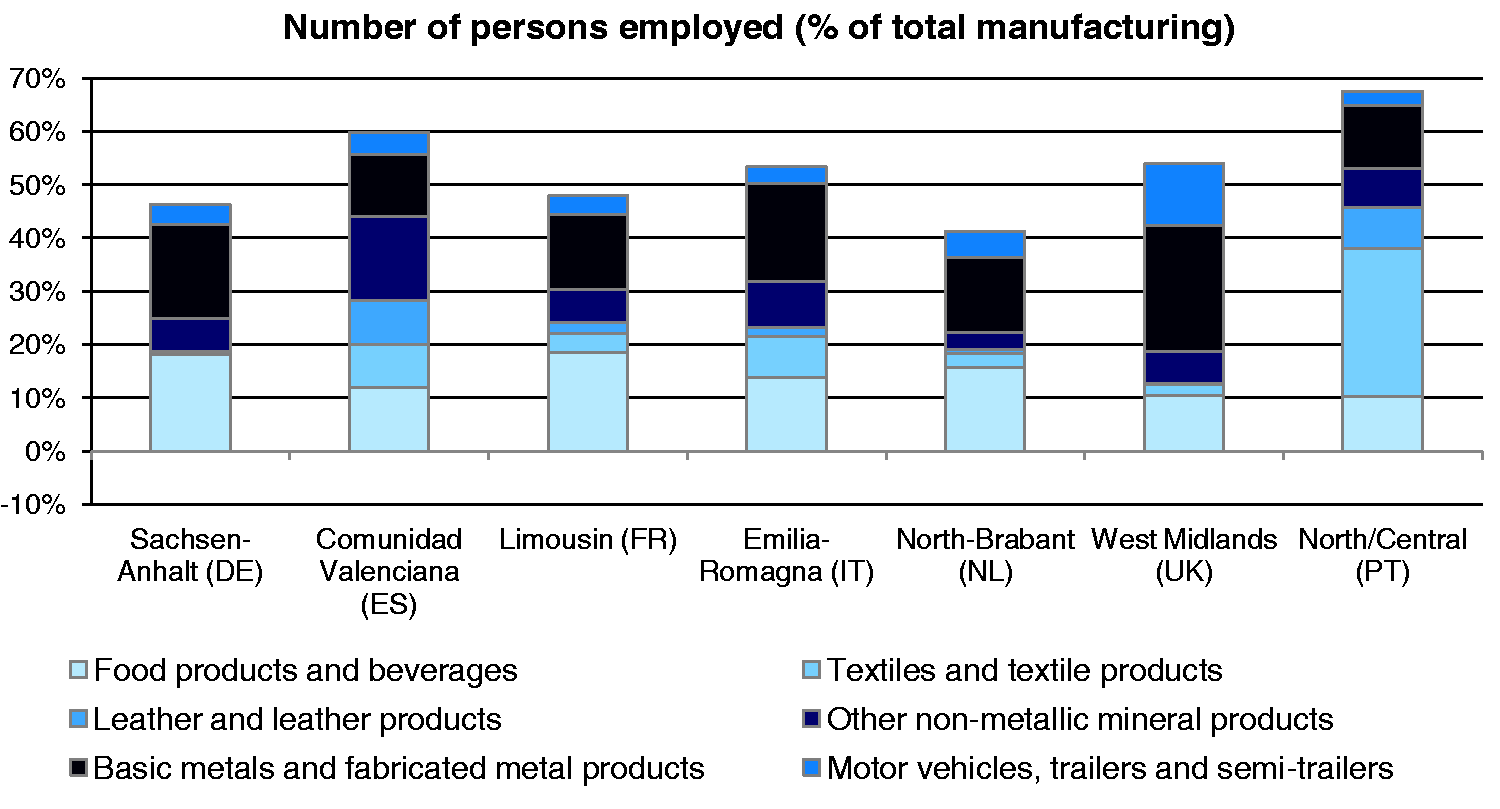
Traditional manufacturing sectors in North Brabant: Traditional characteristics matrix.
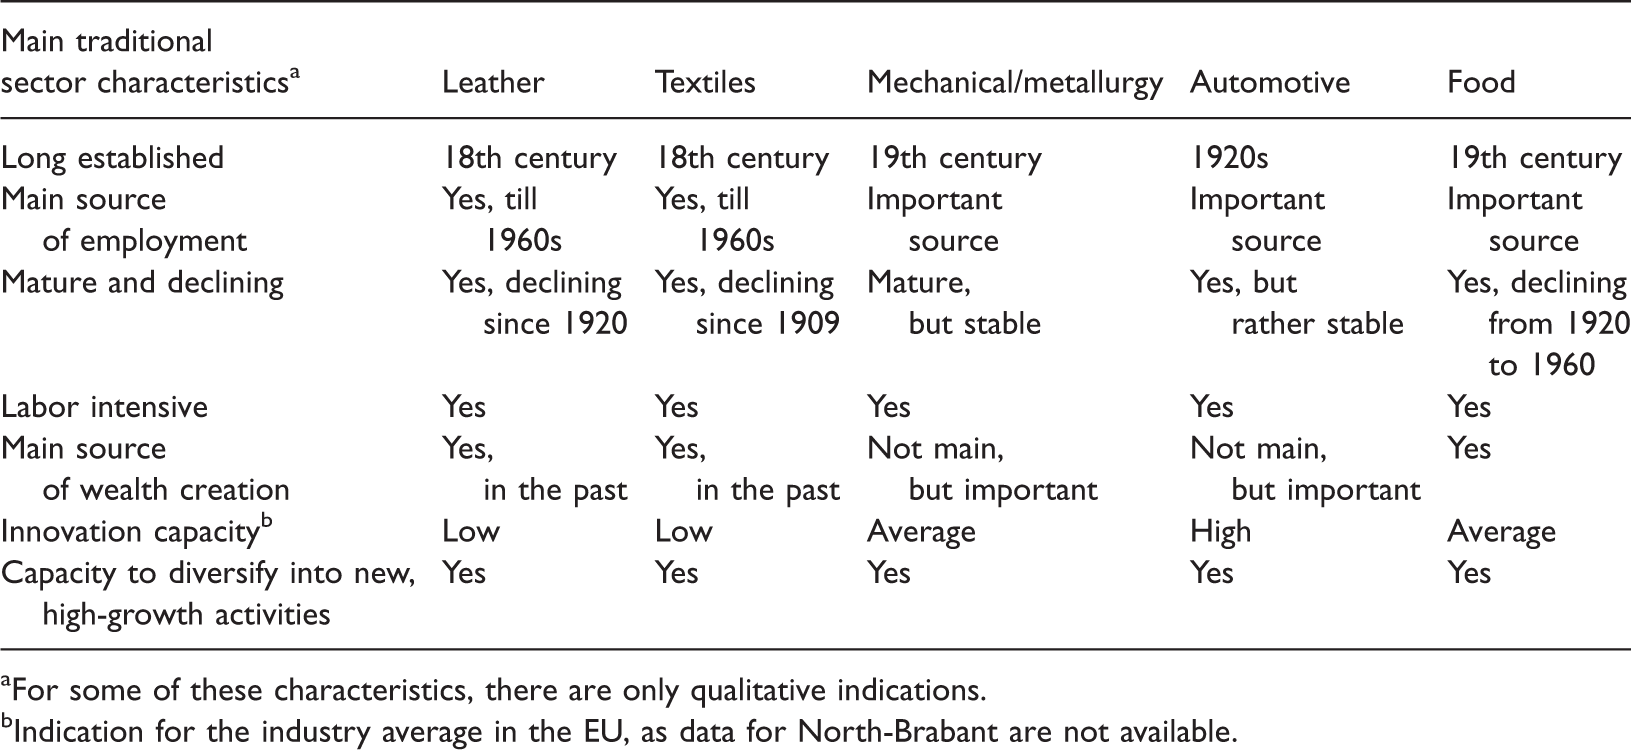
For some of these characteristics, there are only qualitative indications.
Indication for the industry average in the EU, as data for North-Brabant are not available.
Employment in traditional industries in North-Brabant.
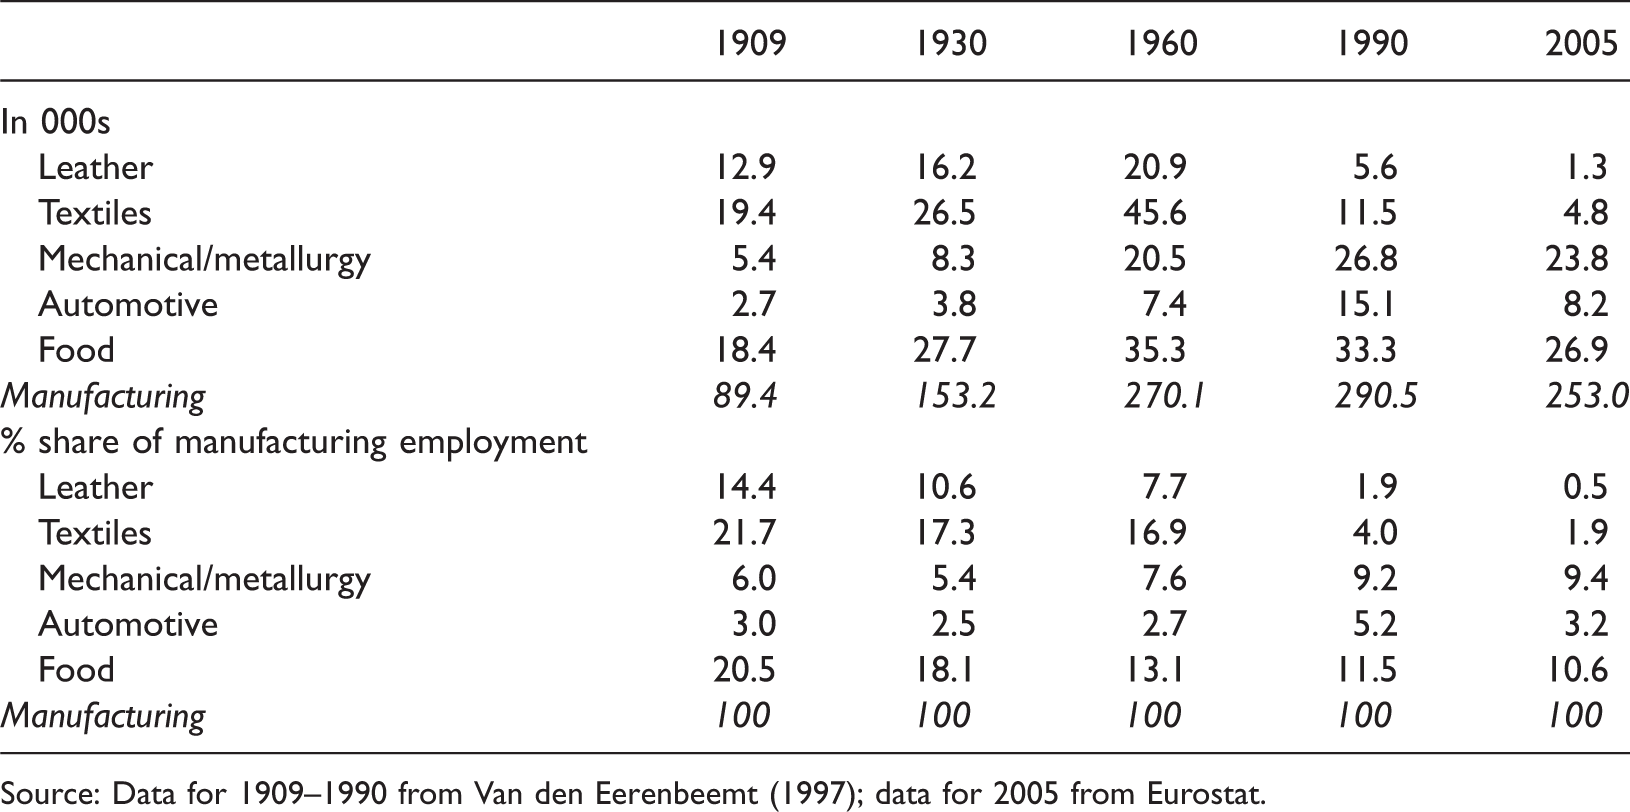
Source: Data for 1909–1990 from Van den Eerenbeemt (1997); data for 2005 from Eurostat.
The importance of traditional manufacturing industry is not confined to these seven regions but is common throughout the EU. Figure 2 charts the change in European regions’ employment share of these six traditional industries from 1995 to 2009. It reveals that in around half of EU regions, the share of these traditional industries in manufacturing employment increased over these 15 years; and that, moreover, in 78 EU regions, the increase exceeded 4.5%.
Change in European regions’ employment share of traditional industries, 1995–2009. The map is created with the Region Map Generator. The groups were identified using hierarchical clustering and Ward’s method. The interpretation of the legend is as follows: a strong decline is any change in the employment share of −10% or less; a decline is any change between −10% and −2%; about the same is any change between −2% and 4.5%; an increase is any change between 4.5% and 11%; and a strong increase is any change of 11% or more.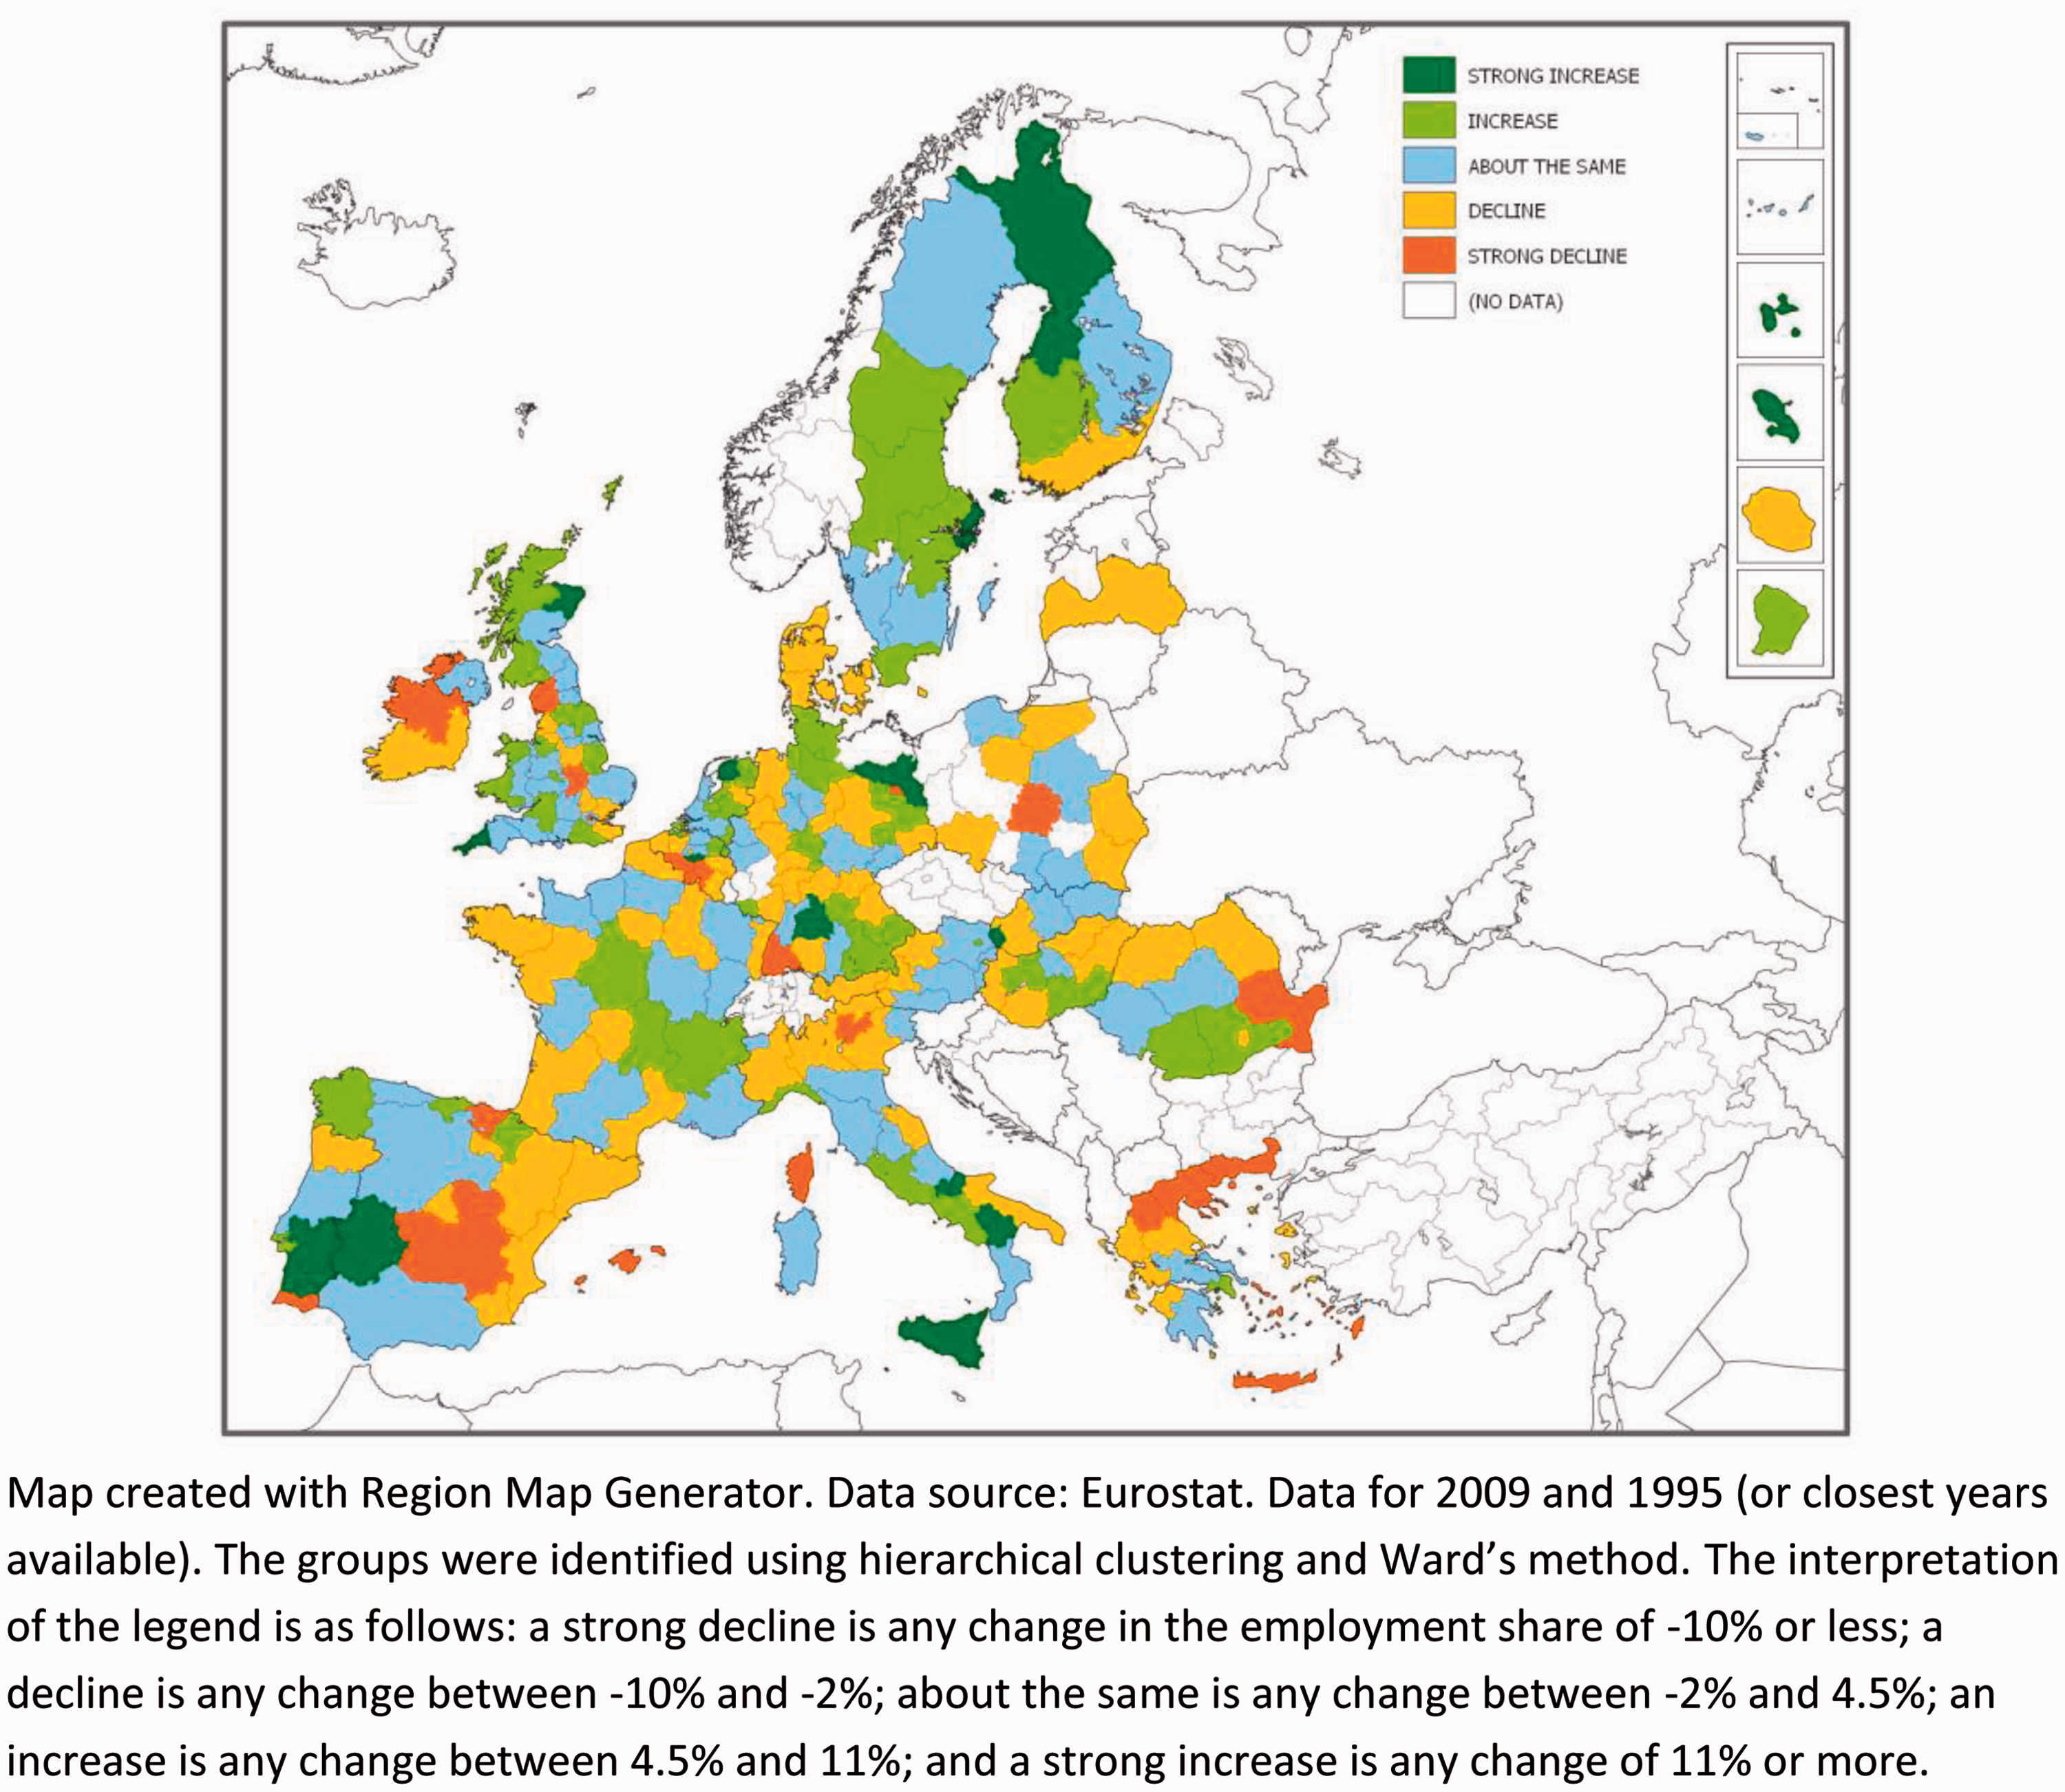
Support for traditional manufacturing SMEs
Throughout the EU, there are around 400 public innovation support programs accessible to SMEs in traditional manufacturing industries, of which 54 in the 7 regions under study have been explained in detail (GPrix, 2010a: 3, 2010c, 2010d). Fewer firms of all sizes in the six traditional industries listed above (6%) receive direct support to finance R&D-based innovation projects than do firms in other manufacturing industries (10%) or services (8%) (GPrix, 2012: 25). In the traditional industries, direct support to finance R&D-based innovation projects is used most in the food and automotive industries (GPrix, 2012).
Firms in traditional industries receive more support than do firms in other manufacturing sectors from the following measures: subsidies and loans for acquiring machinery, equipment or software; support for internationalization, e.g. by providing financial assistance for attending or participating in trade fairs or trade missions; networking with other companies; brokering collaborations—e.g. with outside experts, with universities or with large firms’ supply chains; and providing information on market needs, market conditions, new regulations, etc. All of these are examples of public support consistent with demand-led, customized assistance to help SMEs respond to practical problems and changes in customer demand. Together with innovative public procurement, these types of programs promote SME innovation in traditional manufacturing industries.
Literature Review
Most empirical research deals with R&D subsidies, because public policy was—and largely remains—focused on R&D activities, rather than on innovation in the broader context defined by the Oslo Manual (OECD, 2005). Following García-Quevedo (2004), theoretical consideration of additionality versus crowding-out effects of public subsidies on private innovation suggests that both are plausible (Callejón and García-Quevedo, 2005; Cerulli and Potì, 2012). Namely, provision of public support for innovation activities could induce firms to increase their innovation efforts, which is regarded as additionality (i.e. a complementary effect). In contrast, firms might substitute their private innovation investment with public funding, which is a crowding-out effect. Potential reasons for crowding-out are manifold and associated not only with firms’ behavior but also with government agencies’ functioning. If firms plan to invest in an innovation project without public support, then public support could enable firms to replace private with public funding (Callejón and García-Quevedo, 2005). Regarding public agencies, the selection process could favor innovation projects with high private returns or low risk, as their successful implementation might improve the image of the support program (Callejón and García-Quevedo, 2005; Merito et al., 2010). Finally, asymmetric information between firms and public agencies could result in adverse selection of firms intending to use public funding to finance activities not related to innovation (Merito et al., 2010).
David et al. (2000) provide an extensive review of empirical evidence regarding the effect of public support on innovation and conclude that, although more empirical studies indicate complementarity than substitutability between public and private R&D funding, the overall conclusion is still ambiguous. Lööf and Heshmati (2007) in their review draw the same conclusion. The meta-analysis conducted by García-Quevedo (2004) also does not provide a definite answer; the results indicate very weak evidence of crowding-out. Most individual studies on input additionality reject full crowding out (Aerts and Schmidt, 2008; Almus and Czarnitzki, 2003; Cerulli and Potì, 2008; Czarnitzki and Lopes Bento, 2010, 2013; Callejón and García-Quevedo, 2005; Gonzales and Pazo, 2008; Heijs and Herrera, 2004; Lööf and Heshmati, 2007). Yet, somewhat different results are reported by Busom (2000) for the impact of public subsidies on the R&D intensity of Spanish firms; she finds overall additionality, although for 30% of participating firms a full crowding out effect cannot be rejected. Moreover, Callejón and García-Quevedo (2005) report differential effects of public R&D subsidies in Spanish firms with respect to the technological content of different industries. Empirical evidence from their study indicates that input additionality is more likely to occur in medium-high and medium-low sectors than in high-tech sectors. The authors, based on these results, call for more sector-specific studies, which is consistent with our aim to investigate traditional industries.
Another interesting finding is reported in Cerulli and Potì (2012), who evaluate the impact of a specific R&D policy instrument on innovation input and output in Italian firms. The results suggest that the program is more suitable for large firms, whereas small firms would probably benefit more from targeted programs. However, these results are not directly comparable with our study, as the measure of innovation outcome employed in Cerulli and Potì (2012) is patent applications, unlike the measures utilized in our study (operational innovation and innovative sales). We would add that the low output additionality reported in their study could be partially due to the fact that SMEs, in general, are less inclined to formal protection mechanisms such as patent applications than are large firms (Leiponen and Byma, 2009).
In contrast to the large body of empirical studies on input additionality, few studies investigate output additionality (Clarysse et al., 2009), although the number of studies has grown in recent years (Cunningham et al., 2012). According to Antonioli and Marzucchi (2012), the first issue in evaluating output additionality is how the innovation outputs are defined. In most empirical studies, output additionality is measured as either propensity to patenting or patent counts (see, e.g. Cerulli and Potí, 2012). A few studies use innovative sales as a proxy for innovation output (e.g. Aschhoff, 2009; Cerulli and Potí, 2008; Garcia and Mohnen, 2010; Herrera and Sánchez-Gonzáles, 2012; Hewitt-Dundas and Roper, 2010; Hussinger, 2008; Marzucchi, 2011), the introduction of product innovation (e.g. Hewitt-Dundas and Roper, 2010; Hujer and Radic, 2005) and the introduction of process innovation (e.g. Marzucchi, 2011). Foreman-Peck (2013) measures innovation output as either the introduction of product or process innovation.
Like evaluations focused on input additionality, those investigating output additionality yield heterogeneous results (Merito et al., 2010; for review, see Antonioli and Marzucchi, 2012; Cunningham et al., 2012). 6 In addition, studies investigating the effectiveness of public support programs on measures of innovation and firm performance other than R&D expenditure are scarce (Merito et al., 2010). Most studies report output additionality; see, for instance, Hussinger (2008), Aschhoff (2009), Herrera et al. (2010), Ceruli and Potí (2012), Reinkowski et al. (2010) (but the estimated treatment effect is insignificant for micro firms), Alecke et al. (2012), Herrera and Sánchez-Gonzáles (2012) (output additionality found for small firms, but not for medium-sized firms), and Foreman-Peck (2013). Two studies found insignificant treatment effects, those are Aerts and Czarnitzki (2004) and Cerulli and Potí (2008). Finally, a partial crowding out is reported in Marino and Parrota (2010).
However, whether negative or positive, the program effects are small. Catozzella and Vivarelli (2011) estimate the impact of public support on innovative productivity—the ratio of innovative sales to innovative expenditures—for Italy and report an average treatment on the treated (ATT) effect of −4.95 percentage points. Similarly, Garcia and Mohnen (2010) explore the impact of public support on both product innovation and innovative sales in Austrian firms. Their results vary depending on the source of funding: EU support has no effect; but central government support has a positive effect on both product innovation and innovative sales.
Only one study specifically focuses on output additionality in SMEs. That is the study by Foreman-Peck (2013), who uses the 2004 Community Innovation Survey dataset to investigate the impact of public support on technological innovations in UK SMEs using the Nearest Neighbor matching estimator. The results report a positive and significant treatment effect on SME innovation for both firms receiving R&D tax credits and those supported by non-tax public support. Interestingly, empirical findings suggest a differentiated additionality effect of R&D tax credits: almost 30% in medium-sized firms; only 15% in small firms. For non-tax public support, the results are reversed; the ATT for small firms is twice that for medium-sized firms.
Comparison between public policy evaluations is hampered not only by heterogeneous outcome variables but also by the lack of a common methodology. Best practice evaluation methodology is characterized by the use of a control group or—at least—a comparison group as the platform to address potential endogeneity (García-Quevedo, 2004; Lööf and Heshmati, 2007: 83). To address the ubiquity of selection bias, most studies apply matching estimators (Gonzales and Pazo, 2008; Hussinger, 2008). The drawback of this method is that unobserved heterogeneity among participating firms cannot be controlled for when cross-sectional data are used. This problem is addressed by selection (switching) models (Aakvik et al., 2005), which control for both observed and unobserved heterogeneity (see “Results and discussion” section below).
Choice of method matters
Hujer and Radic (2005) applied a matching approach to evaluate the impact of R&D subsidies on innovation output. The results indicate output additionality for both measures (new products and innovative sales). Yet, once other methods that allow for control of unobservable firm characteristics were applied, the impact of public support becomes negative and crowding out cannot be rejected. Hujer and Radic (2005) and Papa (2012) conclude that neglecting selection bias due to unobservable firm characteristics results in an overestimation of the treatment effect. These findings are consistent with Greene’s (2009) conjecture that evaluation methods controlling for unobservable influences find smaller program effects than do methods controlling only for observable influences. Yet, most evaluation studies have not used estimation methods designed to address unobserved heterogeneity among firms. We explain how we address this issue in the next section.
The model, estimation, and data
Lack of valid instruments to be found in the cross-sectional survey datasets typically available to researchers often precludes the estimation of selection models designed to address selection bias arising from firms’ unobservable characteristics. The present study is likewise limited to cross-sectional data. However, to address endogeneity/selection bias, our questionnaire survey was designed to generate valid instruments for a switching model. By estimating a switching model, we follow the suggestion of Hujer and Radic (2005) that evaluation of public measures should account for both observable and unobservable characteristics.
The model and estimation
This section sets out a parsimonious model for econometric estimation of the innovation effects of program participation on SMEs. One novel feature of this evaluation is that this model was pre-published (GPrix, 2010b: 11–21) not only to inform the design of the survey questionnaire (see below) but also to increase confidence in the validity of subsequent estimates by eliminating the possibility of specification search. Selective reporting of findings by researchers and corresponding bias in empirical literatures constitutes a serious threat to the validity of published research in both medical research (Ioannidis, 2005; De Angelis et al., 2004) and in social science research. Selection among evaluation studies in biomedical research has its counterpart in selection among multivariate econometric estimates from observational (i.e. non-experimental) data in social sciences. In economics, in particular, there are long-established concerns over “selection” among the huge number of findings potentially available to researchers estimating econometric models (Leamer and Leonard, 1983; Sala-i-Martin, 1997; Stanley and Doucouliagos, 2012: 3). In this study, we advance the argument that prepublication of econometric models to be estimated in evaluation studies mimics, albeit in a rudimentary manner, protocols for the pre-registration of clinical trials in medical research. In developing this study, we adopted model pre-publication to demonstrate that our reported findings cannot have been selected by way of search among different model specifications.
This procedure is especially useful in supporting the validity of empirical findings derived from models of innovation output(s), including the evaluation of innovation-support programs. Because theory does not yet support a canonical model specifying the determinants of innovation, thereby constraining specification search, there are manifold opportunities for specification search and selection (i.e. estimating with different sets of independent variables to enable selection of results with the favored sign, significance, and, possibly, size). Accordingly, our empirical strategy was designed to deny ourselves any possibility of specification search. This was accomplished by “pre-publishing” our innovation model to be estimated—i.e. putting our model into the public domain (as an on-line project “deliverable”) before gathering the primary data and conducting econometric analysis. Accordingly, the results reported in this article arise from the pre-published model, which eliminates selection bias and thus helps to validate our findings. 7
In specifying our model, the first problem to address is that there are many potential control variables (Becheikh et al., 2006, identify over 60 determinants of innovation). Accordingly, we propose a strategy for specifying a “parsimonious” model.
We use dummy variables wherever possible to aggregate the effects of the many possible individual effects: Regional dummies for all regional effects and Industry dummies for all industry effects. We use a vector of firm-level “quasi”-fixed effects (or initial conditions) to capture otherwise unobservable firm and ownership effects. Here, we adapt an approach suggested by Blundell et al. (1995); namely, aggregating most time invariant (or, at least, “slow moving”) firm-level and ownership influences on innovation by “including a variable in the regression that approximates the build-up of knowledge of the firm at its point of entry into the sample” (338). According to Blundell et al. (1995), such a proxy for “the ‘permanent’ capacities of companies successfully to commercialise new products and processes” (338) captures the aggregate effect of firm-level time invariant influences on innovation. To replicate this approach, we include a dummy variable derived from the question on the “Firm’s capabilities relative to other firms in their industry with respect to product innovation in 2005” (= 1 for “Above average” and “Leading”; = 0 for “Average” and “Lagging”) together with similarly constructed dummies for process, organizational and marketing innovation. We assumed that firms would be able to infer their capabilities relative to other firms in their industry from their experience of competing on home and/or foreign markets and that their relative capabilities although not fixed over time would nonetheless be “slowly moving.” Unlike actual fixed effects, we cannot be sure of the extent to which such “quasi”-fixed effects will capture otherwise unobservable firm characteristics. Accordingly, we supplement the approach of Blundell et al. (1995) with another dummy variable derived from the question on the firm’s “Resources devoted by the firm to innovation compared to the present” (= 1 if the response was “Fewer”; = 0 if “About the same” or “More”). This question was designed to capture otherwise unobservable attitudes of owner and managers toward innovation, assuming that these would be manifested in differential resource priorities between firms. To anticipate, the latter variable proved to be better specified than did the group of four; this is explained in our discussion of the regression results (below).
Our basic model has two equations: the second equation models the participation decision (the probability that a firm will participate in an innovation support program); and the first equation is an innovation model, which estimates the innovation effect on firms of participating in an innovation support program conditional on both other influences on innovation and the probability of participating in an innovation support program.
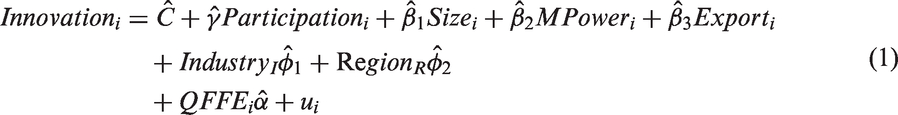
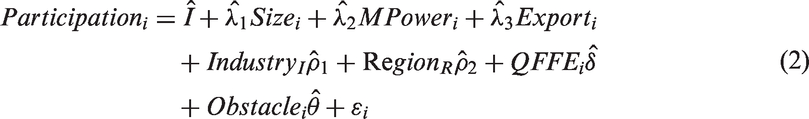
The independent variables must include (for econometric reasons) all the control variables from the outcome equation (1) together with at least one variable to identify equation (2). This identifying variable (Obstacle) must influence the program participation decision but not the innovation decision. For this purpose, the survey included a question related only to program participation. Whereas previous questions related directly to firms’ own, particular innovation behavior, Question 31—the question on program participation—asked firms about SME needs in general: “What are the specific needs for SMEs to enable them to participate in innovation support programs?” In all 18 parts of this question (see Radicic et al., 2014, Appendix B, Table B.1 for details), the corresponding indicator variable was defined as 1 if the response was “Very high importance” or “High importance” and 0 otherwise (“No importance,” “Low importance,” or “Important”).
To reduce the number of potential identifying variables based on Question 31, we applied principal-component analysis with varimax rotation to identify main factors (see Appendix B, Table B.4, which is available at http://www.staffs.ac.uk/research/cabr/working-papers/). Five factors were extracted with eigenvalues greater than one. The first factor mainly consists of SMEs’ external needs; the second comprises administrative needs related to timeliness (short time-to-contract periods and short application-to-funding periods); the third consists of financial needs; the fourth comprises administrative needs related to maximizing the ratio of assistance to bureaucracy (simple application procedure, simple reporting requirements, transparent proposal evaluation procedures, and adequate assistance/guidance during project by program officer); and the fifth factor consists of SMEs’ internal needs. In total, the five factors together capture 63% of the variance of the Question 31 variables.
We constructed equation (1) to test the hypothesis that whether a firm innovates depends on whether the firm participates in a support program. This makes Participation a switching variable: if the firm participates (Participation = 1), then the firm enters a state in which innovation is hypothesized to be more likely (Regime 1); if the firm does not participate (=0), then the firm remains in a state less conducive to innovation (Regime 0). 8
Because the outcome variable, Innovation, can exist in one of two regimes, equation (1) should be estimated over both regimes 1 and 0, in which case Participation disappears as a separately estimated variable. Instead of the single equation (1), we now have two equations, (1a) and (1b), differentiated by an additional subscript: 1 for Regime 1 (all firms that participated in a support program—i.e. Participation = 1); and 0 for Regime 0 (all firms that did not participate in a support program—i.e. Participation = 0).
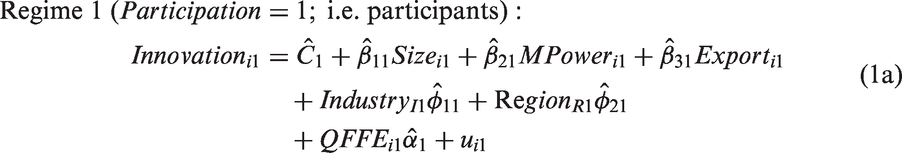
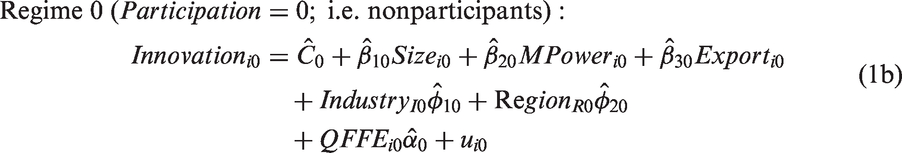
This switching process is endogenous if unobserved influences on Innovation (ui1 in equation (1a) and/or ui0 in equation (1b)) are correlated with unobserved influences on Participation (ɛi in equation (2)). In our three equation model (equations (2), (1a), and (1b)), a bivariate outcome (Innovation) is partitioned into two regimes by a potentially endogenous bivariate switching variable (Participation). The three equations are linked by both common observed variables and, potentially, by common unobserved variables.
The estimated switching probit model measures the effect of program participation “in terms of impact evaluation” (Lokshin and Glinskaya, 2009: 492) by reporting the following statistics:
The effect of the treatment on the treated (TT) statistic “estimates the effect of the program on the entire group of people who participate in it” (Aakvik et al., 2005: 22). The ATT effect is obtained by averaging TT over the subsample of participating firms (Lokshin and Glinskaya, 2009). The average treatment effect on the untreated (ATU) estimates the effect of a program on the firms who did not participate (the control group) (Lokshin and Glinskaya, 2009). The average treatment effect (ATE) is a sample estimate of the effect of program participation on the innovation of a firm randomly selected from the population (Aakvik et al., 2005: 20).
The endogenous switching model (also known as the Roy model or the type 5 tobit model) is often applied in evaluation studies. The original implementation of this model (Aakvik et al., 2005) relies on the strong assumption of joint normality of the error terms. Unfortunately, the violation of the assumption leads to inconsistent estimates. However, at first, approaches to relaxing the assumption of joint normality did not receive much attention in the evaluation literature, because of the expected additional computational burden (Smith, 2003). Accordingly, much of applied evaluation methodology was focused on developing semi-parametric and parametric methods that do not rely on assumed functional forms (Smith, 2003), such as matching estimators. This is one reason why, as noted in our literature review (above), matching is the most frequently applied evaluation method in assessing the effectiveness of R&D and innovation policy. 9
To relax the normality assumption in sample selection models, Smith (2003) applied the copula approach, which allows different types of joint distribution in error terms between the outcome and the selection equations (Hasebe, 2013). Besides this, another advantage is that the copula method allows the model to be estimated via the maximum likelihood method, which means that the estimates are efficient (Hasebe, 2013). A copula represents a joint distribution function that binds together marginal distributions of the error terms in the selection and the outcome equations, although the copula itself is independent of marginal distributions (Smith, 2003). In our analysis, we have considered a range of copulas: Gaussian, Frank, Plackett, Clayton, AMH, FGM, Joe, and Gumbel (for a detailed discussion, see Smith, 2003; Trivedi and Zimmer, 2005; Hasebe, 2013). In each of the estimated models reported below, the preferred copula was determined using the Vuong test together with the Akaike information criterion (AIC) and Bayesian information criterion (BIC). The former evaluates the contribution of each copula to the log likelihood, such that the copula with the highest contribution is preferred (Hasebe, 2013). In addition, the smallest AIC or BIC suggests the preferred copula (Hasebe, 2013; Smith, 2003).
Data
Our population of interest is SMEs in traditional manufacturing industries. Resources dictated sampling from seven EU regions characterized by high employment shares in six traditional industries (see “Context” section above). The sample includes 312 SMEs, comprising 145 participating and 167 non-participating firms. 10 Data were gathered in 2010 and cover the period from 2005 to 2009. Detailed descriptive statistics on the survey sample are presented in Appendix B, Tables B.1, B.2, and B.3, which are reported and discussed in Radicic et al. (2014); also at http://www.staffs.ac.uk/research/cabr/working-papers/. The survey sample has the desired characteristics; namely, a good balance between participants and non-participants; and similarity between participants and non-participants with respect to demographic and market characteristics. (Formal balancing tests confirmed that most variables are balanced even before matching; these are available on request.)
To investigate whether there are extreme differences in the innovation behavior of firms between either the regions or the industries appearing in our dataset, we conducted one-way analysis of variance (ANOVA) on each of the aggregate categories of operational innovation investigated in our econometric analysis.
Tests of differences in mean percentages of firms undertaking different types of innovation (1) between regions and (2) between industries: p-values from one-way ANOVA model F-tests.
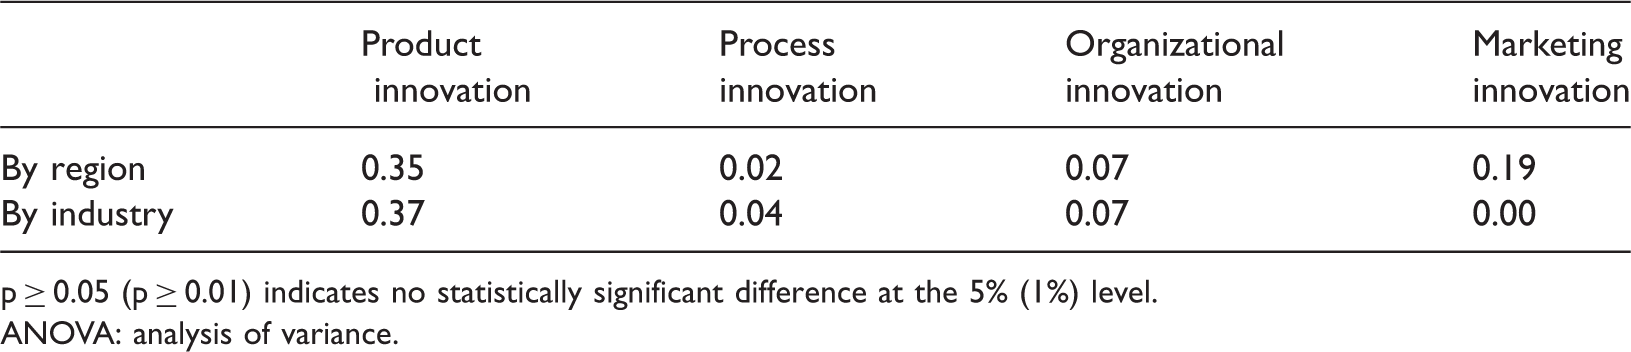
p ≥ 0.05 (p ≥ 0.01) indicates no statistically significant difference at the 5% (1%) level.
ANOVA: analysis of variance.
Results and discussion
The model set out in equations (1a), (1b), and (2) was estimated separately for 20 dependent variables: 16 binary variables indicating whether firms enacted a particular type of operational innovation (product, process, organizational and marketing innovation together with sub-categories of each); and four indicating economic outcomes (proportions of sales attributed to new or improved products and/or processes—innovative sales).
In 16 models, one or more of the factors derived from the Question 31 variables, which were designed to provide instruments, proved to be satisfactory instruments (see “The model and estimation” section above). In the other four cases, difference in functional form was sufficient to achieve identification.
Regression results from the copula-based switching model for the four combined types of operational innovation—i.e. aggregating all the sub-categories of product, process, organizational and marketing innovation, respectively—are reported in Appendix B, Table B.5 (available at http://www.staffs.ac.uk/research/cabr/working-papers/). These models are vehicles for deriving program effects. Accordingly, we are not primarily interested in the estimated coefficients and so comment on them only briefly.
In each selection equation, systematically significant effects are displayed only by the following variables:
“resources invested in innovative activities 5 years ago” (Q12t_1) have positive effects on selection into support programs, which is consistent with positive selection on observables—or “cream skimming”—by program managers; the German and Spanish region dummies show positive effects, which is consistent with the much higher than average participation of sample firms in support programs in these two regions (see Appendix B, Table B.2, which is reported in Radicic et al., 2014); the “food products” industry dummy (Q3t_6) and—with one exception— by one or two of the factor instruments.
Turning to the two output equations, competitive pressure (Q4t_5) has a negative impact on innovation in five from eight estimates, three of which are statistically significant, which is a common if controversial finding in the literature (Aghion et al., 2005; Hashmi, 2013; Tang, 2006). Other variables do not display systematic effects with respect to sign and significance.
Before leaving the regression results, we highlight an issue arising from the estimates of our “quasi-fixed effects.” 11 There were two types of these, a single measure and a group of four similar measures, which yielded strikingly different results. Our first “quasi-fixed effect,” “Resources devoted by the firm to innovation 5 years ago compared to the present” (Q12t_1) yielded uniformly positive and strongly significant estimates of around the same size in all four selection equations together with uniformly positive estimates in the innovation outcome equations (although these were statistically significant in only two from eight estimates). In contrast, the four variables that capture relative innovative capacities—Prodin_2005, Procin_2005, Organiz_2005 and Marketing_2005—are not statistically significant in any of the selection equations and add nothing to the explanation of innovation output (only 3 from 32 estimates are statistically significant). The explanation for this may be that while the first quasi-fixed effect is a within-firm measure, the second group are between-firm measures of capacity relative to other firms. Yet, our dependent variables—in both selection and outcome equations—may depend much more on firms’ own internal capabilities than on “relative” ones. Moreover, while managers and owners are uniquely and well able to judge their own innovative efforts over time they may be less able to evaluate the capability levels of other firms in the same industry. Of course, there are counter-considerations that influenced the design of these variables: especially in the traded goods sector, which includes traditional manufacturing firms, competition forces firms to be cognizant of other firms’ capabilities, and piloting of the questionnaire did not suggest that owners and managers had difficulty in responding to the respective survey questions. Nonetheless, researchers considering the use of quasi-fixed effects in cross-section regressions might like to take into account the contrasting success of the two types reported above.
For each model, the estimated coefficients are used to calculate the program effects: ATT, ATU, and ATE. These estimated effects are presented in Table 6, columns 5–7 (following Lokshin and Sajaia, 2011, standard errors are calculated by bootstrapping). In addition, Column 2 notes the type of copula used (in each case supported by the Vuong test—Hasebe, 2013); 12 Column 3 reports the Likelihood Ratio test of the null that the errors from the equations of the estimated switching model are independent (these diagnostics support the validity of the switching model—in each case except two this null is rejected, while the exceptions are borderline at the 10% significance level) 13 ; and Column 4 reports the factor(s) used as instruments.
Program effects: Summary of relationships between ATT, ATE, and ATU.
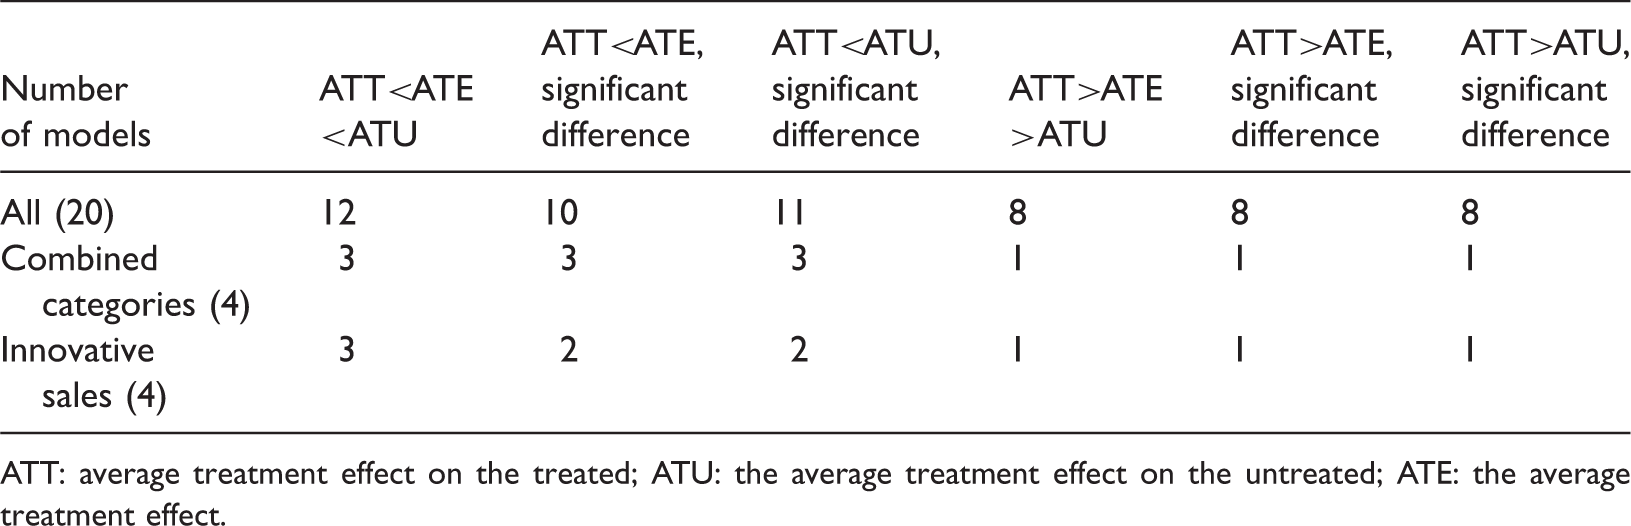
ATT: average treatment effect on the treated; ATU: the average treatment effect on the untreated; ATE: the average treatment effect.
Mean and standard deviation of ATT, ATE, and ATU.
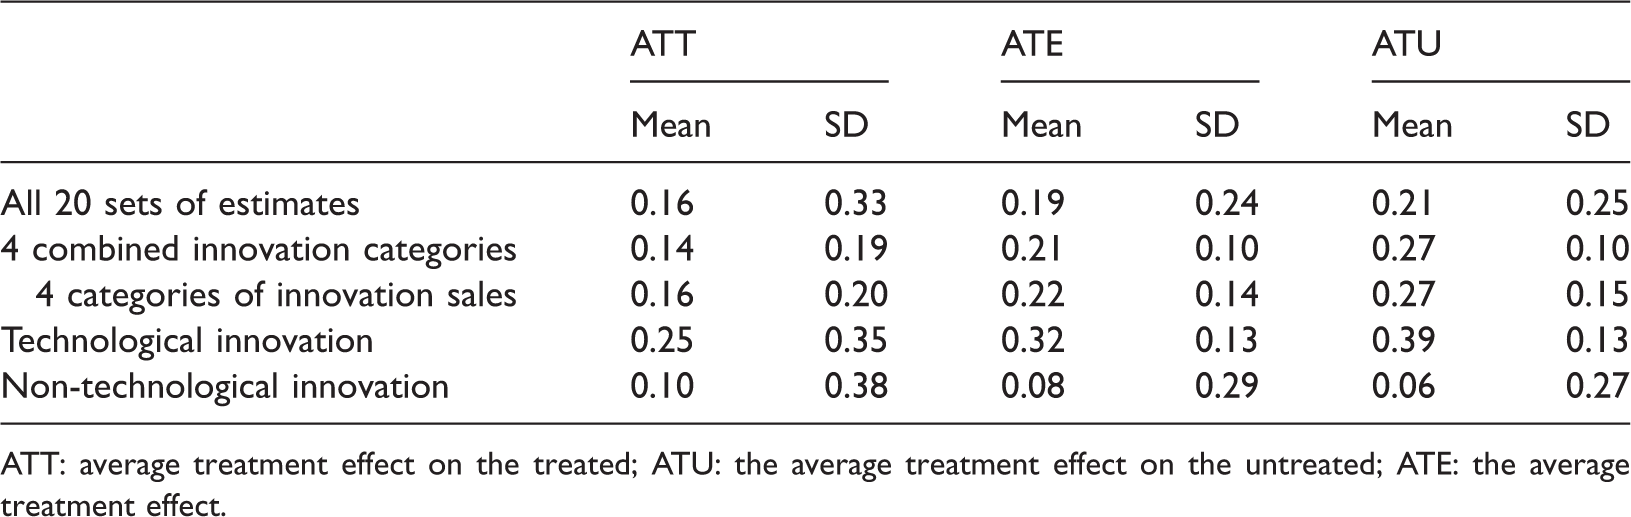
ATT: average treatment effect on the treated; ATU: the average treatment effect on the untreated; ATE: the average treatment effect.
Program participation effects on innovation outputs: ATT, ATU, and ATE (bootstrapped standard errors, 1000 replications).

ATT: average treatment effect on the treated; ATU: the average treatment effect on the untreated; ATE: the average treatment effect; bootst.: bootstrapped.
p < 0.01, **p < 0.05, *p < 0.1.
Together, these findings suggest that program participation has a positive effect on the probability of innovation and successful commercial outcomes. Yet, while the typical increase for participants is estimated to be typically somewhat less than 20% for participants (ATT), the estimated effect for non-participants is higher than 20% (ATU), and, correspondingly, the effect for a randomly chosen firm would be around 20% (ATE). 15 Accordingly, while we find that innovation support programs for SMEs in traditional manufacturing industries typically succeed in promoting innovation, these estimates also suggest that program implementation procedures are not successful in selecting those firms for participation that will most increase innovation as a result.
Finally, we note the striking difference between the estimated program effects on technological innovation and those on non-technological innovation. For technological innovation (i.e. product and process), six from seven cases yield ATT<ATE<ATU as well as statistically significant differences both between ATT and ATU and between ATT and ATE. Moreover, the mean program effects are systematically higher than those otherwise reported in Table 6 (ATT = 0.25, ATE = 0.32, and ATU = 0.39). In contrast, from nine cases of non-technological innovation (organizational and marketing), ATT < ATE < ATU in only three cases (with the difference ATT < ATE being statistically significant in two and ATT < ATU in all three). Conversely, ATT > ATE > ATU (the reverse of the dominant pattern) in six cases of non-technological innovation, all of which yield significant differences between ATT and ATE and between ATT and ATU. The mean program effects likewise reverse the dominant pattern and are much lower (ATT = 0.10, ATE = 0.08, and ATU = 0.06).
As explained above (“The model and estimation” section), the main assurance of the robustness of our estimates is provided by the prepublication of our model. This procedure precludes ex post specification search for “desirable” results. However, we can provide additional assurance by comparing the results of this study with estimates from the same dataset and the same pre-published model obtained from a different estimator; namely, an endogenous switching model based on the assumption of the joint normality of error terms. These results (reported in Radicic et al., 2014) are consistent with the conclusions outlined below (“Conclusion: Summary and policy implications” section).
Conclusion: Summary and policy implications
We define the essential characteristics of traditional manufacturing industry, which include capacity for innovation, and provide evidence of its continued importance, particularly to manufacturing employment. Within this context, we evaluate the effect of innovation support programs on SME innovation in traditional manufacturing industry. To this end, we conducted a survey in seven EU regions to generate the data needed to estimate a pre-published switching model by means of the copula approach. Our estimation strategy is supported by two arguments: namely, that switching models are preferred to matching approaches, because they take into account both observed and unobserved firm heterogeneity; and that the copula approach to estimating switching models is preferred, because it relaxes the particularly restrictive assumption of joint normality.
The main finding is that, for participants, the estimated effects of publicly funded innovation support programs on SMEs in traditional manufacturing industries are positive (ATT), typically increasing the probability of innovation and of its commercial success by around 15%. The main limitation of our study is that we lack information on the value of project support. 16 Accordingly, while our findings preclude complete crowding out, we are unable to distinguish between the consequent possibilities of additionality, partial crowding out and no effect. Nonetheless, in three respects, we add to the small literature assessing the effects of public support programs on innovation outputs. First, our findings are consistent with most of this literature, which reports additionality, although whether negative or positive the program effects reported are small. Second, this article reports the first evaluation for SMEs in traditional manufacturing industries. Third, our study corroborates the mainly positive findings of this literature by addressing the common conjecture that once methods controlling for unobservable firm characteristics are applied, then the impact of public support may become negative and crowding out cannot be rejected. While our methodology is new to this literature, controlling for unobserved heterogeneity without making unduly restrictive parametric assumptions, our findings do not overturn but broadly endorse the conclusions of previous studies.
The dominant pattern of our estimated program effects, ATT < ATE < ATU, enables us to say more about innovation support programs for traditional industry SMEs than simply that, on the whole, they are most likely effective. ATT < ATU suggests that that the wrong firms are being selected for support; greater return on public investment could have been secured by supporting those firms in our sample that were not selected for the program. Of course, the policy corollary is not to maintain current selection procedures but select from among those that do not satisfy the criteria. To inform policy proposals, we focus on the finding that ATT < ATE. This relationship suggests that greater return on public investment could have been secured by supporting firms chosen at random from the population of innovating traditional sector SMEs. In short, while innovation support programs for traditional sector SMEs typically yield positive effects, their selection procedures typically not only do not contribute to these positive effects but also rather diminish them.
Our results suggest a direction for policy reform to increase the potential additionality of innovation support programs. We find that cream-skimming of firms on the basis of characteristics positively associated with innovation is less effective in promoting innovation than would be a strategy of randomly selecting participants. The policy implication is that the selection process of firms into innovation support programs should be reformed by moving away from “cream skimming” towards random allocation. There is potential for improving the overall innovation outcomes of innovation support programs for SMEs in traditional manufacturing industry by substituting random allocation—hence, selecting typical firms for support—for selection procedures biased toward firms with the greatest observed propensity to innovate. 17 The practical implementation of random allocation takes place by lottery as the final stage of a process that starts with firm applications and continues with screening or “due diligence” checking, which ensures that participating firms meet eligibility requirements—e.g. with respect to proposed activities and solvency—for participating in the particular public support program. 18
Consistent with these proposals, the case for random allocation is gaining influence among policy makers. Two recent examples of successful lottery distribution of innovation vouchers are in the Netherlands and in the United Kingdom. Cornet et al. (2006) investigated the effectiveness of a Dutch innovation voucher program for SMEs, under which vouchers were allocated by lottery. The evaluation of the program indicates that 8 out of 10 vouchers were used to introduce innovations which, without public support, would not have been realized. This is a very large treatment effect, especially given that empirical studies, if reporting additionality at all, typically report small program effects. Second, the UK’s National Endowment for Science, Technology and the Arts (NESTA) has already trialed a voucher program with random allocation to support SME purchases of creative services; Bakhshi et al. (2011) evaluated the short-term effects of this program and report a high level of additionality.
Our findings provide support for innovation support programs while suggesting reform of program selection procedures. However, this conclusion may be qualified by our finding that the dominant ATT < ATE < ATU pattern holds with particular force for product and process innovation but not for organizational and marketing innovation. We conjecture that this contrast suggests a differentiated approach to selection for technological innovation support and for non-technological innovation support: first, because complex and costly selection procedures may be particularly unnecessary for allocating technological innovation support to traditional sector manufacturing SMEs; and, second, because even if implemented, non-random selection procedures for technological innovation face particular obstacles. First, we have argued that one of the defining characteristics of traditional manufacturing is that firms in these industries display continuing capacity for innovation. This essential feature is reflected in our sample (Appendix Table B.1, reported in Radicic et al., 2014). However, the respective proportions of firms recording either product innovation (93% of program participants and 73% of non-participants) or process innovation (91% and 76%) in the sample period is higher than for either organizational or marketing innovation (78% and 63%, and 74% and 55%, respectively). Accordingly, SMEs in traditional manufacturing industry may generally have greater capacity to benefit from technological support than from non-technological support, in which case, random allocation would be less risky for the former than for the latter. Second, the mode of technological innovation among traditional sector SMEs may also favor random allocation. Technological innovation in such firms proceeds via tacit knowledge rather than via measurable inputs such as R&D spending; while, conversely, organizational and marketing innovation may be more easily observed. Accordingly, non-random allocation according to observable features of firms’ innovation processes is more difficult to implement for technological innovation than for non-technological innovation.
The use of our findings to inform policy depends on their external validity. We do not claim that our SME sample is representative of all SMEs in traditional manufacturing industry. Yet, even if a representative sample would have been feasible, we argue that it would not have been useful from a policy perspective. Penrose’s (1959) classic The Theory of the Growth of the Firm (7), addressed a similar issue: “Many firms do not grow, and for a variety of reasons… I am not concerned with such firms, for I am only concerned with… those firms that do grow.” By analogy, policy makers are concerned to encourage innovative or potentially innovative SMEs to more fully exploit their innovative potential. In “Context” section above, we identify as one of the characteristics of traditional manufacturing industries the retention of “a capacity for innovation” and suggest that this characteristic creates potential for public policy to promote innovation in these industries. Correspondingly, our sample firms are overwhelmingly recent innovators (and the rest are at least sufficiently oriented toward innovation to engage with an innovation survey). As long as such firms are a priority for policy makers, then it is valid to use our results to inform policy.
In addition to our findings and their policy implications, we advance the argument that, in general, pre-publication of the model(s) to be estimated supports the validity of findings from econometric literatures and, in particular, that it helps to establish the validity of the findings reported in the present article. Because econometric studies are so much cheaper to start than are RCTs, pre-registration—including the pre-publication of analytic procedures, model(s) to be estimated and so forth—would create an incentive to obtain and select results prior to pre-registration. However, in the case of econometric studies made possible by large projects, in particular, those dependent on gathering primary data, the pre-publication approach could be a credible way to ensure against selection bias and thus provide assurance as to the validity of subsequently published results. The present study arises from an EU Framework 7 project (GPrix, 2009–2012). According to the schedule of project “deliverables,” the model was set out and pre-published on the project website.
Footnotes
Acknowledgements
This study develops analysis conducted for the 27-month GPrix project (November 2009–February 2012) commissioned by the European Commission’s DG-Research. Full title: Good Practices in Innovation Support Measures for SMEs: facilitating transition from the traditional to the knowledge economy; Instrument: SP4-Capacities—CSA—Support Action; Call: FP7-SME-2009-1; Grant agreement Number: 245459. DG-Research funded the research but did not influence its conduct or findings. Likewise, the authors alone took the decision to prepare this article for publication. We are grateful to Bianca Buligescu at UNU-MERIT, Maastricht School of Business and Economics, for advice on our empirical strategy. In addition, discussion with Hannes Leo and other participants at the GPrix project Final Workshop in Brussels (February 28th 2012) as well as later collaboration with Hasan Bakhshi and Albert Bravo-Biosca at the UK’s National Endowment for Science, Technology and the Arts (NESTA) and Hilary Chilton at the UK’s Technology Strategy Board (TSB) helped to bridge the gap between policy implications/proposals and policy design/enactment. We also thank participants at the DRUID Winter Conference in Aalborg (January 2013) for feedback on an earlier version of this article.
Declaration of conflicting interests
The author(s) declared no potential conflicts of interest with respect to the research, authorship, and/or publication of this article.
Funding
The author(s) received no financial support for the research, authorship, and/or publication of this article.