
Abstract
While critical attention has recently turned to racialized police violence in US cities, another quiet development in urban policing is taking place. Hundreds of police departments have begun to wed database software with geographic information systems to represent crime cartographically. Focusing on the Chicago police’s digital mapping application, CLEARmap, the article interprets this development from the standpoint of racialized carceral power. It puts critical geographic information systems theory into discussion with critical ethnic studies and builds the case that CLEARmap does not passively “read” urban space, but provides ostensibly scientific ways of reading and policing negatively racialized fractions of surplus labor in ways that reproduces, and in some instances extends the tentacles of carceral power. CLEARmap’s data structure ensures that negatively racialized fractions of surplus labor, the places they inhabit, and the social problems that afflict them are only representable to state authorities and the public as objects of policing and punishment. CLEARmap is also used at police–community meetings and via the Internet to adapt public perceptions of crime to that of the policing apparatus, and mobilize the public as appendages of police surveillance. By tracing these phenomena, the article casts a heretofore untheorized dimension of the carceral power into sharp relief.
Keywords
Carceral control’s digital horizon
In April of 2016, Chicago Mayor Rahm Emanuel’s task force of civil litigators, social workers, law professors, an Inspector General, and a former governor released a report on policing and racism (PATF, 2016). Reacting to the “historic public outcry” over police violence, the report chronicled the Chicago Police Department’s (CPD) “racism and maltreatment,” citing the disproportionate rates with which civilians categorized as black and latinx are subjected to street stops (72%), taserings (76%), and police shootings (74%). “CPD’s own data,” it concluded, “gives validity to the widely held belief the police have no regard for the sanctity of life when it comes to people of color.” The findings echoed a spate of recent reports on the differential brutality and lethality unleashed by criminal justice apparatuses in negatively racialized areas of cities (ACLU, 2014; CCR, 2012; NYCLU, 2014; PTF, 2015).
But another, less spectacular development in Chicago and other cities has taken root over the past few decades. Since the mid-1990s, police departments in Chicago and other cities have sought to exploit the “digital explosion” of low-cost computing and merge database software with geographic information systems (GIS) to represent crime cartographically (Heaton, 2000; John and Maguire, 2012; Maguire, 2000; Ratcliffe, 2002; Vigneswaran, 2014). Between 1997 and 2001 the number of police departments with 100 or more officers using digital crime mapping nearly doubled (Zhang et al., 2014). This trend has been heralded by police executives, policymakers, and media as a paradigmatic revolution offering unprecedented ways of seeing and preventing crime (Gurwitt, 1998; Henry, 2003; Walsh, 2001). It has also helped popularize “hotspot” analyses of concentrated crime throughout criminological research (Anderson, 1999; Melsness and Weichelt, 2014). Together, these developments have been hailed as ushering in a new mode of scientifically precise and objective policing that seamlessly “flows from the data” (Gurwitt, 1998). A computational analyst who worked with the CPD’s GIS team notes: “I think [computerized crime mapping] is where the next big thing is … In ten years I think every [police department] will be using some form of it” (Former member of CPD’s GIS team).
This article focuses on the CPD’s multiaward winning GIS crime mapping application, CLEARmap, to reinterpret the rise of digital crime maps from the standpoint of racialized carceral power. It seeks to uncover the relational links between GIS, racialization, and the carceral control of negatively racialized fractions of surplus labor. It does so through semistructured interviews with the CPD’s GIS team and participants at police–community “beat meetings,” participant observations of beat meetings, and discourse analysis of relevant news media and technical city documents. 1 Putting critical GIS (critGIS) into discussion with critical ethnic studies (CESs), the article builds the case that CLEARmap does not passively “read” urban space, but provides ostensibly scientific ways of reading and policing negatively racialized fractions of surplus labor in ways that reproduces, and in some instances extends the tentacles of carceral power. For one, CLEARmap’s data structure ensures that negatively racialized fractions of surplus labor and the places they inhabit are only representable to state authorities and the public as objects of policing and punishment. With GIS and GIScience, police and state officials are given a scientific go-ahead to represent racialized surplus populations and the social problems that afflict them as nothing more than objects of policing and punishment, while disregarding the complex network of forces that generates these populations and problems in the first place. For another, CLEARmap is wielded by police to reconstitute civilians as appendages of the carceral state. CLEARmap is used at police–community meetings and via the Internet to adapt public perceptions of crime to that of the policing apparatus, interpellate residents as geocoding subjects 2 who act in service of the state, and ultimately establish a networked regime of police surveillance.
This article builds on the “first wave” (Schuurman, 2000) of postpositivist geographic critiques of GIS that formed the basis for critGIS research. At the heart of these critiques is the recognition that GIS mapping can conceal more than it reveals. Though there is nothing innately positivist about GIS (Kwan, 2002; McLafferty, 2002), it is almost exclusively wielded for spatial statistical analysis by government users (Bondi and Domosh, 1992; Harris, 1989; Kwan, 2007; Lake, 1993; St Martin and Wing, 2007; Sheppard, 1995). When coupled with state apparatuses, the Cartesian grids of GIS can be used in a way that completely overlooks the web of political, economic, and social forces that give rise to location’s material conditions and cloaks the power relations that traverse social space (Goodchild, 1995; Ley, 1977; Sheppard, 2001, 2005). This masking function is particularly useful for neoliberal governances, which have all but abandoned policies designed to recuperate the relative material securities that surplus labor had during the Keynesian era.
Furthermore, GIS have been developed within the constraints of digital computing, which rely on Boolean mathematics that deal exclusively in binary inputs (Sheppard, 1995, 2001). Such deductive, binary restraints perforce exclude insights about places from social theoretic logics such as dialectics, deconstruction, and hermeneutics (Lawson, 1995; Pickles, 1993; Sheppard, 1993; Taylor and Overton, 1991), not to mention vast spectra of qualitative and situated knowledge (Elwood, 2002; Kwan, 2008; Kwan and Ding, 2008). Thus, the computational logic inscribed into the very heart of GIS can react against critical analysis, which works in the service of policy regimes that reinforce, if not engender social inequalities (Schwanen and Kwan, 2012; Sheppard, 1995).
What is more, GIS have proven formidable technologies of subject production (Harvey, 2001; Kirby, 1996a, 1996b; Kitchin and Dodge, 2011; Lake, 1993; Pickles, 2004; Rose-Redwood, 2006; Wilson, 2011; Yapa, 1998). GIS maps present a schema in which humans are cast as interchangeable objects defined by reductive bureaucratic categories, space is reduced to an invariant XY-coordinate system, and connections between the two are locked into formalized relationships that elide political economic transformations and social particularity (Currie et al., 2016; Dalton and Thatcher, 2015; Kirby, 1996b). And on the terrain of public policy, the mere act of geocoding most often designates the coded object as a problem, even if that object is a human (Curry, 1995; Lake, 1993; Taylor, 1990; Yapa, 1998). The commitments of various state apparatuses to track the coordinates of social problems using GIS can thereby cast the geocoded human as one object of technocratic administration among others. Moreover, state spokespersons’ increasing promotion of GIS as conduits of smart and transparent governance has propelled the production of geocoding subjects (Elwood, 2002; Wilson, 2011), or individuals who feed the state with assessments of places and persons according to bureaucratized categories and standards.
While these provocative works show how GIS mappings can render aspects of social reality invisible, crucial questions remain: what social meanings are inscribed into geocoded data? How does this interplay of obfuscation and representation prop up modalities of racialized social control? To answer these questions this article engages CESs that investigate the roles that the production of knowledge and representations play in reproducing racialized hierarchies (Day, 2015; Elia et al., 2016; Ferguson, 2015; Lowe, 2015; McKittrick, 2006; Melamed, 2011; Nishiyama, 2015; Rana, 2011; Reddy, 2014; Rodríguez, 2009; Rosas, 2006; Silva, 2007; Woods, 2007). These works analyze how seemingly apolitical knowledge and representations transmit “ideological information bits” (Melamed, 2011) that contribute to racializing human beings and organizing them differentially according to normalized exposure to exploitation, devaluation, disavowal, and violence (Cacho, 2012; Gilmore, 2002; Hong, 2015; McKittrick, 2013; Mbembe, 2003; Tadiar, 2012; Weheliye, 2014). These works are fruitful for analyzing GIS crime mapping as crime statistics have long functioned as the most “durable signifiers” of antiblack discourses in the US (Muhammad, 2011) and provided policymakers pretexts for the punitive governance of communities bureaucratically categorized as “black” (see also Murakawa, 2008; Shabazz, 2015).
In merging critGIS with CESs, this article identifies digital crime maps as conduits of spatial knowledge and representations particular to the carceral state, the mode of statecraft in which criminal justice apparatuses function as key mechanisms for managing negatively racialized fractions of surplus labor dislodged by deindustrialization and the disintegration of the Keynesian state (Alexander, 2012; Beckett and Herbert, 2011; Brown and Schept, 2016; Davis, 2003; Gilmore, 2007; James, 2000; Lebaron and Roberts, 2010; Peck, 2003; Wacquant, 2010; Western and Beckett, 1999). These works place emphasis on the fact that the criminalization and containment of racialized surplus populations is in no way reducible to detention centers, jails, and prisons, but also permeates public space through variegated networks that include, but are not limited to, media coverage (Beckett, 1999; Wilson, 2005), private sector agencies (Vitale, 2005), public housing complexes (Shabazz, 2009), public education facilities (Sojoyner, 2016), voluntary associations (Garland, 2001; Simon, 2003), state agencies (Beckett and Murakawa, 2012), and zoning ordinances (Beckett and Herbert, 2011; Vitale, 2008). This scholarship reveals the viral and rapid spread of hyperaggressive policing and penal policies to be a state response to social dislocations wrought by the demise of Keynesian welfarism. Moreover, it elucidates how the state utilizes such policies to manage geographic distributions of negatively racialized surplus labor in a manner that is conducive to postindustrial forms of accumulation anchored in high-end consumption, gentrification, real estate development, and tourism. By analyzing the role of GIS during these mutations, this article casts a heretofore untheorized dimension of the carceral power into sharp relief.
Chicago, crime, and space before CLEARmap
By the late 2000s, the media and city officials lavished praise on the CPD for its “methodical and tenacious” pursuit of information technology (Pastore, 2004), its exemplary model for using GIS to fight crime (Pompilio, 2005), and its place as the “international leader for [its] use of technology” (Daley and Weis, 2007). The department’s innovation with geospatial technology was celebrated for offering an unprecedented and “virtual view of the crime picture in metro regions” (Walters, 2007) and inaugurating a “brave new world of policing” (Spielman and Main, 2003). But this techno-glorified rhetoric is a far cry from that of a decade prior, when carceral governance nestled its way into center stage of Chicago’s political scene.
In the early 1980s, staggering upsurges of reported index crimes in the “Black Belt”
3
sparked widespread public support for racialized carceral governance (see Figure 1). Echoing the dominant crime rhetoric of the day, Chicago officials pathologized crime waves and argued in favor of militarized solutions to address them. Mayor Richard M. Daley (1989–2011) repeatedly stressed that Chicago was one of multiple cities around the US afflicted by rising crime rates, and the fight against crime was linked to broader struggles for national survival and international flows of illegal drugs and firearms (Daley, 1991a, 1991b). Crime-riven parts of the city were likened by Daley to the Colombian drug war (Long, 1991a), while aldermen compared them to Vietnam (Long, 1991b) and routinely invoked imagery of “bloody battlegrounds” and “neighborhoods under siege” (Copeland et al., 1991). Citizens were encouraged to organize Block Clubs to assist CPD in the “street war” against gangs, “onslaught of violence,” and “ever-rising tide of [violent crime]” (Kujawski, 1995).
Index crimes in Black Belt districts. Index crimes include murder, rape, robbery, aggravated assault, burglary, theft, auto.
4
Source: Chicago Annual Police Reports (1980–1990).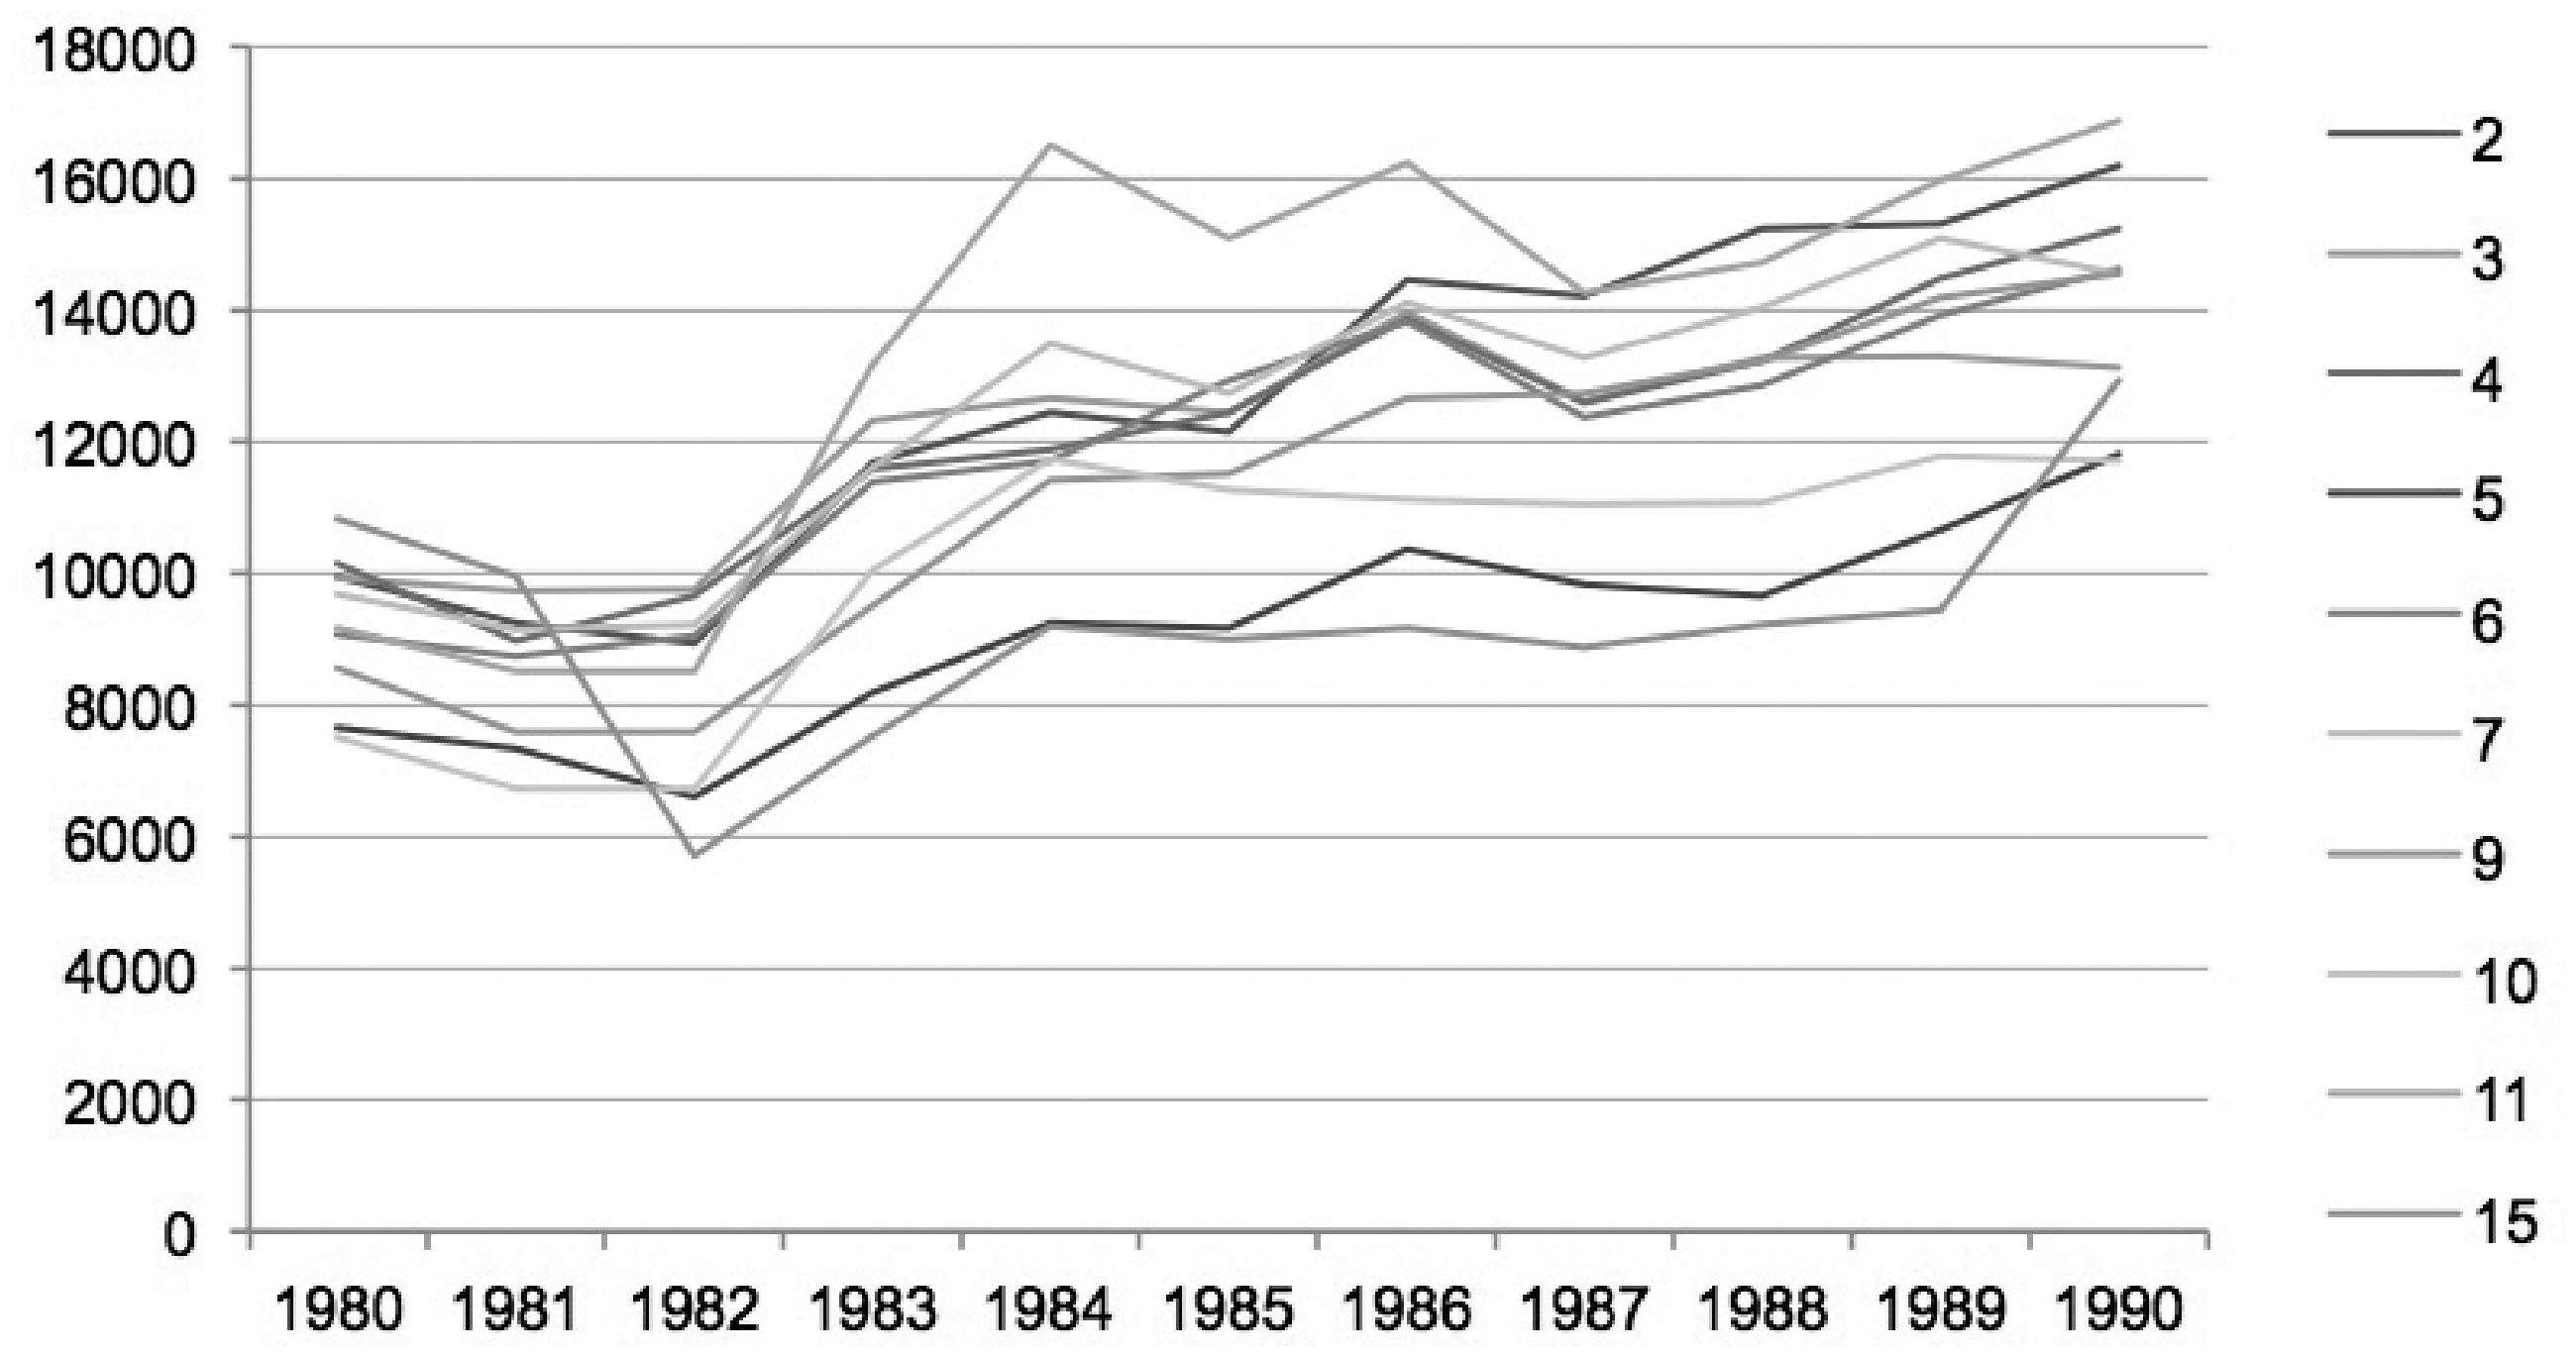
In many officials’ rhetoric, criminalized subjects were cast as incorrigibly violent individuals who could only be controlled through a militarized carceral state. Gang members and drug addicts were subhumanized and racialized through barely coded language marked by evocative martial, zoological, and biological tropes. Gang members were described as plagues that “spread like cancer,” “rats coming out of the garbage can” (McNamee, 1991b), or hoodlums who “terrorized communities” and perpetuated “shameless violence and destruction” (Daley, 1991b). Criminal tendencies were considered legible through visible signs associated with blackness: verbal expressions, emotive styles, dress, gaits (Wilson, 2005). In short, this crime discourse articulated social difference vis-à-vis a catalog of signifiers always already linked to “inner-city blackness,” which, like all modalities of racism, locked negatively racialized subjects into structural positions in which their differential exposure to state vilification and violence was codified in policy and law (Cacho, 2012; Gilmore, 2002; Hall, 1992; Melamed, 2011; Reddy, 2011).
Other officials and media linked crime trends to structural mutations in the city’s economy, most notably the rapid decline of manufacturing and public sector employment. 5 The work of William Julius Wilson and Robert J. Sampson penetrated mainstream debates about crime and race. But even when officials portrayed criminals as malcontents who felt “outcast by society” due to virulent poverty, lack of political representation, and lack of affordable housing, they were nonetheless cast as unredeemable due to irreparably damaging childhoods and warped subculture (Daley, 1991b; McNamee, 1991a; Sweet, 1991).
In these volatile conditions, public officials scrambled to find solutions. Drawing on the country’s ultrapunitive zeitgeist, Daley introduced an anticrime package that was so overreaching that the Illinois Supreme Court struck down several of its provisions including wiretapping and antiloitering ordinances. Police Superintendent LeRoy Martin (1987–1992) railed against lenient judges and argued the CPD should replicate Chinese policing strategies and curtail constitutional rights where they encumber law enforcers (Weintraub, 1991). Debates raged about redrawing the city’s 279 “beats”—geographic sections inside police districts that officers are responsible for patrolling during a shift—and reallocating the CPD’s 13,600 officers according to crime index data. Moreover, some officials and media insisted that unemployment, poverty, and inadequate schooling were drivers of violent crime, and substantive crime reduction required economic and infrastructural transformations (McNamee, 1991a; Reckenwald and Reardon, 1994; Scheingold, 1994). While city decision makers ultimately embraced the carceral state to manage criminalized subjects, the discourse surrounding crime control was fractured by disputes, tensions, and contradictions.
CLEARmap and the carceral gaze
In the mid-1990s, a shift occurred in Chicago officials’ rhetoric on crime and policing. Hyperbole waned and crime came to be treated as a scientific and technical problem. And crime rhetoric became profoundly spatialized. At the center of this shift lay the CPD’s turn to GIS. With GIS, public discussions about crime control were no longer formulated through “moral panics” so much as through a positivist discourse in which criminals were viewed as no more than nuisances that could be managed via technocratic adjustment of criminal justice mechanisms. As such, debates about the causes of crime slowly faded from the public arena, as did those about the best approaches to crime reduction. Through GIS maps and spatial statistical analysis, city officials adopted an empiricist–positivist epistemology familiar to GIScientists, as the geocoded objects (crime events) under scrutiny were completely divorced from the social forces that constitute them (Bondi and Domosh, 1992; Curry, 1995; Miller, 1995). For Chicago authorities, GIS engendered a new carceral positivism in which criminalized subjects and the spaces they live in were henceforth depicted as no more than policeable and punishable dots that materialize from time to time inside bounded segments of Cartesian space.
It would be shortsighted to view shifts in official crime discourse solely in terms of declining crime rates. Rather, the enthusiasm CPD and public officials showed for GIS shifted conversations from conservative and liberal emphases on cultural and structural causes of crime, respectively, toward a bipartisan fixation on eradicating microspatial “hotspots” of crime. This tendency became evident as early as 1995, when the CPD implemented its Information Collection for Automated Mapping (ICAM), the first public interface in the US for crime mapping that used ESRI. ICAM was touted as an easy-to-use computerized mapping program that provided patrol officers and district personnel with crime maps for beats, sectors, and districts, and enabled them pinpoint “hotspots of criminal activity” (Daley and Rodriguez, 1995). Daley held press conferences in police station houses to demonstrate how police districts and residents used ICAM’s computerized mapping to “plot schools, churches and other institutions” and keep track of “trouble spots like taverns, liquor stores and abandoned buildings” (Daley, 1995). ICAM quickly became the “linchpin of [a] whole strategy” marked by the infusion of extra patrol forces in GIS-generated hotspots and paved the way for its successor CLEARmap (Rich, 1996).
In 2001 the CPD, in conjunction with business software designer Oracle Corporation, set out to revamp the department’s crime database and merge it with GIS functionality (Ashley, 2006). The collaboration gave rise to the CPD’s Citizen and Law Enforcement Analysis and Reporting (CLEAR), originally a 200 GB data storehouse used to enhance police management, coordination between criminal justice agencies, and community/business partnerships (see Skogan et al., 2005). But CLEAR’s major innovation was to add a mapping component to the department’s data warehouse, CLEARmap, which made it possible to take crime data from query pages and generate choropleth maps using ESRI’s ArcIMS by police beat, district, ward, community area, and census tract.
For CLEARmap’s architects, the key advantage of GIS crime mapping is its ability to reveal clusters of crime hotspots and see patterns in the way they proliferate. But the positivistic gaze employed by the GIS team decontextualizes these clusters from the material conditions in which they emerge. This neglect of the surrounding conditions that engender and reproduce geographic patterns in crime data is characteristic of GIS practices performed by the state, which are characterized by a “methodological individualism” that isolates social actors from social contexts (Levine et al., 1987). In crime mapping, this process of reification is captured by the widespread preoccupation among crime analysts who use GIS to “drill down” to ever-smaller scales of analysis (Curtis et al., 2016) and depict crime events as purely localized events lacking any connection to nonlocal forces. Linkages between GIS practice and the decontextualization crime events are marked among the CPD’s GIS team, who exhibit a preoccupation with: crime hotspots – spatial locations that are good targets for police – [which] would not exist without digital crime mapping or without GIS … [With GIS] we know that 50 percent of all urban crime happens in 5 percent of area of the city ….We didn’t know that until we put the dots on the map. (Former member of CPD GIS team (personal communication, 2015)) If you … focus all your energy on the traditional crime hot spots, you put all your extra resources in large commercial areas, cause that’s where the chronic crime hot spots are. But if you recognize that there are temporary hot spots that are also equally good if not better targets, those are spread all over the place. (Former GIS team manager (personal communication, 2015))
For Daley’s successor, Rahm Emanuel (2011–current), GIS remained regarded an antidote for saving Chicago’s poorest neighborhoods from becoming a “lost generation that slides into crime and poverty” (Byrne, 2015). Emanuel’s “technology triumvirate” of the Chief Information Officer, Chief Technology Officer, and Chief Data Officer became the public face of the city’s geospatial analytical prowess. They explained how, in synthesizing big data and geospatial technology, the city was applying “simple spatial and temporal principles” and “empiricism and statistical models” to optimize decision making (Wong, 2011). Expanding public access to CLEARmap was said to enhance the capacity of anticrime groups, the research community, journalists, and residents to “generate new knowledge about patterns of crime” (Office of the Mayor, 2011). Similarly Police Superintendent Garry McCarthy (2011–2015) extolled GIS as “an invaluable tool and dynamic method to reduce crime … We can identify patterns, hot spots, frequent offenders and target our resources to those areas” (in Office of the Mayor, 2011).
As CLEARMap came to occupy a foremost position among the police’s spokespeople, the media praised the CPD for its “high-tech crime fighting,” and partook in the fetishization of criminogenic microspaces. In this new regime of geographic information production, where the ecological fallacy and modifiable areal unit problem are barred from consideration, entire police districts and about a dozen community areas replaced gangs and negatively racialized youth as floating signifiers for criminality. The Sun-Times began crafting vignettes of crime that were georeferenced by neighborhood: a 12-year old boy killed after cleaning up his Back of the Yards neighborhood; a 7-year-old girl wounded on her Englewood porch; a 14-year-old boy shot dead in Humboldt Park, a 10-year-old girl wounded in Pilsen by a stray bullet. (Spielman, 2003)
The Tribune echoed this microspatial fixation: “Mario Wright was fatally shot during a quarrel with another man at a party in the 6800 block of South Green Street” (Jeffers, 2004a), “Hernandez, 26, was shot on Clark Street near Addison Street” (Jeffers, 2004b), “Fernando was shot in the back and the neck on the Far South Side” (Staff, 2007). Mention of a nationwide crisis was replaced with that of “local crime problems.” Chicagoans were urged to not get preoccupied with national crime statistics, as “the numbers you should pay attention to are much more local – the crime on your block and in your neighborhood” (Yednak, 2003). The material conditions surrounding these incidents, it seemed, had lost their importance.
The continuities between crime discourse and carceral statecraft before and after CLEARmap are apparent. Like official crime rhetoric in the 1990s, CLEARmap’s dataset militates against acknowledging links between geographic patterns in crime data and dramatic expansions of the penal code, methodological changes in crime measurement, geographically differentiated policing tactics, shifting geographies of impoverishment, transformations in labor market conditions, or disinvestments in public infrastructure, to say the least. But in CLEARmap’s view from nowhere (Haraway, 2000), criminalized subjects exist simply as policeable and punishable points within a featureless, geographical vacuum. When asked about the explanatory power of GIS and spatial statistical analysis, a former member of the CPD’s GIS team remarked that they “[show] that criminals are generalists by and large … they don’t just do one kind of crime … [GIS show] they don’t have the same set of values that the rest of us have.” Such radical reductionism typifies the penchant of GIS practices to reify social problems and deflect against critical thinking about the variegated forces that create them (see Yapa, 1998).
CLEARmap’s reductionist gaze also reconfirms the relational links between “transparent” representations of space and racialized social control (Cacho, 2012; McKittrick, 2006). As Cacho (2012: 9) notes, we “transparently” recognize criminals “only by refusing to recognize the material histories, social relations, and structural conditions that criminalize populations of color and the impoverished places where they live.” Indeed the data-gathering methods (differential policing) and data structure (department crime indexes) that constitute CLEARmap see to it that negatively racialized segments of low-skilled workers remain overrepresented. At the same time, these features of CLEARmap establish an ontological cage within which geocoded individuals are only knowable as policeable and punishable objects. Like other forms of racialized surveillance, CLEARmap performs a denuding function that reduces subjects into interchangeable objects of state power (Browne, 2015). With GIS and GIScience at its disposal, the CPD simply grafted a scientific façade onto a social control apparatus that had grown militantly averse to acknowledging the network of forces that create and reproduce “criminogenic” hotspots.
GIS, subject production, networked carceral power
Beyond issues of public rhetoric by government officials and news media, how does CLEARmap affect public perceptions of crime and punishment? How might this reinforce or extend racialized carceral power? These questions are pertinent as maps overcode the worlds we inhabit and affect the subjects we become in multiple ways (Kitchin and Dodge, 2011; Pickles, 2004). First, when applied to human beings, the cartographic gaze as deployed by state apparatuses reduces individuals to bureaucratic classifications (e.g. “narcotics offender”) and erects an insuperable barrier between classified subjects and the space they occupy (Dalton and Thatcher, 2015; Harvey, 2001; Kirby, 1996b). Through this state-mediated optic the individual and the space she occupies are locked into a formalized, three-dimensional relationship expressed solely in terms of longitude, latitude, and time. Neither the data collection techniques nor the statistical methods inscribed in the mapmaking process factor into our perception of a geocoded person we see on a map, which further petrifies her personhood in whatever bureaucratic category that’s used to label her (Dalton and Thatcher, 2015).
Apart from locking geocoded individuals into bureaucratized subject positions, the proliferation of state-produced GIS maps has proven pivotal in shaping how subjects perceive and navigate their surroundings (Thatcher, 2013; Wilson, 2011). This is because data visualization structures how we observe social reality and the people contained inside it (Currie et al., 2016), which in turn fine-tunes shared perceptions of the social environment to data processing apparatuses. Finally, given the first two conditions, the increasingly ubiquitous nature of state GIS maps has spawned the production of civilian subjects who willingly geocode their environments according to state bureaucratic categories and standards (Wilson, 2011). This not only legitimizes state power but also aids it in restructuring sociospatial environments in accordance with its own prerogatives (Pickles, 2004; Smith, 1992). Below I chronicle how this cartographical production of subjects intersects with racialized carceral power.
Producing subjectivities in Englewood
Chicago’s Englewood neighborhood provides a fruitful case to explore how CLEARmap casts shared perceptions about crime in the mold of the wider apparatuses of policing and punishment. It is an atypical case with an exceptionally high index crime rate, which makes police–community dialog fertile grounds for analyzing how GIS maps sculpt perceptions of crime in a manner commensurate with carceral power. In 2013, Englewood was Chicago’s fourth most impoverished neighborhood, with a poverty rate of about 50%, a median household income of $23,000, and wherein about 43% of residents did not hold a high school degree (City-data, 2015). From 2001 to 2010 Englewood maintained, with an average of 9,273, the fifth highest crime index (CPD 2002–2011).
6
By 2010, it had the city’s fourth highest number of arrests (10,018) (ibid) (see Figure 2). Police-community meetings in Englewood therefore offer illuminating sites to examine if CLEARmap relates crime rates to social structure and the subsequent effects of shared attitudes toward crime control.
2015 arrest rates by district: Situating Englewood’s seventh district. Source: CPD Annual Report.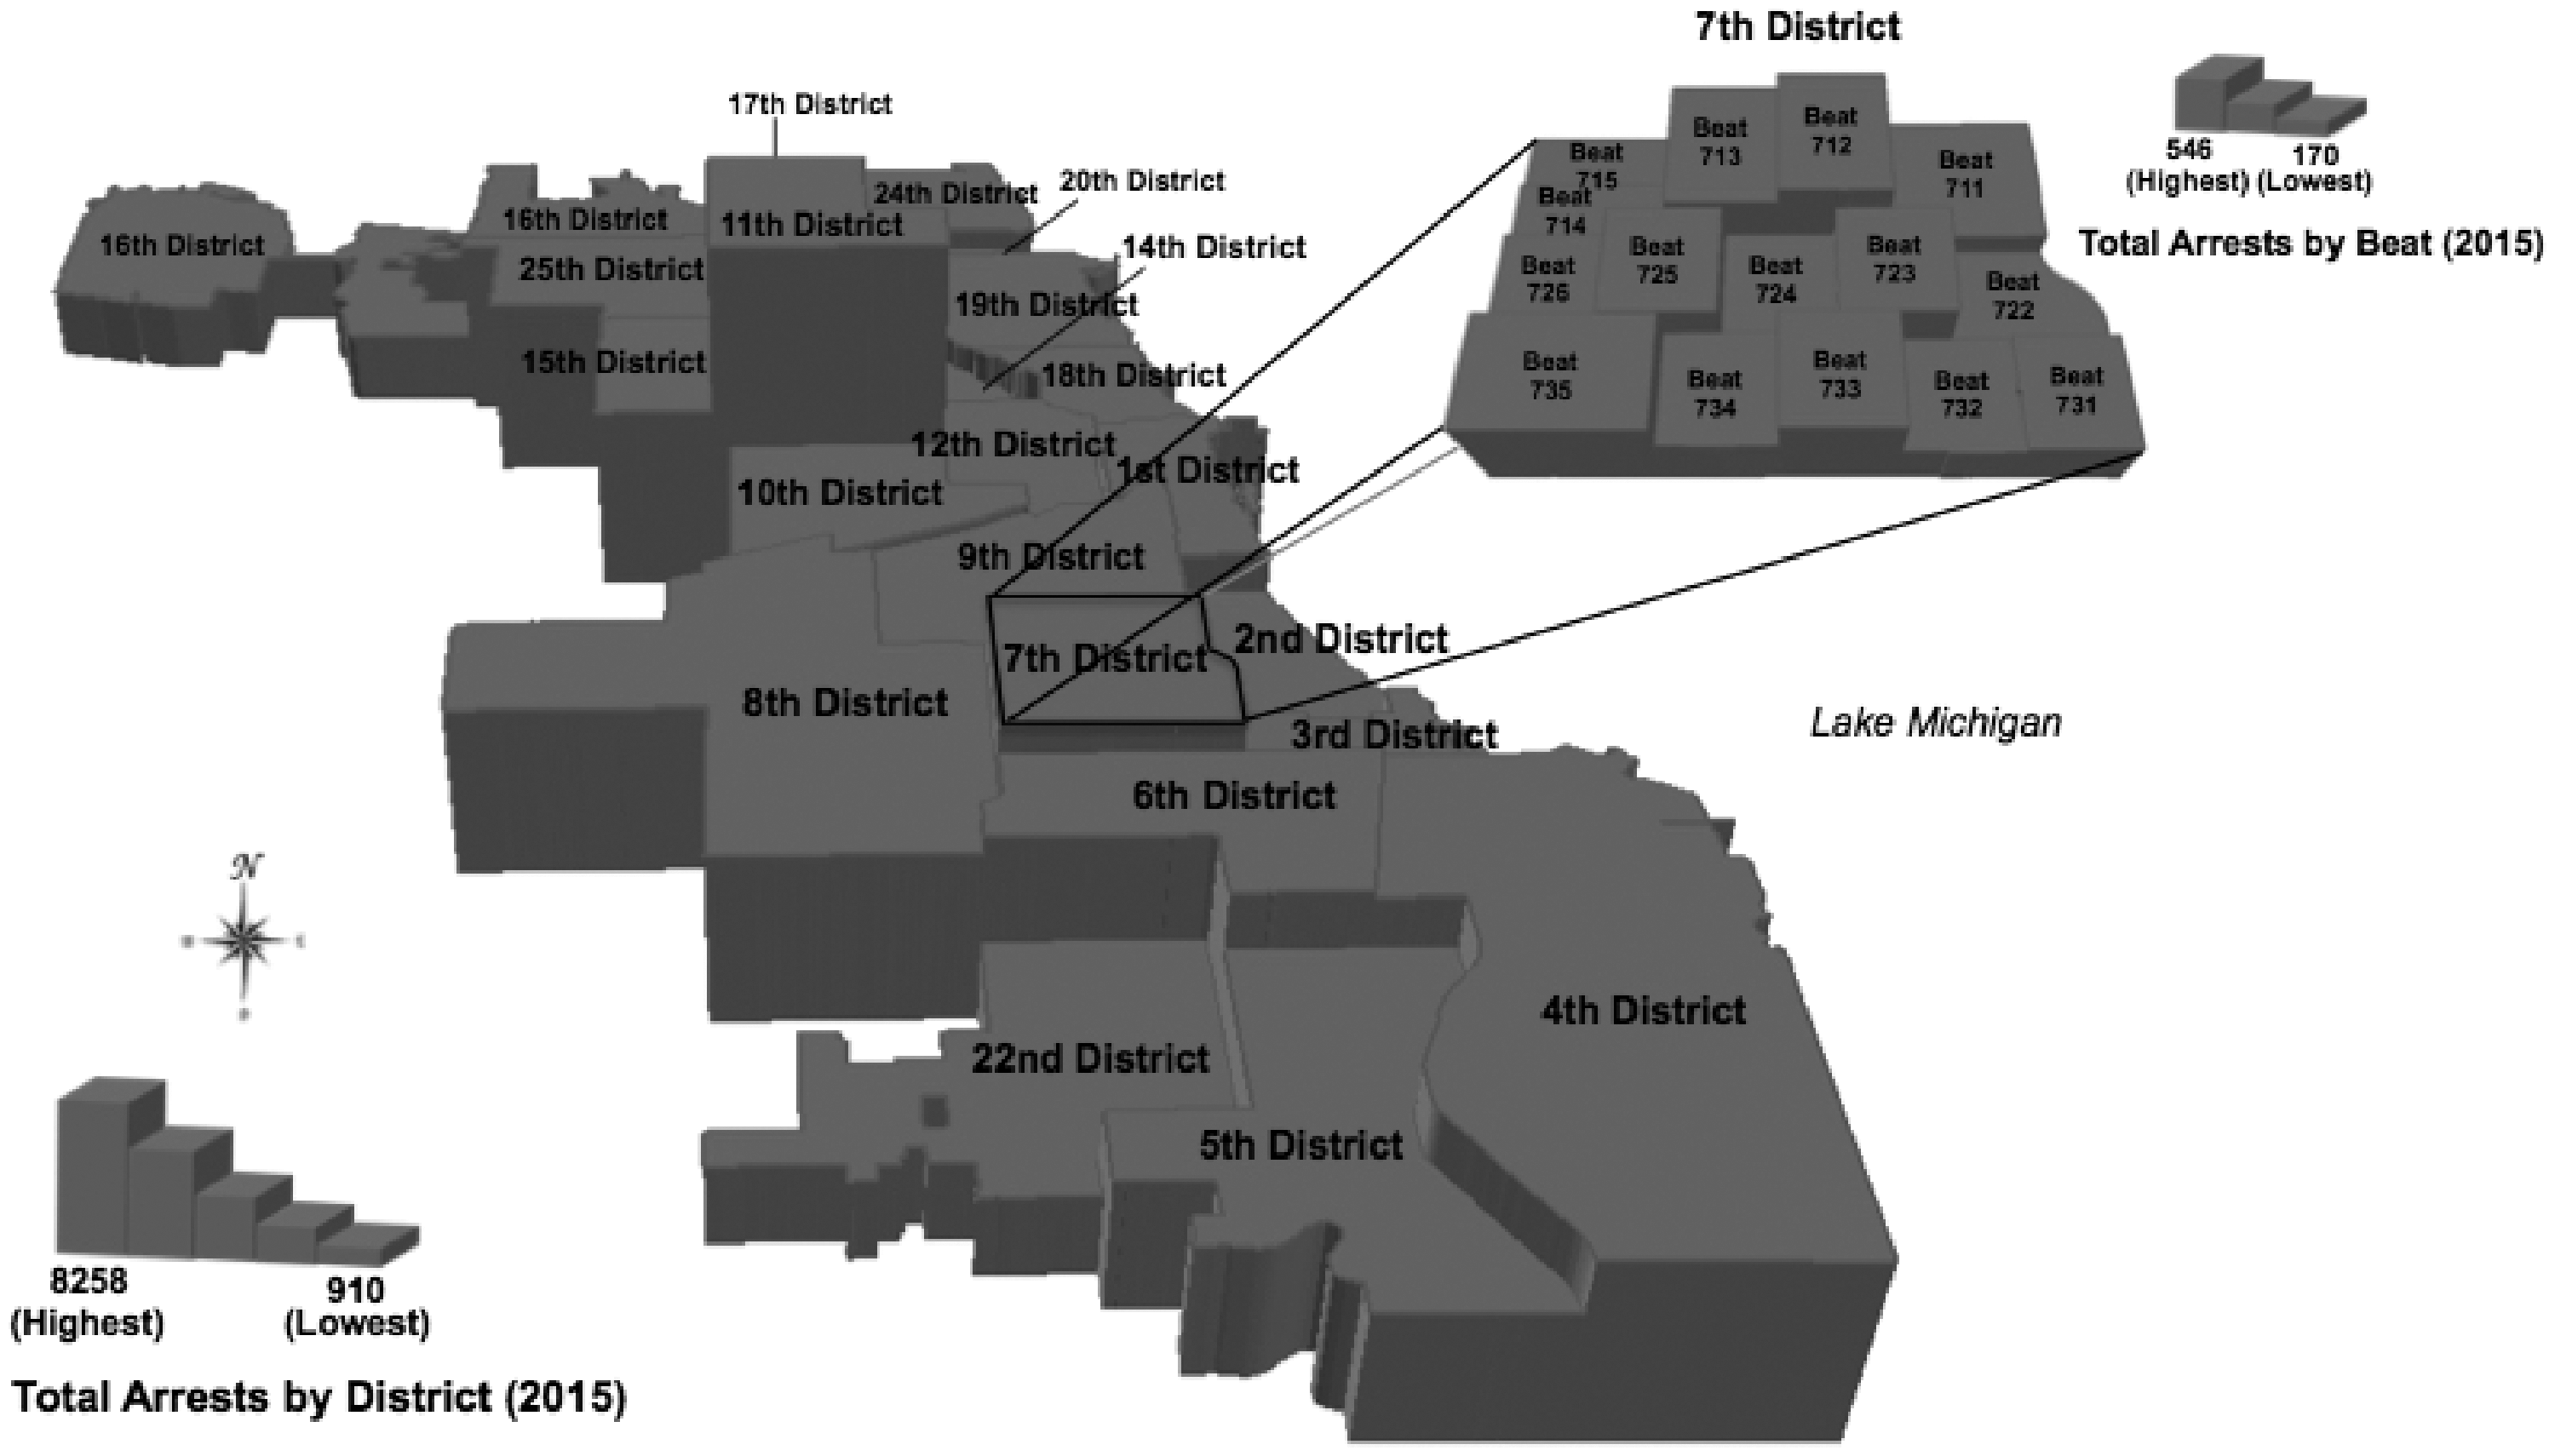
CLEARmap’s presence is palpable at Chicago’s Alternative Policing Strategy (CAPS) meetings, which involve bimonthly gatherings of police officers, residents, and city officials to tackle “serious crime problems, as well as those neighborhood problems that breed crime” (CPD, 2016). In the seventh district, the meetings commence with an officer handing out printed maps from CLEARmap and beat agendas that provide information about progress on previously identified problems, arrest data statistics, CLEARmap reports, and a list of new problems. These handouts parameterize ensuing discussion and set the stage for constituting residents as appendages of police surveillance.
At CAPS meetings, CLEARmap is wielded by the CPD as an instrument of knowledge–power. Despite official rhetoric about bolstering community involvement via CLEARmap, civilians play a negligible role in determining CLEAR’s data model. For one, all data are organized at the scales of beats and police districts, which work to restrict geographical imaginations to the microscale. In the Englewood CAPS meetings, all crimes are identified within one of the seventh district’s 15 beats. Using the maps, police read off crime data by the beat, block, and street intersection. Exclusive focus on the microscale also shapes the way residents identify themselves. In fact, regular participants at the meetings memorize the exact beat they live on and identify themselves as such before speaking. Residents constantly reproduce CLEARmap’s privileging of the microscale when speculating on causes of crime: “there’s abandoned buildings over there,” “they sell drugs in that parking lot,” “the street lights are broken.” The distribution of the maps instantiate the “scale-dependence of knowledge-power in GIS” (Kwan, 2002) and render the way residents perceive and articulate crime in accordance with the carceral positivism that characterizes the policing apparatus.
CLEARmap’s data model also determines what categories of deviance take center stage during discussion. About 90% of crimes tracked by CLEARmap are blue-collar “street crimes.” At CAPS meetings, resident grievances fall exclusively into categories of drugs, violence, and disorderly behaviors. As such, the geocoded subjects observed on CLEARmap printouts are perceived exclusively as criminal and sharply demarcated from the space in which they are depicted. And CLEARmap does more than merely set a differential relation between this subject and the space s/he inhabits; it sets an antagonistic relation between them. The point of geocoding individuals in CLEARmap is to aid the state and civilians in removing them. CLEARmap thus reinforces the reduction of negatively racialized surplus populations to states of “existential surplus” (Hong, 2015), as it represents them as existing thoroughly and permanently outside of civil society.
Moreover, at CAPS meetings, discussion about crime is articulated exclusively through the bureaucratic grammar of the police apparatus. This is due in part to CLEARmap’s looming presence at the meetings, which participants embrace as a means of providing scientific and thorough explanations for why crime indexes are high in Englewood. As a consequence the police practices that affect localized crime rates 7 and the network of forces that give rise to concentrated crime indexes are precluded from discussion. CLEARmap thus performs the ideological operation of positing effects (crime events) as causes (Yapa, 1998) and reinforces its function as an integument against critical comprehension of local conditions.
What is more, at CAPS meetings, CLEARmap executes a hegemonic function in which fragmentary information about crime is interpreted as comprehensive knowledge. The distinction is crucial. As Taylor (1990) observes, knowledge production involves synthesizing ideas into integrated systems of thought, whereas information production is characterized by extracting particular facts from a situation and treating them as independent. At the CAPS meetings, police maintain that the maps foster “a deeper understanding about what the streets really look like. [Residents’] information helps us do our job more thoroughly.” The ceaseless information about crimes in the district conveyed through the maps induces participants to interpret crimes as reified events whose casual mechanisms are exclusively local. At CAPS meetings, CLEARmap acts as a discursive shield that blocks structural interpretations about the causes of patterns found in crime data, which reinforces the positivist logic inscribed into the core of the carceral apparatus.
CLEARmap’s myopia notwithstanding, the maps handed out at the meetings are treated like exhaustive guides to understanding Englewood crime indexes. While they portray crimes as decontextualized, atomistic events, CAPS participants nonetheless embrace them as if they expand and deepen knowledge about local conditions. For many attendees, the maps are viewed as providing both the public and police with in-depth and holistic pictures of what’s happening inside Englewood. On several instances crime maps were attributed to providing a “fuller picture” of how and why crimes become spatially concentrated. As a participant noted, “we like to know everything that’s going on, on the ground. That’s the only way we’re going to be able to make a dent in what’s going on in [Englewood].” For residential participants at the meetings, maintaining a perpetual eye on the whereabouts of hotspots was viewed as the most important means of reducing crime. Emblematic of this perspective were typical responses to questions about the value of printed crime maps at CAPS meetings, which reduced Englewood to signifiers of policeable and punishable events: [the map] can show us a complete view of our community. We can see exactly where folks are committing crime, so that can help us organize to be more vigilant. I think every community should be using [GIS crime mapping]. (CAPS participant, 2015) With the maps we now know what’s going on – everywhere. I might already know about what’s happening on my block, or hear from my girlfriends what’s happening on [the other side of Englewood]. But the maps show us everything. So it’s useful to be able to see that. (CAPS participant, 2015)
Extending CLEARmap’s field of vision
CLEARmap does more than sculpt the way the public sees and interprets crime; it also invites them to feed police with information and thus extend the latter’s vision. This is crucial as differential surveillance has long served as a key ingredient to racialized social power, as it both engenders racialized subjects and locks them into positions in which they are ceaselessly supervised (Browne, 2015; Reddy, 2011). And GIS also influence how users view themselves in relation to geocoded problems and their preferred approach to addressing those problems (see Pickles, 2004; Sieber, 2000). CLEARmap thus bounds what type of subject positions users believe are available in the fight against crime, e.g. potential victims, police adjuncts, or even vigilantes. By enjoining residents to feed information to CLEAR’s database, CLEARmap paves the way for a networked regime of carceral power with capillaries that extend throughout the public sphere.
For starters, police mobilize residents to augment CLEARmap’s field of vision at CAPS meetings. The maps handed out at the meetings are employed by police to arrange residents into units of surveillance organized according to beat number. Civilians who speak during meetings to apprise police of crimes and disorder begin by identifying what beat they live on. On several occasions, attendees began to ask questions only to be interrupted by the officer or other civilian participants imploring the speaker to clarify her beat number. Asked why the beat number identification is so necessary to CAPS meetings, a long-time participant explained that specifying blocks and beat numbers: is very important because [the police] need as much information as possible to respond to the community’s concerns. We need to know the when and where because not everything is reported. It also creates a situation where residents get to know each other and build that type of trust … So luckily, [participants at the meetings] already know which beat they’re on. (P.O. at CAPS meeting, 2015) I’ve been coming [to beat meetings] for about 7 years. It’s important because it’s not just the police giving information, [residents] also tell them about things that might not be reported, or could be overlooked. There are a lot of issues with drugs or even gangs that [residents] see, but the police don’t.” (CAPS Participant, 2015) We give each other information about things we notice … things that might be related to other crimes. So, meetings are like putting the brains of the community and police together to solve problems. It’s not perfect but it helps [crime reduction]. (CAPS Participant, 2015)
Under conditions of neoliberal governance, this appeal to disadvantaged communities to take on state responsibilities has increasingly spread to criminal justice apparatuses (Garland, 2001; O’Malley and Palmer, 1996). CLEARmap thus functions as a formidable tool in expanding increasingly prevalent forms of community anticrime activism organized by police (see Patillo, 2007) and ensuring that civilians see and act in concert with prevailing modes of carceral power.
Crime maps online
This subject-forming function of CLEARmap was extended in 2008, when the CPD unveiled CLEAR’s online interface, “CLEARPath,” a public access web portal that was touted as a gateway to citizen participation in policing (Schuck and Rosenbaum, 2008). The first policing project funded by the MacArthur Foundation, CLEARpath offers a glimpse into the potential extent to which GIS crime maps might shape public perceptions of and participation in crime control as it disseminates the CPD’s knowledge–power through the Internet. While data about CLEARpath’s user base are not available, it is well established that miniaturization and growing accessibility of information technologies has increased the state’s ability to transmit its ideologically inflected information throughout the broader public (Haraway, 2000; Lyotard, 1984). CLEARpath provides a glimpse into what the meshing of digital technology and racialized carceral governance may portend, most notably its quiet extension through the network form.
From CLEARpath’s inception, the CPD has unambiguously maintained that the online application is meant to extend police surveillance via the public. City officials touted the application as a tool for revitalizing the public’s role in crime reduction efforts, overcoming “deep-seated suspicions and antagonisms” between police, racialized communities, and organizing disparate anticrime crime groups across the neighborhood and city (Kelleher, 2008). Moreover, CLEARpath was developed due to a growing sense among city officials that CAPS had lost the luster it had during the 1990s (Schuck and Rosenbaum, 2008). CLEARpath was thus meant to “enhance the role of the community in public safety through advanced information technology” and function as a “gateway for citizen involvement in community policing and homeland security” (Schuck and Rosenbaum, 2008).
City officials unveiled CLEARpath to the public as a tool that would enable communities to take on greater roles in crime control. “[Public access to] this type of data,” the president of the Metro Chicago Information Center said of CLEARpath, “is in very high demand from community organizations, and will forever change the lives of people working in neighborhoods to combat crime because they can target interventions in ways they couldn’t before, down the block [and] individual crime” (in Office of the Mayor, 2011).
In order to gain access to CLEARpath, civilians must register on the CPD’s website. Registered individuals receive regular crime reports via email, phone calls, and SMS messages. CLEARpath also allows civilian users to anonymously provide information about crime; report concerns; and access information about known/wanted offenders, gangs, and crime prevention services and techniques. It also allows users to instantly generate maps of 25 blue-collar crimes and three white-collar crimes, in addition to the locations of sex offenders, gun offenders, sex worker patrons, and “Block Clubs”—neighborhood groups organized to identify and discuss localized quality-of-life issues. CLEARpath also sports tabs for crime alerts, gang awareness, and terrorist threat levels. Furthermore, it allows users to report and map “community concerns” including gangs’ narcotics, prostitution, city services, trouble buildings, and “other” (see Figure 3).
Screenshots of CLEARmap’s online application. Source: http://gis.chicagopolice.org.
Police also encourage civilians to contribute information through CLEARpath so as to gain a more detailed view of beats and districts. Through online interactivity, the CPD maintains, police and residents can take a “joint problem-solving” approach to attacking crime. The online application allows citizens to report crimes; assist police in solving open cases; participate in the CPD’s problem-solving model; and browse the names of all adult arrestees, prostitution arrestees, sex offenders, and wanted persons. Police regard these online modules as a new and valuable source of information gathering, which extends the department’s data-gathering capacities. “You can have all the technology in the world,” a seventh district officer exclaimed, “but there’s ultimately no substitute for human intelligence. [Computerized crime mapping] is only gonna improve if the public can enter information more easily, with greater accessibility and user friendliness” (personal interview, 2015).
But despite rhetoric about bolstering community involvement with CLEARpath, civilians play a negligible role in determining the statistical categories it tracks and visualizes. CLEARpath’s data structure reconfirms the fact that racialized hierarchy is not only reproduced through explicitly racial classifications, but also involves a much more variegated taxonomic grid that casts negatively racialized surplus labor as incompatible with civil society (Lowe, 2015) and reinforces “relations of violence, uneven personhood, and non-equivalency” (Reddy, 2010). When asked what role the public has in influencing CLEAR’s data structure, a former member of the GIS team remarked: “to my knowledge CLEARmap decides its own inputs. It pretty much follows what the data says.” “We’ve done,” said an officer, “6 or 7 different press conferences … We’ve recently expanded some of the crime categories we allow citizens to report on the web themselves, but CLEAR really decided which categories.” Indeed all data submitted by the public are organized into five categories including crime tips, crimes, mug shots, most wanted, and community events. This input model ensures that CLEARpath facilitates a portable interface between the Internet and human individuals that enables the public to contribute to the proliferation of carceral surveillance and reduce negatively racialized surplus population’s to a state in which it is “perfectly legal to discriminate against [them] … in nearly all the ways that it was once legal to discriminate against African Americans” (Alexander, 2012).
Demonized to digitized
CLEARmap offers the latest one-dimensional caricature of racialized surplus populations and places in its three-dimensional presentation of space and time. Its puts Cartesian geometry in service of a state apparatus that represents racialized surplus populations solely through the lens of criminality, masks the material forces that engender crime rates, and preserves punitive solutions as taken-for-granted approaches to reducing these rates. Moreover, it has proven a formidable tool for mobilizing public perceptions of and participation in crime control, and conforming each to the directives of the broader carceral complex.
Contrary to official rhetoric about the objectivity and precision of GIS, there is no evidence that they have had meaningful implications for the racialized character of policing or punishment. In the summer of 2015, 250,000 pedestrians were stopped by police for furtive behavior—four times the number of New Yorkers stopped at the apex of stop and frisk when adjusted for population (ACLU, 2015). Though Chicagoans categorized as black make up 32% of the city’s population, they accounted for 72% of documented stops (ACLU, 2015). Moreover, the CPD had the highest number of fatal police shootings between 2004 and 2010—ranking ahead Phoenix, Philadelphia, Houston, and Los Angeles—66% of which involved the death of subjects classified as black. 8 Since the inception of GIS crime mapping, 43.1% of crimes recorded by the CPD are in Black Belt neighborhoods, with a standard deviation of 1.3. From 2005 to 2014, the percentage of prisoners categorized as black was held almost constant at 58.3% with a standard deviation of 1.1.
Avoiding temptations of technological determinism, it is evident that the development and deployment of CLEARmap has been coconstitutive with new horizons of racialized policing and surveillance. While policing and carceral control have long been racialized, new conditions of accumulation, urbanization, and digital technologies have converged to project the epistemologies, ontologies, and practices characterizing the carceral control of negatively racialized surplus labor throughout the urban fabric in unprecedented ways. Critical geographic investigations of this process will merit further engagements between subfields including, but not limited to, carceral geography, digital geography, critical data studies, and geographic engagements with race and ethnicity.
Footnotes
Acknowledgements
The author would like to acknowledge Angel Luis Veles, Shawn Fields, and Yoo Min Park for their assistance in preparing this manuscript. He would also like to acknowledge the blind referees for their constructive comments.
Declaration of conflicting interests
The author(s) declared no potential conflicts of interest with respect to the research, authorship, and/or publication of this article.
Funding
The author(s) disclosed receipt of the following financial support for the research, authorship, and/or publication of this article: This project received support from the Funding Initiative for Multiracial Democracy from the Campus Research Board at the University of Illinois Urbana-Champaign.