
Abstract
We use a time and motion study to understand how probation officers spend their time. What officers spend their time doing and whom they spend their time with demonstrates a deeper symbolic meaning of how the convicted should be treated, what is believed effective to change behavior, and informs the community about definitions of public safety. Explicitly studying officer time is a neglected area of research. We model a count variable of minutes per task as a function of offender, offense, and task characteristics using zero-truncated negative binomial regressions. Results show that officers spend significantly more time with higher-risk offenders, mixed results regarding domestic violence and sex offenders, and significantly less time with older and black probationers. Our intentions are to delve deeper into how officers spend their time to contribute to the development of an evidence-based model of corrections.
Introduction
The US correctional system is grappling with several challenges related to the growth in those under correctional supervision. Prisons and jails have grown from the near-century-long average range of 125 to 150 per 100,000 incarcerated adults to more than 700 inmates per 100,000 (Kaeble and Glaze, 2016; Garland, 2001). Incarceration has been linked to several long-lasting negative effects that include diminished political rights (Uggen and Manza, 2002), lost employment opportunities (Pager, 2007), and reduced quality of life (Comfort, 2005). Alongside the growth in incarceration rates there has been a little noticed movement of growth in community corrections populations as well (DeMichele, 2014; McNeill, 2013; Phelps, 2013).
Community supervision often is touted as a fix to the institutional corrections overflow. Penal reformists suggest that placing individuals on probation or parole is the solution to prison and jail overcrowding. For instance, the Pew Center On the States, other policy associations, and the government have created many opportunities for states to shift their emphasis away from incarceration toward community punishments. 1 However, what few people are discussing is the tenfold growth in probation since the 1970s, when the Bureau of Justice Statistics started collecting population data. In 1977 there were about 230 adults on probation for every 100,000 in the population, and by 2015 this number had grown to nearly 1701 per 100,000 (Kaeble and Bonczar, 2016). This population growth, especially alongside prison growth, poses unique policy challenges to scholars, citizens, and governments.
This puts probation and parole in a difficult situation when staffing is low and funding is limited. A central research gap in the evidence-based practices literature is further understanding the activities officers regularly complete. How long do officers spend on an office visit, visiting individuals in their homes or other settings, or completing administrative functions? In this paper, we address this gap in research by reporting the results from a time and motion analysis of two-dozen county-level probation agencies.
First, we present the use of time and motion studies in community corrections. Second, we review the methods used for conducting the time and motion study. Third, we present descriptive statistics of the task analysis and results from a series of truncated negative binomial regression models. The task analysis provides a snapshot of the specific tasks and how long officers spend on those tasks, and the regression models offer some understanding of the relationship between times spent on tasks and offender demographics, risk levels, nature of the task, and type of offense. The findings demonstrate that probation officers report spending nearly equivalent amounts of time with probationers regardless of risk level. We identify a set of limitations and weaknesses related to the study methodology, and suggest policy implications that can reasonably be drawn from the findings. In the end, we situate our study within the punishment and society literature to suggest that probation agencies are organizational units that provide the rules and policies that create shared meaning systems and action scripts that shape officers’ daily activities. The tasks regularly completed by officers demonstrate how officers translate organizational mandates into the everyday practice of probation. The findings suggest that probation officers shape their daily activities to emphasize face-to-face interactions with probationers. They may, however, have limited time to engage individuals as much as they would prefer, but they appear to recognize the need to interact with individuals.
It’s not about numbers. It’s about what officers do
Community supervision administrators grapple with complex issues to ensure that offenders are supervised at required levels. Can they hire new staff if some staff leaves? What sorts of tasks are contracted versus completed internally? Offenders’ needs and risks are highly variable, with some offenders having substance abuse problems, others having trouble locating and remaining employed, and others with various mental health conditions. Making situations more complicated is the fact that many offenders have various combinations of such problems. The compilation of these characteristics along with other criminal history factors come together to shape an offender’s relative risk of various negative outcomes (e.g. re-arrest, revocation, re-incarceration).
In the 1980s, the National Institute of Corrections (NIC) utilized the Model Case Management Systems Project to move the country in the direction of a workload model (see Clear, 2005). 2 The NIC model was never fully embraced and is rarely considered today. The American Probation and Parole Association (APPA) addressed the workload/caseload issue, in the 1990s, in which total caseload was a function of case priority (high, medium, or low) and hours each month devoted to each of these types of cases (ranging from 4 hours to 2 hours or 1 hour, respectively). Separating workload and caseload as distinct aspects of study and concern reflect what is referred to as the risk, needs, and responsivity model (RNR). Community corrections supervision practices are influenced by the research by Andrews and Bonta (2010), among others (e.g. Taxman et al., 2004) that have found that more intense levels of supervision should be reserved for those presenting a higher likelihood of having a negative supervision outcome (e.g. re-arrest, revocation). Similarly, those with lower likelihoods of failure should be sentenced to fewer conditions of supervision. The RNR approach recognizes that there are not only static (i.e. unchanging) features that predict risk, but that supervision practices should focus on the dynamic elements of an individual’s life to reduce likelihood of a negative outcome. This could be in the form of substance abuse treatment, employment training, education, and other deficits that increase the probability of a negative outcome. These needs are targeted at the individual by being responsive to each person’s learning capacity and readiness for change. Taking these elements of RNR together, NIC, APPA, and others suggest community corrections officers should spend more time with higher-risk individuals (see Burrell, 2006, and Table 1).
Supervision caseload approach (APPA, 1991).
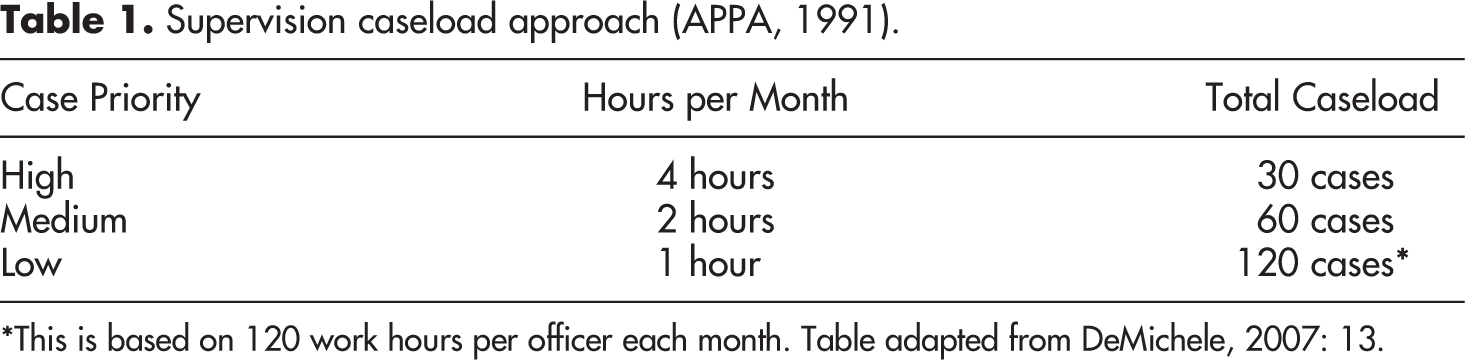
*This is based on 120 work hours per officer each month. Table adapted from DeMichele, 2007: 13.
A workload model recognizes that offender and jurisdictional differences can result in more or less officer time spent per offender. The APPA model above suggested that ‘high’ level offenders need twice the amount of time to supervise (according to agency requirements) than a ‘medium’ level offender, and four times the time required to supervise a ‘low’ level offender. Although this model suggests that probation agencies should move away from an approach that only counts cases, it is a simple formula for determining officer caseload standards. Simply, how do we know that high-risk offenders take twice as long as medium-risk offenders? What tasks do officers complete with high-risk offenders that necessitate twice as much time? This is not to suggest that higher-risk offenders do not or should not take longer to supervise, but there is a lack of empiricism documenting the tasks officers complete with offenders.
Measuring officer workload is a necessity for determining officer staffing levels, and such an approach can be used to inform policy. Workload studies have been used in probation for at least the past 40 years. In fact, Miles (1969) pointed out that time and motion studies were becoming prevalent in probation and parole. He expected to see a greater emphasis placed on workload measurement. Strangely, however, such evaluations have been sporadic at best 3 (Miles, 1969). DeMichele, Payne, and Matz (2011) averaged the results of several workload studies completed across the country to provide time estimates according to type of offense and risk level. They identified time ranges for 17 case types across low-, medium-, and high-risk offenders, and identified potential barriers that officers may face (e.g. travel times, broken equipment). DeMichele et al. (2011) did not measure actual times to complete tasks by officers, but relied on time and motion studies completed since the 1990s.
Replacing caseload with workload: Taking officer time seriously
The basis of this study is to understand the daily activities of probationer officers. In this sense, we treat time as the dependent variable to learn how time is organized, used, and distributed among several probation officer tasks. Studying time in this way can provide insight into what is valuable, required, and of interest to officers and agencies. To date, we are unaware of any previous research that theorizes time within a community supervision setting. This is surprising because time has long been considered foundational to cultural, social, psychological, and organizational spheres of life (Hall, 1983; Schein, 1992), and something that Sorokin and Merton (1937) found foundational to sociology.
We borrow from previous organizational studies literature to theorize how time is integral to probation organizational cultures (e.g. Bluedorn and Denhardt, 1988; Clark, 1985; Das, 1993). Our intentions are to explore time (Das, 1993; Lee and Liebenau, 1999), first, to document how officers spend their time, and, second, to investigate in what ways offender demographics, risk levels, current conviction, and the nature of the task shape the amount of time officers spend on tasks. This will allow us to contribute to criminal justice research, more broadly, and community corrections research, more specifically, by uncovering how individual, crime-based, and organizational factors influence how officers understand, experience and use time to inform research, practitioner, and policy communities about the nature of probation work. And, we believe, understanding officer time in this way can inform evidence-based practices and future efforts to increase the efficacious and ethical treatment of probationers.
The scarcity of research on officer time is surprising. How we spend time says a lot about individuals, organizations, and societies (Das, 1993; Lee and Liebenau, 1999; Sorokin and Merton, 1937). One organizational scholar studying time drives this point home by stating that ‘there is probably no more important category for cultural analysis than the study of how time is conceived and used in a group or organization’ (Schein, 1992: 114). How officers spend their time suggests what society deems worthwhile in the treatment of the criminally convicted. And, in some ways, this is a statement about what we deem worthwhile regarding our treatment of the socially marginal, given the disproportionate presence of the poor, minority, and young with criminal justice status (Lynch and Sabol, 2000; Western, 2006). What officers spend their time doing and whom they spend their time with demonstrate a deeper symbolic meaning of how the convicted should be treated, what is believed effective to change behavior, and informs the community about definitions of public safety.
Our research, in some ways, is motivated by the previous well-documented studies investigating intensive supervision programs (ISP). Petersilia and Turner (1991) conducted a multi-site randomized experiment comparing individuals placed on caseloads that were reduced in size but more intensive with those supervised by ‘probation as usual’ methods. They concurred with previous studies on ISPs (e.g. Clear and Hardyman, 1990) and found no difference in arrests for new crimes, but significantly higher technical violations for the treatment group. Their research provided an implicit understanding that as agencies shifted their goals and the organizational culture toward enforcement, officers would spend their time performing enforcement-oriented tasks that resulted in higher violations. Paparozzi and Gendreau (2005) conducted a quasi-experiment comparing regular parole supervision with parolees placed into an intensive supervision program that was balanced with treatment, programming, and concerned with pro-social behavior change – i.e. the balanced approach (see also Skeem and Manchak, 2008). They found that parolees on the balanced supervision caseloads (i.e. supervision styles that emphasize an equal or balanced emphasis on treatment and enforcement) had significantly lower arrests and violations. More recently, Jalbert and Rhodes (2012) randomly reduced officer caseloads within probation/parole agencies (in Oklahoma) deemed ‘evidence based’. These agencies, similar to Paparozzi and Gendreau (2005), utilized motivational interviewing, risk and needs assessments, and directed individuals to substance abuse and cognitive behavioral therapy. The individuals supervised on the reduced caseloads received significantly more treatment services, had more interactions with officers, and had lower recidivism rates, but they had higher revocation rates.
This research hints at crucial insights about the importance of officers’ daily activities. The research suggests that supervision styles that integrate treatment into their enforcement regimes have the best chance of improving outcomes, but it is not a forgone conclusion as replication is needed and the findings are mixed regarding technical violations. We need to know more about the specific tasks that officers perform, so that when we claim that officers are ‘evidence based’ we can know this means that a bulk of their day involves officers performing tasks that are shown to improve offender outcomes. The reality is that officers are required to complete a host of activities that have little to nothing to do with improving supervisee outcomes. For instance, sitting in court for several hours, completing unrelated paperwork, and attending to other administrative duties may potentially be unrelated to improved probationer outcomes. Of course, these tasks are required, but they are time consuming and they require agency resources.
We investigate the offender, case and task characteristics that may influence how long officers spend on certain tasks. Our central variable of interest is risk level. It is hypothesized that officers will spend more time with individuals at higher risk. Extra-legal factors such as age, race, and gender will potentially influence officer task time. We hypothesize that, given the expected higher criminogenic needs, minorities, males, and younger probationers will have higher task times. Lastly, we expect the type of case to influence the length of time officers spend on tasks. We expect that sex offenders and domestic violence offenders will have longer expected times compared to other offenders.
Methods
We were approached by a single state to conduct a workload evaluation of probation supervision. The state has county-based administration of probation, and we needed to identify interested and willing participants for the workload evaluation. We worked with the state’s probation association to email a short survey to probation chiefs to determine the number of officers and offenders, the use of specialized caseloads, the use of electronic monitoring, average officer to offender ratios, and the level of interest to participate in the study. The state’s probation association emailed the survey using their letterhead and sponsorship. This resulted in 27 departments out of 90 departments indicating interest in participating in the workload evaluation.
Once we received the contact information of chiefs interested in participating in the study, one of the authors conducted semi-structured telephone interviews with all the probation chiefs. The telephone interviews lasted between 30 and 70 minutes, and allowed us to inform the chiefs about the goals, strategies, and burden of the project. Two agencies declined to participate after hearing more about the study, and prior to launching the data collection one department was forced to withdraw due to a natural disaster. This left 24 county-level probation departments to participate in the study.
The telephone interviews allowed us to learn about the type of tasks that each department completed. We developed a list of over 200 specific tasks that was distributed to all participating chiefs (and their designates) for review, edit, and suggestions. After a review, this list was reduced to 69 items, and after a pilot test of the task time collection form it was updated to include 104 total items used for the data collection. The telephone interviews allowed us to identify officers to participate in the research. Given that several of the departments are small – having fewer than 20 officers – most of these departments dedicated their entire supervision staff to participating in the data collection. 4 The departments, on average, had 22 officers. The second sampling stage sought to minimize role duplication. For instance, if a department had multiple officers that oversaw intake or completing reports, it was unnecessary to include all of these people because our research design focused on the tasks completed, not the individual.
The data collection tool was a password protected online form that recorded the task completed, the amount of time to complete the task, and officer and offender information. The task time form provided drop-down menus to reduce officer burden with the 104 specific tasks indicated, but these tasks were grouped into broad categories that fit within these categories. The data entry was anonymous, and the project was not subject to human subjects review as this was intended as an administrative evaluation. The online task time forms were piloted for two weeks, and reported data were collected for a one month period. The pilot test proved to be a needed process as we fielded hundreds of questions from participants on substantive and technical questions about the task time forms. Two researchers responded to all substantive questions, the contracted web-developer responded to all technical questions, and we compiled all questions into a frequently asked questions (FAQ) and answers document. The FAQ and instructions were distributed to all participants via email, they were updated during the data collection as needed, and they were uploaded as a PDF on the online task form site.
Findings
The time task forms were developed to measure how long, on average, it takes to supervise offenders within specific groups by case and supervision type, and risk level. Officers recorded nearly 2.1 million minutes or 34,957 hours over the course of one month of data collection, with an overall mean time per task of 28.22 minutes. We start the analysis by reporting the task analysis to capture average times per task by risk level before disaggregating the data and presenting the regression models.
Task analysis
In this section, we report the average minutes spent on each task by risk level. The risk levels identified by the state-based advisory board match their risk assessment instrument categories. In Table 2, the total average across all risk levels is provided in column 1 (total); in column 2, the average minutes for those entering supervision – pre-risk (P-R) – but who have yet to be assigned a risk level are provided; and in column 3, we report the average minutes for individuals on administrative supervision. 5 In columns 4 to 6, we report the average minutes per task for those in the low, moderate, and high-risk categories. We collapsed the six specific risk levels for ease of reporting and because there were several tasks that had low cell counts without collapsing. Further, we believe that these categories capture similar propensities to recidivate.
Task analysis – average minutes per adult supervision task by risk.
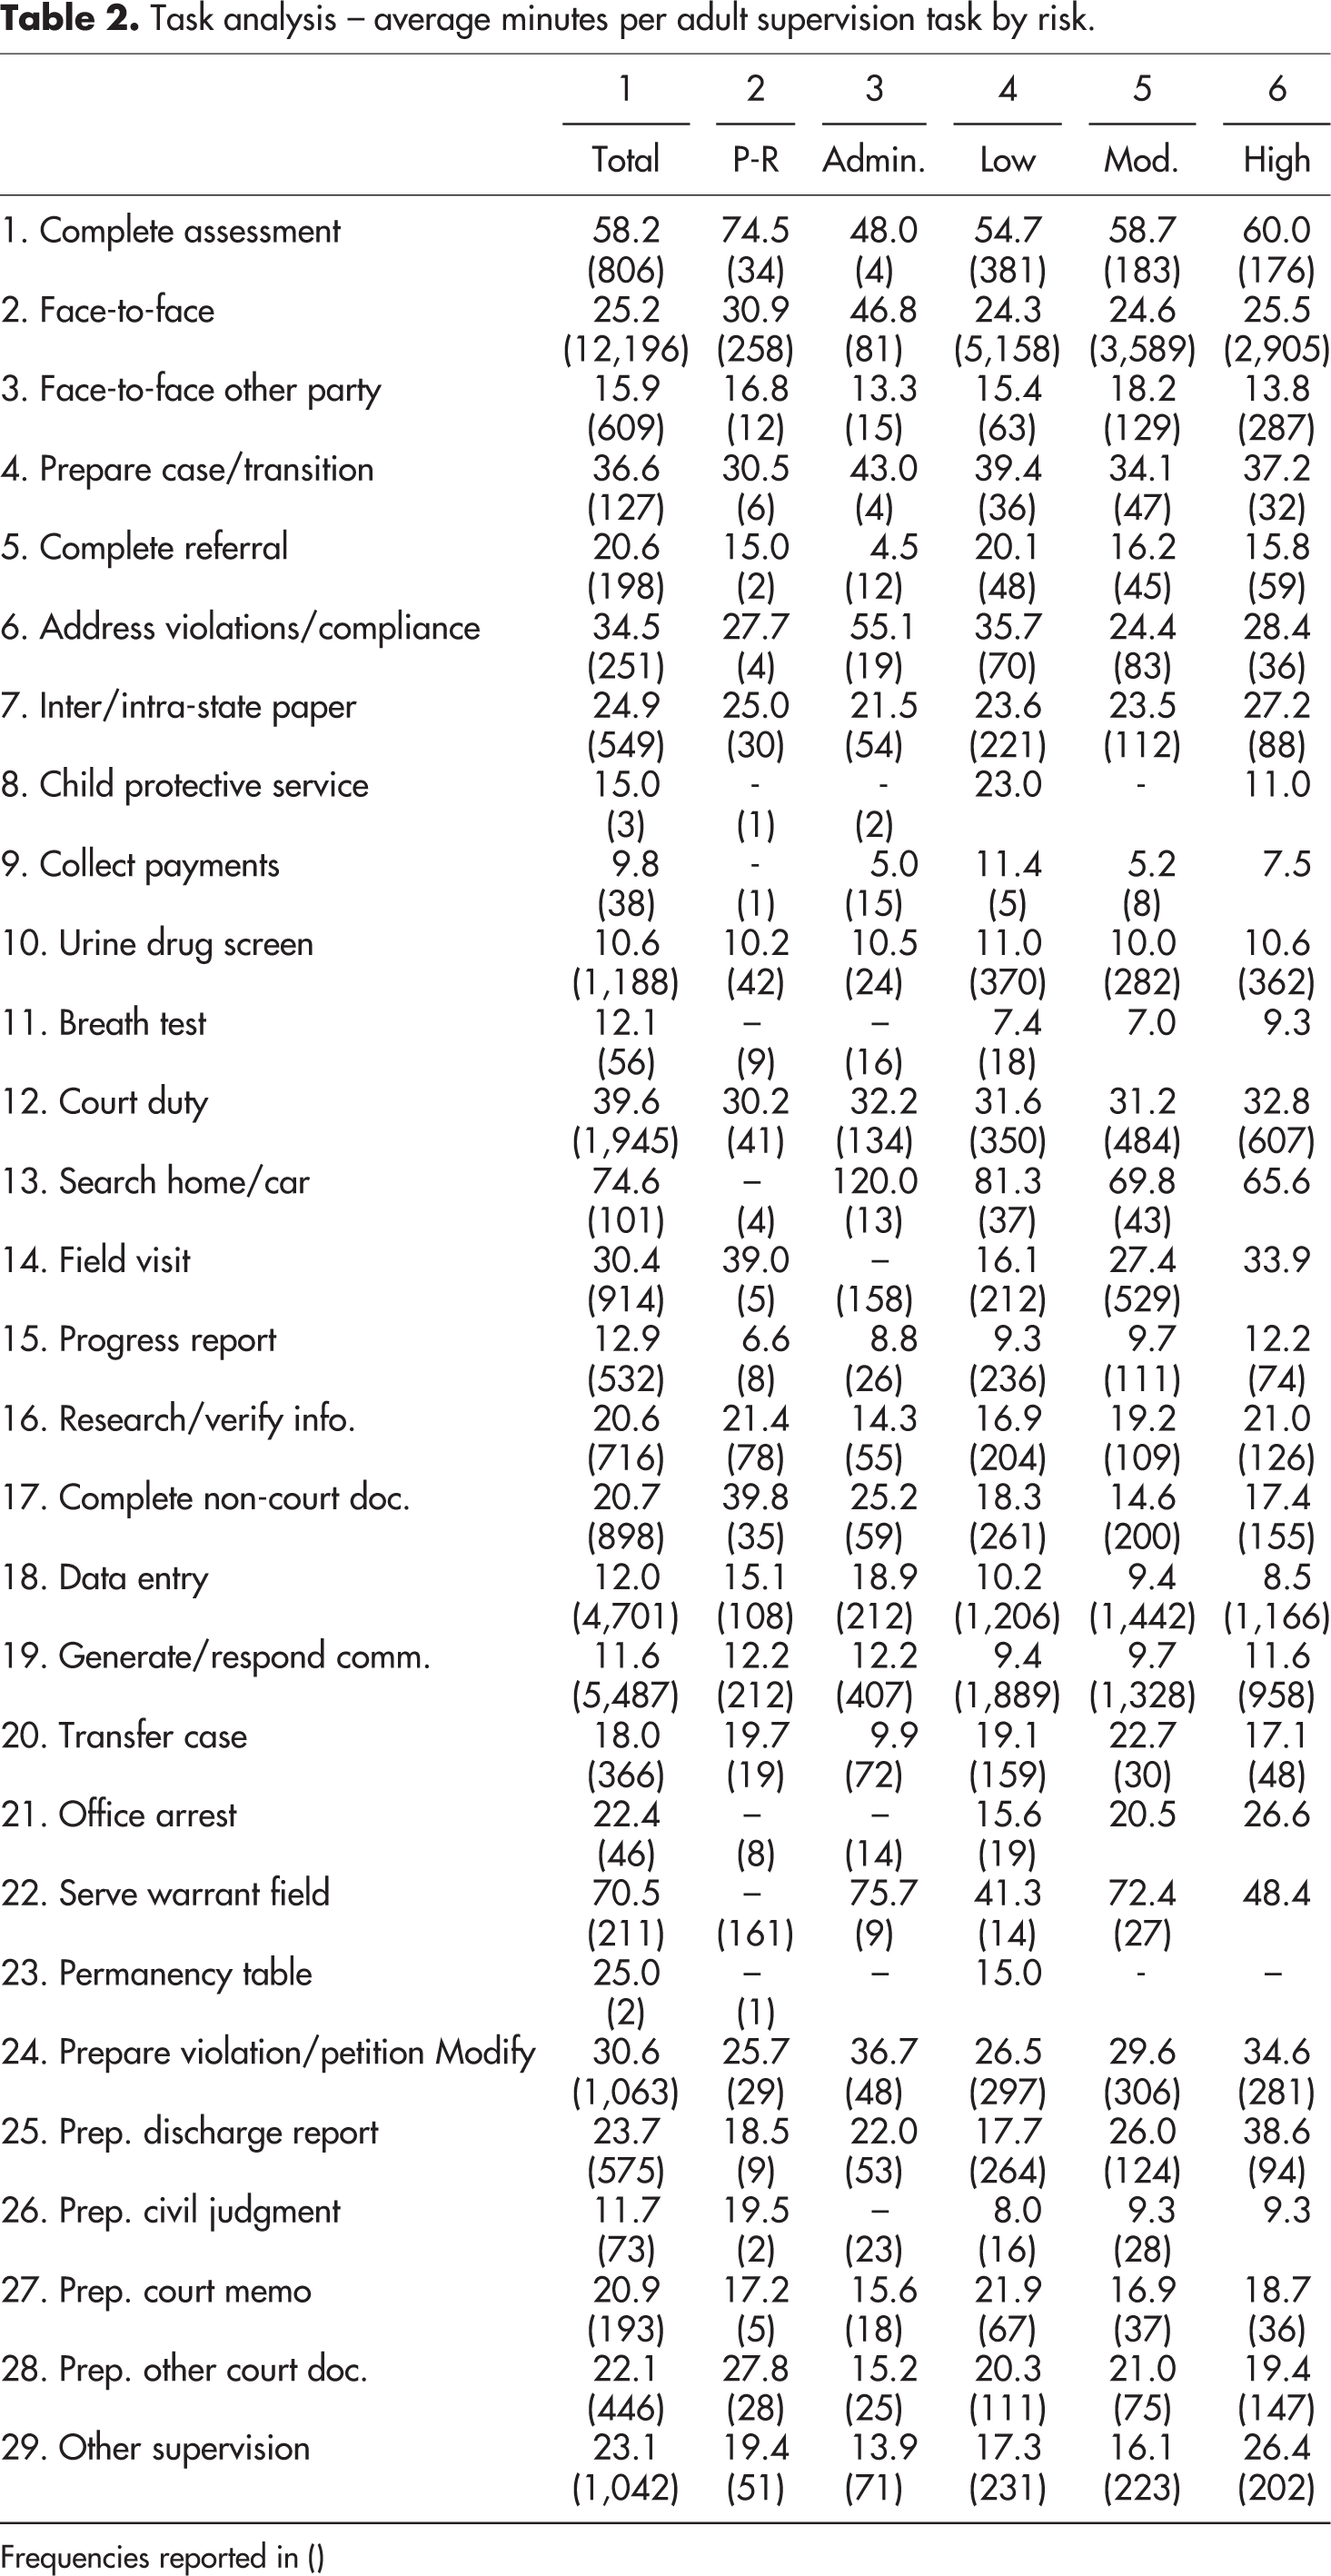
Frequencies reported in ()
The task analysis gathered times for 104 specific tasks across the five risk areas and the overall average. This produces 624 risk by task categories (6 risk levels x 104 tasks), which rules out summarizing each of these areas. It is beyond the scope of this paper to fully report on all of the 104 tasks for which times were recorded. Instead, we provide the average times by risk for the 29 supervision tasks. A central aspect of probation supervision is interacting with offenders and others involved in the case. And we see with tasks 2 and 3 that officers spend a bit less than half an hour (
Risk assessment
Probation supervision has changed significantly as agents spend less time in the field and more time completing risk and needs instruments and pre-sentence reports. The risk assessment instruments were disaggregated into five essential elements: interview, screener, scoring, modification, and data entry. We report the average times for each element as well as the overall average minutes spent by risk level. Initially, we expected that higher-risk offenders would take longer to complete risk assessments as they would have higher criminogenic needs that might require officers to spend more time to understand how best to supervise these individuals. The data only partially support this assumption.
The analysis reported in Table 3 provides average times by risk and type of risk assessment activity for adults. For those outside of the community corrections field, risk assessment may easily be thought of as a single activity of completing a form or answering questions on a computer screen. But the state-based advisory board identified five distinct elements needed to complete a risk assessment. The interview process alone took more than three-quarters of an hour (
Average minutes spent on risk assessment.
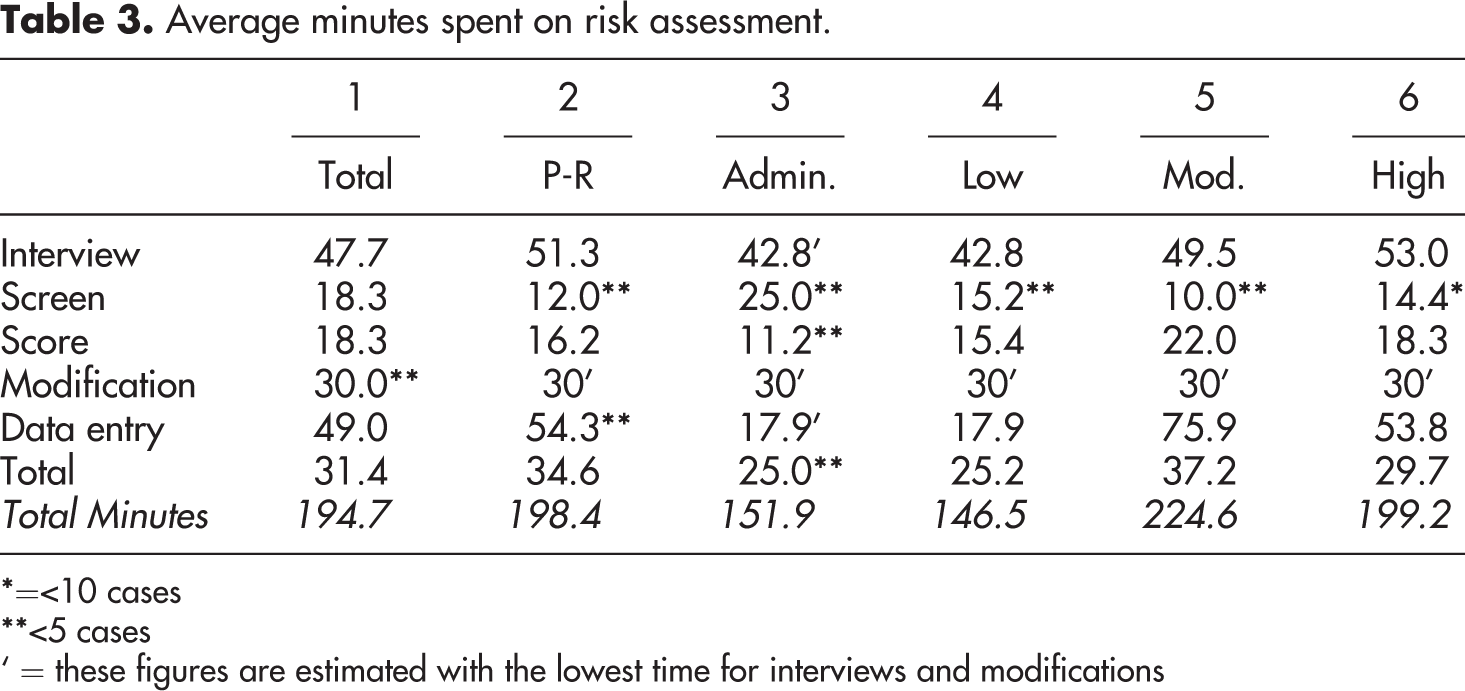
*=<10 cases
**<5 cases
‘ = these figures are estimated with the lowest time for interviews and modifications
Pre-sentence reports
In these jurisdictions, probation officers were responsible for completing the pre-sentence investigation reports. The phone interviews with chiefs revealed that pre-sentence investigations were a major resource issue for each agency that required several hours of an officer’s time. These instruments were divided into their elements to understand how long parts of the instruments require, and these elements are summed to reported estimated average total time needed for pre-sentence reports similar to the risk assessment analysis above.
8
Table 4 shows that pre-sentence instruments are the most time-consuming aspect of probation work. For example, officers spend about one hour on several tasks including interviewing (
Minutes spent on pre-sentence reports by risk level.
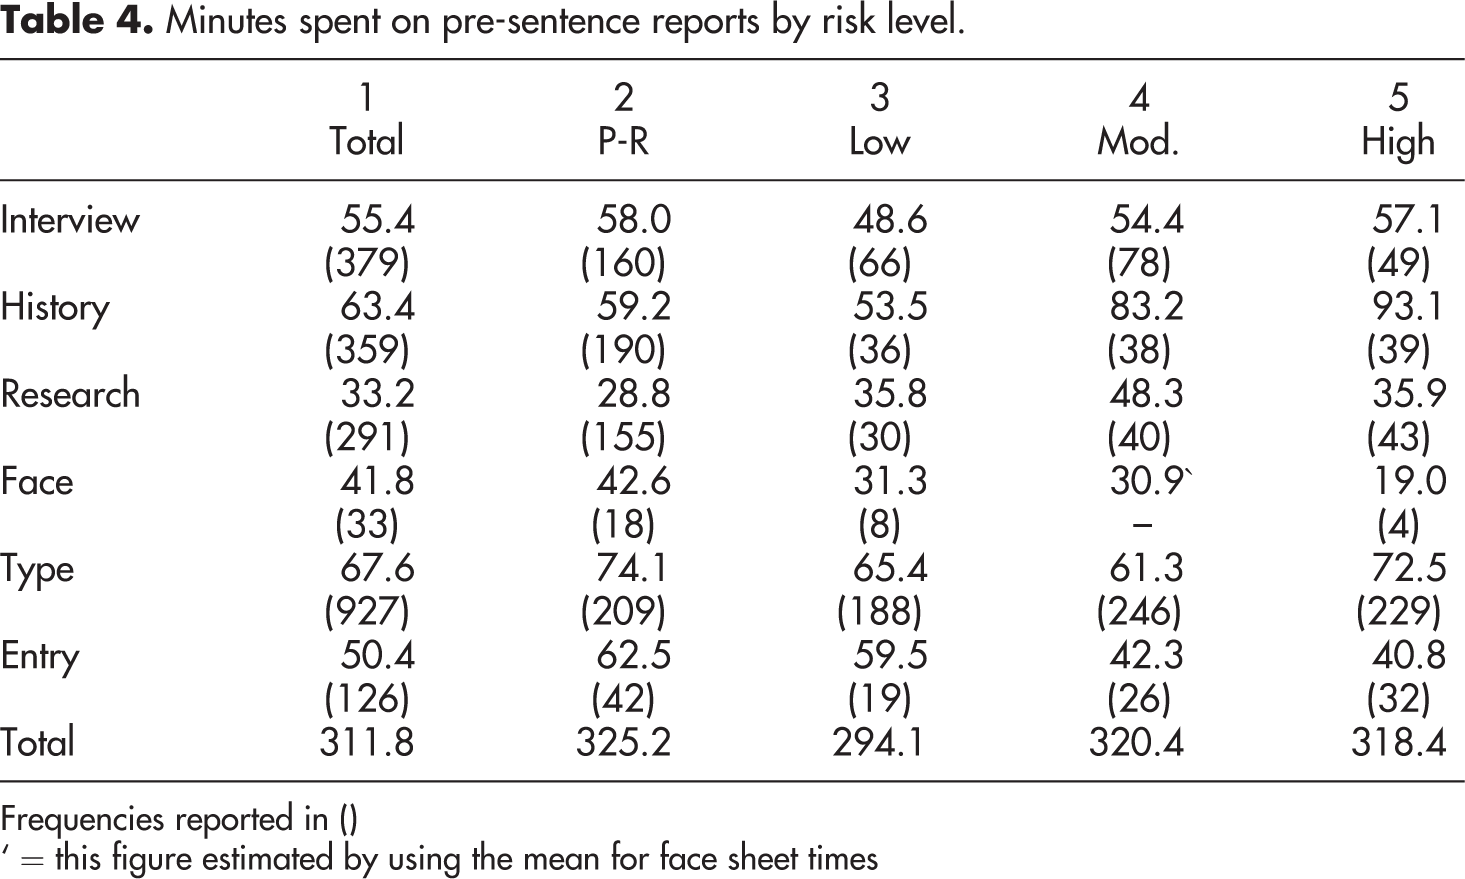
Frequencies reported in ()
‘ = this figure estimated by using the mean for face sheet times
The total amount of time invested in pre-sentence instruments, on average, is close to five or six hours. The total times across risk groups cluster just slightly above the grand mean for pre-sentence reports, with those yet to be assigned a risk group taking slightly longer to complete (
Non-case-specific task analysis
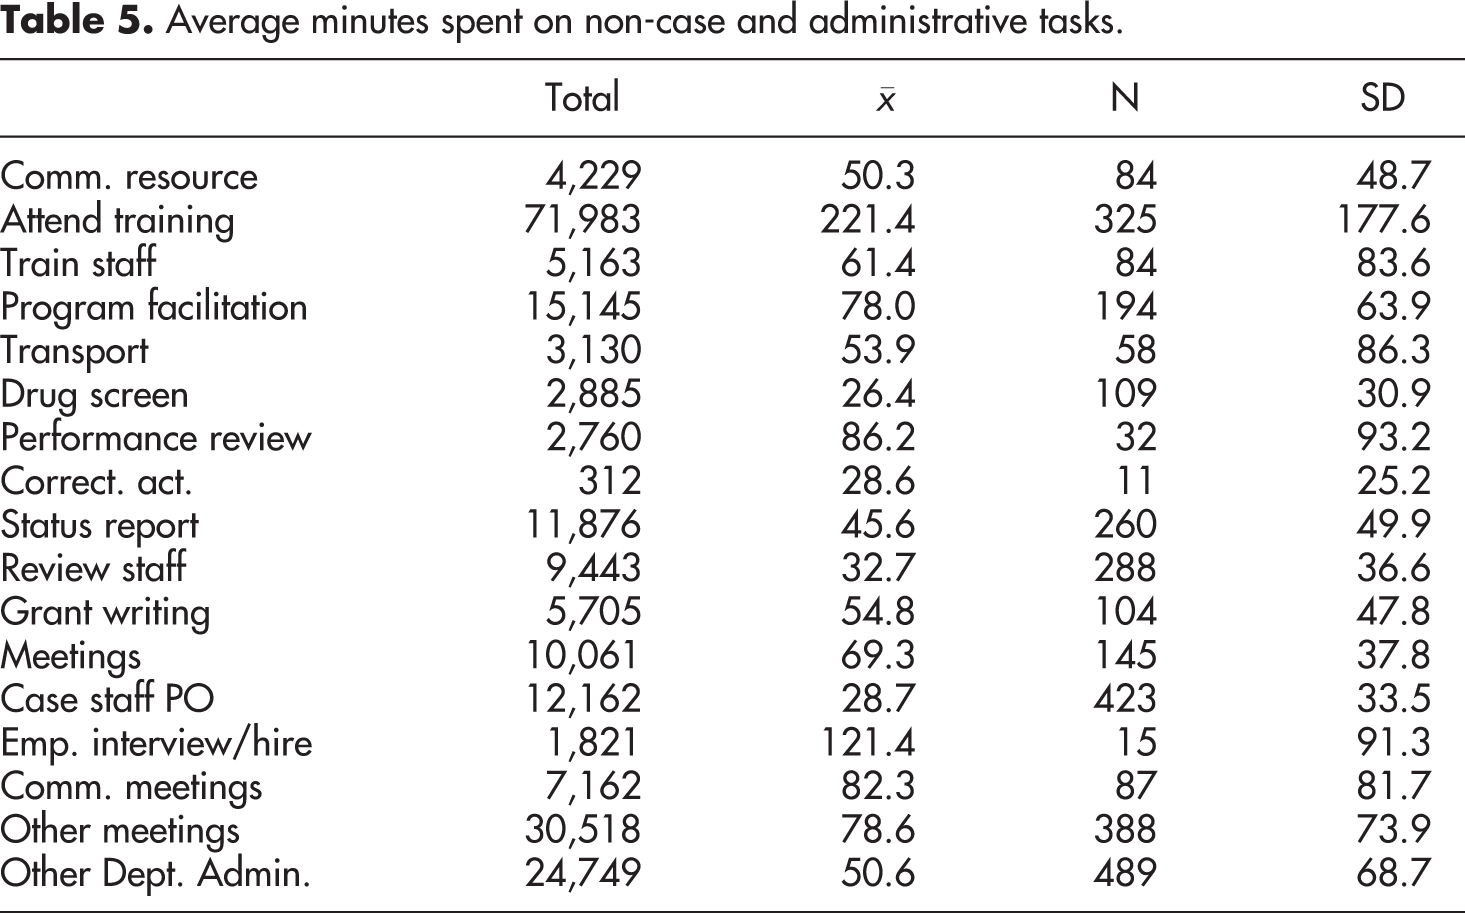
A serious concern for workload studies is to calculate the time needed for non-case-specific and administrative tasks. Given the nature of these tasks, we only report overall average time requirements as risk-specific-times are illogical. The times reported in this section are intended to provide some estimate of how much time officers spend doing non-case and administrative activities. During the data collection, officers recorded 71,983 minutes attending training, 15,145 minutes with program facilitation, 5163 minutes training other staff, 4229 minutes engaging community resources, 3130 minutes transporting clients, and 2885 minutes operating the drug screening call system. Table 5 reports the often-overlooked aspect of probation work that involves various department administrative tasks. There were 219,104 minutes or 3651 hours recorded for administrative and non-case tasks. The bulk of these minutes involved meetings and completing additional paperwork. Previous scholars have pointed out that one of the biggest changes to probation work is the amount of time spent on administrative tasks (DeMichele et al., 2011).
Average minutes spent on non-case and administrative tasks.
Equipment management: Task analysis
Another issue facing probation supervision is the amount of time spent on equipment management. These elements identified tasks related to managing electronic monitoring or global position satellite systems focusing on general equipment issues, and do not include time needed to respond to alerts, alarms, and violations. Table 6 shows that officers spend a little over two hours (
Task analysis – Average minutes per equipment management tasks by risk.
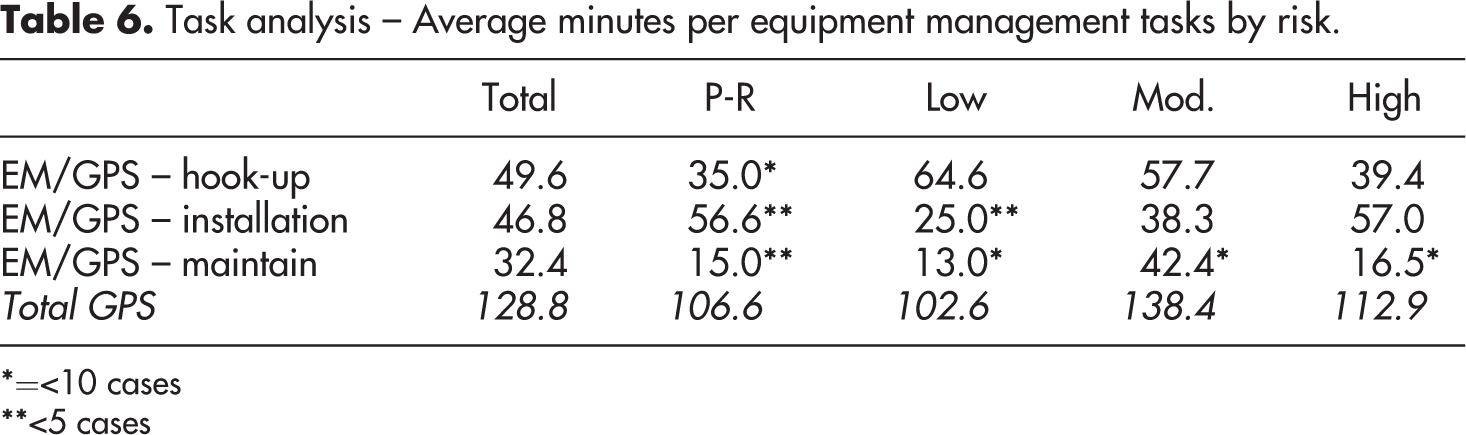
*=<10 cases
**<5 cases
Negative binomial regression models to explain time spent on tasks
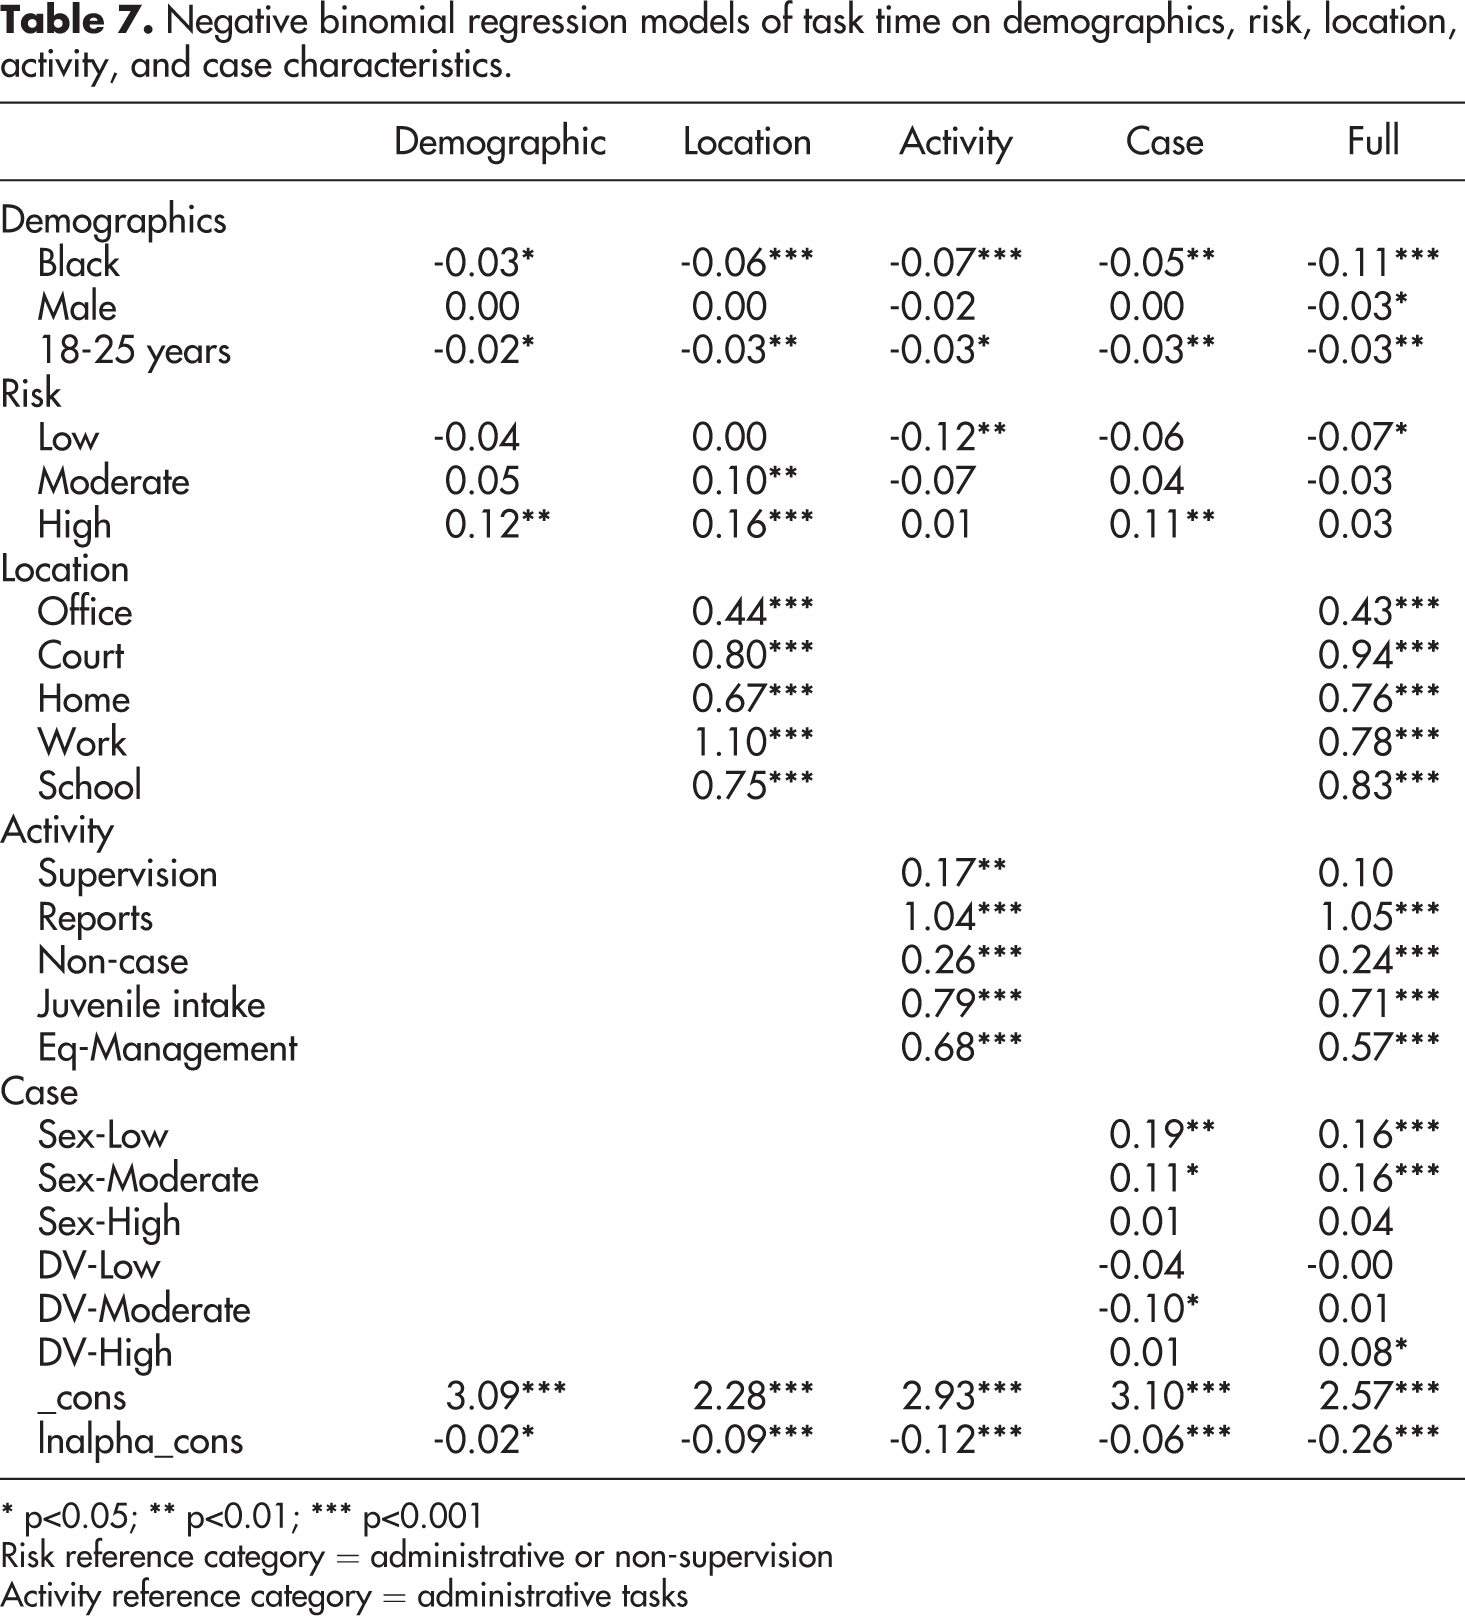
Up to this point, we have provided a descriptive analysis of the amount of time spent on tasks, but we want to understand if there are contextual factors that affect the amount of time spent on tasks. That is, do specific offender, task, and case characteristics influence the amount of time spent on tasks? Table 7 reports zero-truncated negative binomial regression models using the time in minutes as the dependent variable. This variable is over-dispersed (
Negative binomial regression models of task time on demographics, risk, location, activity, and case characteristics.
* p<0.05; ** p<0.01; *** p<0.001
Risk reference category = administrative or non-supervision
Activity reference category = administrative tasks
The general Poisson distribution in equation 1 is:

In this model, μ is the expected number of minutes an officer spent on a task, and y is a random variable indicating the actual number of minutes observed within the sample. The Poisson distribution explains the relationship between the expected count, μ, and the true probability of minutes observed within the sample, y, and μ is the sole parameter defining the distribution (Cameron and Trivedi, 1998; Long and Freese, 2006: ch. 8). 11
In Table 7 we report five regression models to understand the relationships between the amount of time officers spent on tasks with offender characteristics, context of task, nature of the activity, and case characteristics. All the independent variables are dichotomous (0, 1) except for risk, which ranges from 1 to 4 with higher numbers indicative of greater risk level, with the administrative or non-supervised level used as the reference category. Each of the models includes race, gender, age, and risk variables to provide a baseline model. Table 7 reports the estimated negative binomial regression coefficients that can be interpreted as representing the change in the log of the expected minutes per task for every one unit change in the predictor variables, net of the other variables in the models, and these coefficients can be easily converted to incidence rate ratios by exponentiation.
The demographics provide interesting findings suggesting that officers, on average, spend less time with black and younger probationers per task. Probation officers spent between 3 per cent and 11 per cent less time per task with black probationers compared to probationers of other races. 12 We want to know how risk level is driving officer time. In two of the five models, low-risk probationers received between 7 per cent and 12 per cent less time per task compared to those classified at the administrative (or unsupervised) level. There was one significant difference between moderate-risk probationers in which tasks took 10 per cent longer. In agreement with evidence-based practices literature, we found that the high-risk probationers had between 11 per cent and 17 per cent longer times compared to tasks with the unsupervised probationers.
The location model suggests that tasks conducted at a probationer’s work (in model 2) and those in court (in model 5) are associated with 3.00 (exp (1.10) and 2.22 (exp (0.80) longer expected times. In the activity and full models, reports (e.g. assessment and pre-sentence reports) are associated with a 2.82 longer expected time per task compared to administrative tasks, net of other variables in the models. Supervision tasks had a 1.18 (exp (0.17) longer incidence rate in the activity model, but this effect washes out in the full model, whereas the reports variable coefficient becomes slightly stronger in the full model.
The case type variables are binary indicators of individuals on supervision for a sex offense or a domestic violence offense and whether they are low, moderate, or high risk. One might expect these indicators to be related to longer times to complete tasks, 13 but the results provide a mixed picture. Low- and moderate-risk sex offenders were associated with longer per task times but, strangely, high-risk sex offenders were not. And the domestic violence probationers have significantly longer times for the moderate-risk level in the case model and for the high-risk level in the full model.
To better understand how risk level is related to the amount of time officers spend on tasks, we calculated the expected average number of minutes spent on task by risk level. These predicted times were calculated following the full model and hold all other variables at their means. 14 The expected counts showed that high-risk probationers had the longest average times at 23.3 minutes, low-risk probationers had the lowest times at 21.2, and moderate-risk probationers fit in between these other risk levels with 22.1 minutes on average per task. These data were collected over one month and essentially demonstrate that, on average, officers spend nearly identical amounts of time with probationers regardless of risk levels.
Discussion
We have reported results from a time and motion study to demonstrate how probation officers spend their time. The data show that officers spend much of their workdays completing reports and assessments, which makes it difficult for them to interact with probationers in the community. Community supervision was intended to be a person-focused occupation in which officers are to engage offenders, but there is little time (or financial resources) for that to happen. Limited resources and burgeoning workloads place the community corrections field in a difficult position. During phone interviews with probation officers, it was stressed that risk assessments and other reports were required by statutes, and interviewees were frustrated by the over-utilization of these reports. Instead, they wanted to get ‘in the field’ to work with probationers in the community. We also found that officers spent slightly less time with black, male, and younger individuals.
First, on the surface, the amount of time spent on various tasks calls into question the utility of caseload models. In theory, low-risk offenders need less time spent with them. Such an assumption is the basis for assigning so many low-risk offenders to one probation officer. In many cases, those supervising low-risk offenders will supervise four or even five times as many offenders as those supervising high-risk offenders. However, specific supervisory tasks do not take four or five times less to complete. In the end, officers presumably end up juggling workloads to supervise their caseloads, with nearly identical times spent regardless of risk level.
For professors, an analogy might be to compare large lectures with small seminar courses. Professors cannot teach the two types of classes the same way (although professors are given the same amount of time to teach the two types of classes). Professors will use different strategies based on the size of the course. Probation officers, in comparison, may need to use different strategies because of the size of their caseload. It is not clear, however, if probation officers are given the tools they need, or the preparation they need, to use different strategies with various offenders.
Finding that officers spend less time with black offenders than other offenders warrants some attention. There are a few possible reasons why this discrepancy appears. For example, it could be that certain officers interacted with black offenders more often and these officers spent less time with all offenders. Or, it could be that other officers do not ‘connect’ with black offenders as much and these weaker bonds may result in less time per offender. It could also be that black offenders were more prone to be lower-risk offenders and required fewer resources from their probation officers. Such a question is beyond the scope of our study, but this is a question that should be asked (Gabbidon, 2010).
Our findings also point to the need to examine ‘evidence-based’ research more broadly. Evidence-based research focuses on how programs work. Missing from this research in the probation literature are examinations of what officers do and the time it takes officers to complete specific tasks. More research is needed to identify what officers are doing to develop realistic tools to meet the full potential of the community supervision field. The time and motion design provides one method for community corrections scholars to investigate the things that officers do on a day-to-day basis. Although this approach is common in engineering, nursing, and other fields, it is seldom used within criminal justice research. This approach requires researchers to fully understand the nature of tasks that officers complete.
Admittedly, this research is limited to the departments and officers willing and interested in participating. The study design included daily reports of estimated time spent on each of the designated tasks. It is possible that officers incorrectly recorded their time in various ways. For instance, they may have over- or under-estimated the amount of time it took them to complete various tasks. These are self-reported estimates of time usage and we provided detailed instructions, FAQs, and reminders requesting officers to regularly check their watches/clocks prior to and after a task – with supervisors also providing reminders. We have no way of knowing the nature of error with time reporting, but the time reporting provides a glimpse into what frontline probation officers perceive as to how they are to perform community supervision. Organizational sociologists have regularly identified the importance of time to demonstrate what different organizational fields prioritize, value, and prefer. Simply by studying how officers use their time we gain an important glimpse into their interpretation of what it means to enact community supervision policies and mandates. These frontline performances shape the lived experience of supervision for probationers. The time and motion study reported here is an attempt to delve deeper into how probation officers translate organizational culture into penal culture.
Conclusion
The punishment and society scholarship provides sociological frameworks to demonstrate the linkages between social and cultural preferences and punishment practices (e.g. Feeley and Simon, 1992; Garland, 2001, 2014). This body of literature is used to study a wide range of topics that address theoretical questions to offer empirical understanding of how social transformations, structures, and institutions shape policy preferences and outcomes. Some perceive community supervision as going soft or coddling convicted individuals. But these sanctions are experienced as punishment, with several scholars finding that many individuals would prefer incarceration to supervision, and these sentences are associated with diminished attachments and weakened employment opportunities (see Durnescu, 2011; Payne and Gainey, 1998). Punishment and society scholars have provided insightful studies of mass incarceration writ large, but focused less attention on community corrections.
Central to Garland’s culture of control argument is a host of managerial techniques that rely on actuarial classifications of risk. The most influential treatment of these actuarial techniques was summarized by Feeley and Simon’s (1992) new penology in which correctional policies and practices stopped being concerned with individuals as distinct people; rather, they were to be treated as probabilities of risk. Simon (1993) argued that parole had become a risk management job – not concerned with individual rehabilitation. Although the new penology has provided criminology with a powerful lens to understand adjustments to socio-cultural shifts, it seems that the pessimistic account of the new penology has yet to reach frontline officers. For instance, in Lynch’s (1998: 862) ethnographic study of California parole officers she found that officers have ‘close contact with the clientele, agents have an emotionally charged component to their job’.
Although in the current study we found that risk assessment, on average, received some of the longest recorded times, face-to-face interactions had one of the highest frequencies of occurrence (Table 2). There is little understanding about what risk assessment entails across jurisdictions. There has been a burgeoning risk assessment industry and much confusion about how to use assessments or how they are completed. The officers in our study conducted an in-depth interview as part of the assessment process in which they spent nearly one hour interviewing new probationers after conducting a brief in-person screening, and officers also conducted periodic modifications to the assessments based on individual progress (or lack thereof). 15 In fact, Taxman et al. (2004) have stressed that assessments and all interactions between officers and clients are an opportunity to engage, motivate, and understand, not simply to ‘check boxes’.
Footnotes
Notes
Declaration of Conflicting Interests
The author(s) declared no potential conflicts of interest with respect to the research, authorship, and/or publication of this article.
Funding
The author(s) received no financial support for the research, authorship, and/or publication of this article.