






Abstract
Large-scale social surveys of visually impaired people often explore participants’ mobility and travel behaviour. What is methodologically more challenging is gathering participant-centred data in relation to their own interpretation of the barriers they face. Findings from a national survey of visually impaired people are presented in this article (N = 960, probability sample drawn from the British registers of blind and partially sighted people). The research made use of the World Health Organisation ‘International Classification of Functioning, Disability, and Health’ (ICF) to develop an interview schedule in relation to visually impaired people’s participation in mobility and travel. Results found that participants identified a range of barriers and enablers to greater mobility which included individually-based explanations (e.g. difficulties with their eye sight) and socially-based explanations (e.g. inadequate public transport systems). Logistic regression analysis revealed that participants who particularly focused upon individually-based barriers had more severe visual impairment, worried most about their vision, and had most recently lost their sight. The findings highlight how professionals and family must be cautious not to reinforce visually impaired people’s perceptions of individual barriers and any associated sense of helplessness. The use of the ICF model also provided an innovative approach to survey-based studies: the methods adopted encouraged participants to identify issues they thought were important, while still generating findings which can be statistically generalised.
Introduction
The field of social policy and disability commonly draws upon surveys of disabled people to gain an understanding of their circumstances and opinions, e.g. in the UK Martin et al. (1989) and Williams et al. (2008). Researchers specifically concerned with visual impairment have also carried out similar surveys (e.g. Bruce et al., 1991; Hendershot and Crews, 2006; Pey, Nzegwu and Dooley, 2007). Such surveys provide an opportunity to gather information on a range of topics, including visually impaired people’s mobility and travel which is commonly identified as being restricted (e.g. Blasch, Weiner and Walsh, 1997; Dodds, 1988; Orr and Rogers, 2006; Pey, Nzegwu and Dooley, 2007). What is methodologically more challenging is gathering data in relation to visually impaired people’s own perception of the barriers they face. This article has two broad aims; one methodological and one empirical. The article aims to:
Give a description and rationale for the use of the WHO International Classification of Functioning, Disability, and Health (ICF) (WHO, 2001) as a framework to design aspects of a large-scale survey of visually impaired people (the ‘Network 1000’ survey).
Present findings from the survey in relation to the barriers and enablers visually impaired people report exist in relation to their mobility and travel.
Mobility and travel
Blasch et al. (1997) note that ‘the ability to move independently, safely and purposefully through the environment plays an important role in human development’ (p. 1) and highlight how milestones in human development are marked by many references to independent travel (e.g. children’s first steps, going to the local shop alone, crossing the road, passing a driving test). It is not surprising then that they go on to describe that ‘a lack of mobility among people with severe visual impairment or other disabilities seems to contribute to the depression that some people with disabilities feel early on in their experience with a disability’ (p. 1). It has been argued that it is the qualities of the visual sense which are particularly helpful for successful travel – the speed, volume, richness and spatial content of information acquired through sight (e.g. Geruschat and Smith, 1997). Therefore people with no vision (or reduced vision) must learn alternative methods of getting this information. In the UK it is often rehabilitation workers who teach visually impaired people these ‘mobility and orientation’ skills. Franks (2000) surveyed 330 rehabilitation workers in an attempt to understand the range of work they undertake. Their work included ‘offering information, advice, advocacy services, counselling skills and general support’ (p. 177) as well as traditional skills-based domains of teaching mobility and orientation and daily living skills. The majority of professionals were involved in some aspects of training in relation to mobility and travel (which included teaching sighted guide techniques to friends and family as well as mobility strategies to the visually impaired person), although this did not always include traditional formal orientation and mobility training. Indeed, Dodgson and McCall (2009) suggest that this type of traditional work is becoming an increasingly smaller proportion of the rehabilitation workers’ caseload.
In addition to this individual-focused view of independent mobility and travel, others have also considered more socially-focused analyses. For example, it may be that particular features of the environment present barriers to a visually impaired person when travelling (e.g. uneven surfaces on a pavement, poor lighting, no crossing points on a busy road, no public transport options). Similarly, it may be changes or adjustments to the environment which can act as enablers to more independent travel (e.g. appropriate tactile paving, the introduction of a high colour-contrast banister on a stairway). For this reason, an important aspect of the work of a rehabilitation worker is often described as carrying out and acting upon environmental audits or assessments (see for example, Corn and Erin, 2010; Geruschat and Smith, 1997; Koenig and Holbrook, 2000; Stone, 1995).
Surveys and methodological debate
The ‘Blind and partially sighted adults in Britain: the RNIB Survey’ (Bruce et al., 1991) was the first national survey of its kind in Britain. This survey had built upon the UK Office for Population Censuses and Surveys (OPCS) Disabled Adults Survey (e.g. Martin et al., 1989). Both the OPCS and RNIB surveys have been very influential in the UK, and certainly the latter has been a central resource to many in the field of visual impairment (researchers, services providers and campaigners). The surveys were influenced by the World Health Organisation (WHO) (1980) International Classification of Impairment Disability and Handicap (ICIDH). In fact, it is more accurate to say it mostly drew upon the ‘impairment’ and ‘disability’ (activity) aspects of the classification (individual orientation), largely ignoring ‘handicap’ (social orientation). This approach has been questioned by some as being too individual or medically orientated at the expense of a ‘social model’ of disability (e.g. Oliver, 1992). For example, Oliver (1992) and Abberley (undated) argue that the questions in the OPCS survey clearly locate the ‘problems’ of disability within the individual and they offer alternative phrasing of the survey questions. Despite this ideological and methodological difference, supporters of a social model of disability have made pragmatic use of the studies (e.g. Barnes and Oliver, 1995, p. 111, refer to ‘Britain’s 6.5 million disabled people’ identified by the OPCS survey; Duckett and Pratt, 2001, p. 818, refer to different views of older and younger visually impaired people as identified by the RNIB survey).
This article draws upon a UK-based research project entitled ‘Network 1000’ which began in 2004 (see Douglas, Corcoran and Pavey, 2006). An aim of the project was to establish a representative consultation network of approximately 1000 visually impaired people aged 18 and over who could be surveyed on a range of social issues in order to influence service development and provision. Unsurprisingly, Network 1000 was considerably influenced by 1991 RNIB survey. Nevertheless, the research team was conscious of the critiques made of the application of the 1980 ICIDH and wanted to explore the use of the replacement of that framework, the WHO International Classification of Functioning, Disability, and Health (ICF) (WHO, 2001).
This article describes how the authors explored the use of the ICF as a vocabulary for framing some of the questions in the survey, and how we navigated some of the methodological challenges. The article also presents survey findings in relation to travel and transport. This serves two purposes. Firstly it illustrates how we developed and applied our methods. Secondly, it provides insight into how visually impaired people understand the mobility and travel challenges they face.
Methodological approach taken – the ICF
Avoiding over-elaborate jargon, the research position dictates the ‘lens’ through which a research topic is explored, and the methods and processes the researchers draw upon. This reflects the epistemological and related methodological positions of the researchers. At the time of designing the survey a methodological tension emerged. It was essential to draw upon previous research to enable comparison, but there was also a need to try to capture the voice of the visually impaired people themselves. In some regards we felt this posed little difficulty – many of the demographic measures we were interested in were relatively straightforward (e.g. measures of details such as age, residence, nature of impairment). However, there was more difficulty in relation to people’s activities, more specifically their opinions of how they saw their lives in relation to these activities. It has been the framing of some of these questions which has led to criticism of previous surveys described above (e.g. Oliver, 1992).
Thomas (2004) explores the tensions between approaches taken by different research traditions. She presents an examination of sociological approaches to disability and notes that key authors in the field of medical sociology and disability studies overlap considerably with their approaches:
The argument has been advanced that despite the frequently reported divide between these disciplines there is, on close inspection, some evidence of common ground on what constitutes disability: Shakespeare, Watson, Bury, and Williams can all agree that impairment plays a role in causing restricted activity that constitutes disability and can agree that the social model of disability is flawed because it denies this causal linkage. (p. 580)
Therefore, it is the emphasis of the approaches that differs – some more concerned with social barriers that cause restriction, others more concerned with the effect of the impairment on activity. Thomas (2004) also argues that a flawed logic might lead to an unhelpful conclusion that ‘impairment does not cause restrictions of activity because the social model tells us that ALL restrictions of activity are caused by social barriers’ (p. 579, original emphasis). Thomas finds this regrettable because debates about it have deviated from the more fundamental debate about disability and social oppression. Perhaps the important divide is the difference in the definition of what disability actually means – some seeing disability as being a restriction of activity linked to oppression (or social disadvantage), while others see disability as being this oppression. Thomas has an elegant way of aligning herself to the latter definition, while still seeing the importance of recognising and understanding the non-socially imposed restrictions of impairment which might be better captured by the concept of ‘impairment effects’ rather than disability (more detail of this is described in Thomas, 1999). Other commentators have also acknowledged the helpfulness of considering this interaction, e.g. Shakespeare (2006) describes it in general terms in his examination of disability studies and French (1993) offers specific examples in relation to visual impairment. Thomas (1999) also emphasises the importance of people’s own views of their situation and their personal experience:
The personal experiences of living with both impairment and disability (and the interaction of these) should be on the disability studies agenda. (Thomas, 1999, p. 125)
The centrality of the experiences of participants was critical to the aims of the research. Nevertheless the challenge is to design a method which enables participants to describe a range of explanations of the restrictions they may face (whether they construct them as individually-based or socially-based), yet which is has the qualities (and standardisation) to be used with a large sample to enable to statistical generalisation.
An important part of designing a method with these features is having an appropriate vocabulary. WHO (2001) argue that the ICF classification ‘aims to integrate the two opposing (sic) models of disability – social and medical models’ (p. 20). Some key terms are as follows (based upon WHO, 2001, pp. 9–10):
Impairment – problems in body function or structure such as a significant deviation or loss.
Activity – concerned with performances in activities at an individual level.
Participation – concerned with involvement in life situations on a society level.
Participation restrictions – problems an individual may experience in involvement in life situations.
Environmental factors – concerned with variables which can be manipulated (whether physical, social or attitudinal) which might improve performance on activities and/or increase participation.
Barriers – general term describing environmental factors which may cause ‘activity limitations’ and ‘participation restrictions’. Similarly, ‘facilitators’ (or ‘enablers’) may remove such limitations or restrictions.
The framework replaced the WHO (1980) original classification which made the (much debated) distinction between ‘impairment’, ‘disability’ and ‘handicap’. This has now been modified with a greater emphasis upon an inclusive agenda and social participation. When the ICF classification (WHO, 2001) was first being proposed it led to a debate as to its potential usefulness – e.g. both Bury (2000) (a supporter and architect of the original framework) and Pfeiffer (2000) (who strongly opposed the original framework) question whether the new framework added anything new, while Hurst (2000) reflects upon the new framework’s ‘many flaws’ (p. 1083) but concludes it is a useful tool for the disability movement. Imrie (2004) comments upon the useful coherence of ICF but questions its theoretical efficacy. Shakespeare (2006) talks about the framework positively, noting ‘the medico-psycho-social model which lies at the heart of the ICF does seem to me a sensible and practical way of understanding the complexity of disability’ (p. 59). He goes on to say, ‘I believe that it offers a way forward for defining and researching disability, and should be endorsed by disability studies’ (p. 60). Either way, a number of researchers have used the framework within their empirical work (e.g. Crews and Campbell, 2001; Heerkens et al., 2004; Hendershot and Crews, 2006; Stucki and Melvin, 2005).
Method
ICF and interview schedule
In terms of implications for the interview schedule design, the ICF provided a useful framework and vocabulary for designing the interview questions. For example, we ask questions about an individual’s impairment (e.g. the nature and severity of their visual impairment), activity (e.g. how often they leave home, how they travel), participation (e.g. what the purpose of their journeys are), and environmental factors and barriers which help or hinder the activity (e.g. presence and absence of public transport). An example of the question structure is presented in Figure 1.
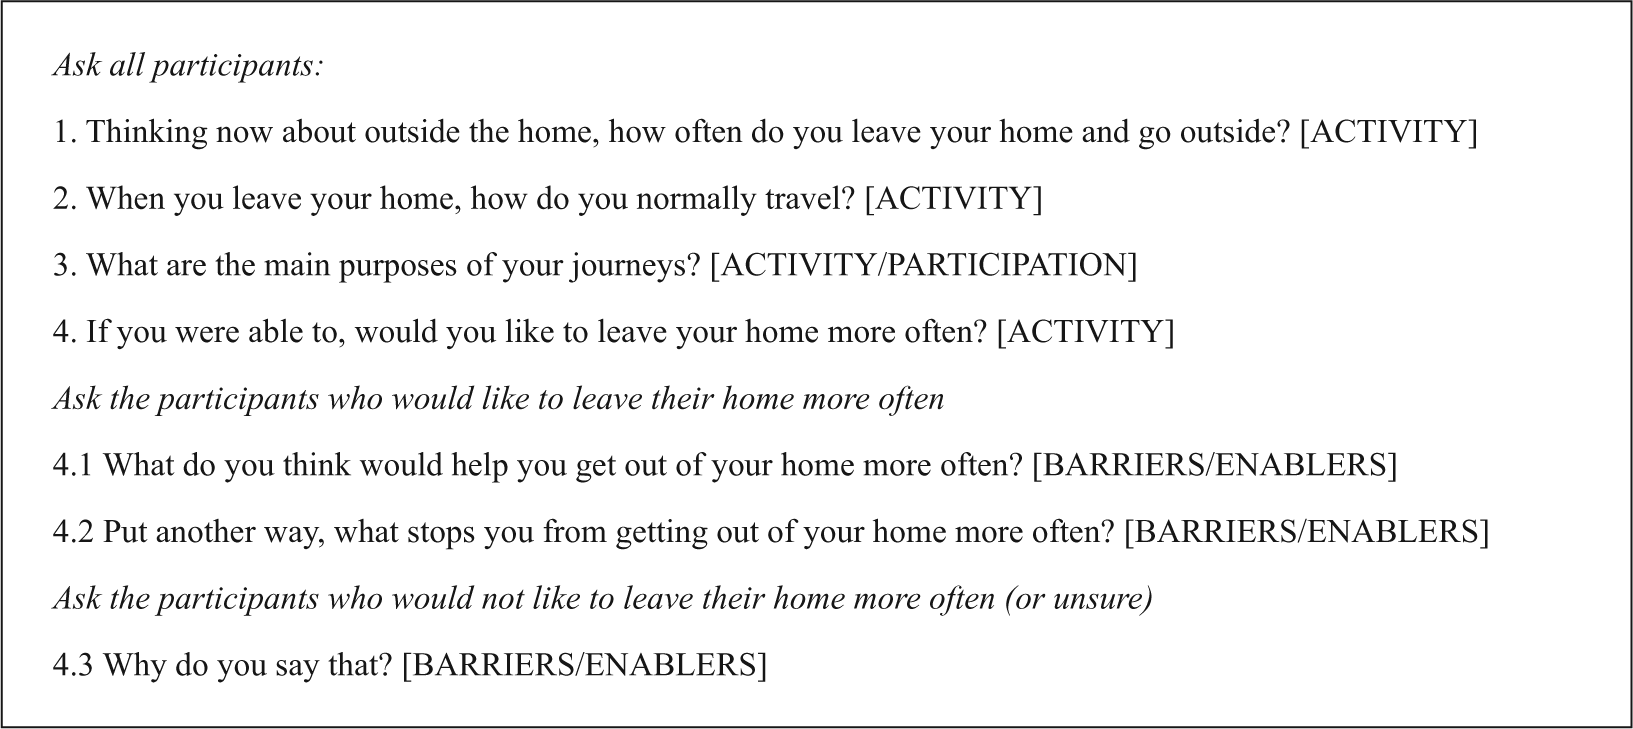
Example of question structure in relation to travel and ‘getting out of their home’, and links to ICF terminology in square brackets and capital letters. Answer categories and prompt/probe protocols not included.
The particular strength of the ICF in this context is that it gives the useful vocabulary we were seeking and crucially a vocabulary for participants to express their opinions. Most significantly, the way we were using the vocabulary does not force causal links between the concepts of impairment, activity and participation. It is these causal links which prove to be points of so much debate and speculation as described above. Such causal links can come from the participants themselves (should they choose to express an opinion), or at time of analysis and interpretation by researchers or others. Importantly, the causal links are not embedded in the questions themselves.
However, a challenge of this qualitative style of question is that it requires the interviewer to record and code the responses at time of interview (particularly the open questions 4.1, 4.2 and 4.3 in the example in Figure 1 which were specifically designed to generate participant views). This is reflected upon in the discussion section below.
Sampling
Crucial to the Network 1000 design was the construction of an unbiased sample of visually impaired people in Britain. In Britain, an ophthalmologist can assess whether a person can ‘register’ as sight impaired (partially sighted) or severely sight impaired (blind). If the visual impairment is of sufficient severity (and with agreement from the visually impaired person) then the ophthalmologist will complete a ‘Certificate of Vision Impairment’ and send it to the person’s local social services department. Similar referral processes exist in other countries (e.g. ‘legal blindness’ in the USA). The local authorities maintain registers of people who are sight impaired (partially sighted) or severely sight impaired (blind). Approximately 360,000 people were registered as visually impaired in Britain at the time of recruitment in 2005 (see Department of Health, 2003; National Assembly for Wales, 2003; Scottish Executive, 2003). Drawing upon the registers as a sampling frame, a two-stage sampling design was adopted. Stage one involved a random sample of 20 local authority Social Services Departments in England (15), Scotland (4) and Wales (1) (probability of selection proportional to the size of the register held by each authority to avoid bias in favour of people in small local authorities). Stage two involved creating a sample of those registered as blind or partially sighted from each selected local authority with weighted stratification by age (with the research targeting 200 participants in each of the five age groups: 18–29, 30–49, 50–64, 65–74 and 75+ years). Approximately 6000 recruitment letters (in large print and audio tape) were sent out inviting people to participate in the project. This led to the recruitment of 1007 participants approximately equally split across the age groups. Weighted frequencies from the sample (accounting for age) reflected the expected distribution for gender and registration status (blind and partially sighted). A more detailed account of the sampling process is presented in Corcoran et al. (2004), and Douglas et al. (2006).
Interviews
The survey involved telephone interviews which took an average of 40 minutes. Survey 1 was carried out in 2005–6. The structured interview schedules (see Pavey, Douglas and Corcoran, 2005) covered many topics including mobility and travel. Questions in relation to mobility and travel followed the structure described in Figure 1. Drafts of the interview schedules were commented upon by the project steering group and the final versions were piloted to test for timing and ambiguities. The team of interviewers were all trained to use the schedule (e.g. to read the questions and offer prompts and probes in a standardised format and use the computer assisted interviewing software).
Analysis
The analysis focuses upon 960 participants who took part in Survey 1. The analysis excludes 47 people who had learning and communication difficulties such that the interview schedule was inappropriate (for these people a ‘key informant’ was interviewed who knew the visually impaired person, see Douglas et al., 2006).
The results reported are weighted to account for the differences in the age distributions between the stratified sample and population.
The analysis presented in this article focuses upon the questions in Figure 1. It is split into three stages reflecting the ICF:
Stage 1: Travel activity and participation
Stage 2: Individual’s explanation of their situation – barriers and enablers
Stage 3: Factors associated with explanations
Results
Stage 1: Travel activity and participation
The first stage of the analysis looks at broad summaries and patterns in the activity and participation questions:
How often do you leave your home?
How do you normally travel?
Purposes of your journeys?
Would you like to leave your home more often?
Participants were asked a number of questions about travel and going out beyond their homes (Table 1). Forty-five percent of people said that they left their home every day, and this rose to 80 percent of people who left their home several times a week or more. This was linked with age – older participants were less likely to leave their homes every day (for example, an estimated 67% of working age people left their home every day compared with only 40% of people of retirement age).
How often do you leave your home and go outside (by working/retirement age)? Base: whole sample (N = 959)
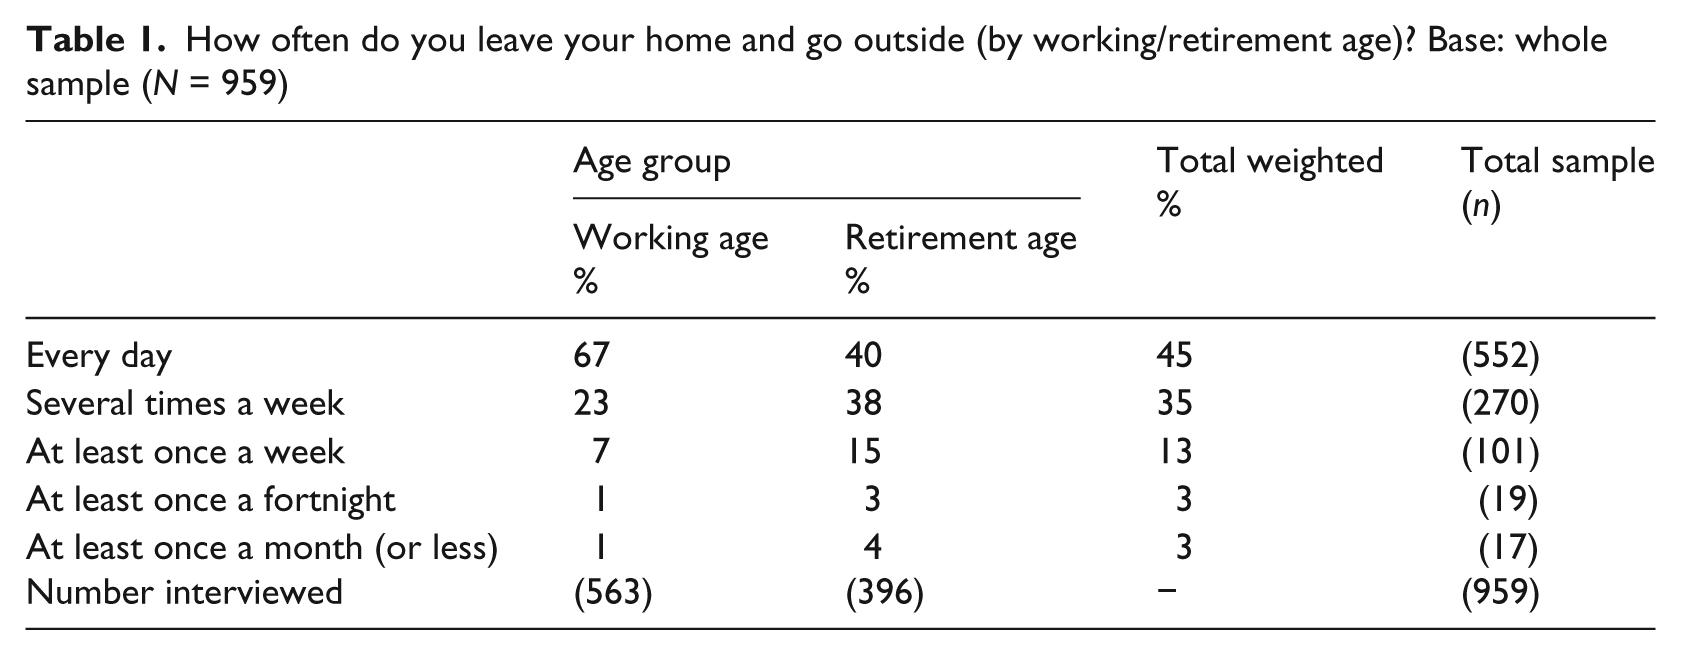
We carried out further statistical analysis to examine which factors affect how often visually impaired participants report leaving their homes when controlling for a range of potential influences (using a logistic regression model, not presented here). This confirmed that age was associated with less travel, as well as reported presence of other disabilities. Interestingly, reported level of visual impairment (based upon registration status) was not associated with amount of travel.
The significance of age was also reflected in the described purposes of the journeys (Table 2) – 7 percent left their home to go to work (33% of those of working age). Nevertheless, the most commonly given reasons for leaving the home were shopping and general leisure and hobbies (77% and 47% respectively).
What are the main purposes of your journeys? Base: whole sample excluding those who do not go out at all (N = 952), weighted
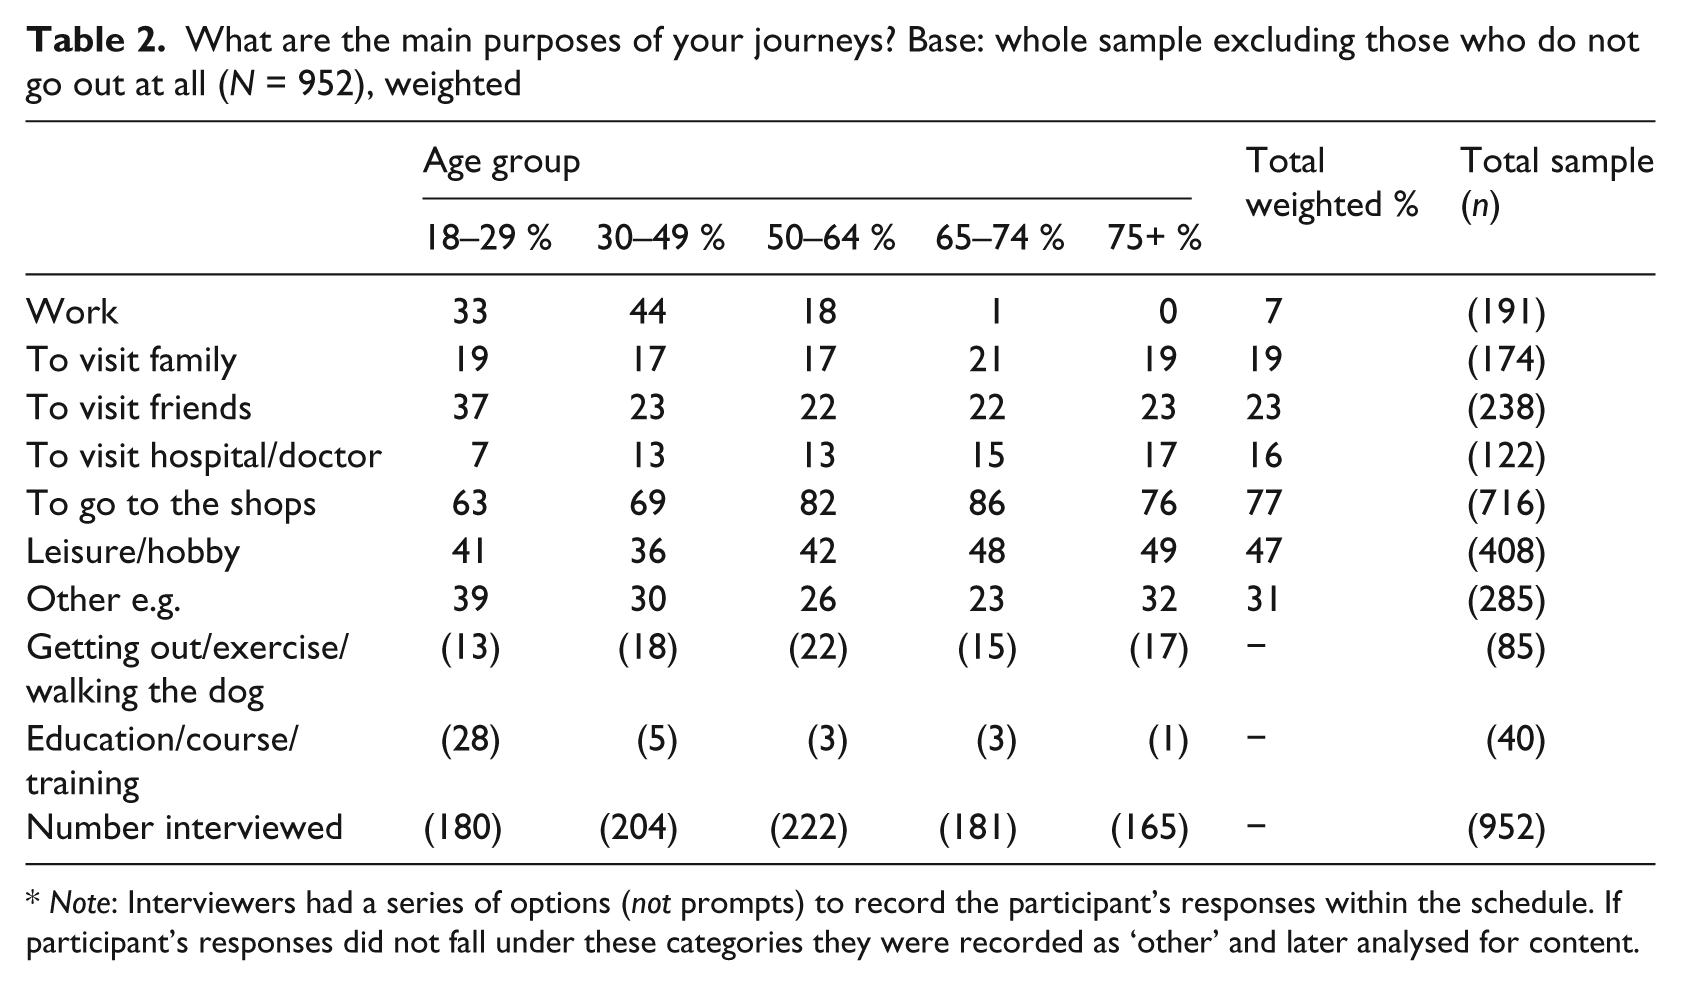
* Note: Interviewers had a series of options (not prompts) to record the participant’s responses within the schedule. If participant’s responses did not fall under these categories they were recorded as ‘other’ and later analysed for content.
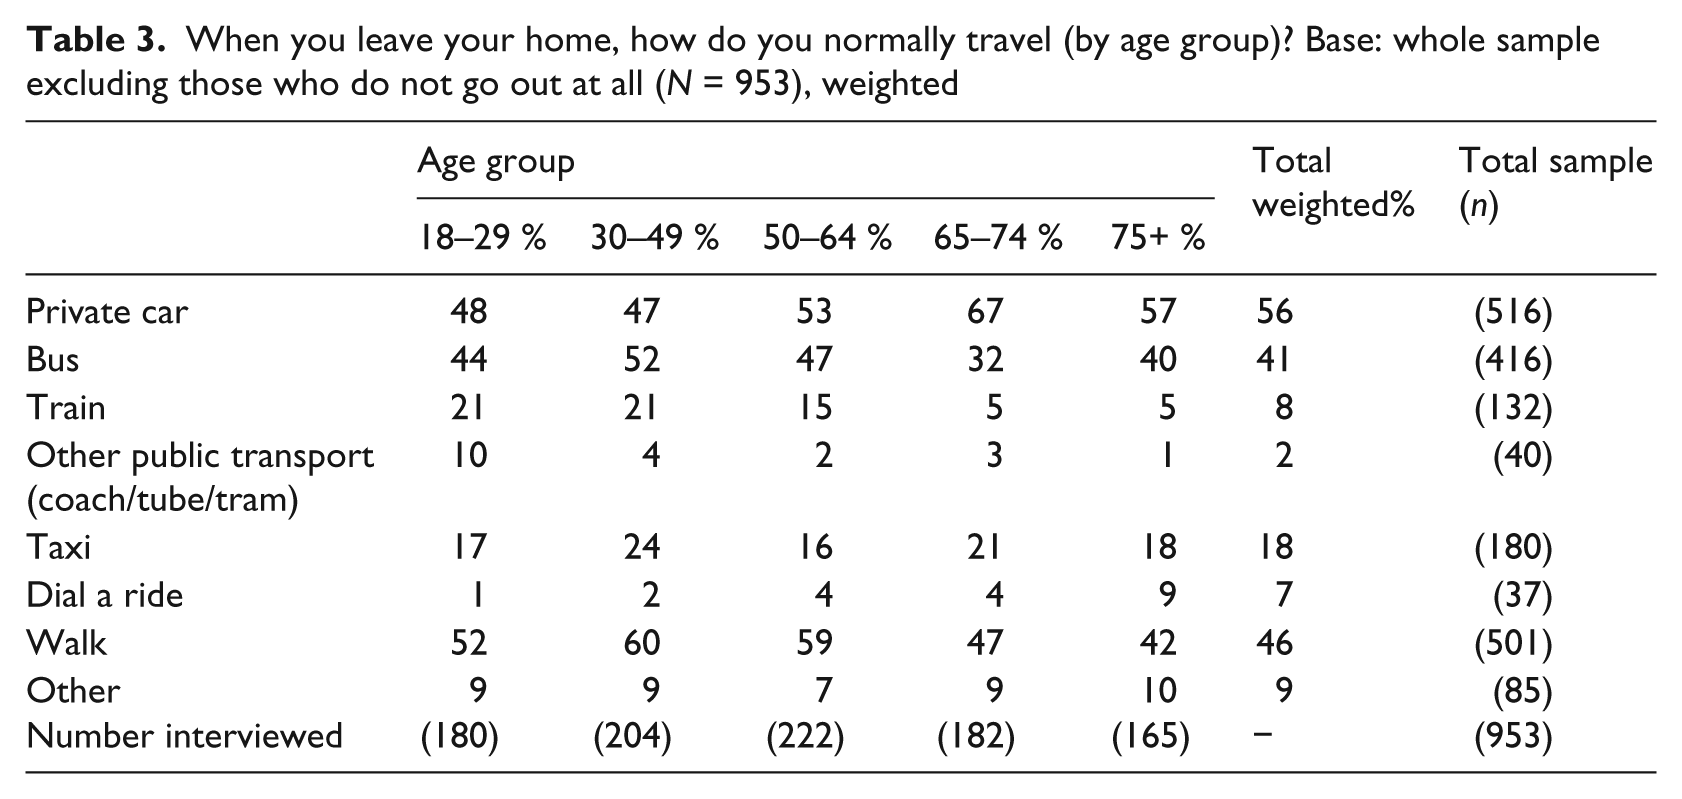
A variety of modes of transport were described (Table 3). Fifty-six percent of people described travelling by private car and 18 percent by taxi. Nevertheless, public transport was used by many (e.g. 41% told us they used the bus), and walking was one of the most common methods described (46%). Mode of transport appears to be linked to age; private car was more commonly named as a mode of transport by people of retirement age, whilst people of working age were more likely to walk and use public transport.
When you leave your home, how do you normally travel (by age group)? Base: whole sample excluding those who do not go out at all (N = 953), weighted
Central to our discussion here is whether people felt that they wanted to leave their home more often if they were able to; 43 percent of participants told us that they would. People of working age were more likely to say they wanted to leave their home more often than people who were of retirement age (55% and 41% respectively). We asked follow-up questions of these people asking what would help them get out more, and what stops them. The answers to these questions gave an insight into how people explained their situations.
Stage 2: Individual’s explanation of their situation – barriers and enablers
Stage 1 above provides a broad description of how much, for what purposes, and by what means the participants leave their home, as well as some indication of the factors associated with leaving the home more often. Nevertheless, it is people’s own explanations of their activities in relation to getting out of their home (and restrictions to these activities) which are explored in stage 2 of the analysis.
In line with the question structure presented in Figure 1, Table 4 presents participant’s responses when asked ‘what would help’ them leave their home more often, and ‘what stops’ them leaving their home more often (the responses are collapsed into a single variable). The most frequent responses given by participants are gathered under ‘individual’ and ‘social’ explanation categories, and it appears that both types of explanation are given. For example 32 percent of those asked stated that their visual impairment was a barrier to leaving home. Similarly, 22 percent described some aspects of transport (e.g. availability, cost) being a barrier to leaving home. To this extent the use of the ICF framework appears to be justified because it has allowed people to talk about these alternative explanations.
‘What do you think would help you get out of your home more often?’ and ‘Put another way, what stops you from getting out of your home more often?’ (by working/retirement age). Low frequency categories dropped or collapsed. Base: participants who would like to get out more often (N = 475), weighted
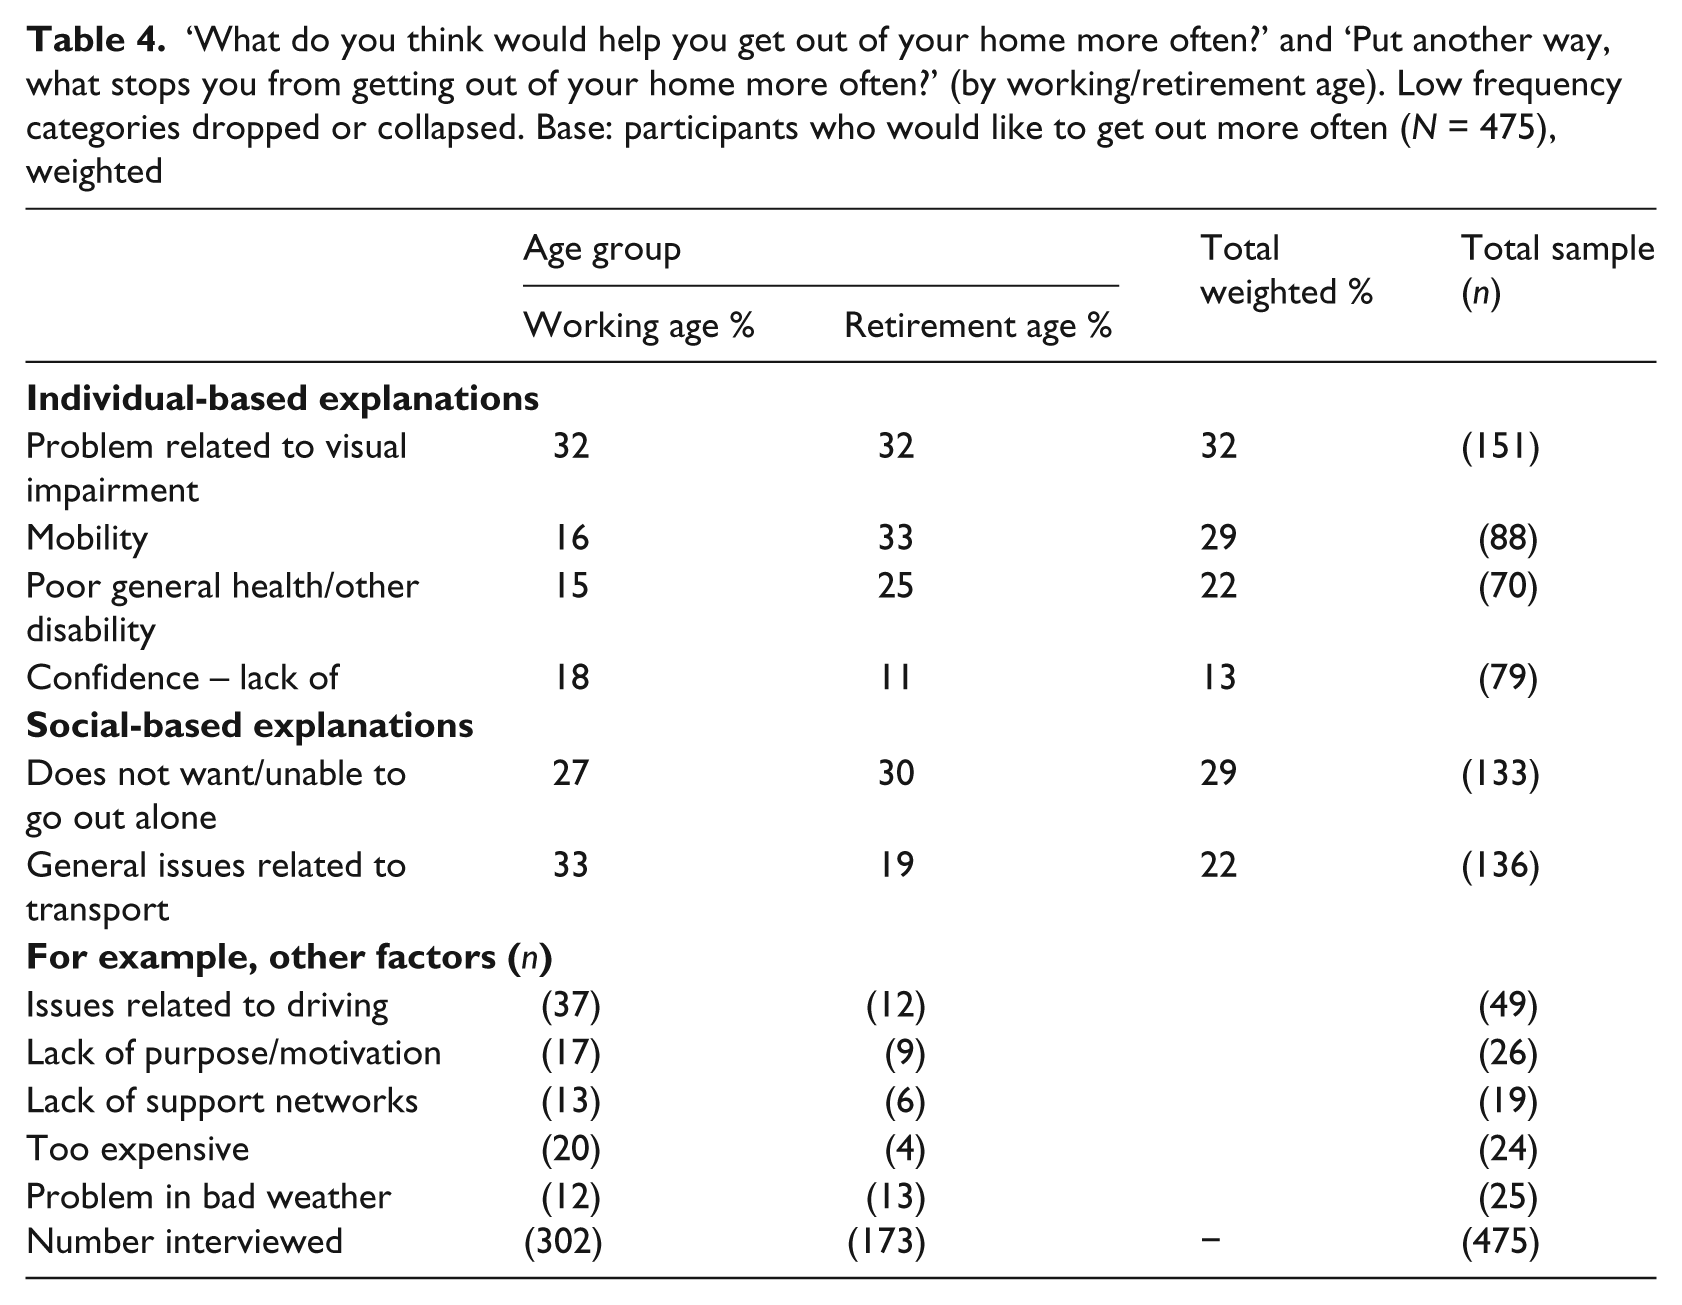
The social-based and individual-based explanations presented in Table 4 are a sub-set of those available to the interviewer at time of interview (the most commonly used). There were also options for interviewers to record other explanations if participants’ responses could not be usefully recorded in the pre-designed codes. Interviewers summarised these ‘other’ responses as qualitative data which were later analysed and coded (as new codes, or within the existing framework). Table 4 also presents summaries of these findings, e.g. 49 different people made reference to driving (e.g. ‘I miss driving’ – male participant, aged 72; ‘If I could drive I would go out more often. [Driving] is the major thing that would change my approach to life I think [..]. I wouldn’t be where I’m living. I think I would move if I could drive it would change everything. I probably would not even live in the same place.’ – male participant, aged 46).
Finally, we consider those participants (about half of our sample) who said they did not wish to leave their home more often (or were unsure). For these participants we simply prompted ‘Why do you say that?’ and recorded their responses in much the same way as described for the ‘what helps’ and ‘what stops’ prompts. The overwhelming majority (81%) felt that they already went out enough or that they were content with their current situation. Nevertheless, there were some participants who gave other explanations in line with the findings above (e.g. visual impairment, poor general health, lack of confidence, or needing to be accompanied by others). This perhaps reflects a tendency for some people to say that they do not wish, for example, to go out more because they do not feel they can for whatever reason. Again, appropriate prompting during interviewing generated this additional information which provides a richer description of how people interpret their situation.
Stage 3: Factors associated with explanations
In the previous sections we argue in favour of the usefulness of prompting people to try to explain their circumstances and situations. We maintain that with careful design such methods of ‘qualitative’ or ‘generative’ data collection can be used as part of medium to large-scale survey research, and we present some data to illustrate this. The next step (‘stage 3’) in this analysis would be to seek patterns in the data to see, for example, if particular explanations are associated with particular participant factors or groups.
A logistic regression approach was used to identify factors affecting the probability of participants offering (1) ‘individual’ explanations compared to those giving only (2) ‘social explanations’ as to what helps or stops them from getting out of the house more (a new dichotomous variable was constructed which categorized participants as those who had mentioned an ‘individual’ explanation or those who had not, i.e. had only offered ‘social’ explanations). This analysis was carried out on the subset of the sample who had said they would like to get out the house more and who were then asked to say which factors helped them and which hindered them in this regard (see Table 4, N = 475). Table 5 presents findings from the logistic regression model in which ten explanatory variables were used: sex; working or retirement age; whether a participant lives alone; home ownership; whether a participant is in work or not; their registration status (blind or partially sighted); whether they have an additional disability; how long they had been registered as visually impaired (for less than seven years or longer); how often they worry about their visual impairment; and the level of vision compared to a year earlier (i.e. deterioration or improvement).
Binomial logistic regression of those who mentioned any individual barriers (= 1) versus those did not (= 0). Base: participants who would like to get out more often (N = 475), weighted
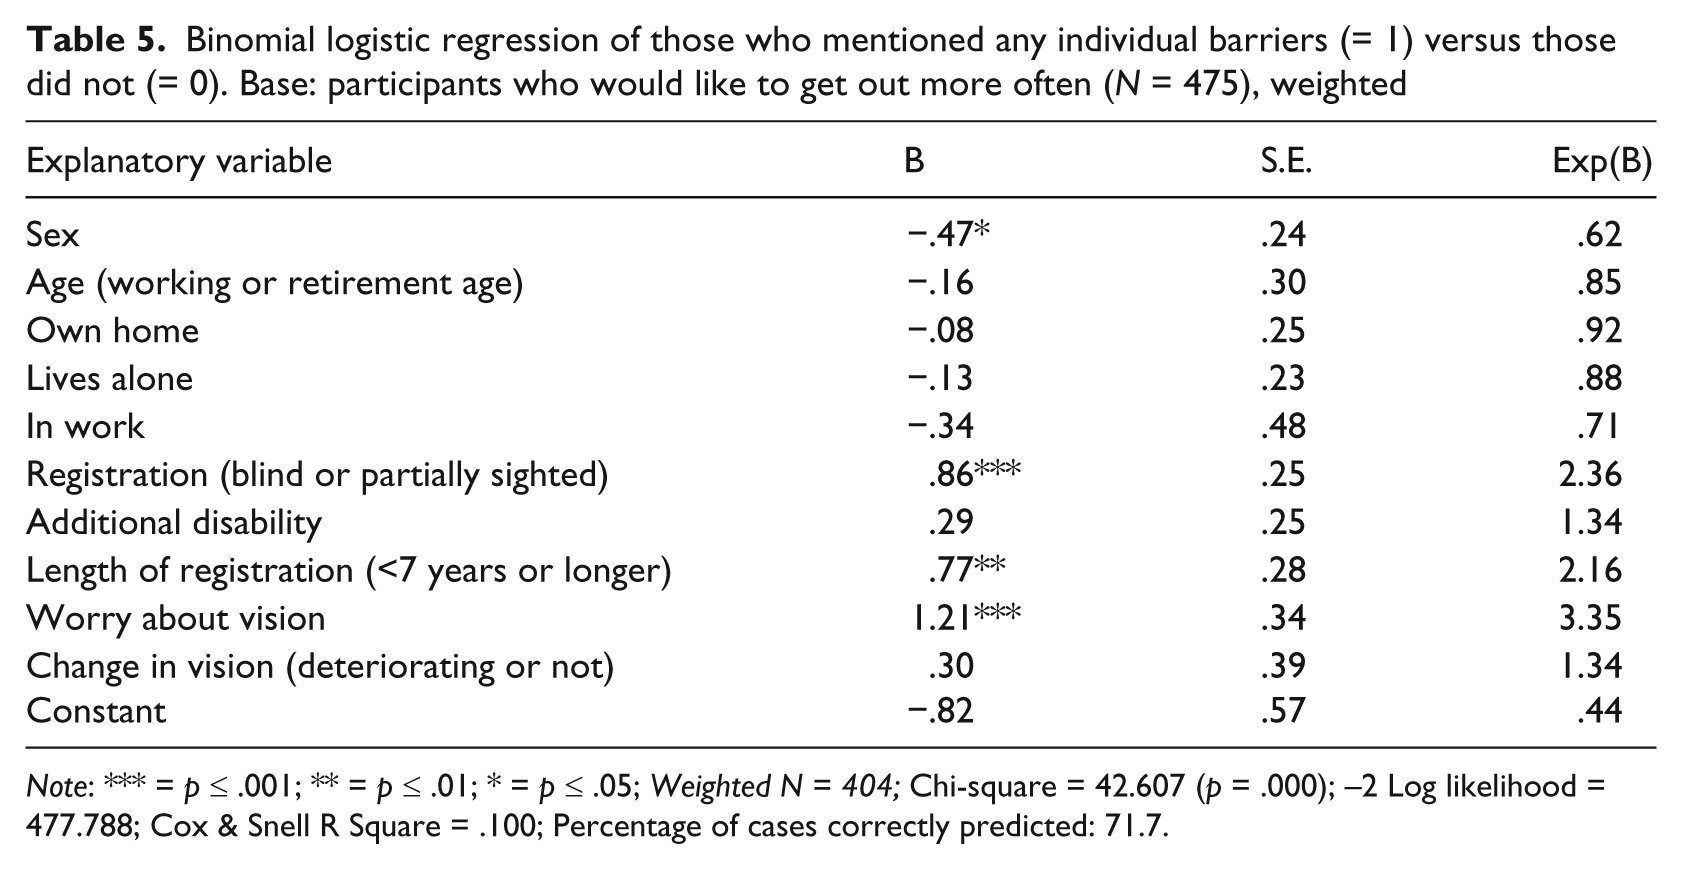
Note: *** = p ≤ .001; ** = p ≤ .01; * = p ≤ .05; Weighted N = 404; Chi-square = 42.607 (p = .000); –2 Log likelihood = 477.788; Cox & Snell R Square = .100; Percentage of cases correctly predicted: 71.7.
The model identified three significant (at p < 0.01 level) explanatory variables:
Being registered as blind increased the probability of offering an ‘individual’ explanation compared to being registered as partially sighted.
Being registered as blind or partially sighted for 7 years or less increased the likelihood of offering an ‘individual’ explanation compared to having been registered for a longer period of time.
Being worried more of the time about a visual impairment increased the probability of offering some form of ‘individual’ explanation compared to worrying less often about a visual impairment.
Sex was also found to be significant but only at a p < 0.5 level of confidence (being female increased the probability of offering an ‘individual’ explanation compared to being male).
Discussion
We revisit our aims in the final discussion: firstly in relation to the methods adopted and success of drawing upon the WHO (2001) ICF; and secondly in relation to visually impaired people’s experience of travel and transport.
Reflections on the method
The first aim of this article was in relation to describing and reflecting upon the method adopted. Duckett and Pratt (2001), in their exploration of methodological approaches to carrying out social research in the area of visual impairment, recommend an ‘eclectic approach to research’ (p. 830). We consider that surveys are one of the valuable approaches available to researchers for two key reasons. Firstly, Oliver (1992) rightly expresses concern that surveys can be too individually orientated at the expense of social explanations of disability. In this context, a question such as ‘does your visual impairment prevent you from going out more often?’ would fall into this trap, i.e. the question is orientated around an individually-based explanation. Nevertheless, surveys do not necessarily exclude researchers from seeking social explanations of disability. Through careful questionnaire design, data can be collected which gives participants an opportunity to express social explanations if they choose. While the ICF framework in its entirety may not be accepted by all researching the area of disability, we believe it offers a useful vocabulary for collecting such data. The data presented shows that the interview schedule adopted appears to have enabled our participants to provide explanations of their situation (both socially- and individually-based explanations).
Secondly, in recent years there has been a growth in secondary data analysis as datasets have been made available in online archives (e.g. the UK-based ‘Economic and Social Research Council’ data archive in the UK). For example, Siminski (2003) offers an interesting analysis of the Australian Bureau of Statistics Survey of Disability Aging and Carers (other examples in the context of visual impairment include: Bassett, 2010; Clements and Douglas, 2009; Meager and Carta, 2008; Zimdars, Gjonça and Nazroo, 2012). Siminski’s analysis is efficient and creative offering alternative and persuasive social explanations of patterns in the data. However, it is Siminski’s broader approach rather than his specific findings which are relevant to the current discussion. The article decouples the analysis from the data, implicitly arguing that while datasets may be incomplete or take positions which are not in keeping with the researcher’s position wholesale, they can be used to test different hypotheses. In this sense, we believe our approach has generated a broad range of data which will give us opportunity to represent and promote the views of visually impaired people. However, it is also a resource for other researchers to make alternative interpretations.
We believe the method described shows some promise and offers an interesting approach to overcoming some of the methodological tensions outlined earlier in this article. We would argue that the research has offered a fresh insight into the barriers and enablers people face in relation to travel and transport, and therefore offers evidence of how the approach can be successfully applied. Nevertheless, it is important to reflect upon the approach taken and any potential limitations it might have. In this regard, the flexibility it affords inevitably means that the lack of structure provided to the interviewer could lead to inconsistent and unreliable coding. The training of interviewers undertaken by the research team will have addressed this to some extent, as would the considerable amount of post hoc coding carried out by the authors when interviewers did not know how to code at the time of interview. Nevertheless, a more systematic analysis of the reliability of the approach would be a valuable next step.
Travel and transport
The findings related to participants’ travel activities provide an interesting insight into visually impaired people’s participation in travelling beyond their home in Britain (i.e. the amount and purpose of travel and the mode of transport used). The high use of private cars (for which visually impaired people must rely upon sighted others) and relatively expensive taxis, provides evidence of some of the social and economic challenges which may be particular to this group in relation to travel. Indeed, it is telling that 49 participants raised the topic of driving without prompting as a key barrier to travelling more. The findings also give an insight into how different sub-groups of the visually impaired population may be in particular danger of isolation – most clearly people who are older and have additional disabilities leave their home less often. In this respect findings have broad similarities with the findings of Pey et al. (2007). The findings have implications for how support may be focused upon those who are particularly vulnerable, as well as more specific entitlement issues at a time of public sector reform in the UK as well as economic cuts in the social care sector. For example, in the UK the Disability Living Allowance (DLA) is a tax-free benefit for children and adults who need help with personal care or have walking difficulties because they are physically or mentally disabled. The benefit has a ‘mobility component’ which is intended to support those who ‘cannot walk or need help getting around’ (Directgov, 2009). Many visually impaired people receive DLA (including the mobility component) (e.g. Douglas, Pavey and Corcoran, 2008), and in part this can be linked to the fact that visually impaired people are unable to drive and are consequently excluded from the enormous mobility benefits this affords (and related social and economic benefits). The recent and current welfare reforms in the UK will bring about changes to the DLA and the implication of this for visually impaired people will require monitoring.
However, it is perhaps the explanations generated through the interviews which offer a novel and helpful way of conceptualising barriers which visually impaired people experience in relation to travel. The interviews revealed that participants identify both socially- and individually-based explanations for the barriers they face, and in some cases identify both. Such a way of understanding visually impaired people’s perspectives has implications for actions that can be taken to support people getting out of their homes more often. Some of this action has a social and campaigning focus. Public transport is clearly an area which many visually impaired people feel presents significant barriers to travel (including public transport cost, suitability and availability).
Some of the action is also linked to support and rehabilitation which can be offered to individual visually impaired people. A challenge is that many visually impaired people may feel that their reduced mobility (even no independent mobility) may be an inevitability of their situation. The findings suggest that participants who are most likely to focus upon individually-based barriers alone have more severe visual impairment, worry most about their vision, and have most recently lost their sight. This makes intuitive sense, as it seems likely that people who are new to sight loss are most vulnerable to believing that the key solution to greater mobility would be the recovery of their sight or improved health. In such a situation, it may be that the person’s own understanding of their visual impairment and circumstances may serve as a barrier to them being more mobile.
Importantly, while the distinction between individual and social explanations is helpful, it is important to recognise they do not operate in isolation. An individually-based explanation of barriers is influenced by the social context in which they function (e.g. shifts in family expectations, availability of training, adequacy of public transport, etc.). Therefore, it must be highlighted that while perceived barriers may reside within the individual it would be incorrect to interpret this to mean it is somehow their ‘fault’, their ‘problem to overcome’ or an ‘inevitable situation’.
In Britain the Rehabilitation Worker (RW) is the professional usually responsible for assessing and supporting a person who is newly visually impaired, and they must operate within a complex context when they negotiate with the client what support they need in relation to mobility. Much policy advice for services correctly places the client at it’s centre, building a plan around the client’s needs, hopes and aspirations: e.g. ‘person-centred approach’ (Dodds, 1988); ‘student-centered approach’ (Zimmerman and Roman, 1997); and ‘social care should be provided on the basis of the needs, wants and aspirations of the individual’ (UK National standards of social care for visually impaired adults, ADSS, 2002). A danger of such an approach might be that the dominant discourse in such negotiations may be around individual barriers (often held by the client) which may lead to conservative interventions implicitly built around a purely individually-based understanding of the person’s disability.
Conclusion
We believe that the WHO (2001) ICF provides a powerful interactional model for understanding and researching disability. A strength of the model lies in the vocabulary it provides for understanding different perspectives of the experience of disability. This vocabulary provides a framework to enable researchers to place participants at the centre of a research design in which the disabled person can inform the researcher of their views and not just respond to the researcher’s agenda. In the specific context of visually impaired people’s mobility, findings indicated that visually impaired people report facing a range of barriers (and potential enablers that may be available). These include individually-based factors, and often involve identifying the visual impairment itself as a barrier to increased mobility. It also includes socially-based factors. Analysis revealed that some people (e.g. those with recent sight loss) particularly focus upon individually-based barriers and may be in danger of feeling that their situation cannot be changed, with associated feelings of helplessness.
Finally, a fundamental aspect of the ICF is that it has ‘participation’ at its centre, and emphasises the importance of removing barriers to disabled people’s participation. The ICF serves as a reminder that the broader aim of disability research should be to increase inclusion and participation of disabled people. This should be true whether the aims of a given research project emphasise individually-based barriers or socially-based barriers (or both).
Footnotes
Acknowledgements
We would like to thank: the many participants who are taking part in this research; Mike McLinden, Steve McCall and other colleagues at the University of Birmingham for their support in shaping this project; Christopher Robertson for his encouragement and comments on earlier drafts of this article; Vision 2020 UK and their chief executive Mike Brace who are the commissioning research partners; The project management panel for their enormous support and encouragement; and the Big Lottery Fund, RNIB, GDBA and Thomas Pocklington Trust for funding this work.