
Abstract
The Multidimensional Evaluation of Enacted Social Support (MEESS) measures communicated support in terms of supportiveness, helpfulness, and sensitivity. However, a systematic review of studies using the scale showed that the scale is mostly used as a unidimensional measure of support. Additionally, the scale is prone to having high interfactor correlations, and researchers rarely perform a confirmatory factor analysis to verify the scale’s factor structure. Therefore, we conducted two studies (Combined N = 1609) using nationally representative samples of U.S. adults to investigate the scale’s factor structure in message recall and hypothetical message study designs. We also explored whether the scale is best presented one factor at a time with factor-specific instructions as opposed to presenting the scale as a single set of items with one instruction set. Study 1 results indicate that the one-factor and three-factor solutions are both adequate without performing modifications during confirmatory factor analysis, but the three-factor model did provide a small but significantly better fit to the data than the one-factor model. In Study 2, both the one- and three-factor solutions had adequate fit; however, when using the factor-specific instructions, the three-factor solution had a far superior fit compared to the one-factor solution. Given the purpose of the scale as a multidimensional evaluation of social support, we recommend always conducting a confirmatory factor analysis when using the MEESS and to present the scale with separate instructions for each factor’s items.
Keywords
Introduction
Several academic disciplines study distinct aspects of social support. The communication discipline often concerns itself specifically with studying the quality of supportive messages that are communicated (i.e., enacted support), as opposed to analyzing perceived available support (e.g., Sun et al., 2020) or one’s integration into a support network (e.g., Uchino et al., 2018). One issue at the forefront of measuring the quality of enacted support is that supportive messages vary in type and goal. For example, some supportive messages may be problem-focused, whereas others may be emotion-focused (Holmstrom & Burleson, 2011; Lazarus, 1991), and support recipients may evaluate the supportive messages they receive across multiple dimensions.
For example, some supportive messages might be perceived as sensitive but ineffective and other messages may be perceived as helpful but communicated in an insensitive way. Although some scholars have argued that “people do not respond to the individual components of a message; rather, they respond to the overall effect these components combine to achieve” (Samter & MacGeorge, 2017, p. 122), recent studies have shown that negative statements within otherwise positive support messages are more likely to be recalled and to predict longitudinal outcomes (Ray, 2022). Additionally, some supportive messages may fail because of the absence of certain messages. For example, receiving blunt advice may provide a person with helpful information they need to hear, but may also be viewed as insensitive if the supporter does not engage in any facework when communicating such advice. Thus, even if most supportive messages are uniformly positive or negative, there are instances when mixed evaluations can occur and it is important that scales measuring supportive message quality account for these instances.
To account for the multifaceted complexities of evaluating enacted social support messages, Goldsmith and colleagues (2000) developed the Multidimensional Evaluation of Enacted Social Support (MEESS). The scale is considered multidimensional because its items load on three factors: relational assurance (i.e., supportiveness), problem-solving utility (i.e., helpfulness), and emotional awareness (i.e., sensitivity). This multidimensional structure allows researchers to evaluate supportive messages that may simultaneously differ in quality across factors (e.g., a helpful but insensitive message) or be uniformly high- or low-quality across all three factors. As noted by the scale’s creator, “Unidimensional measures designed to reflect a global assessment fail to differentiate between support that is mediocre and support that is exemplary in some respects but problematic in others… It is precisely the mixed evaluation of these messages that could be important for coping and for relational outcomes” (Goldsmith & Griscom, 2018, pp. 454–455).
The MEESS has been used in dozens of studies since its publication; however, some issues regarding the scale need to be addressed. For one, the MEESS was developed using college student samples that are not representative of many of the populations in which the scale has been administered. Additionally, a persisting issue dating back to the scale’s development is whether the scale’s items comprise three factors or one factor (i.e., whether the MEESS is actually multidimensional or if the scale’s 12 items all load onto one dimension). Compounding this issue is that, although the developers of the MEESS claim it is a three-factor scale, the majority of researchers using the scale has treated it as a unidimensional measure of support in their studies–sometimes out of convenience and other times due to a high interfactor correlation (e.g., Ray et al., 2021).
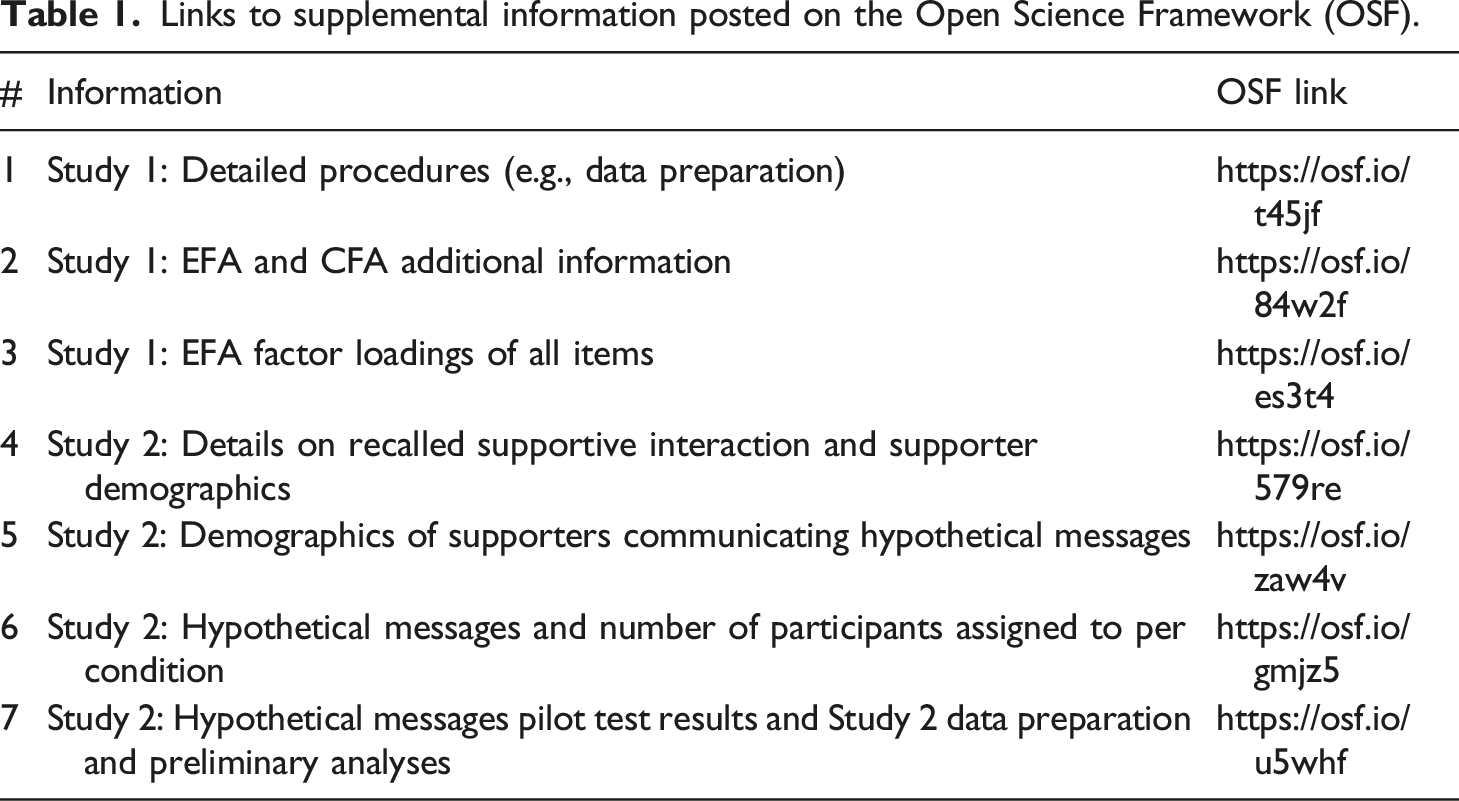
Links to supplemental information posted on the Open Science Framework (OSF).
An Overview of the Multidimensional Evaluation of Enacted Social Support
The Multidimensional Evaluation of Enacted Social Support: potential items and items selected for the scale during the scale’s development (Goldsmith et al., 2000).
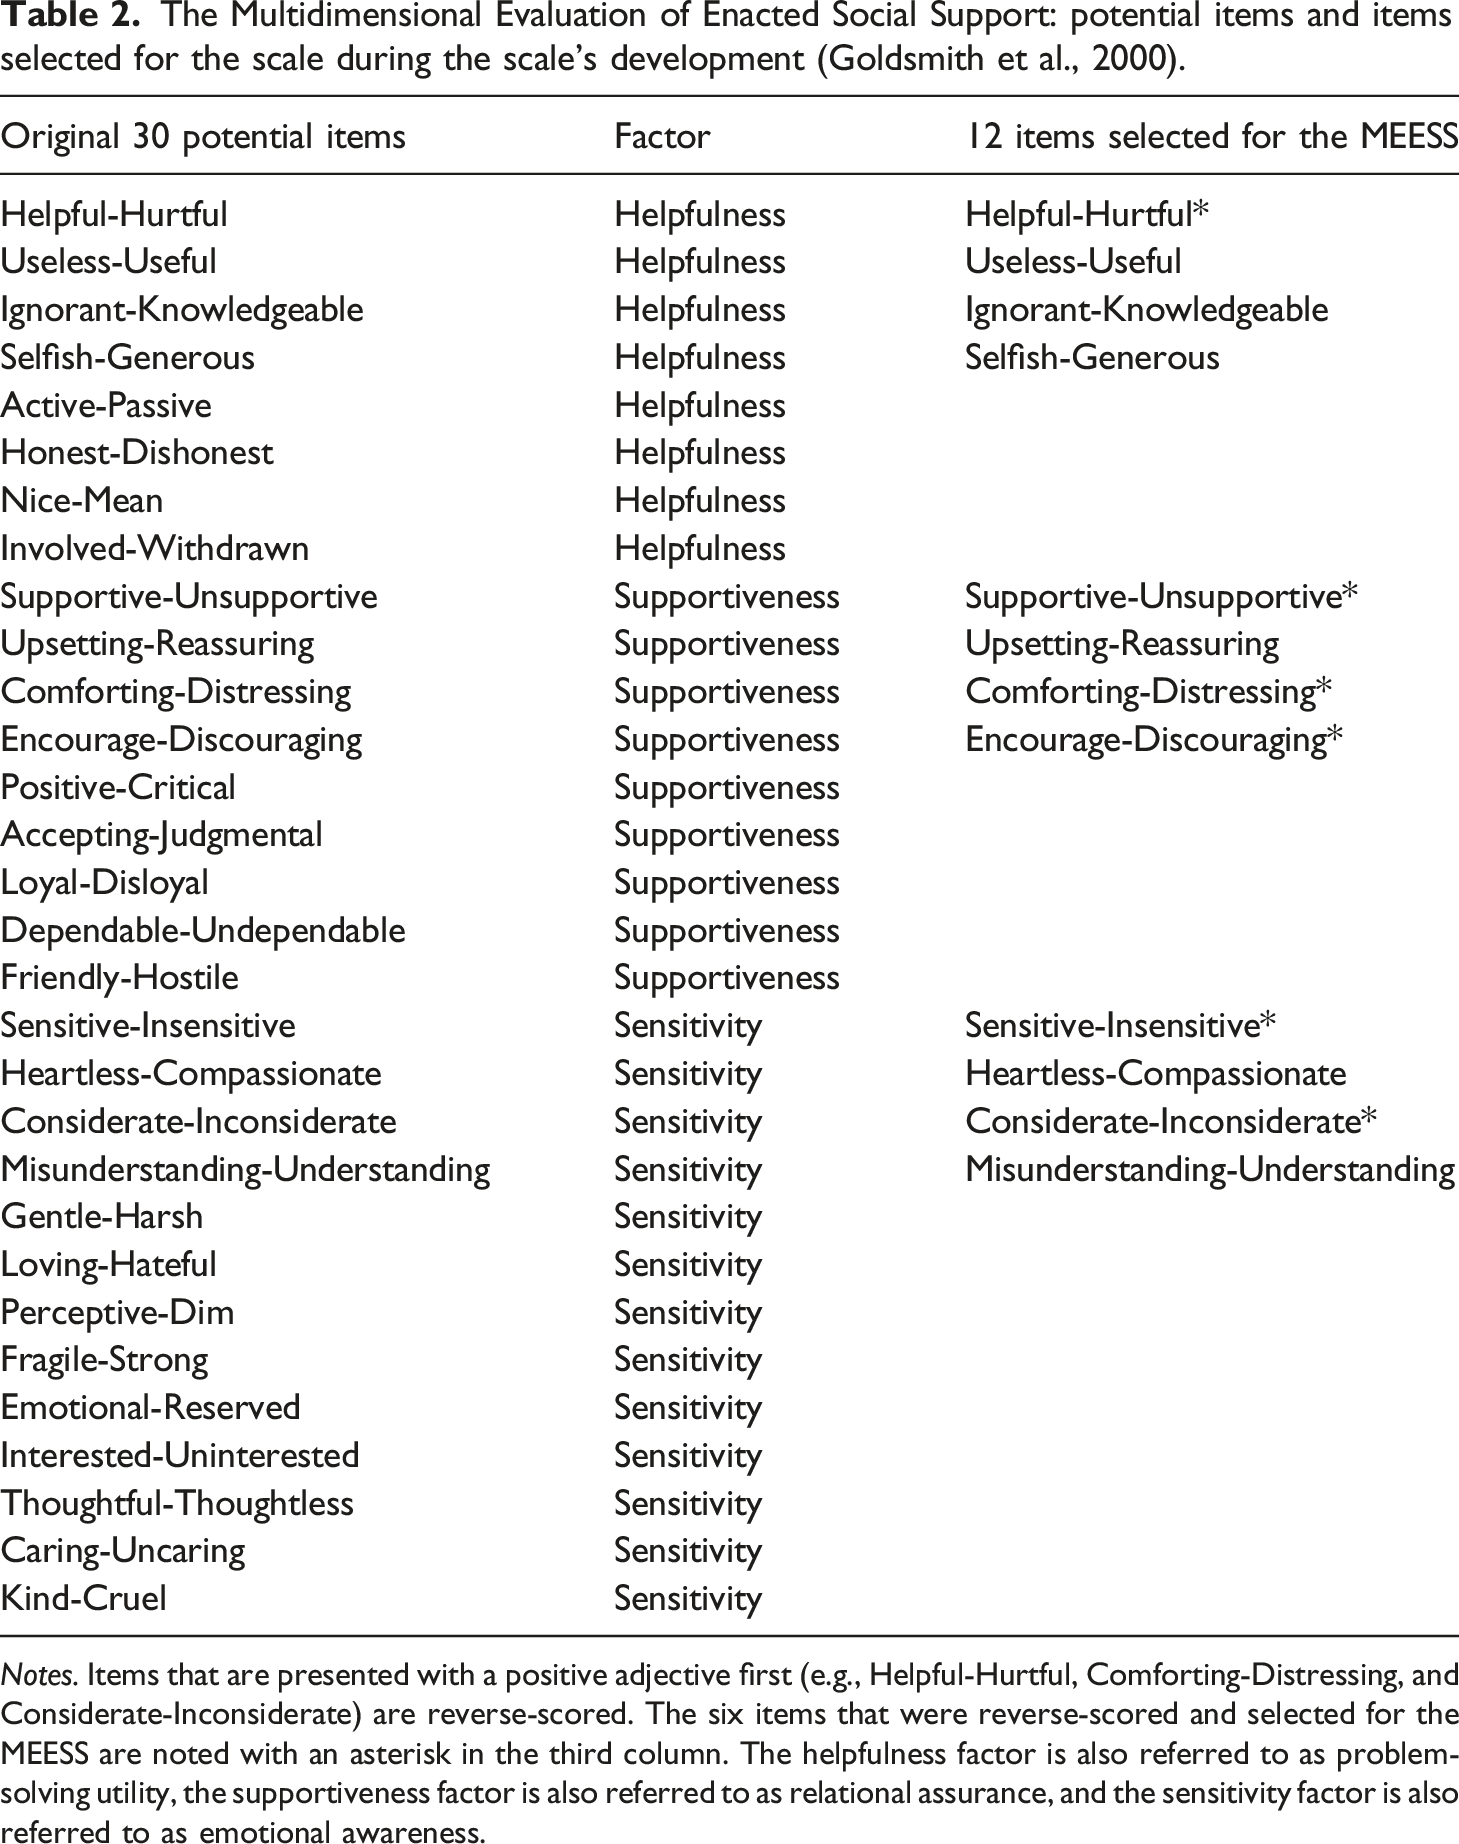
Notes. Items that are presented with a positive adjective first (e.g., Helpful-Hurtful, Comforting-Distressing, and Considerate-Inconsiderate) are reverse-scored. The six items that were reverse-scored and selected for the MEESS are noted with an asterisk in the third column. The helpfulness factor is also referred to as problem-solving utility, the supportiveness factor is also referred to as relational assurance, and the sensitivity factor is also referred to as emotional awareness.
The MEESS is administered as a set of 12 semantic differential items in which “reporters or raters respond to an adjective pair that reflects opposite ends of a continuum (e.g., helpful-unhelpful) and select a number between 1 and 7 to indicate their evaluation of the interaction for each criterion” (Goldsmith & Griscom, 2018, p. 454). The MEESS is scored by producing an average score for each of the three factors (after reverse coding six items to ensure higher values equate to more positive message evaluations). However, as discussed in more detail later, researchers more frequently use the 12 items (or a subset of the 12 items) to create a single-factor assessment of various aspects of support quality (e.g., Matsunaga, 2010).
Issues with Names for the Scale
Before exploring issues regarding the scale’s development, structure, and use, we would like to note a somewhat unique problem with this scale: The scale’s creators did not provide an official name for the scale at the time of its development. As such, the scale has been referred to by various names when cited, including the Evaluation of Enacted Social Support Scale, Evaluation of Enacted Support Scale, Enacted Social Support Scale, Multiple Outcomes of Supportive Interactions Scale, Social Support Quality Measure, Goldsmith Support Measure, and Goldsmith Social Support Scale. Naming issues were potentially resolved in a book chapter written by Goldsmith and Griscom (2018) in which they referred to the scale as the Multidimensional Evaluation of Enacted Social Support (MEESS). Two recent studies have subsequently referred to the scale as the MEESS (Taniguchi & Glowacki, 2021; Thompson et al., 2022), and we recommend future studies adopt this naming convention as well.
Issues with Sample Representativeness During the Scale Development
One issue with the process of developing the MEESS is that the participants in the two studies conducted to develop and select the scale’s items and to determine and validate the scale’s factor structure were undergraduate college students. Using college student samples is often viewed as a threat to the generalizability of research findings (Sears, 1986), but the problem remains prevalent in social scientific research. For example, a recent multi-year review of 332 empirical interpersonal communication studies (Afifi & Cornejo, 2020) found that college students made up 43% of approximately 71,000 participants from across these studies.
This is problematic, as undergraduate students are not typically representative of the general adult population in terms of obvious characteristics such as age and education (Peterson & Merunka, 2014), but also tend to be more compliant, have stronger cognitive skills, and have less strongly formulated attitudes (Sears, 1986). Furthermore, a second-order meta-analysis showed that college students samples tend to provide more homogenous data than nonstudent samples (Peterson, 2001). Even more alarming is that a study using a sample of undergraduate business majors found the results did not even generalize to the population of business majors from which the sample was drawn (Peterson & Merunka, 2014).
In examining the reported demographics in the scale development article, it is clear that the samples used to select and validate the scale’s items are not representative of the U.S. adult population, or likely any adult population besides college students. For example, the sample from Study 2 had no participants over the age of 39, an average age of 20.7 years, and a standard deviation of 1.7–suggesting minimal variability in participant age. Study 3 had the same average age and a slightly smaller standard deviation of 1.5, and no participants were older than 29 years of age.
Although there are appropriate times to use college student samples, such as when interested in studying populations that have attributes that are characteristic of colleges students or when studying social problems that are prevalent in and relevant to college students (Henry, 2008), we contend that developing a scale to measure the quality of enacted support does not meet these criteria. That is, supporting others occurs throughout the general population and throughout one’s life. It is not a unique stressor to college students. Henry (2008) does not call for an outright ban on student samples, but instead suggests that findings based on student samples should be replicated using separate nonstudent samples. Seeing that the items and factor structure of the MEESS were originally determined by student samples, studies investigating issues related to the MEESS (including our studies reported herein) should be conducted using samples that are more representative of the general population than undergraduate college student samples.
Issues with How The Scale Has Been Used and Cited
According to Google Scholar, the original scale development article has been cited over 150 times (as of June 9, 2022), appearing in 78 peer-reviewed journal articles, 32 doctoral dissertations, 18 masters theses, 15 books and book chapters, and one published set of conference proceedings. In reviewing these citations, we found that 82 of these publications cited the scale development article without utilizing the scale to collect data. Of the 37 studies that utilized the scale to collect data, 23 used the scale as a unidimensional measure of social support, whereas only 14 treated the scale as multidimensional.
The decision to treat the scale as multidimensional or to collapse the scale’s items into a single factor was rarely informed by confirmatory factor analyses. In fact, only seven of those 37 studies reported a confirmatory factor analysis to verify the factor structure of the scale with their specific dataset, and only six of those studies confirmed a three-factor structure. Instead, the overwhelming majority of studies did not report a confirmatory factor analysis. Those who used the scale as a unidimensional measure rarely justified the decision, and those who did made the decision based on observing high inter-item correlations (e.g., Jones & Burleson, 2003) or high interfactor correlations (e.g., Ray et al., 2021) instead of reporting a confirmatory factor analysis. Of note, only one of the 23 studies that used the MEESS as a unidimensional scale did so based on the reported results of a confirmatory factor analysis (Matsunaga, 2010).
Furthermore, 13 studies used a portion of the scale’s items, sometimes in combination with additional items created by researchers for their studies, to measure various aspects of support related to message quality. Finally, four studies used the MEESS or a selection of the scale’s items as a manipulation check for some other aspect of support that was being manipulated, such as verbal person-centeredness.
To review, the MEESS (or subsets of its items) has been used in several ways. Although developed as a multidimensional measure of enacted support quality, the scale is most frequently used as a unidimensional measure. The majority of researchers appear to make this decision without using a confirmatory factor analysis and nearly half of the instances of a confirmatory factor analysis being conducted to verify the scale’s multidimensionality can be tied to a single researcher’s diligence across several of his studies. We have purposefully taken the time to note in detail that this scale has been used as both a unidimensional and multidimensional measure because of an issue we will discuss next: Is the MEESS empirically multidimensional?
Issues of Factor Structure
Goldsmith and Griscom (2018) note that one critique of the scale is the potential for substantial intercorrelations among the scale’s three factors. Although the scale’s creators reported interfactor correlations ranging from .62 to .77 when developing the scale (Goldsmith et al., 2000), subsequent uses of the scale have seen interfactor correlations as high as .96 (Ray et al., 2021). High interfactor correlations may suggest that the MEESS is actually a unidimensional measure as opposed to a multidimensional measure. Additionally, most studies using the MEESS only report internal reliability statistics – most commonly Cronbach’s alpha. Internal reliability statistics do not adequately attest to the scale’s validity; however, confirmatory factor analyses can contribute to establishing the validity of a scale (Levine, 2005).
Study 1
Participant demographics for Study 1 (N = 982) and Study 2 (N = 627).
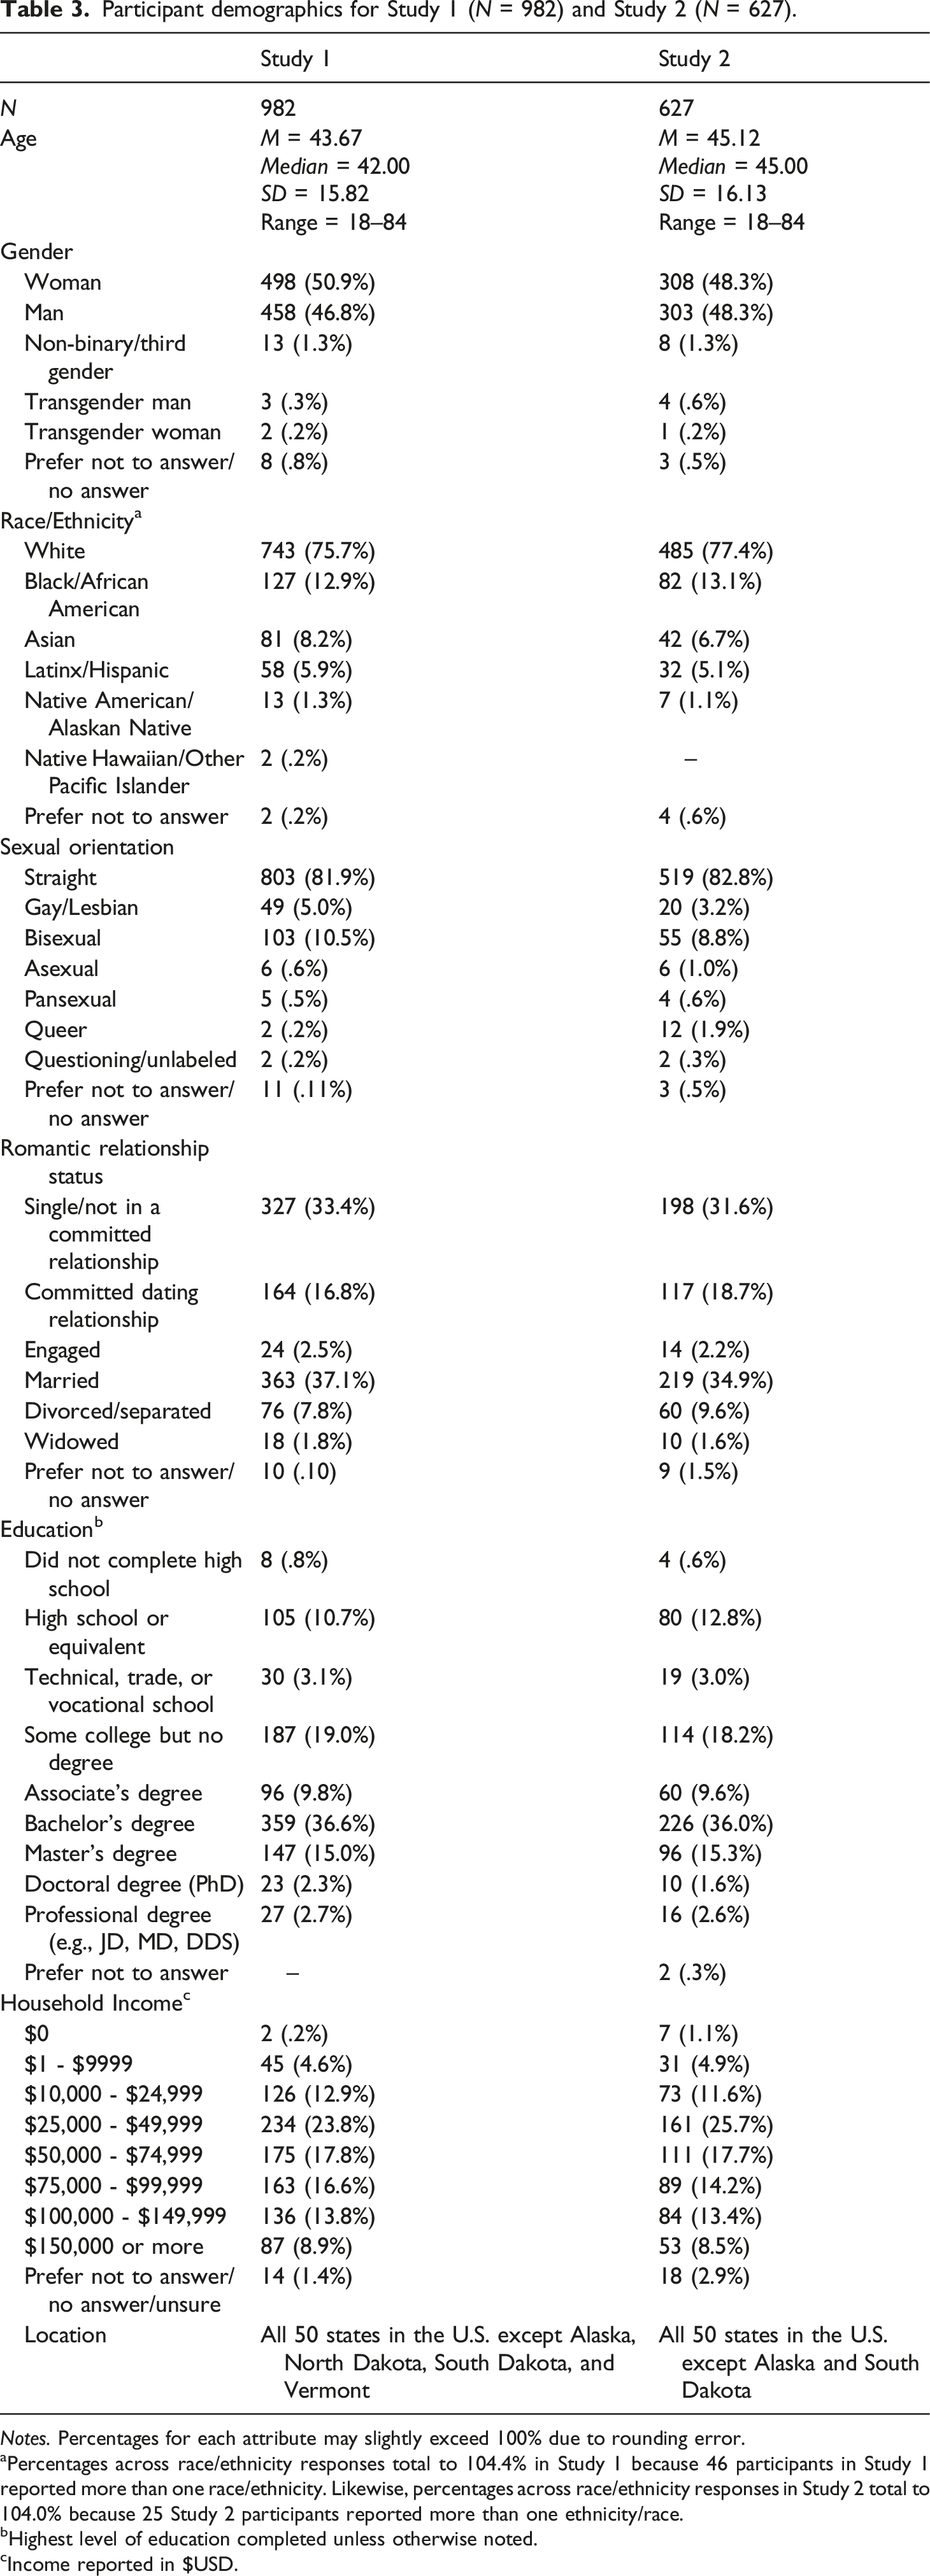
Notes. Percentages for each attribute may slightly exceed 100% due to rounding error.
aPercentages across race/ethnicity responses total to 104.4% in Study 1 because 46 participants in Study 1 reported more than one race/ethnicity. Likewise, percentages across race/ethnicity responses in Study 2 total to 104.0% because 25 Study 2 participants reported more than one ethnicity/race.
bHighest level of education completed unless otherwise noted.
cIncome reported in $USD.
These participants completed one of the original activities participants completed during the initial creation of the MEESS: rating a recalled supportive interaction they had with someone they knew regarding a stressor they were experiencing. This provided the necessary data to run two analyses: 1) an exploratory factor analysis to determine whether the 12 items selected by the scale’s creators (from a pool of 30 items they created) did indeed yield the strongest scale possible, and 2) a confirmatory factor analysis that verifies the MEESS as having three factors with four items each. Participants received $3.00 (USD) for participating in our questionnaire. The data were randomly split in half to conduct the exploratory and confirmatory factor analyses. Additional details of our procedures, such as data preparation and additional information reported by the participant regarding their recalled interaction are available on the Open Science Framework at https://osf.io/t45jf.
Study 1 Results and Discussion
Exploratory Factor Analysis
The verification of the Multidimensional Evaluation of Enacted Social Support (MEESS; Goldsmith et al., 2000) started with an analysis of the 30 adjective pairs from the original scale creation process, with the goal of determining if a different factor structure and/or specific items would result in a stronger scale. Details on how we conducted this EFA (and the Study 1 CFA discussed in the next section) can be found on the Open Science Framework at https://osf.io/84w2f. Starting with the 30 adjective pairs, the final factor solution included 28 items with one factor accounting for 77.10% of the variance. The Kaiser-Meyer-Olkin (KMO) test of sampling adequacy was .99 and the Bartlett test for sphericity was significant at p < .001. The final factor solution included 28 items with factor loadings between .66 and .94 (average loading .88).
To compare, we also conducted an EFA on the final version of the scale, which includes three factors with 12 items total. The initial solution produced only one factor with an eigenvalue exceeding 1.0. No items were excluded from the final factor solution and the one factor accounted for 83.59% of the variance. The Kaiser-Meyer-Olkin (KMO) test of sampling adequacy was .98 and the Bartlett test for sphericity was significant at p < .001. The final factor solution included items with factor loadings between .85 and .95 (average loading .91). A supplementary table with factor loadings for all items is available on the Open Science Framework at https://osf.io/es3t4.
Two conclusions can be drawn from these exploratory factor analyses. First, both factor solutions only included one factor, not the three (helpfulness, supportiveness, and sensitivity) as indicated in Goldsmith et al. (2000). Second, based on the EFA data, the 12-item measurement accounted for marginally more variance and had higher average factor loading than the 28-item version.
Confirmatory Factor Analysis
To further test the factor structure of the MEESS, we used SPSS Amos version 26 to conduct confirmatory factor analyses on both a one-factor solution from the EFA and the three-factor solution proposed by Goldsmith et al. (2000). The initial CFA for the 12-item three-factor solution (helpfulness, supportiveness, and sensitivity) as proposed by Goldsmith et al. (2000) demonstrated adequate model fit, χ2 (51) = 215.32, p < .001, CFI = .98, RMSEA = .08, SRMR = .02. The average interfactor correlation for the three-factor solution was r = .93. No items were removed from the scale.
The initial CFA for the 12-item one-factor solution as indicated by the exploratory factor analysis, also demonstrated adequate model fit, χ2 (54) = 235.21, p < .001, CFI = .98, RMSEA = .08, SRMR = .02. Comparing the final models, the three-factor model provided a small but significantly better fit to the data than the one-factor model, χ2diff (3) = 19.89, p < .001; however, the average interfactor correlation for the three-factor model was r = .93.
Study 1 Brief Discussion
Two conclusions can be drawn from these exploratory and confirmatory factor analyses. First, Goldsmith and colleagues did an excellent job in reducing the items for their final version of the scale during the scale’s initial development. No items were removed from either CFA, and all the individual items loaded on their latent factors. We also attempted CFAs with a three-factor and one-factor solution with the original 30 items, but the initial factor solutions were not as strong as the initial factor solutions for both of the 12 item solutions. Second, the three-factor solution was superior to the one-factor solution, though both produced adequate model fit. The fact that the three-factor solution produced better model fit might be due, in part, to the fact that no modifications were made to either solution. Further, the average correlation between the three factors (helpfulness, supportiveness, and sensitivity) in our nationally representative sample was r = .93. This was notably higher than the correlations among the three factors when the scale was developed using college student participants, which ranged from .62 to.77.
The results of Study 1 suggest that the Multidimensional Evaluation of Enacted Social Support best functions as a three-factor scale as opposed to a one-factor scale. However, this is not generally in line with how the scale has been previously used. We also realize that this claim should not be made based on a single study conducted by this research team. Therefore, we completed a second data collection from a separate nationally representative sample of U.S. adults to further explore and verify the factor structure of the MEESS.
Study 2
In our second study, we specifically test if the scale’s factor structure is affected by three aspects: 1) presentation of the scale items and instructions, 2) study design, and 3) the extent to which the messages and conversations being rated are uniformly positive or negative across the scale’s three factors. Next, these three aspects are discussed further, and research questions are posed.
First, just as the scale’s developers checked for model fit with multiple samples during the scale’s development, we also believe that our assertion from our Study 1–that the Multidimensional Evaluation of Enacted Social Support (MEESS) is indeed multidimensional–should be verified using a second nationally representative sample of U.S. adults. Collecting data from a second, separate sample to conduct a confirmatory factor analysis on the MEESS is in line with best practices for developing and validating scales in social research (Boateng et al., 2018). Therefore, we begin by posing the following research question:
One potential reason why the MEESS’s items could load onto one factor could be due to the presentation of the items in one block and with one set of instructions for the entire scale. Researchers have found that careless respondents may assume they know what is being measured after answering the first few items of a scale and subsequently respond to the remaining answers in a similar way (Schmitt & Stults, 1985). Such careless responses are an example of the issue of insufficient effort responding (IER), which occurs when participants do not give full effort when answering items (for overview, see Hong et al., 2020). Of note, IER is more likely to occur near the middle or end of surveys (Baer et al., 1997), and typically the MEESS is used later in surveys after participants have been shown a hypothetical message or asked to recall a prior supportive interaction.
For a multidimensional scale, such as the MEESS, IER could lead to participants inattentively responding without realizing that the items are concerned with three different aspects (i.e., factors) of support quality. This would be particularly problematic if participants engage in straightlining, which occurs when participants answer several consecutive items with the same response (e.g., answering “strongly agree” for all items; see Johnson, 2005). Straightlining can lead to artificially inflated inter-item correlations (DeSimone et al., 2018), inflated correlations between substantive measures (Huang et al., 2015), and can disturb a scale’s factor structure (Huang et al., 2012; Woods, 2006). This may explain why the MEESS has, at times, generated exceedingly high Cronbach’s alpha scores (e.g., Ledbetter, 2008; Matsunaga, 2010), inter-item correlations (e.g., Jones & Burleson, 2003), and interfactor correlations (e.g., Ray et al., 2021).
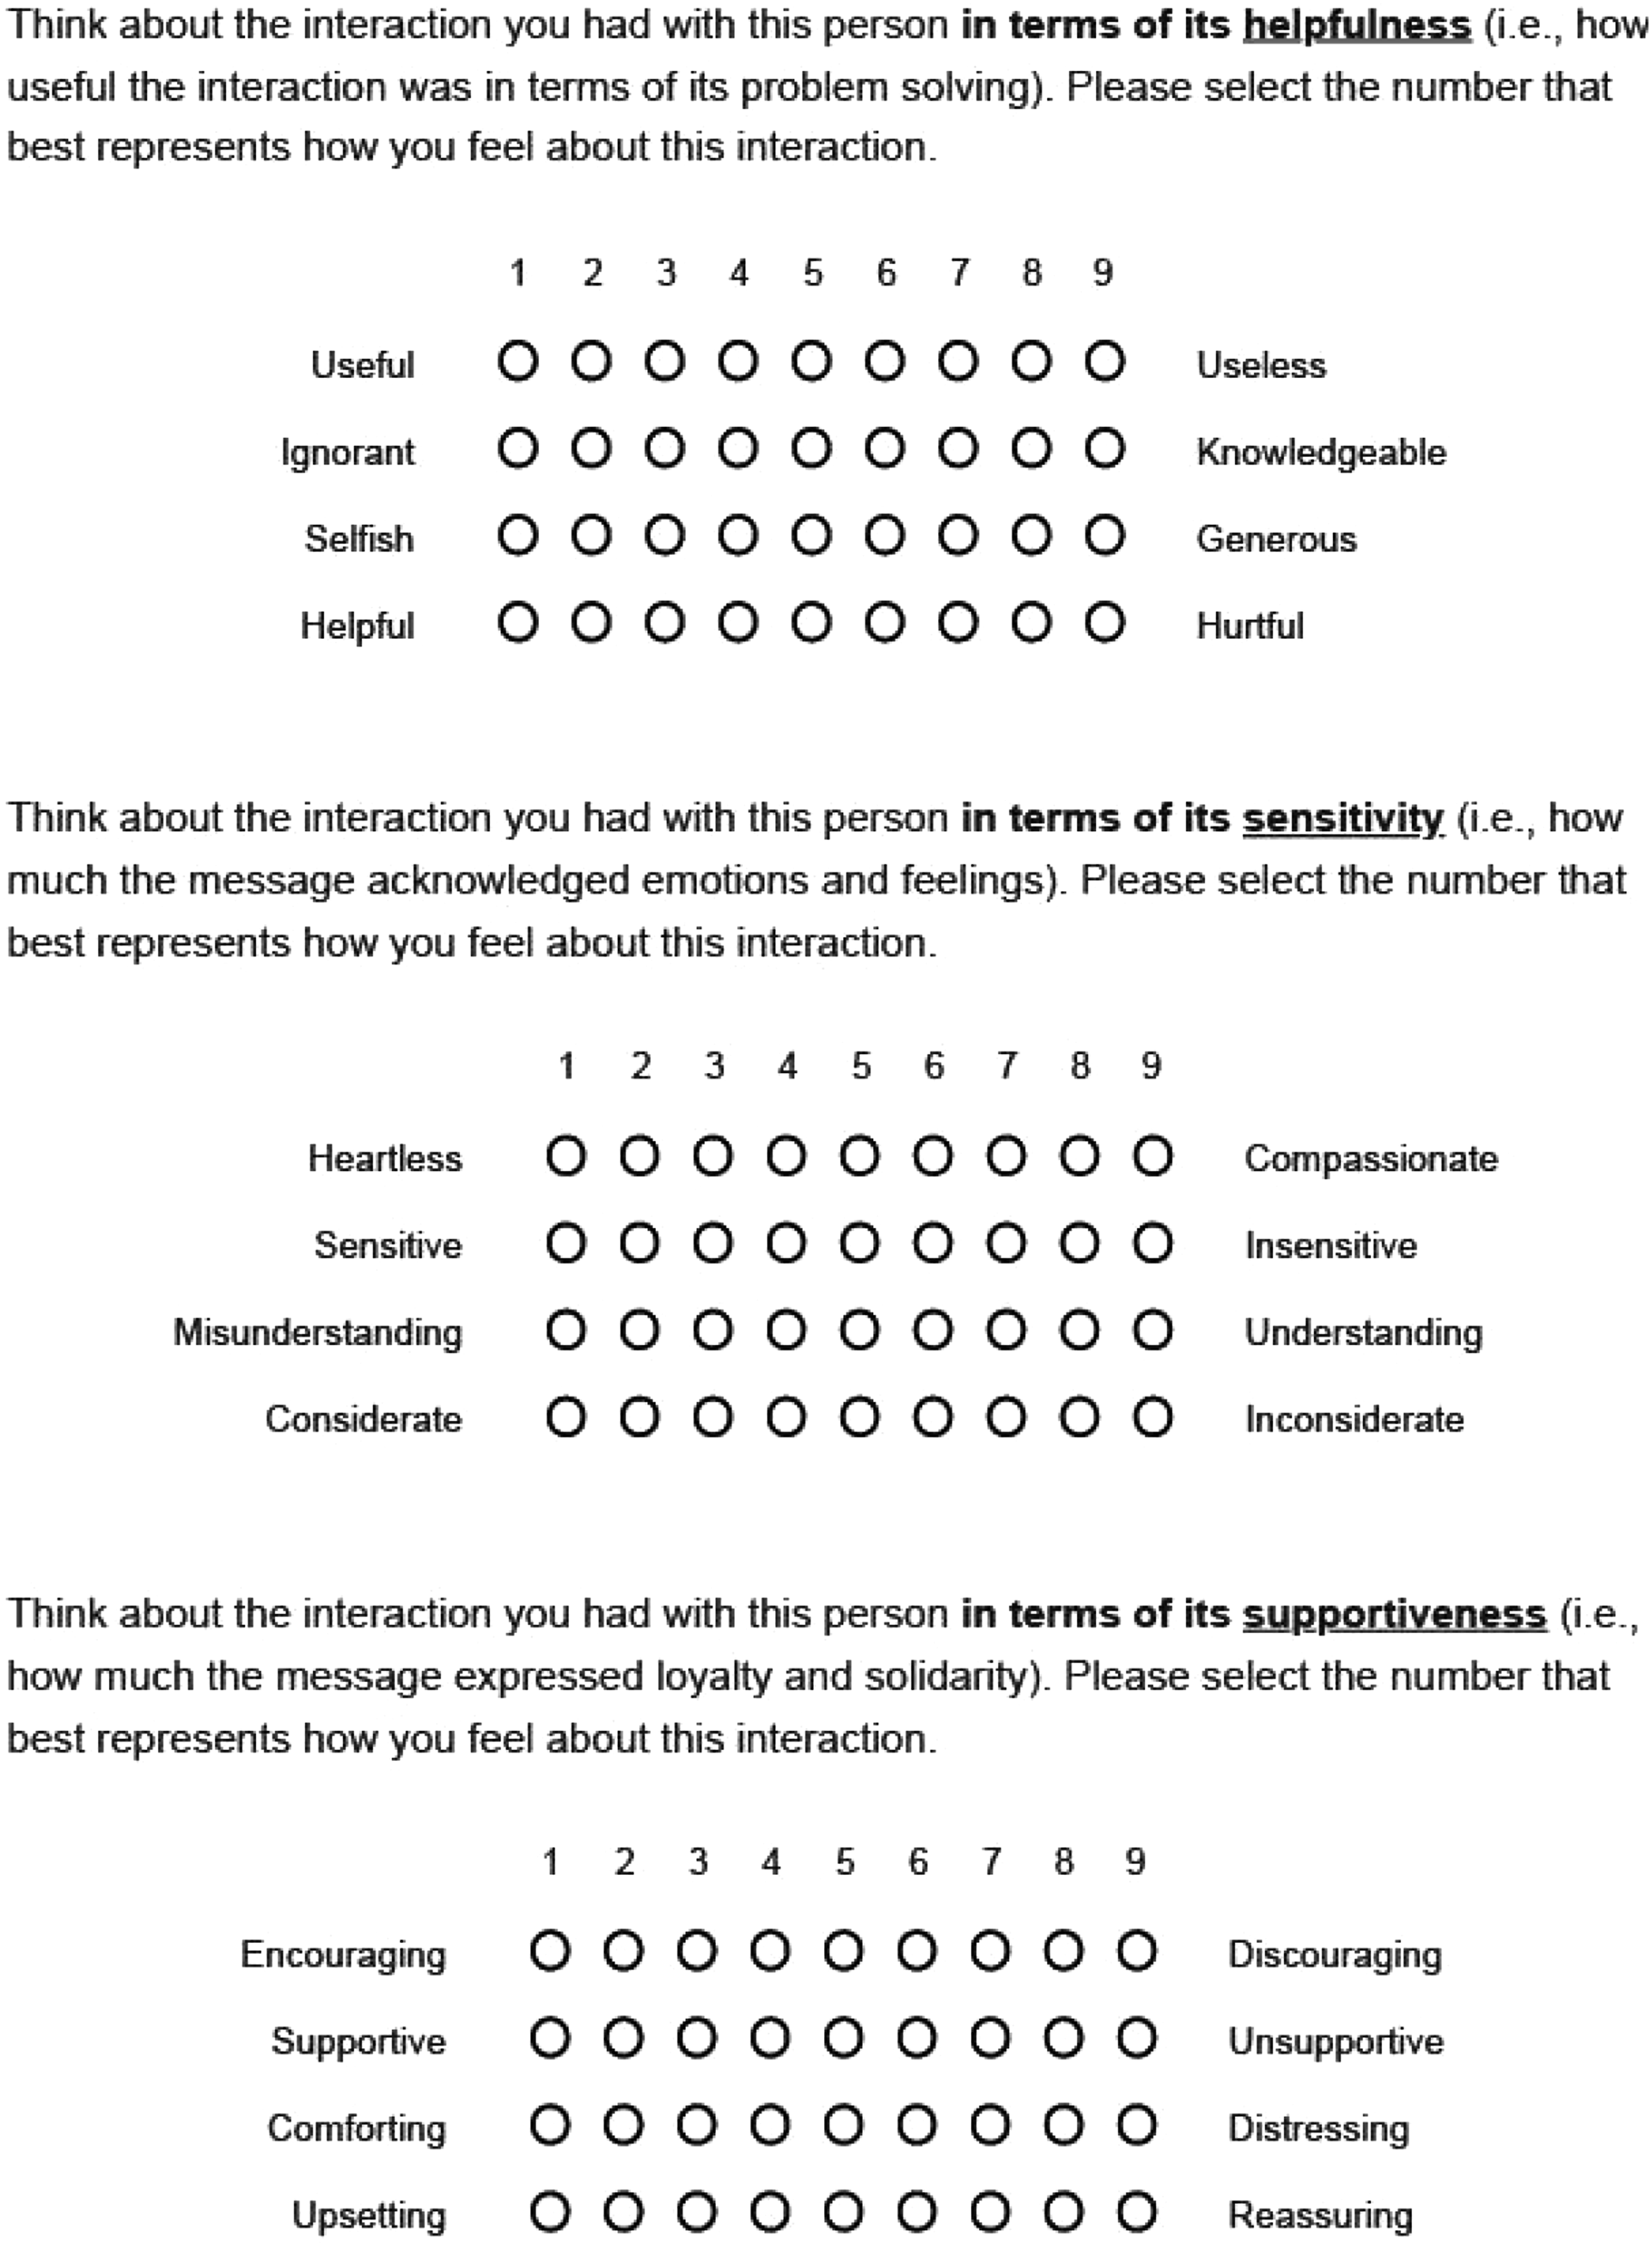
We propose that dividing the presentation of the MEESS’s items by factor and presenting each factor with its own factor-specific set of instructions can ameliorate these issues. In this proposed alternative format, the helpfulness factor, for example, would be presented with instructions that specifically ask the participant to rate the message/interaction based on its helpfulness and then present the four items from the helpfulness factor. The same pattern is then used for the remaining two factors. By presenting a new set of instructions that orientates the participant to the focus of each factor, we believe that participants will pay closer attention to the items, and the resulting data would subsequently be more likely to load on three factors as opposed to one factor. The original format of the MEESS and the proposed alternative format in which items are presented by factor with factor-specific instructions are presented in Figures 1 and 2. Formally stated, we pose the following research question. The MEESS as a single set of 12 items with one set of instructions. Note: This version of the scale is presented the same way as the original version of the scale and is presented here as it was also presented in the book chapter by Goldsmith and Griscom (2018). The one difference is that we provided nine answer choices, whereas Goldsmith and Griscom provided seven. We recommend randomizing the order that the 12 items are presented in the scale for each participant. The MEESS presented with three sets of items and factor-specific instructions. Note: The scale is shown above with nine answer choices; however, Goldsmith and Griscom (2018) show the scale using seven answer choices. We recommend randomizing the order that the three factors are presented and the order the items are presented within each factor.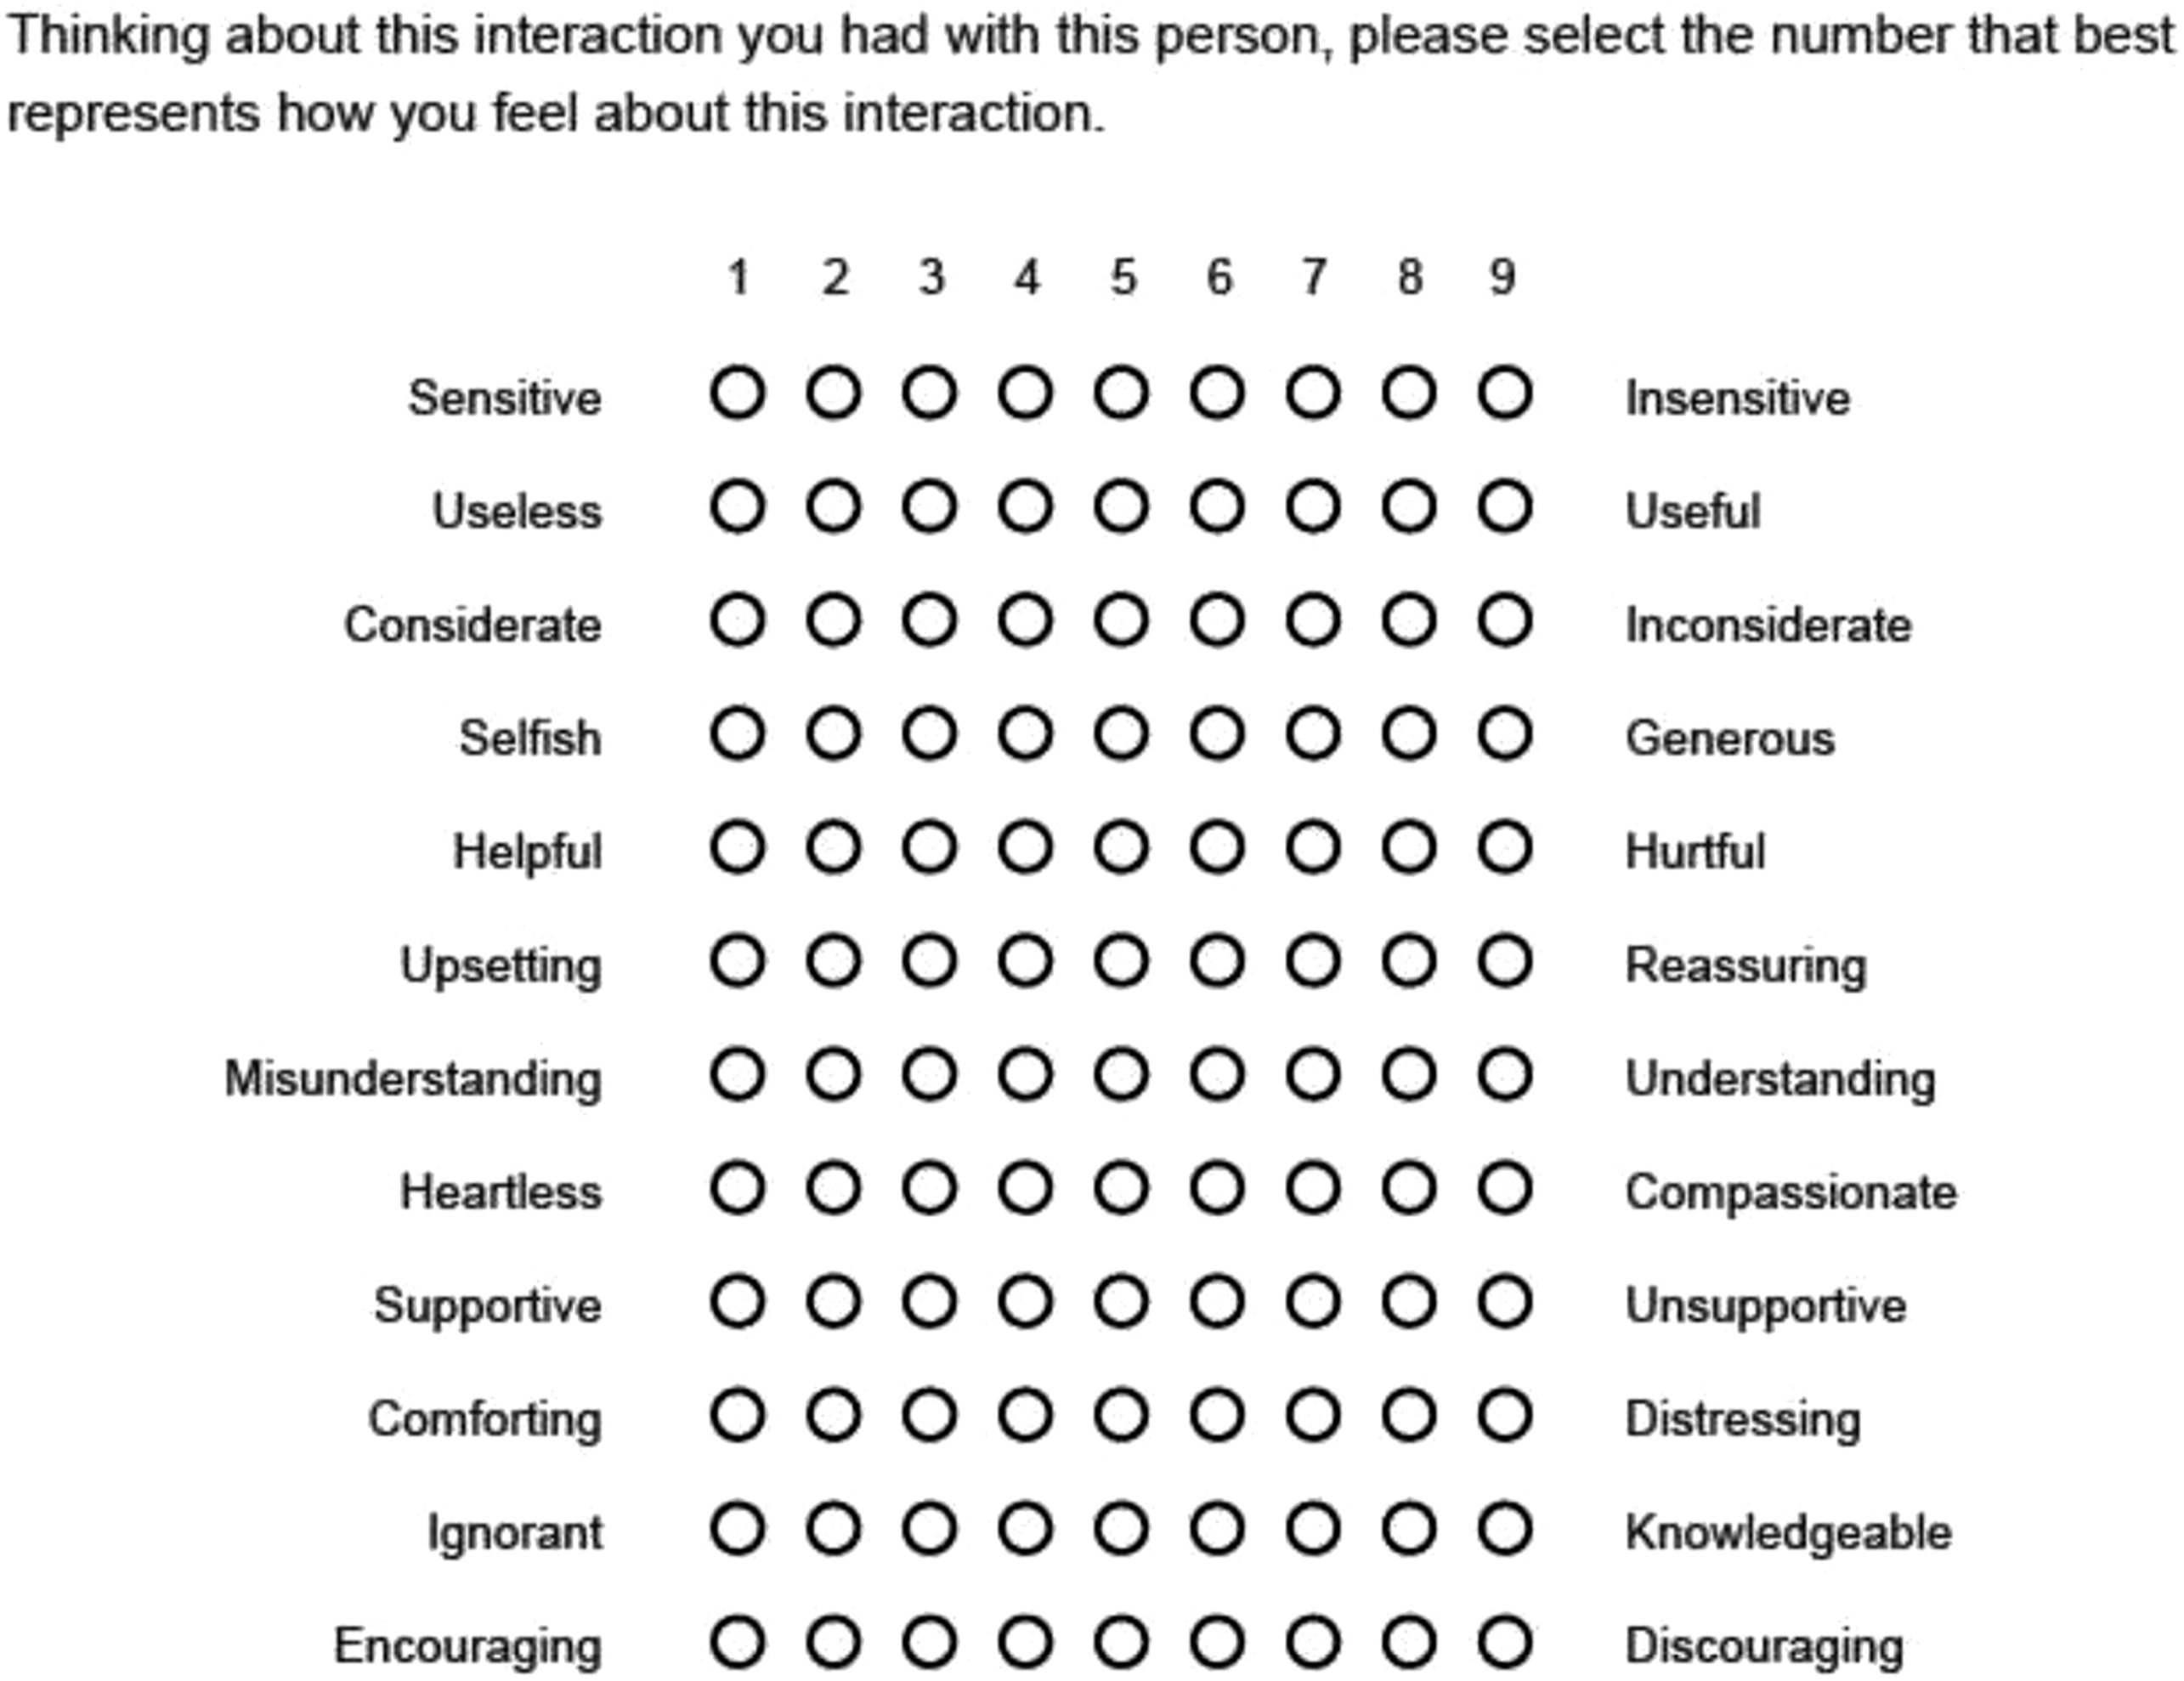
In addition to how the items and instructions are presented potentially affecting the scale’s factor structure, we also speculate that the study design itself could affect whether the scale yields a one- or three-factor loading for its items. Social support study designs have been classified by Burleson (2003) into four paradigms: a message perception paradigm (e.g., rating hypothetical supportive messages), a naturalistic paradigm (e.g., recalling a supportive interaction), an interaction analysis paradigm (e.g., recorded supportive interactions in a laboratory setting), and an experimental paradigm (e.g., inducing a stress response and analyzing subsequently communicated support). In this study, we collect data using study designs that fall under the naturalistic paradigm and the message perception paradigm. Specifically, we explore whether using the MEESS to rate a recalled supportive interaction (a naturalistic paradigm design) or to rate a hypothetical message created by researchers (a message perception paradigm design) affects the factor loading of the scale’s items.
When people recall conversations from the past, they tend to recall the gist of the messages exchanged in those conversations as opposed to the verbatim content of the messages (Brown-Schmidt & Benjamin, 2018). In a supportive communication context, this means when people are asked to recall a prior supportive conversation, they are likely recalling the gist of the most salient messages from that conversation. As a result, the nuances of the messages communicated throughout the conversation may be lost when recalled, and instead people may recall that the conversation was generally positive or negative based on a few salient messages from the interaction. This would likely lead to subsequent ratings of these recalled conversations to be more uniform in their goodness or badness, resulting in the MEESS items loading onto one factor. Conversely, reading a hypothetical message and subsequently rating it would potentially allow for more nuanced evaluations of the message as the cognitive demand of recalling a conversation would not be occurring. To investigate this possibility, we offer the following research question:
Not all supportive interactions or messages are uniformly positive or negative, though. Recent work on “mixed messages” uses a hypothetical support message design to probe instances of emotional support that simultaneously include positively and negatively valenced statements within a single message (Ray et al., 2020; 2021; Ray, 2022). These studies, which used the MEESS as an outcome variable, should have been likely candidates for the scale being multidimensional given that the messages being rated consisted of both positive statements of caring and negative statements of criticism. Yet, in all three studies the helpfulness, supportiveness, and sensitivity factors were highly correlated (reported interfactor correlations in the studies ranged from .87 to .96) and were subsequently collapsed into a unidimensional rating of message effectiveness. This is unexpected given that the messages presented to participants in these studies primarily differed in their levels of sensitivity and begs the question as to whether the MEESS is capable of detecting mixed evaluations.
Thus, to explore whether the content of the messages or conversations affect the scale’s factor structure, we offer the following research question.
Study 2 Methods
Participant Recruitment and Demographics
Participants for Study 2 were recruited through Prolific to obtain a sample that was nationally representative of the general U.S. adult population. A total of 663 potential participants opened the questionnaire, and 641 consented to participate and thus began participating. Of those 641 potential participants, 14 people were removed for failing one or more of the three attention checks. This resulted in a final sample of 627 U.S. adults. Participants received $3.00 (USD) for participating in this questionnaire. Demographic information regarding the sample is provided in Table 3.
Procedures
Participating in Study 2 consisted of partaking in an online questionnaire hosted on Qualtrics. The questionnaire involved providing demographic information and completing three activities–the first two of which are reported on in this study, with the third activity providing data for an unrelated study also on social support.
Procedure for Activity 1: Recalling and Rating a Prior Supportive Interaction
The first activity that participants completed was the supportive interaction recall procedure described in Study 1. However, unlike in Study 1 in which participants were randomly assigned to recall either a positive or negative supportive interaction about a stressor, in Study 2 we asked participants to recall their most recent supportive interaction about a stressor, regardless of how well it went
Participants were asked to provide information on how well the interaction went overall, their relation to the person they interacted with, the gender of this person, and their relational closeness to this person. This information is available on the Open Science Framework at https://osf.io/579re. Participants were then asked to rate the interaction using the 12 items from the MEESS. Approximately half (n = 313, 49.9%) of participants were randomly assigned to have the MEESS presented to them as the scale was originally created (as a single set of 12 items with one set of instructions, as seen in Figure 2). The remaining participants (n = 314, 50.1%) were randomly assigned to have the 12 items of the MEESS shown on one page but in three separate blocks (one block per factor and four items per block, as seen in Figure 2). In this condition, each set of four items had a separate set of instructions related to each of the scale’s three factors.
Procedures for Activity 2: Rating a Hypothetical Support Message
The second activity provided an opportunity to test the factor structure of the MEESS when evaluating hypothetical messages that systematically differ in their level of supportiveness, helpfulness, and sensitivity. To accomplish this, participants were randomly assigned to receive one of eight hypothetical messages. Before receiving the hypothetical message, participants were first asked which would be more distressing: losing their job or experiencing an injury. The messages received by the participants were tailored to the scenario they selected as more distressing. The overwhelming majority of participants (89.8%) reported the stressful scenario they selected had either happened to them or could happen in the future. Participants also rated the severity of the selected scenario on a 7-point scale and, in general, participants reported perceiving these scenarios as severe (M = 6.45, Med. = 6.67, SD = .65). This was confirmed by a one-sample t-test that showed the average to be significantly greater than the scale’s midpoint of four, t (626) = 94.70, p < .001.
Participants were also asked to identify a close friend who would communicate support to them if they were facing the scenario they selected. Participants reported demographic information about this supporter, which can be viewed on the Open Science Framework at https://osf.io/zaw4v. Participants were then shown the hypothetical message, which was presented as a mock text message from the friend they had identified as a likely supporter. After confirming they had read the message, participants were asked to evaluate the message using the MEESS, which was presented either as a single set of 12 items or three sets of four items based on the scale’s three factors, as detailed previously.
Creation of Hypothetical Messages for Activity 2
A total of eight message conditions were created (four messages related to losing one’s job and four messages related to experiencing an injury). These four messages in each context (job loss or injury) were created by combining three message portions–one that was either helpful or unhelpful, one that was either sensitive or insensitive, and one that was either supportive or unsupportive. First, the lead author created a job loss support message with three positive message portions: supportive, helpful, and sensitive. Then three more messages were created by replacing one of the three positive portions with a negative message portion. That is, the message that was supportive, sensitive, and helpful was used three more times: once with the supportive portion replaced with an unsupportive portion, once with the sensitive portion replaced with an insensitive portion, and once with a helpful portion replaced with an unhelpful portion. This entire process of creating a supportive, helpful, and sensitive message then creating three more messages by replacing the positive portions with negative portions was repeated again with messages related to experiencing an injury. All eight messages were 89 words long. The messages, the number of participants randomly assigned to each message, and the number of participants randomly assigned to the two different ways the scale was presented can be viewed in tables available on the Open Science Framework at https://osf.io/gmjz5. Results of pilot testing these messages, data preparation, and preliminary analyses are also available on the Open Science Framework at https://osf.io/u5whf.
To examine if participants were able to differentiate all-positive messages from the messages that included one negative message portion (either supportive, sensitive, or helpful), we used a series of independent samples t-tests. These comparisons were also separated by instruction type, either the original instructions or the alternative instructions. For the original instructions, the participants that received the all-positive messages scored significantly higher in supportiveness (M = 8.06, SD = .99), than those that received the messages that included the negative support message portion (M = 7.04, SD = 1.82), t = 4.58 (160), p < .001. The participants that received the all-positive messages scored significantly higher in sensitivity (M = 8.00, SD = .92), than those that receive the messages that included the negative sensitivity message portion (M = 4.26, SD = 2.24), t = 14.65 (167), p < .001. The participants that received the all-positive messages did not score significantly higher in helpfulness (M = 7.61, SD = 1.50), than those that received the messages that included the negative helpfulness message portion (M = 7.78, SD = 1.19), t = −.74 (145), p = .231. For the original instructions, participants were able to differentiate positive and negative supportive and sensitive message portions, but not helpfulness message portions.
For the alternative instructions, the participants that received the all-positive messages scored significantly higher in supportiveness (M = 7.96, SD = 1.40), than those that received the messages that included the negative support message portion (M = 6.96, SD = 1.69), t = 3.85 (151), p < .001. The participants that received the all-positive messages scored significantly higher in sensitivity (M = 7.80, SD = 1.55), than those that received the messages that included the negative sensitivity message portion (M = 4.22, SD = 2.22), t = 10.88 (140), p < .001. The participants that received the all-positive messages scored significantly higher in helpfulness (M = 7.81, SD = 1.17), than those that received the messages that included the negative helpfulness message portion (M = 7.24, SD = 1.57), t = 2.70 (166), p < .01. For the alternative instructions, participants were able to differentiate positive and negative supportive, sensitive, and helpfulness message portions.
Study 2 Results
Confirmatory factor analyses for study 2 (N = 627).

Notes. *p < .05, **p < .001. For all significant differences, the three-factor solution was superior to the one-factor solution.
But first, because participants engaged in two different activities, both of which included either the original set of instructions or the alternative instructions, it is important to examine if any order effects were present in the data. Based on the two different activities and the two sets of instructions for each activity, participants were included in one of four different cells. As a preliminary analysis, we compared the average Activity 2 MEESS score for participants who completed Activity 1/original instruction and completed Activity 2/original instructions to participants who completed Activity 1/alternative instructions and completed Activity 2/original instructions, t = .04 (310), p > .05. We also compared the average Activity 2 MEESS score for participants who completed Activity 1/original instruction and completed Activity 2/alternative instructions to participants who completed Activity 1/alternative instructions and completed Activity 2/alternative instruction, t = −1.38 (312), p > .05. As expected, there were no significant order effects in the MEESS scores for Activity 2 (either the original or alternative instructions) based on the set of instructions participants received during Activity 1. These results indicate that there were no order effects impacting the results for Activity 2.
RQ1: Is the MEESS a One- or Three-Factor Scale?
The first research question used a separate sample from the one collected for Study 1 to test the factor structure of the MEESS. Because two sets of instructions were given for the recall activity (Activity 1), we only examined the results from the original set of instructions. The CFA for the one-factor solution demonstrated adequate model fit, χ2 (54) = 168.33, p < .001, CFI = .98, RMSEA = .08, SRMR = .02. Similarly, the CFA for the three-factor solution also demonstrated adequate model fit, χ2 (51) = 158.65, p < .001, CFI = .98, RMSEA = .08, SRMR = .02. The average interfactor correlation for the three-factor solution was r = .92. Comparing these two models, the three-factor solution demonstrated a small but significantly better fit to the data, χ2diff (3) = 9.68, p < .05.
RQ2: Does the Presentation of the MEESS Items and Instructions Affect Factor Structure?
The second research question explored whether the presentation of the scale’s items and instructions affected the factor structure and item loadings for the scale. Using the recall activity (Activity 1), we compared the original format of the scale, which presents all 12 items in one block with one general set of instructions, versus an alternative format that presents the items by factor, in sets of four items, with factor-specific instructions. The results for the original instructions version (provided below) are the same results given above in RQ1.
For the original set of instructions, the one-factor solution demonstrated adequate model fit, χ2 (54) = 168.33, p < .001, CFI = .98, RMSEA = .08, SRMR = .02. With the original instructions, the CFA for the three-factor solution also demonstrated adequate model fit, χ2 (51) = 158.65, p < .001, CFI = .98, RMSEA = .08, SRMR = .02. The average interfactor correlation for the three-factor solution was r = .92. With the original instructions, the three-factor solution demonstrated a small but significantly better fit to the data, χ2diff (3) = 9.68, p < .05.
For the alternative set of instructions which presented the items in sets of four, the one-factor solution demonstrated poor model fit, χ2 (54) = 483.94, p < .001, CFI = .93, RMSEA = .16, SRMR = .03. With the alternative instructions, the CFA for the three-factor solution demonstrated adequate model fit, χ2 (51) = 118.28, p < .001, CFI = .99, RMSEA = .07, SRMR = .02. The average interfactor correlation for the three-factor solution was r = .89. With the alternative instructions, the three-factor model provided a substantial and significantly better fit to the data than the one-factor model, χ2diff (3) = 365.66, p < .001.
RQ3: Is Factor Structure Dependent on Study Design?
The third research question investigated whether the factor structure of the MEESS is dependent on the study design, specifically recalling a supportive interaction and rating it (i.e., a naturalistic paradigm design) versus receiving and rating hypothetical support messages (i.e., a message perception paradigm design). For the results of the recalled support messages (provided below), we are reporting the same results given above in RQ2.
For recalled support messages (Activity 1) using the original instructions, the one-factor solution demonstrated adequate model fit, χ2 (54) = 168.33, p < .001, CFI = .98, RMSEA = .08, SRMR = .02. With the original instructions, the CFA for the three-factor solution also demonstrated adequate model fit, χ2 (51) = 158.65, p < .001, CFI = .98, RMSEA = .08, SRMR = .02. The average interfactor correlation for the three-factor solution was r = .92. With the original instructions, the three-factor solution demonstrated a small but significantly better fit to the data, χ2diff (3) = 9.68, p < .05.
For the hypothetical support messages (Activity 2) utilizing the original set of instructions the one-factor solution demonstrated poor model fit, χ2 (54) = 227.15, p < .001, CFI = .97, RMSEA = .12, SRMR = .02. The CFA for the three-factor solution demonstrated adequate model fit, χ2 (51) = 210.50, p < .001, CFI = .97, RMSEA = .10, SRMR = .02. The average interfactor correlation for the three-factor solution was r = .93. For hypothetical support messages utilizing the original instructions, the three-factor solution demonstrated a significantly better fit to the data, χ2diff (3) = 16.65, p < .001.
For recalled support messages (Activity 1) using the alternative set of instructions, the one-factor solution demonstrated poor model fit, χ2 (54) = 483.94, p < .001, CFI = .93, RMSEA = .16, SRMR = .03. With the alternative instructions, the CFA for the three-factor solution demonstrated adequate model fit, χ2 (51) = 118.28, p < .001, CFI = .99, RMSEA = .07, SRMR = .02. The average interfactor correlation for the three-factor solution was r = .89. With the alternative instructions, the three-factor model provided a substantial and significantly better fit to the data than the one-factor model, χ2diff (3) = 365.66, p < .001.
For the hypothetical support messages (Activity 2) utilizing the alternative set of instructions the one-factor solution demonstrated poor model fit, χ2 (54) = 629.95, p < .001, CFI = .88, RMSEA = .19, SRMR = .04. The CFA for the three-factor solution demonstrated poor model fit, χ2 (51) = 266.92, p < .001, CFI = .96, RMSEA = .12, SRMR = .03. The average interfactor correlation for the three-factor solution was r = .85. For hypothetical support messages utilizing the alternative instructions, the three-factor solution demonstrated a substantial and significantly better fit to the data, χ2diff (3) = 363.03, p < .001, though both models exhibited poor model fit overall.
RQ4: Is Factor Structure Affected When the MEESS is Used on Mixed Messages?
The fourth research question explored the MEESS’s factor structure when the hypothetical support messages received simultaneously consisted of positive and negative attributes (i.e., mixed messages). To test this question, we conducted confirmatory factor analyses on participants who received messages that were mixed in quality during the hypothetical support message activity (Activity 2). That is, the messages they received were not uniformly positive (i.e., either low helpfulness, low supportiveness, or low sensitivity).
For evaluations of the mixed-quality hypothetical support messages (Activity 2) utilizing the original set of instructions, the one-factor solution demonstrated poor model fit, χ2 (54) = 189.34, p < .001, CFI = .96, RMSEA = .11, SRMR = .02. The CFA for the three-factor solution demonstrated poor model fit, χ2 (51) = 184.57, p < .001, CFI = .96, RMSEA = .11, SRMR = .02. The average interfactor correlation for the three-factor solution was r = .94. For evaluations during mixed-quality hypothetical support messages, there was no significant difference between the models, χ2diff (3) = 4.77, p > .05.
For evaluations of the mixed-quality hypothetical support messages (Activity 2) using the alternative set of instructions, the one-factor solution demonstrated poor model fit, χ2 (54) = 539.19, p < .001, CFI = .88, RMSEA = .19, SRMR = .05. The CFA for the three-factor solution demonstrated poor model fit, χ2 (51) = 208.40, p < .001, CFI = .96, RMSEA = .11, SRMR = .03. The average interfactor correlation for the three-factor solution was r = .86. For evaluations during mixed-quality hypothetical support messages, the three-factor solution demonstrated a substantial and significantly better fit to the data, χ2diff (3) = 330.79, p < .001, though neither model demonstrated strong model fit.
Study 2 Discussion
These confirmatory factor analyses (CFAs) give several insights into the best use of the MEESS depending on study parameters. First, using the original set of instructions, the three-factor model demonstrated slightly better model fit than the one-factor model, although both demonstrataed only adequate model fit. However, when the alternative instructions were utilized, the three-factor model was clearly superior to the one-factor model. Second, when employing hypothetical support messages, the three-factor model again demonstrated substantially better model fit than the one-factor model. Finally, for evaluations of hypothetical “mixed messages” of support, the three-factor model provides the best model fit. In each case, the interfactor correlations decreased with the use of the alternative instructions as compared to the original instruction.
The results of these CFAs suggest that, in general, the MEESS acts as a multidimensional scale, and that a three-factor solution is superior especially when presenting the items using the alternative instructions (i.e., one factor at a time with factor-specific instructions). We recommend that researchers use the alternative instructions developed and tested herein, as they provide the best opportunity to capture nuanced perceptions of different aspects of supportive messages. In the following section, we provide further discussion of using the MEESS, discuss the strengths and weaknesses of our studies, and consider future research directions.
General Discussion
The purpose of this study was to evaluate the Multidimensional Evaluation of Enacted Social Support (MEESS; Goldsmith et al., 2000) to address issues of sample representativeness during the scale’s creation and issues of factor structure that have arisen over two decades of the scale’s use. Issues of sample representativeness (i.e., the use of undergraduate college students when developing and validating the scale) were addressed by using nationally representative samples of U.S. adults in both our studies. The exploratory factor analysis and confirmatory factor analysis from Study 1, in combination with several factor analyses conducted in Study 2, allowed us to adjudicate if the MEESS should be treated as a multidimensional (three-factor) or unidimensional (one-factor) scale.
Recommendations for Using the MEESS
Overall, the MEESS is an effective instrument for measuring the quality of enacted social support. In general, we recommend presenting the scale using the alternative format that presents items by factor with factor-specific instructions. Doing so provides the best chance for researchers to accurately measure the effectiveness of support messages across different characteristics, which is a strength of the scale and a central reason as to why the scale was initially developed. However, we also note that the scale did yield high interfactor correlations, regardless of which set of instructions were used — although the interfactor correlations were smaller when using the alternative, factor-specific instructions. This suggests that, at times, the three factors do not discriminate well from one another. We strongly recommend performing a confirmatory factor analysis each time the MEESS is used in order to determine how the items are loading for each particular data set. This would be particularly important in cases when researchers have decided to add additional context-specific items to the scale or have decided to remove items from the scale, as some researchers have done in the past. The addition or removal of items could change the factor structure and, again, points to the need for always conducting a confirmatory factor analysis when using the MEESS.
Finally, we implore all researchers to refer to the scale as the Multidimensional Evaluation of Enacted Social Support in all future research endeavors. Even if using the scale as a unidimensional measurement of support quality, we recommend referring to the scale by this name and then noting that the decision was made to treat the scale's items as a single factor (ideally as the result of conducting and reporting a confirmatory factor analysis). Doing so will resolve decades of inconsistency in how the scale has been referred to in dozens of publications.
Recommendations for Using Other Multidimensional Scales
The MEESS is not the only multidimensional scale used in communication studies and allied disciplines. There are other multidimensional scales that specifically measure aspects of social support, such as the multidimensional scale of perceived social support (Zimet et al., 1988). Given that multidimensional scales may at times, depending on the data collected for a particular study, return a factor loading suggesting unidimensionality, we reissue Levine et al.’s (2006) call for using and reporting confirmatory factor analyses when using multidimensional scales. Confirmatory factor analyses should be conducted as part of the process of preparing data for a study’s hypothesis tests–in the same way that researchers are expected to recode reverse-scored items or address instances of missing data before performing statistical tests. Reporting the results of confirmatory factor analyses should become a standard within the communication discipline and the social sciences and should be reported as commonly as other statistics for scales, such as the mean, standard deviation, and internal reliability statistics such as Cronbach’s alpha (or the now preferred McDonald’s omega).
Additionally, we also suggest that researchers using multidimensional scales should consider presenting the items by factor and with specific instructions for each factor (when feasible), just as we have recommended herein when administering the MEESS. We make this recommendation based on the consequences of insufficient effort responding (Hong et al., 2020), including the potential for insufficient effort responding to disturb a scale’s factor structure (Huang et al., 2012; Woods, 2006).
Strengths, Limitations, and Future Directions
Although the studies reported herein have several methodological strengths, no study is without limitations. For example, in Study 1 we randomly split the sample and conducted the EFA with half of our representative sample and the CFA with the other half. Fortunately, our sample size was large enough to support splitting the sample without a loss in power for either test. Further, Study 1 utilized cross-sectional recall data that only examined positive or negative examples. Although adequate for our purposes, we were not able to examine messages with mixed evaluations in Study 1 like we were able to in Study 2.
A limitation of Study 2 is that the data collected only reflects two of the four social support research paradigms outlined by Burleson (2003). Although the data collected allowed us to evaluate the MEESS in study designs categorized within the message perception paradigm and the naturalistic paradigm, none of the data collected was done using live interactions or laboratory experiments. Researchers should conduct confirmatory factor analyses on the MEESS when used in interaction studies and laboratory experiment studies in the future.
A second limitation of Study 2 is that we only tested hypothetical support messages with one problematic factor (e.g., helpful and supportive but insensitive). Obviously, some support messages received in the course of people’s lives may be problematic in more than one way (e.g., supportive but unhelpful and insensitive), including the potential for a message to be rated low across all three factors. Future studies should investigate how the scale’s items load when mixed messages that are problematic in more than one way are presented to participants.
In both studies reported herein, we used nationally representative samples of U.S. adults and collected extensive demographic data that is typically not reported in communication research, such as average income and sexual orientation (Afifi & Cornejo, 2020). Although nationally representative samples are a stronger methodological choice than the use of college student samples (Peterson, 2001; Sears, 1986), there are still some limitations regarding our samples that are worth noting. First, even though we used the company Prolific to recruit nationally representative samples, no sample can be fully representative of the general population. For example, Prolific recruited a sample that approximated the general population of U.S. adults based on age and gender. In terms of ethnicity, Prolific’s samples are based on simplified U.S. Census data. As a result, in both our studies, the percentage of participants identifying as Latinx and/or Hispanic were low (Study 1 = 5.9%; Study 2 = 5.1%), suggesting that Latinx and Hispanic adults were underrepresented in both samples. We also did not measure ability status in either sample.
We also note that a nationally representative sample of U.S. adults creates a geographic boundary around the generalizability of this study in that people from societies beyond the U.S. may respond to the items on this scale differently. Future research endeavors should test this scale in societies that are not WEIRD (Western, Educated, Industrialized, Rich, Democratic). Such studies would strengthen the validity of the scale while simultaneously contributing to answering Afifi and Cornejo’s (2020) call for better sample representativeness in interpersonal communication. In doing so, such research endeavors could also investigate other psychometric properties of the MEESS beyond factor structure, such as convergent and discriminant validity.
Conclusion
To summarize, we conducted two studies that evaluated the Multidimensional Evaluation of Enacted Social Support (MEESS) to address issues such as the use of nonrepresentative college student samples during the scale’s development and the use of the scale as a unidimensional measure of support by several research teams over the past two decades. Based on our analyses of the data from both studies, we recommend treating the MEESS as a multidimensional scale unless a confirmatory factor analysis shows the scale's items have loaded onto one factor for one’s particular data set. Additionally, we recommend that researchers present the 12 items one factor at a time, with four items per factor, and with three sets of factor-specific instructions. Also, based on years of researchers inconsistently referring to the scale by different names, we recommend that all researchers refer to the scale as the Multidimensional Evaluation of Enacted Social Support (MEESS) in all future studies using the scale. Finally, the results of both studies reaffirm the need for researchers in communication studies and the social sciences in general to consistently conduct and report confirmatory factor analyses when using scales with three or more items.
Supplemental Material
Supplemental Material - The multidimensional evaluation of enacted support scale: Best practices for use based on issues of factor structure, study design, and scale instructions
Supplemental Material for The multidimensional evaluation of enacted support scale: Best practices for use based on issues of factor structure, study design, and scale instructions by Colter D. Ray and Alan C. Mikkelson in Journal of Social and Personal Relationships
Footnotes
Acknowledgements
The authors do not have any acknowledgements.
Funding
The author(s) received no financial support for the research, authorship, and/or publication of this article.
Open research statement
As part of IARR’s encouragement of open research practices, the author(s) have provided the following information: This research was not pre-registered.
Data availability
The data used in the research cannot be publicly shared but are available upon request.
Supplemental Material
Supplemental material for this article is available online.
References
Supplementary Material
Please find the following supplemental material available below.
For Open Access articles published under a Creative Commons License, all supplemental material carries the same license as the article it is associated with.
For non-Open Access articles published, all supplemental material carries a non-exclusive license, and permission requests for re-use of supplemental material or any part of supplemental material shall be sent directly to the copyright owner as specified in the copyright notice associated with the article.