
Abstract
Having strong, diverse social relationships is tightly linked to myriad physical and mental health benefits by mitigating the negative impacts of adverse events. The COVID-19 pandemic brought increased uncertainty and changes to our social lives that reduced the spread of COVID-19 (e.g., social distancing), but also likely impacted emotional well-being. We investigated how one of these changes – changing social networks – relates to emotional bias (a proxy for well-being), specifically one’s tendency to interpret ambiguous stimuli as positive or negative (i.e., valence bias). Participants (N = 614) categorized the valence of clearly (e.g., angry and happy expressions) and ambiguously valenced stimuli (e.g., surprised expressions), and were asked about their social network before and during the pandemic. Compared to before the pandemic, participants reported a decrease in overall network size (p < .001) and number of embedded networks (i.e., a measure of network complexity represented by number of areas of social activity; p < .001). In a model with all three social network dimensions (size, complexity, diversity), network complexity uniquely predicted valence bias (p = .02). Specifically, participants with greater social network complexity during the pandemic showed a more positive bias. Further, participants that did not experience a pandemic-related reduction in network complexity were protected from pandemic-related increases in negativity (p < .001). In other words, having a more complex social network could act as a protective factor against adverse outcomes in times of uncertainty.
Having strong social relationships is tightly linked to myriad health benefits. Such benefits include increased longevity (Holt-Lunstad, 2018; Holt-Lunstad et al., 2017), faster recovery from physical illness (e.g., stroke and upper-respiratory diseases; Seeman, 1996) and better gut health, which can bolster immunity (Dill-MacFarland et al., 2019). In addition to physical health benefits, having strong social relationships is associated with improved cognitive and emotional health and well-being (Appau et al., 2019), including lower likelihood of age-related cognitive decline and better self-esteem (Cohen & Wills, 1985; Harris & Orth, 2020; Kawachi & Berkman, 2001). Thus, maintaining multiple robust social connections appears to offer many protective benefits for well-being, perhaps by buffering or protecting against the negative impacts of uncontrollable and adverse events and associated stress (Barnes et al., 2009; Cohen & Wills, 1985; Holt-Lunstad, 2018).
Notably, the same uncontrollable, adverse events that threaten our well-being may also directly threaten our social networks. The COVID-19 pandemic was a global catastrophe that resulted in large-scale changes to daily life. In an effort to mitigate the spread of COVID-19, many governments placed restrictions on social movement and in-person social interactions, some of which included lockdowns, curfews, and encouraging a social distance of a least six feet (Christensen et al., 2020; Masters et al., 2020; Wang, 2021). Further, many companies moved to a work-from-home model for employees. As a direct result of these measures, there was a severe loss of social contact in many people’s lives (Bierman et al., 2021; Kovacs et al., 2021), which could have exacerbated the potential threats to our health and well-being (Ford, 2021; Marroquín et al., 2020). Reports show unprecedented increases in symptoms of depression and anxiety in the United States during the pandemic, which could be a symptom of social losses, as well as other COVID-related impacts, such as loss of income (Barendse et al., 2023; Hawes et al., 2022; Twenge & Joiner, 2020; Vahratian et al., 2021). Interestingly, as in-person social interactions diminished, online interactions (i.e., video calls) with close social ties such as friends and family flourished, likely as a compensatory mechanism that allowed for some maintenance of social connection (Dhakal et al., 2022; Freedman et al., 2022; Tibbetts et al., 2021). Social contact was fundamentally altered, or in some cases severed, across many social domains (e.g., family, friends, volunteering, work/school). The widespread outcomes of this major social change could have occurred broadly—impacting all domains—or these changes could have occurred differently as a function of social domain. The resulting impact of these changes on well-being, particularly emotional well-being, could have been innumerable.
Social network losses are detrimental to well-being through several potential factors, such as loss of interpersonal emotion regulation opportunities, increased loneliness, and increased stress. First, social disconnection limits the opportunities to engage in interpersonal emotion regulation, which is the goal-directed process of changing one’s emotions through social interaction (Williams et al., 2018; Zaki & Williams, 2013). Individuals with higher interpersonal emotion regulation efficacy show greater social and emotional well-being (Tran et al., 2022; Williams et al., 2018; Zaki & Williams, 2013). In part, this is likely because they benefit more from social support after emotional events (Williams et al., 2018). More recently, research highlighted that interpersonal emotion regulation buffers against neuroticism-related negativity (Brock et al., 2022).
Second, social disconnection and isolation is associated with increased loneliness (Holt-Lunstad et al., 2015; Kovacs et al., 2021). Indeed, the resulting loneliness from social disconnection can contribute to hypervigilance and heightened sensitivity to ambiguous and negative social cues, feeding into a vicious cycle that encourages further social isolation (Qualter et al., 2013; Vanhalst et al., 2017). In addition, linking with the findings reported above, social connectedness was associated with a greater tendency to engage in sharing positive emotions, and seemingly protected from loneliness-related negativity (exacerbated negative responses to ambiguity) early in the pandemic (Harp & Neta, 2023).
Third, social disconnection can be incredibly stressful (Gryksa & Neumann, 2022). Social losses – such as those that occurred in the pandemic – can increase stress, which is associated with increased negative responses to ambiguity (Brown et al., 2017; Raio et al., 2021) and harmful impacts on well-being (i.e., responses to emotionally ambiguous social cues/signals; Ford, 2021; Marroquín et al., 2020). Not only is the dissolution of social bonds inherently stressful (Eisenberger, 2012), but we also lose a buffer against stress (Cohen & Wills, 1985; Eisenberger, 2012; Humphrey et al., 2022). Positive social interaction can buffer against stress potentially by inhibiting a maladaptive stress response (DeVries et al., 2003; Gryksa & Neumann, 2022; Kikusui et al., 2006). Together, social isolation and disconnection are associated with increased rates of early death (Harris, 2023). In contrast, maintaining social relationships and utilizing those relationships to cope with shared adversity is beneficial (Harp & Neta, 2023). Thus, social losses – such as those that occurred in the pandemic – can trigger stress, which is associated with increased negative responses to ambiguity (Brown et al., 2017) and has harmful impacts on well-being (i.e., responses to emotionally ambiguous social cues/signals; Raio et al., 2021).
In the present study, we examined the impact of the COVID-19 pandemic on social connection, and the downstream consequences for emotional well-being. Social network indices are a useful tool to quantify one’s social relationships and regular social contact. We used the Social Network Index, developed by Cohen et al. (1997), which measures three dimensions of an ego-centric social network: size, diversity, and embedded networks. Network size is the number of people in a respondent’s network, and network diversity is the number of social roles the respondent fulfills. In contrast, embedded networks are quantified as the number of different social domains (family, friends, church/temple, school, work, neighbors, volunteering, other groups) within which an individual is active (i.e., has frequent interactions with at least four people). In this way, embedded networks reflects both diversity (i.e., various social domains/roles) and network size (i.e., a minimum of four connections constituting an embedded network), and thus represent social network complexity (Bickart et al., 2011). COVID-19 caused widespread changes to social connections across all social domains (e.g., frequency with which you are interacting with coworkers, friends) en masse, thus this measure of embedded networks may better reflect those changes, more so than network size or diversity alone. This dimension provides a nuanced perspective to small losses as they occur across multiple unique domains, and as such will be the best measure for quantifying the impact of the pandemic on well-being.
For our outcome measure of emotional well-being, we examined changes in responses to ambiguity (i.e., valence bias) during the pandemic. Emotionally ambiguous stimuli – those that do not have a clear positive or negative valence – can be interpreted as having either a positive or negative meaning. One’s tendency to ascribe these stimuli with a more positive or negative meaning (i.e., valence bias) is a stable individual difference (Neta et al., 2009). This bias is associated with emotional well-being as it has been strongly linked with other well-being factors; for instance, a more negative bias is associated with higher negative affect (Neta & Brock, 2021) and increased symptoms of depression (Cohen’s d = 0.73; Petro et al., 2021) and anxiety (r = 0.29; Park et al., 2016).
Using these measures, we aimed to probe how widespread changes to social networks, intended to prevent the spread of COVID-19, impacted mental and emotional well-being. We assessed social network dimensions and valence bias in a large online sample over several timepoints in the pandemic between Spring 2020 (late March-April 2020; US Federal Government declared state of emergency on March 13th, 2020, with shelter-in-place orders) and Spring 2021 (March-April 2021). We focused our analyses on differences between Spring 2020 and Spring 2021 as the Social Network Index data was only collected at Spring 2021. We had four exploratory hypotheses stemming from a larger preregistered study that examined valence bias in the pandemic (osf.io/t7sr6), and which reports all measures, manipulations, and exclusions. First, we predicted that participants’ social networks decreased throughout the pandemic, with those losses being best captured by measures of network complexity. Second, we predicted that participants with greater network complexity in Spring 2021 would also have a more positive valence bias, and that such an effect would supersede any adverse effects of interpersonal emotion regulation, loneliness, and perceived stress. Third, we predicted participants with pandemic-related reductions in network complexity would show a parallel reduction in well-being (i.e., a shift towards a more negative valence bias). Fourth, we predicted that participants would experience a reduction in in-person contact, and an increase in online contact, from Spring 2020 to Spring 2021, and we explored the relationship between any changes in form of contact and concomitant changes in social networks and valence bias.
Method
Participants
Participants for this study were recruited from Amazon’s Mechanical Turk (MTurk). Inclusion criteria were 18 years or older, native English speakers, living in the United States, and had no history of psychiatric or neurological disorders. Sample size was determined before any data analysis (see osf.io/t7sr6). Data collection deviated slightly from pre-registration to account for the longer than expected timecourse of the pandemic. Participants were recruited across multiple timepoints—spanning from just before the pandemic (i.e., October 2019 through January 2020; Wave 1) through Spring 2021 (Wave 4a; N = 489, of which 429 completed the entire experiment). Wave 4a comprised participants that had completed at least one prior wave. An additional group of participants were recruited at the same time as Wave 4a that were completely new to the study (i.e., had not completed any prior wave; Wave 4b; N = 296 of which 234 completed the entire experiment; see Stimuli and Procedure for more details). Both Wave 4a and Wave 4b were used in analyses examining the relationship between social network structure and valence bias. 614 participants (51% female, 45% male, 3% other/did not respond; Age = 19–90, M(SD)age = 41.1 (13.1), 78% White, 8% Black/African American, 7% Asian, 1% American Indian/Alaskan Native, 0.3% Native Hawaiian/Pacific Islander, 5% other/did not respond; reported income: 10.9% <$25k, 25.6% $25k to <$50k, 32.9% $50k to <$80k, 19.5% $80k to <$130k, 5.7% $130k to <$200k, 2.1% >$200k, 3.3% did not respond) responded to the Social Network Index and were used in analyses looking at change in social network structure. Participants that did not accurately respond to clearly valenced stimuli (see Analyses; n = 104 from Wave 4a; n = 48 from Wave 4b) were removed from analyses, resulting in a final sample of 462 participants (53% female, 46% male, 1% other/did not respond; Age = 19–90, M(SD)age = 42.1 (13.1), 82.5% White, 5.8% Black/African American, 8.5% Asian, 0.9% American Indian/Alaskan Native, 0.2% Native Hawaiian/Pacific Islander, 2% other/did not respond; reported income: 11.5% <$25k, 26.6% $25k to <$50k, 29.9% $50k to <$80k, 21% $80k to <$130k, 5.4% $130k to <$200k, 2.4% >$200k, 3.2% did not respond) that were used in analyses exploring social network dimensions and valence bias. A sensitivity power analysis of difference between two means computed using G*Power (𝛼 = 0.05, two-tailed; Faul et al., 2007) showed that this sample size provided adequate power (80%) to detect a small effect (d = .11). A subset of participants from Wave 4a that also completed the task at Wave 2 (March to April (Spring) 2020; N = 214, 57% female, 43% male; Age = 19–90, M(SD)age = 42.6 (13.2), 86% White, 5% Black/African American, 7% Asian, 2% other/did not respond) were used for analyses looking at changes in valence bias during the pandemic. A sensitivity power analysis of difference between two means computed using G*Power (𝛼 = 0.05, two-tailed; Faul et al., 2007) showed that this sample size provided adequate power (80%) to detect a small effect (d = .19). Participants received monetary compensation for participating in the study. All the procedures were approved by the University of Nebraska-Lincoln Institutional Review Board.
Stimuli
Stimuli included faces, scenes, and words. Both the face and scene stimulus sets included 24 ambiguous and 24 clearly valenced (12 positive, 12 negative) stimuli. Faces were taken from NimStim (Tottenham et al., 2009) and Karolinska Directed Emotional Faces (Lundqvist et al., 1998), including angry and happy faces as clearly negative and positive, respectively, and surprised faces as relatively ambiguous. Scenes from the IAPS database (Lang et al., 2008) were selected from a set that was previously validated as either clearly positive (e.g., puppies) or negative images (e.g., a bad car accident) or those that are ambiguous in that they are appraised as positive by some individuals and as negative by others (e.g., a tearful scene that could be a reunion or a parting ways; Neta et al., 2013). The words were taken from prior work and included 22 ambiguous (e.g., “BREAK” which could refer to a vacation – spring break – or an injury – bone break) and 22 clearly valenced (11 positive, e.g., “SUNSET”; 11 negative, e.g., “DEADLY”) words (Harp et al., 2021). Words were presented capitalized in black font centered on a white background.
For each stimulus category (faces, scenes, and words), the stimuli were split into two sets (each set included 50% ambiguous stimuli, 25% clearly positive, and 25% clearly negative), and presented as two separate blocks. In other words, participants viewed six task blocks, two of each stimulus category, with interleaving blocks of each category in a counterbalanced order, as in prior work (Harp et al., 2021).
Procedure
The task was administered using Gorilla Experiment Builder (Anwyl-Irvine et al., 2019). Only participants located in the United States using a computer (i.e., no phone or tablet) could participate. This device requirement was set through Gorilla Experiment Builder and would prevent people from participating if they were not on a computer; our experiment included a message that encouraged participants to switch to a computer if they wished to participate in the experiment. Participants were randomly assigned to a pseudorandom presentation order of faces, words, and scenes, and were asked to categorize the stimuli as either positive or negative. Within each block, stimuli were presented for 500 ms in random order, followed by a 1500 ms fixation cross. If participants did not make a response within 2000 ms, the task advanced to the next trial and no response was recorded. Participants categorized stimuli by pressing the “A” or “L” key on their computer, and response key was counterbalanced across participants. The percent positive categorizations were calculated out of the total number of trials for that stimulus category (excluding omissions; Neta et al., 2009). After the behavioral task, participants completed questionnaires, including several described below.
Questionnaires
The
The
The
The
Additionally, participants were asked to report the frequency of in-person and online interactions with friends and relatives (each on a 6-point scale ranging from never (1) to very frequently (6)) in an average two-week period. Participants also retroactively reported the frequency of these interactions – in-person and online – prior to the pandemic.
Analyses
Data processing, analysis, and visualization were completed in R (Version 4.2.2; R Core Team, 2022). There were 140 trials where participants categorized stimuli as positive or negative. The responses to the stimuli were averaged into one score for each valence category (positive, negative, ambiguous) across the stimuli groups. Prior to calculating valence bias, operationalized as the percent positive categorizations for each stimulus category, trials with reaction times less than 250 ms or larger than three standard deviations above the participant mean were removed (Harp et al., 2021). Only participants’ first response to each stimulus presentation was used for calculating the percent positive categorizations for each stimulus category. Data from participants that did not accurately categorize clearly valenced stimuli (i.e., <60% accuracy) for one stimulus category (faces, words, or scenes) were treated as missing for that category. Participants that did not accurately categorize clearly valenced stimuli for two or more stimulus categories were removed prior to data analysis.
To test our first prediction that social networks – and particularly social network complexity (embedded networks) – decreased throughout the pandemic, we ran paired t-tests comparing pandemic SNI dimensions (size, diversity, complexity) to retrospectively reported pre-pandemic levels.
To model associations among the different SNI dimensions and valence bias, we used mixed effect linear regressions as implemented in the lme4 package (Bates et al., 2015) and lmerTest package (Kuznetsova et al., 2017). Specifically, we modeled the percent positive categorizations in response to clearly and ambiguously valenced stimuli as the dependent variable with a random subject intercept. Then, all three SNI dimensions were added as predictors in the model, as well as a Valence factor (Positive, Negative, Ambiguous) to determine if the relationship was specific to categorizations of emotional ambiguity (i.e., a Valence x SNI dimension interaction), or applicable to the clearly valenced stimuli as well. In addition, to test our second prediction that greater social network complexity was associated with a more positive valence bias, above and beyond effects related to interpersonal emotion regulation, loneliness, and perceived stress (given that all of these three variables are affected by social losses and related to valence bias; Brock et al., 2022; Harp & Neta, 2023; Raio et al., 2021), we added the IRQ, UCLA, and PSS as covariates to examine the robustness of the SNI-related effects. We tested a separate model to examine the possible effects of stimulus category (faces, words scenes) as a factor and valence bias.
To test our third prediction that pandemic-related reductions in embedded networks would show a parallel reduction in emotional well-being, difference scores for both measures were calculated. For valence bias, the scores were calculated by subtracting Wave 4a (Spring 2021) valence bias from Wave 2 (Spring 2020) valence bias. Thus, a negative-signed change score represents a reduction in well-being, captured by a reduction in positive categorizations (which could also be conceptualized as an increase in negative categorizations) of emotionally ambiguous stimuli. Similarly, differences in social network complexity were calculated by subtracting Wave 4a SNI embedded networks from participants’ retrospective reports of SNI embedded networks pre-pandemic. Thus, a negative-signed change score for social network complexity represents a reduction in one’s social network embedded networks. Mixed effect linear regressions were then conducted to assess the association between change in social network complexity and changes in valence bias. Again, we used random subject intercepts, a fixed Valence factor (Positive, Negative, Ambiguous), and a continuous predictor of SNI complexity change. Significance of fixed effects in all mixed effects models were tested using Wald’s X 2 tests, as implemented in the Anova function from R’s car package (Fox & Weisberg, 2019). Significant interactions were probed using the emtrends functions, as implemented in the emmeans package (Lenth, 2023).
Finally, to test our prediction that participants would experience a reduction of in-person contact and an increase in online contact, we compared in-person and online interactions before the pandemic to measures collected in Spring 2021. Further, we ran Spearman’s correlations to determine the relationship between the change in in-person and online contact with changes to social network complexity. This was done to explore if the change in network complexity could be associated with reductions in in-person interactions, and if an increase in online interactions could have allowed certain participants to maintain or perhaps grow their network complexity. Then, following any significant correlations, to determine whether changes in that format of social interaction (in-person/online) could explain outcomes related to change in social network complexity, change in social interaction was included as a covariate in our model highlighted above looking at changes in social network complexity and changes in valence bias. Plots were generated using ggplot2 (Wickham, 2016).
Results
Changes to social networks
In Spring 2021, participants reported having a smaller social network size (M(SD)Spring 2021 = 13.9 (8.5)) than before the pandemic (M(SD)pre-pandemic = 14.5 (8.7)) t (612) = −5.11, p < .001, 95% CI = [−0.82, −0.36], d = .21; Figure 1(a)) and less network complexity (M(SD)Spring 2021 = 1.5 (1.2)) compared to pre-pandemic (M(SD)pre-pandemic = 1.6 (1.2)), t (612) = −4.88, p < .001, 95% CI = [−0.17, −0.07], d = .20; Figure 1(b)). There were no significant differences in social network diversity (M(SD)pre-pandemic = 4.8 (2.3), M(SD)Spring 2021 = 4.8 (2.3)), t (612) = −0.14, p = .89, 95% CI = [−0.05, 0.04]; Figure 1(c)). Scores of network size (a), complexity (b), and diversity (c) from the Social Network Index before the pandemic and at Spring 2021. Note. Participants reported a significant reduction in SNI network size (t (612) = −5.11, p < .001) and complexity (t (612) = −4.88, p < .001), but not network diversity (t (612) = −0.14, p = .89). Mean standard error as error bars. *** denotes p < .001.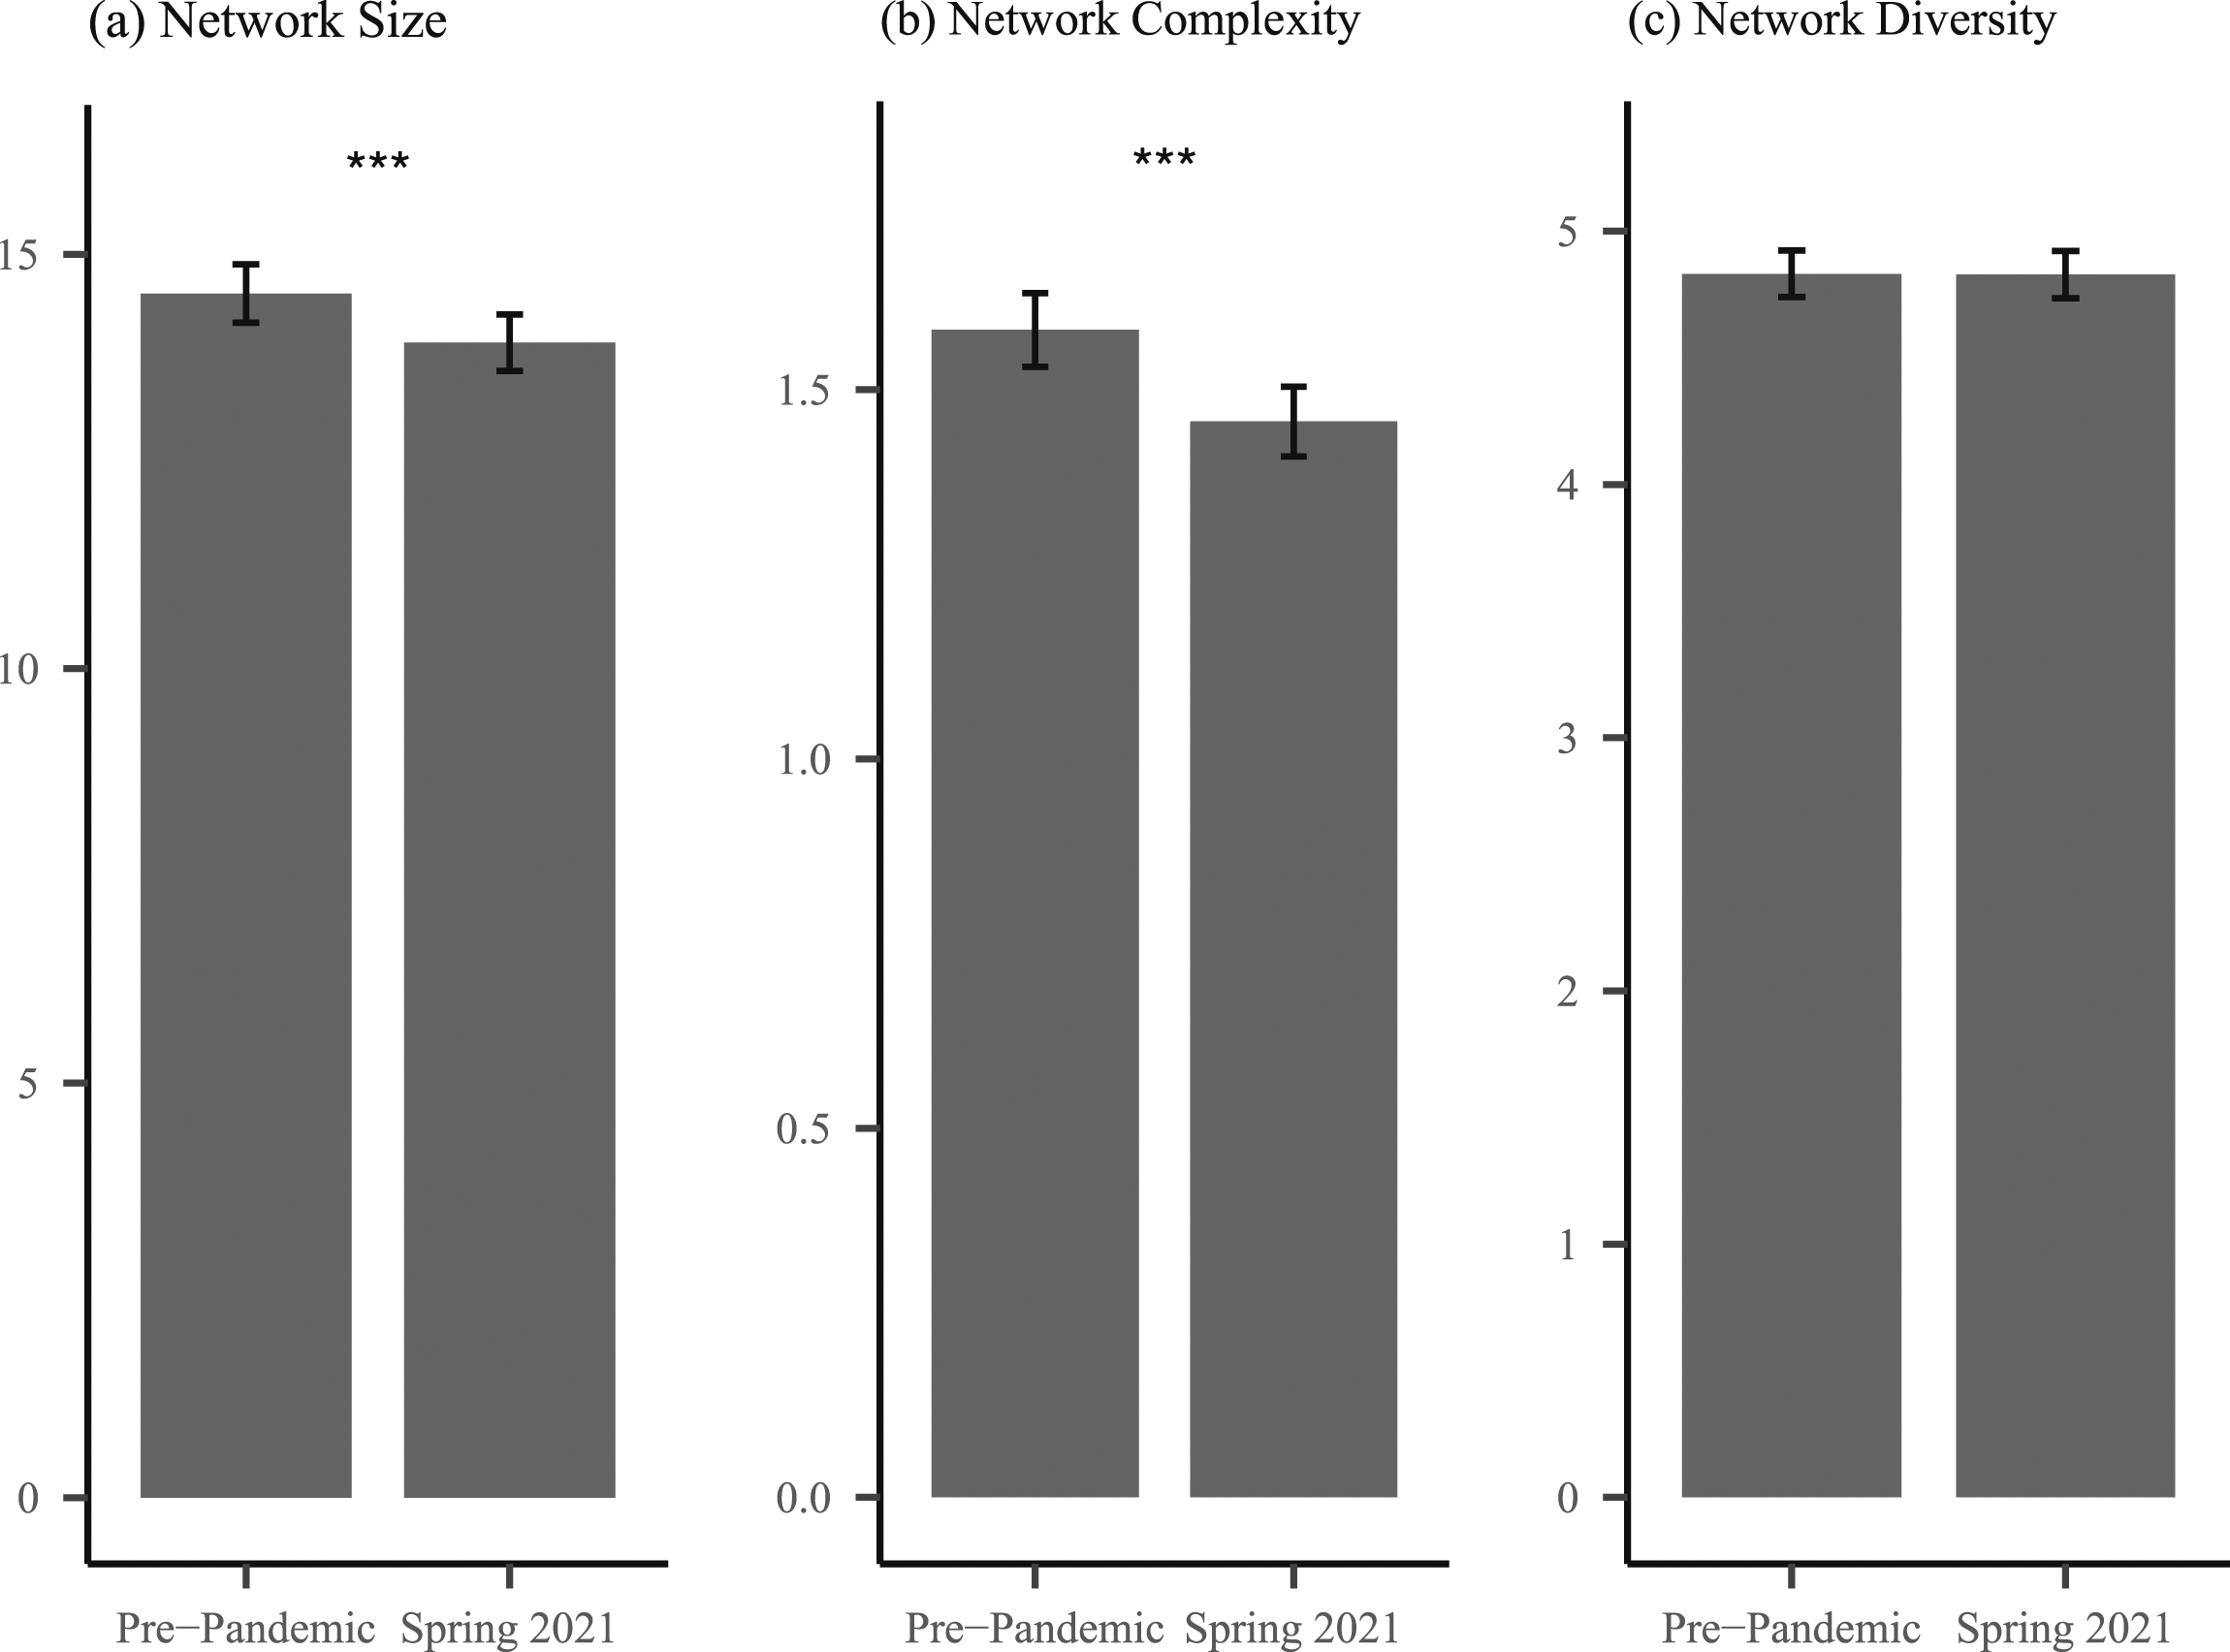
SNI dimensions and valence bias
There was a significant Valence x SNI network complexity interaction (X
2
(2) = 6.60, p = .04). The effect of network complexity was specific to categorizations of ambiguous stimuli (b = 1.50, 95% CI = [0.24, 2.75], t = 2.34, p = .02), such that participants with greater network complexity were more likely to categorize ambiguous stimuli as positive (Figure 2). There was no relationship between SNI network complexity and categorizations of the clearly positive (b = 0.09, 95% CI = [−1.16, 1.34], t = 0.14, p = .88) or negative stimuli (b = 0. 75, 95% CI = [−0.50, 2.00], t = 1.18, p = .24). There was no significant relationship between social network size and categorizations of ambiguous stimuli (b = −0.09, 95% CI = [−0.26, 0.09], t = −0.95, p = .35), or social network diversity and categorizations of ambiguous stimuli (b = 0.15, 95% CI = [-0.32, 0.62], t = 0.61, p = .54). The addition of IRQ (b = −0.01, 95% CI = [−0.05, 0.03], t = −0.58, p = .56), UCLA (b = 0.01, 95% CI = [−0.06, 0.08], t = 0.20, p = .84), and PSS (b = −0.02, 95% CI = [−0.12, 0.08], t = −0.41, p = .68) as covariates did not account for the SNI effects; network complexity remained a significant predictor of percent positive categorizations of emotionally ambiguous stimuli (b = 1.50, 95% CI = [0.24, 2.75], t = 2.35, p = .02). The calculated effect size was small (d = .15). Network complexity and valence bias. Note. Greater social network complexity (more embedded networks) is associated with a greater well-being, operationalized by more positive categorizations of ambiguity (i.e., a more positive valence bias; t = 2.34, p = .02).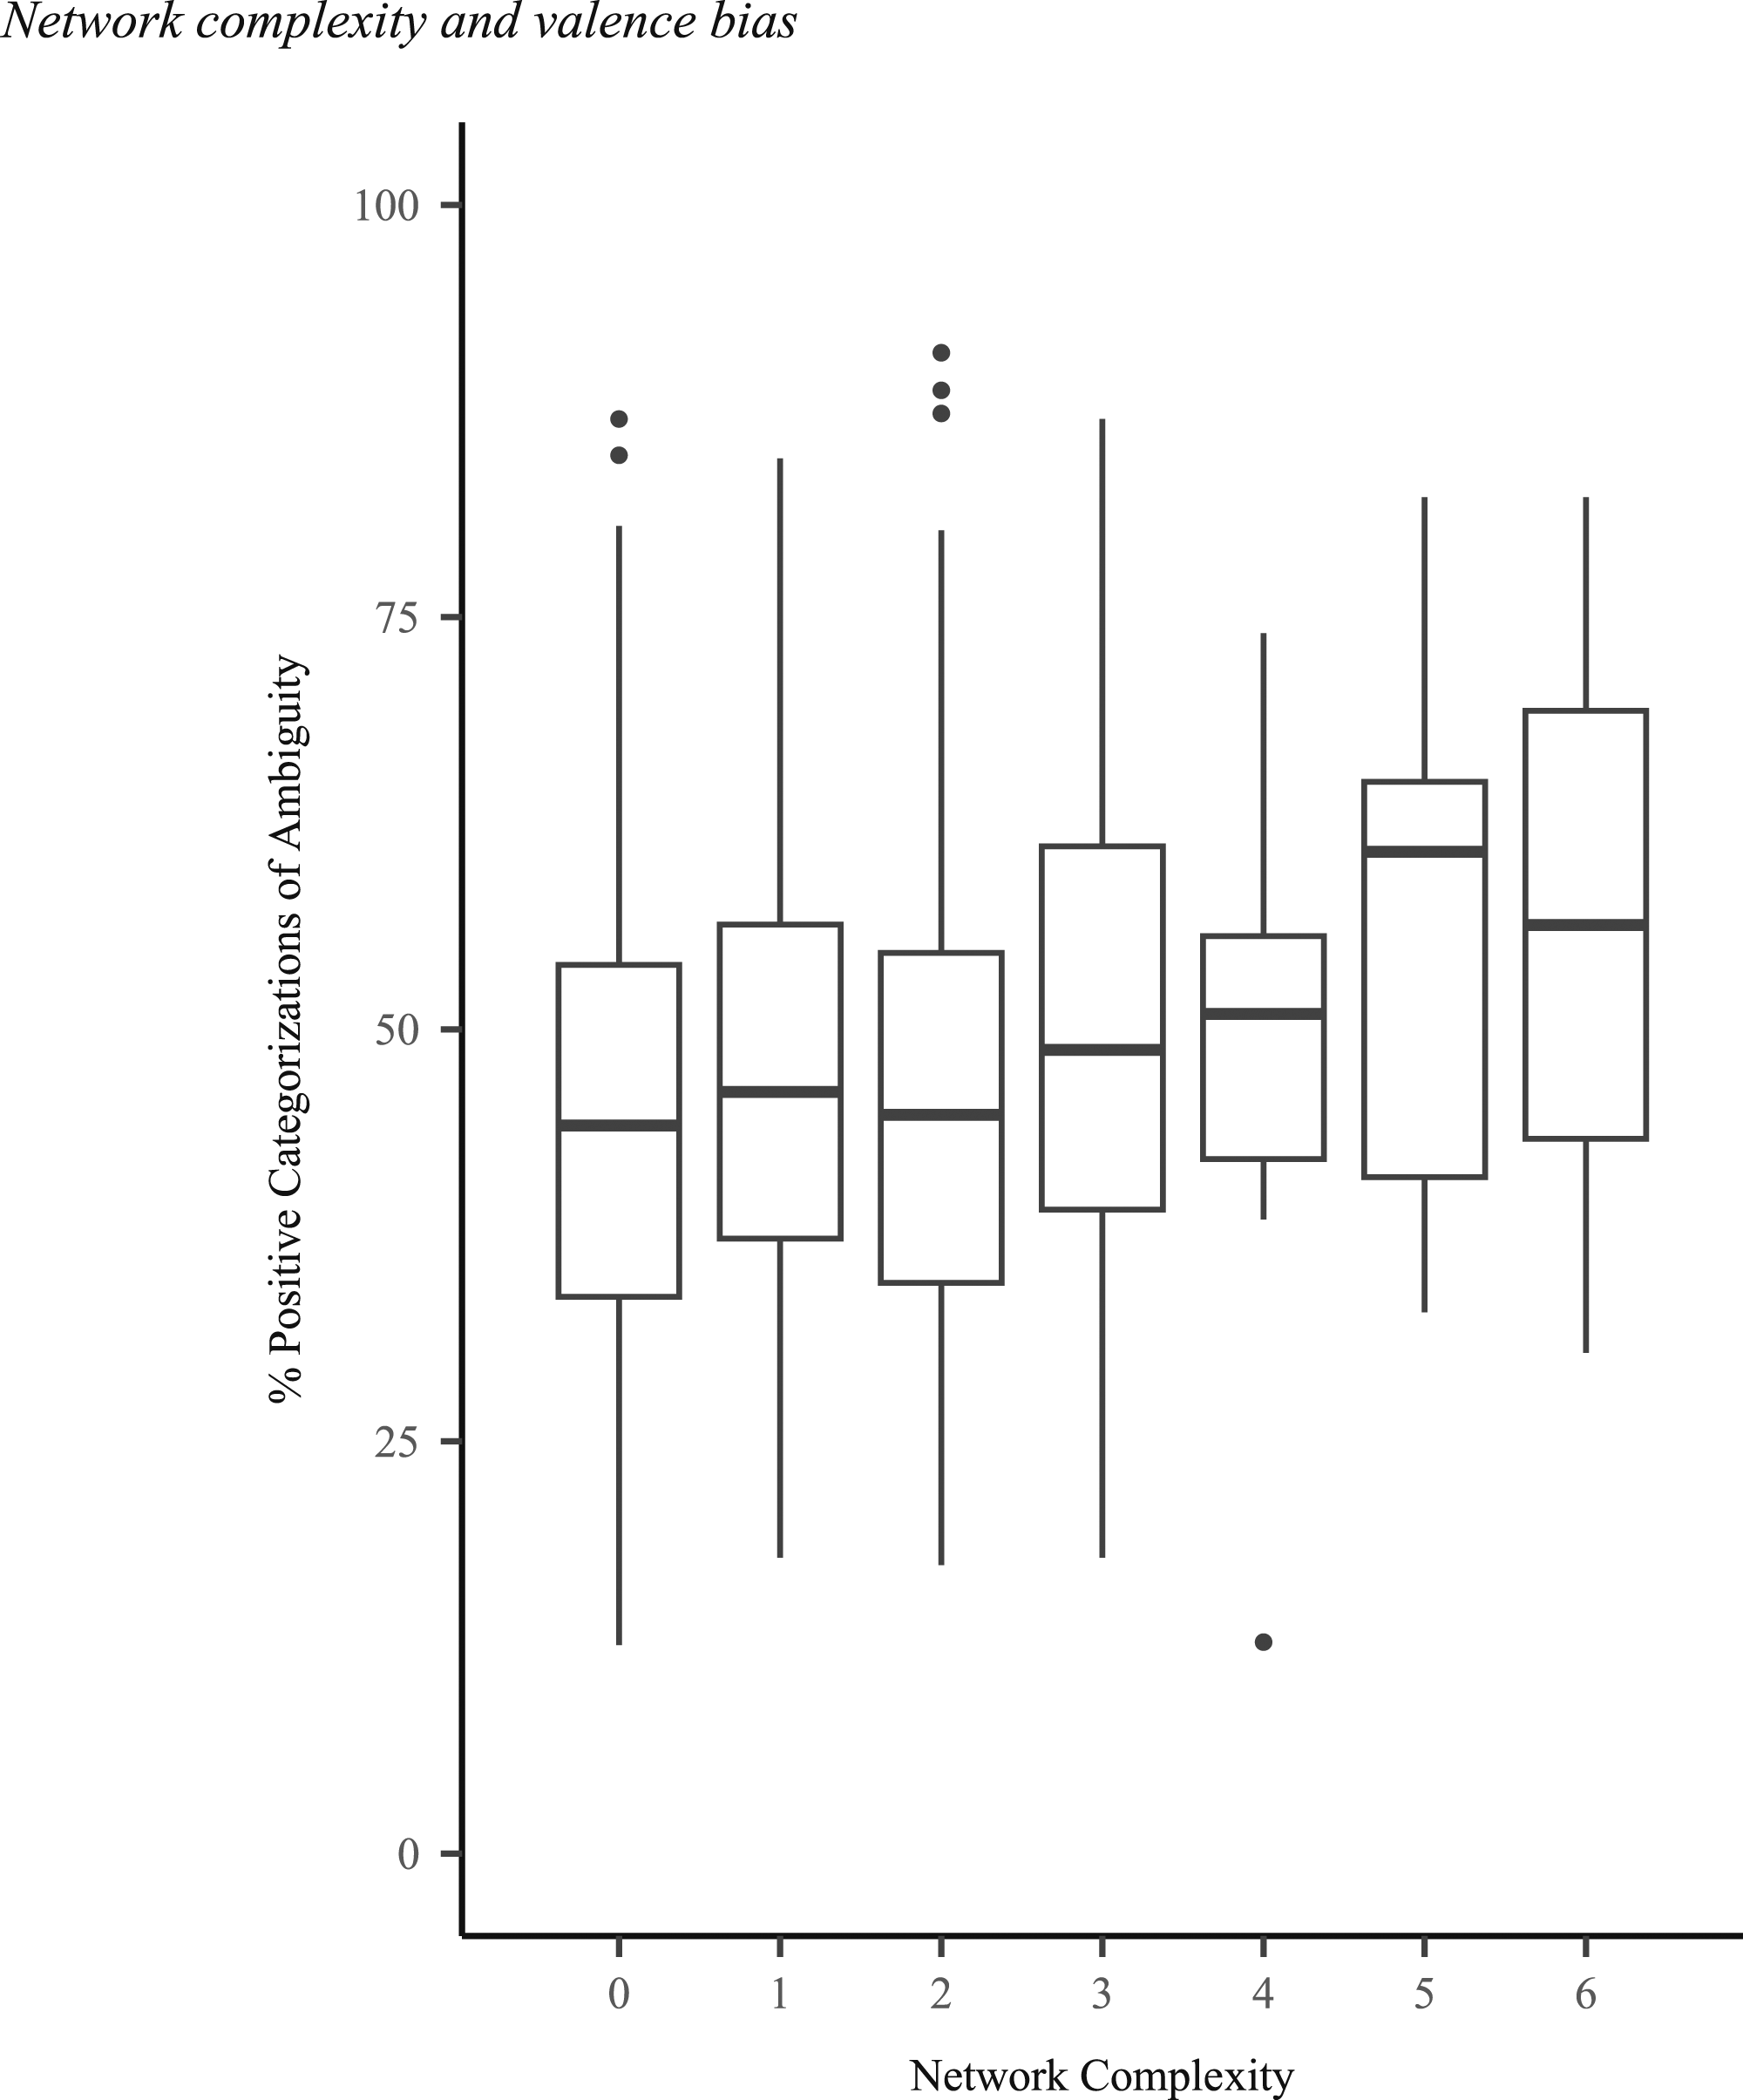
There was no significant effect of stimulus category as a factor (X 2 (2) = 1.40, p = .50). This suggests that the effect is not driven by the social nature of certain stimuli.
Change in network complexity and change in valence bias
There was a significant interaction between change in SNI network complexity and change in valence bias (X
2
(2) = 8.12, p = .02). As before, the effect of change in network complexity was specific to categorizations of ambiguous stimuli (b = 3.78, 95% CI = [1.71, 5.86] t = 3.59, p < .001); such an effect was not observed for categorizations of clearly positive (b = 1.21, 95% CI = [−1.04, 3.46], t = 1.06, p = .27) and negative stimuli (b = −0.17, 95% CI = [−2.42, 2.08], t = −0.15, p = .88). In other words, participants that experienced reductions to their network complexity were more likely to have a parallel reduction in well-being, operationalized as a decrease in positive categorizations of ambiguous stimuli. In contrast, those that did not experience network complexity losses, or reported seeming increases in network complexity, were protected from pandemic-related negativity, and even showed increases in positivity (Figure 3). The calculated effect size was small (d = .24). Changes in network complexity and valence bias. Note. Changes in network complexity (embedded networks) in the pandemic were associated with changes in valence bias, such that a reduction in network complexity was associated with a reduction in well-being, operationalized by reduced positive categorizations of ambiguity. In contrast, an increase in network complexity was associated with an increase in positive categorizations of ambiguity (t = 3.69, p < .001). To better visualize all datapoints, this figure includes jitter generated using the ggplot2 package in R (Wickham, 2016).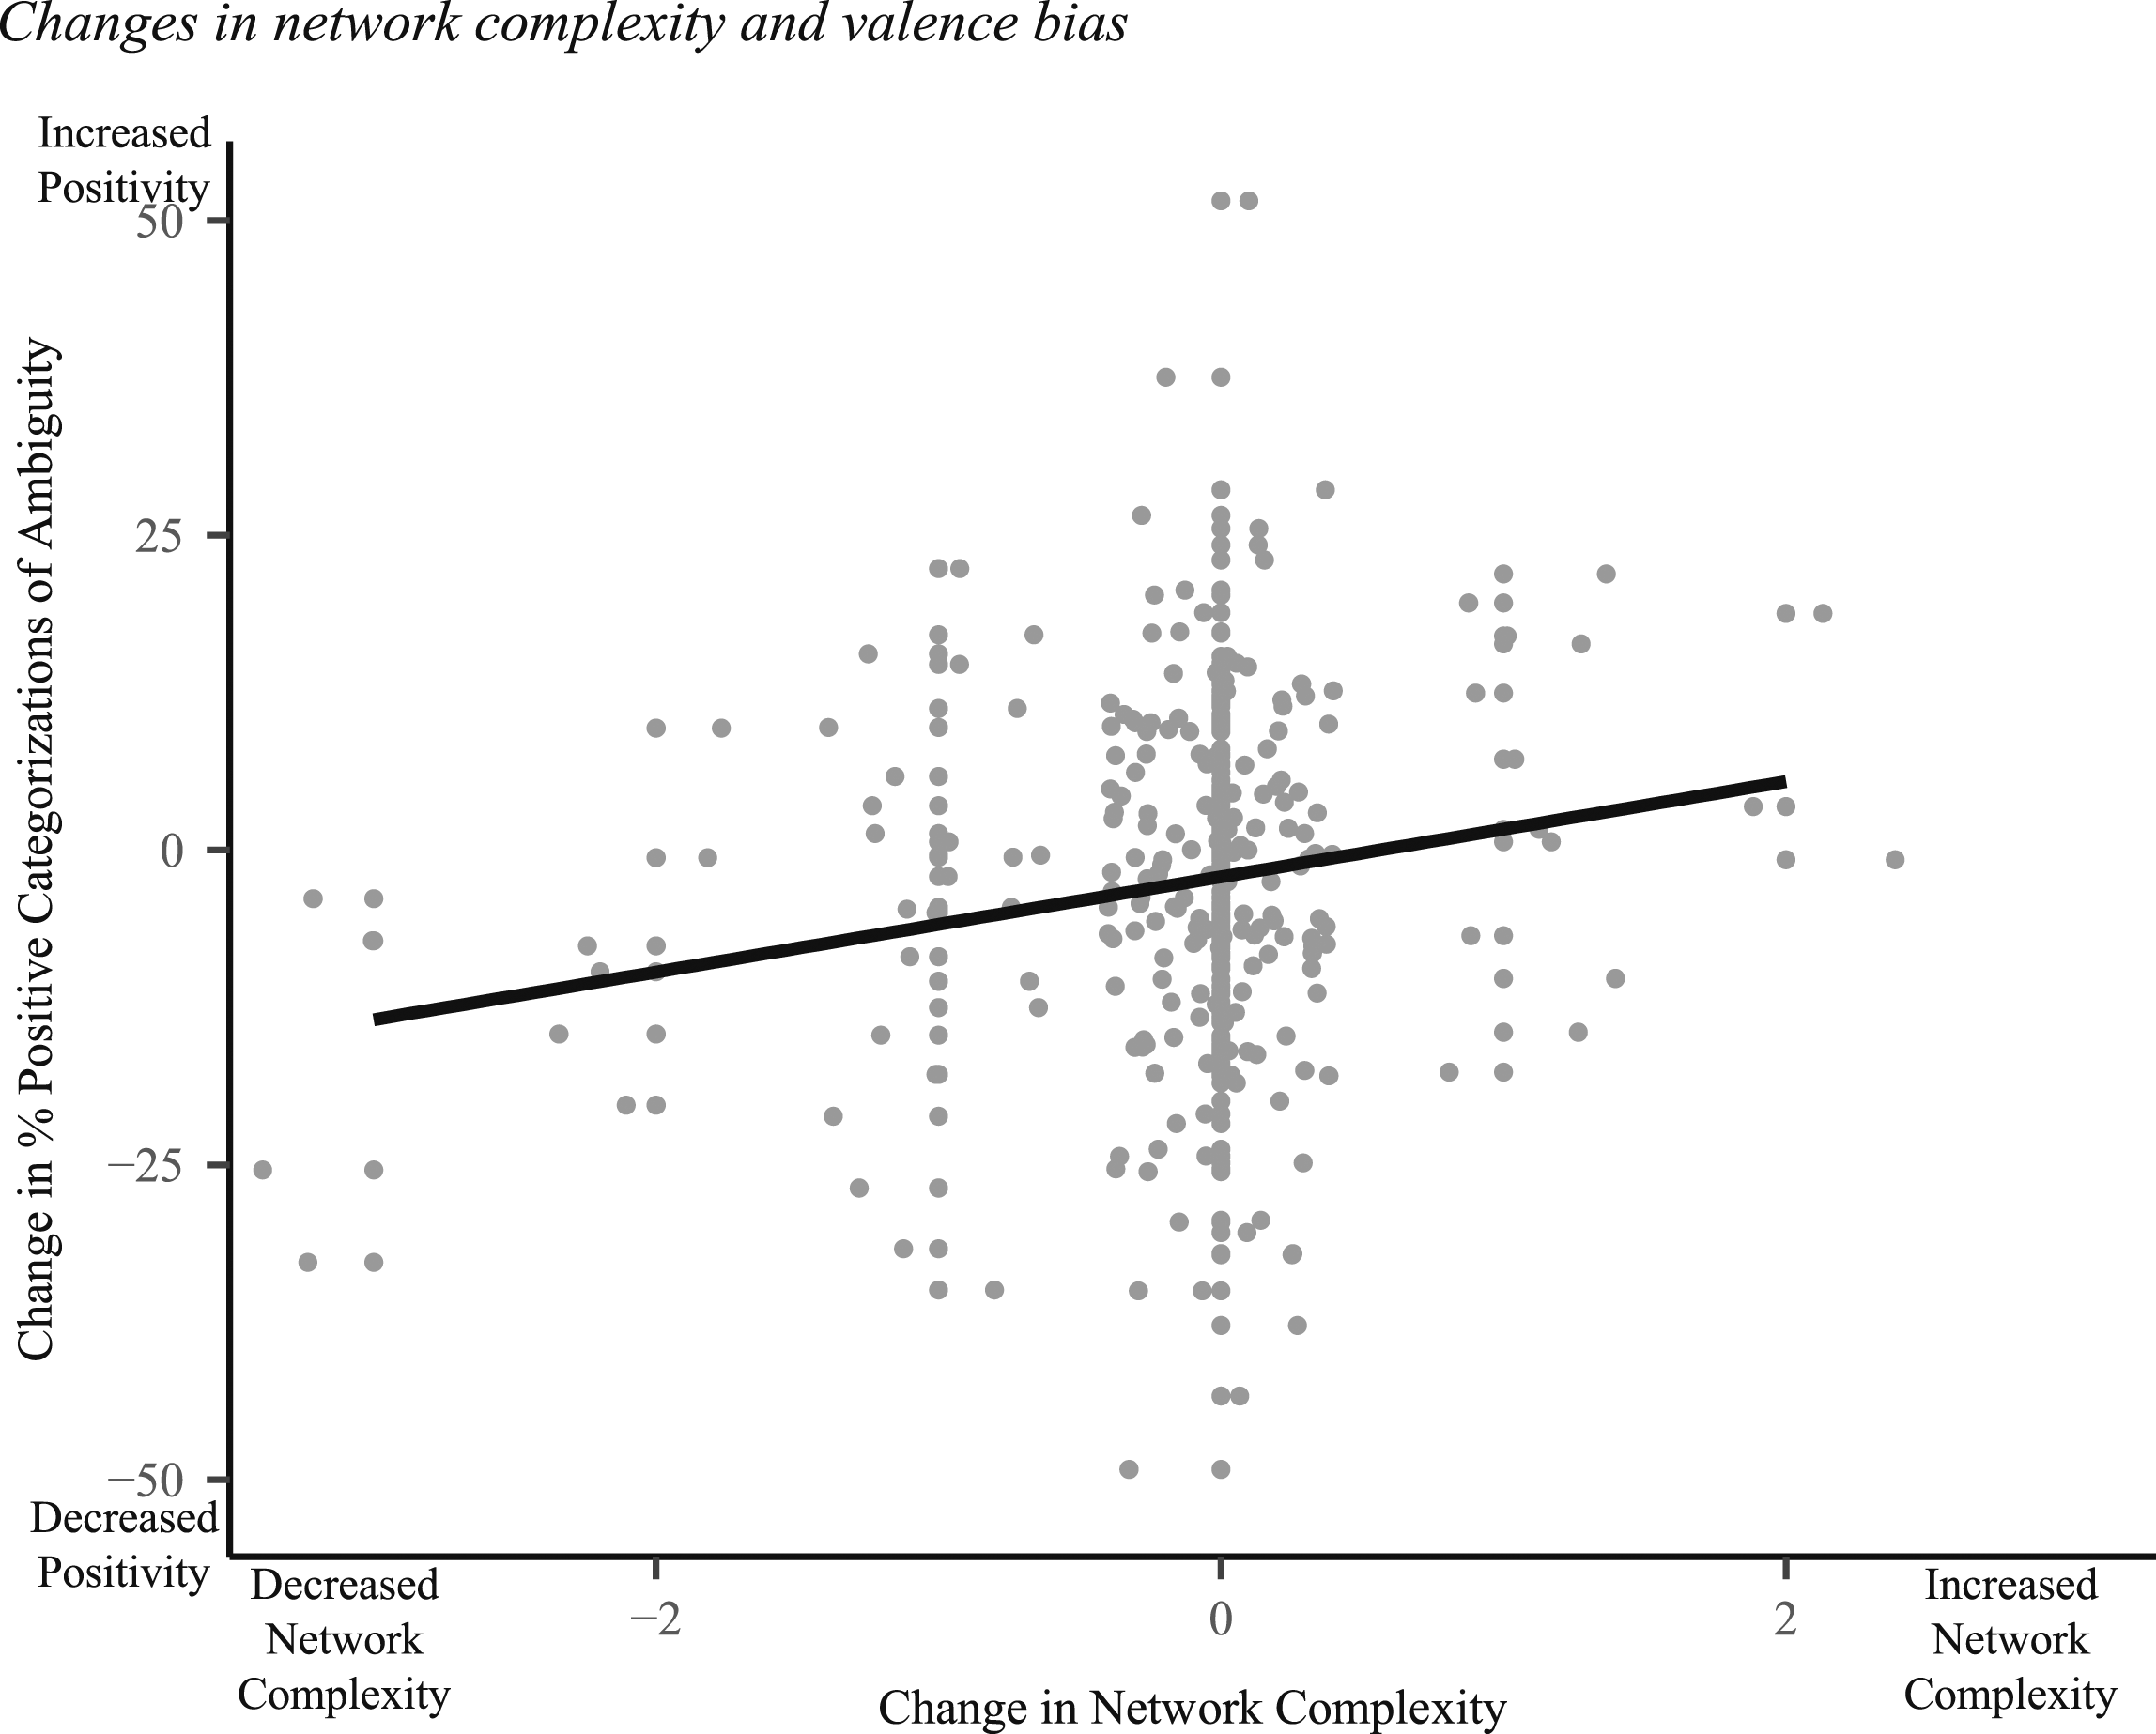
Changes to in-person and online contact
Given that some people reported pandemic-related increases in social network complexity, we explored changes to in-person and online interactions, expecting that these increases might be explained by an increase in online interactions. In the pandemic there was a shift towards online interactions (Dhakal et al., 2022; Freedman et al., 2022; Tibbetts et al., 2021), which is reflected in our results as well. A reduction in in-person social interactions during the pandemic was seemingly replaced with increased online interactions. In other words, participants reported a reduction in the frequency of in-person interactions with friends and family in Spring 2021 (M(SD)Spring 2021 = 3.6 (1.4)) compared to before the pandemic (M(SD)pre-pandemic = 4.1 (1.3)), t (612) = −11.39, p < .001, 95% CI = [−0.63, −0.45], d = .46 (Figure 4(a)), and an increase in frequency of online interactions with friends and family at Spring 2021 (M(SD)Spring 2021 = 4.1 (1.4)) compared to before the pandemic (M(SD)pre-pandemic = 3.9 (1.3)), t (612) = 5.12, p < .001, 95% CI = [0.12, 0.27], d = .21 (Figure 4(b)). Frequency of in-person interactions (a) and online interactions (b) before the pandemic and at Spring 2021. Note. Participants reported a decrease in in-person interactions (t (612) = −11.39, p < .001), and an increase in online interactions (t (612) = 5.12, p < .001), in the pandemic compared to pre-pandemic. Mean standard error as error bars. *** denotes p < .001.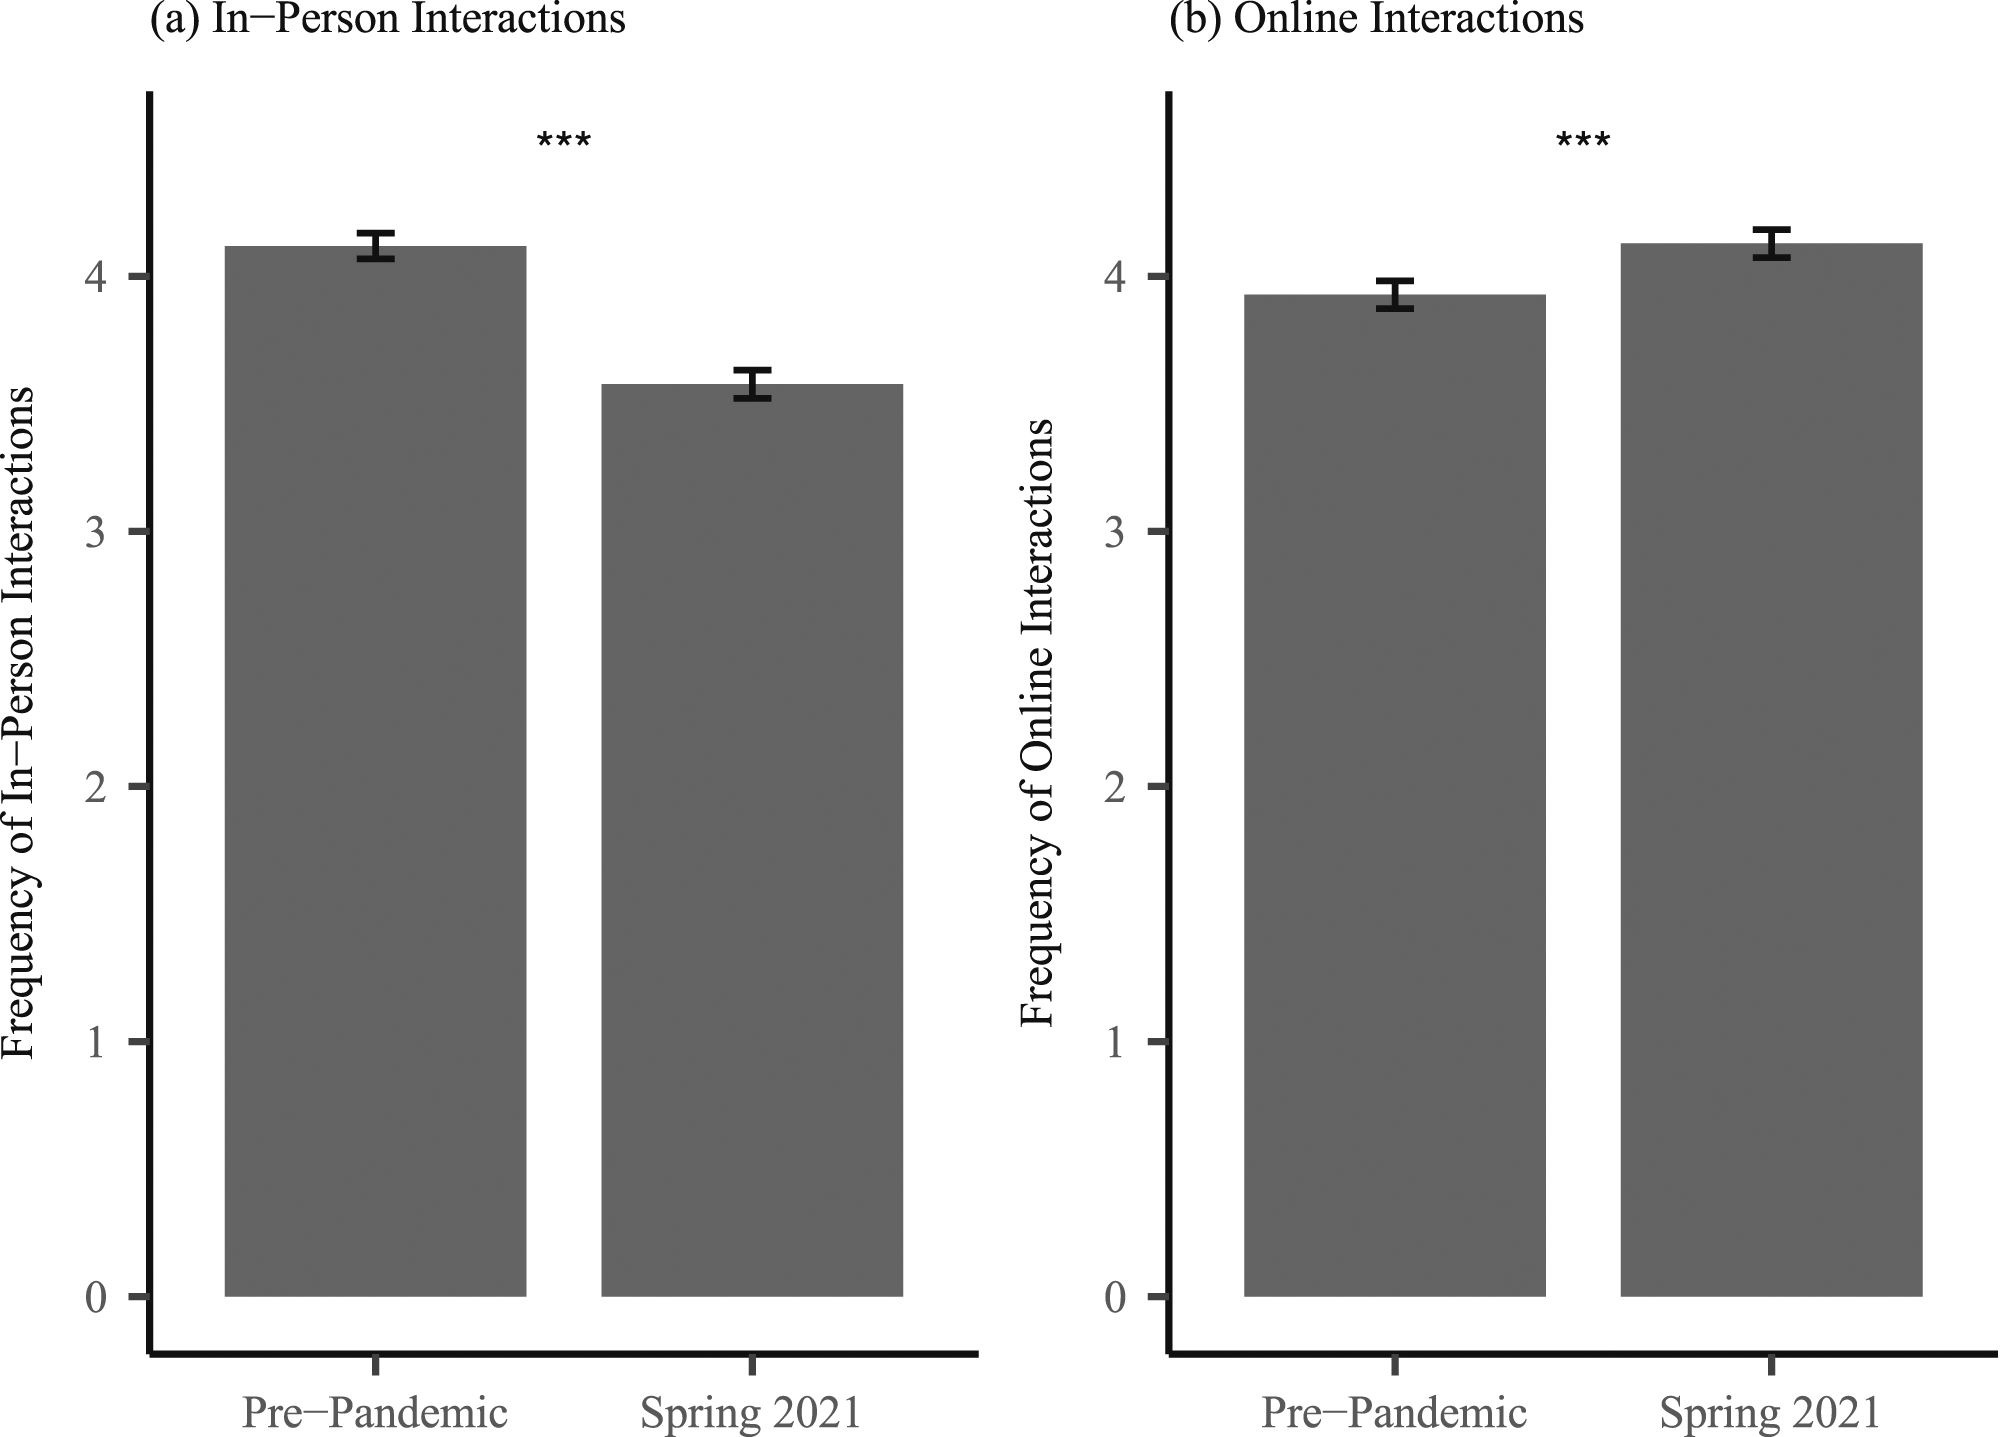
Shapiro-Wilk test showed the distribution of changes in in-person interactions (W = 0.86, p < .001) and changes in online interactions (W = 0.79, p < .001) both departed significantly from normality. Spearman’s rank correlation was used to assess the relationship between changes to in-person and online contact with changes to social network complexity; there was a positive correlation between changes in in-person contact and changes to network complexity (rs (612) = .14, p < .001), where participants that experienced reductions to network complexity also experienced reductions in in-person interactions but no such effect was evident for online interactions (rs (612) = −.01, p = .72). Then, to assess if reduced in-person contact accounted for changes to valence bias, the change score of in-person contact was included as a covariate in the mixed effect regression model examining difference scores of the three SNI dimensions and change in valence bias. The effect of in-person interactions was not significant (b = −0.10, 95% CI = [−1.07, 0.88], t = −0.20, p = .84), and the effect of network complexity remained significant (b = 3.81, 95% CI = [1.73, 5.90], t = 3.57, p < .001).
Discussion
As predicted, many people experienced small but significant changes to their social life during the pandemic, with specific losses to their network size (sum of people in their social network) and their network complexity (number of embedded networks; see also Bierman et al., 2021; Kovacs et al., 2021). Interestingly, people with more complex networks were more likely to assign positive valence to ambiguous stimuli – a measure associated with increased emotional well-being – compared to those with less complex networks in Spring 2021. The effect of network complexity remained significant after controlling for potential effects of interpersonal emotion regulation, loneliness, and perceived stress on social network losses. Further, participants that had losses to network complexity during the pandemic showed a decrease in their likelihood of assigning a positive meaning to ambiguity. This suggests that having more complex networks with various active social domains mitigates pandemic-related decrements in emotional well-being (i.e., valence bias), and is protective above and beyond the effects of limited interpersonal emotion regulation, and exacerbated loneliness and stress, that likely arise from severing social connections.
Changes in social networks explained effects on emotional well-being
Participants that did not experience reductions in their social network complexity were seemingly protected from increased negativity during the pandemic. These findings are consistent with previous work investigating social networks and psychological well-being, where having more complex social networks and higher social integration bolsters well-being (Appau et al., 2019; Seeman, 1996; Siedlecki et al., 2014). With specific relevance to valence bias, greater social network complexity could support greater feelings of social connectedness, a known predictor of a more positive valence bias (Neta & Brock, 2021).
There are several possible explanations as to why having more complex networks could protect against a pandemic-related shift towards negativity, above and beyond effects of interpersonal emotion regulation, loneliness, and stress on social network losses. First, it could be that more complex networks support feelings of social connectedness due to greater network activity (Neta & Brock, 2021; Seeman, 1996). Having more complex networks implies the potential for a more active social network, with increased contact with multiple people in a variety of social domains. Importantly, social activity and more frequent positive social interaction are strongly linked with life satisfaction (Pinquart & Sörensen, 2000) and those with higher social network activity likely have a greater opportunity to engage in positive social interactions. Thus, having access to frequent and varied (i.e., complex) social interactions, or even the potential for those interactions, could act as a protective factor for well-being. This is further supported by previous work showcasing that more frequent contact with family was associated with lower stress and symptoms of depression (Dumont & Provost, 1999; Siedlecki et al., 2014), and breast-cancer patients with larger social networks and more frequent positive social interactions had better quality of life outcomes (Kroenke et al., 2013). By having more complex social networks, and thus a more active network, there could be a greater likelihood of positive social interaction, which could help promote and/or maintain a more positive valence bias.
As mentioned above, a possible explanation for the link between greater social network complexity and better well-being could operate via access to social support (Kroenke et al., 2013; Siedlecki et al., 2014). Social support is tightly associated with improved psychological well-being and is well-documented as a protective factor against stress (Cohen & Wills, 1985). With a more complex social network (and increased opportunity for positive social interaction), there is increased access to social support, improving mental health and emotional well-being (Cohen & Wills, 1985; Kleiman & Liu, 2013; Lincoln, 2000; Siedlecki et al., 2014). People that maintained active and complex social networks in the pandemic likely had greater access to social support, which also could increase feelings of belongingness and protect against pandemic-related negativity.
Finally, social network complexity could be associated with benefits for well-being and self-esteem by increased varied group membership (Jetten et al., 2015). Self-esteem is influenced by one’s social identity. Maintaining membership to various social groups scaffolds a robust social identity, and through greater collective self-esteem, personal self-esteem is bolstered (Jetten et al., 2015). As such, both self-identity and self-esteem become more resilient through varied group membership. Previous research highlights that greater social connectedness (Pachucki et al., 2015) and multiple group membership (i.e., greater network complexity; Jetten et al., 2015) predicts better self-esteem, and having multiple identities across social contexts enriches well-being (Iyer et al., 2009; Jetten et al., 2015). Additionally, self-esteem is a predictor of affect, such that those with higher levels of self-esteem are more likely to have higher positive affect and decreased negative affect (Joshanloo, 2022). As such, though speculative, people that maintained or increased their network complexity in the pandemic could have been protected from pandemic-related negativity through an enhanced self-esteem.
Changes to method of social interactions
In-person social interactions with family and friends decreased during the pandemic but online interactions increased, consistent with prior work (Freedman et al., 2022). We examined the link between these changes in method of social interactions (in-person/online), and changes in social network complexity, and found that reductions in network complexity were associated with reductions in in-person interactions, but not with changes in online interactions. Previous research highlights that more daily in-person interactions were associated with lower feelings of loneliness and depression in the pandemic (Dhakal et al., 2022; Sommerlad et al., 2022); and digital contact, while slightly effective in protecting from loneliness and depressive symptoms (Gabbiadini et al., 2020; Hall et al., 2021), was not as effective as in-person contact (Lee et al., 2022; Sommerlad et al., 2022; Tibbetts et al., 2021). Thus, despite the difficulty of maintaining in-person social connections whilst adhering to essential public health guidelines, doing so was important for protecting against pandemic-related social disconnection. Having said that, the relationship between change in social network complexity and change in valence bias remained significant, even after accounting for changes to in-person contact. In other words, reduced social network complexity was associated with worse well-being (i.e., a less positive valence bias) above and beyond associated reductions in in-person contact.
Interestingly, by way of maintaining social connections in the pandemic, a small number of participants seemingly increased their network complexity. Our findings suggest that this increase is not a result of increased online interactions. Rather, it could be that some individuals moved in with family or others (Cook et al., 2021), consequently increasing their embedded networks by being in more frequent contact with various members of their social networks. The results of this study suggest that in times of uncertainty and adversity, maintaining social connections across various social domains is important for safeguarding one’s emotional well-being. Whilst research suggests that technology-based interactions cannot exactly replicate the social benefits of in-person interactions (Kesselring et al., 2021; Sommerlad et al., 2022), perhaps continuing social interactions online provides sufficient benefits in the absence of alternatives (Gabbiadini et al., 2020; Tibbetts et al., 2021). Of course, during the pandemic, people had to balance following government guidelines aimed at preventing the spread of COVID-19 with the need/desire for social connection (Ford, 2021). It could be that participants actively avoided in-person interactions with loved ones (e.g., immunocompromised and older adults) to protect their health (Dhakal et al., 2022). As such, the drive to adhere to guidelines conflicted with the drive to maintain in-person social connections; this conflict likely exacerbated pandemic-related loneliness and negativity.
Limitations
This study comprised exploratory analyses from a larger, pre-registered study and relied on participant self-report about social networks. The SNI measure was only collected at Wave 4a and Wave 4b (Spring 2021), thus relying on participants to accurately recall and report pre-pandemic social network characteristics from before Spring 2020. The effects in our study could be bi-directional relationships, where positive valence bias could be a protective factor that facilitated more social engagement; that is, in times of uncertainty, maintaining a positive outlook is important for maintaining social connections across various social domains. Or, it could be that social connection protected against COVID-related shift in bias (Harp & Neta, 2023). With lockdown and shelter-in-place orders being enacted suddenly, the inability to maintain social connections could have been the precedent to a reduction in positivity. Of course, given the recall-based reporting, participants may be overestimating the losses to their social networks because of increased feelings of social disconnection and isolation due to social distancing measures, biasing perceptions of loss. Participants that showed a greater shift towards negativity may overestimate social network losses, thus creating this inverse relationship between network complexity and a negative valence bias. Having said that, even if the effect is driven by the perception of loss and increased negativity rather than an actual experienced loss, the relationship may still be of interest. And future research may attempt to disentangle the effects of perceived versus actual losses.
The SNI quantifies the number and variety of social relationships a respondent has, but not the quality of the social tie. That is, with the SNI, someone you talk to once a week about technical items, like a coworker, is given the same weight as someone you speak to everyday with more conversational depth, or someone you rely on for more emotional support. As such, we do not know the degree of closeness of the social relationships, or how the relationship is used in the context of social support or companionship. Future research could include measures of social support, or focus on how varying degrees of closeness in a relationship could influence whether the relationship has a protective effect. Further, future research investigating social networks should include a measure of self-esteem given the relationship between well-being, self-esteem and group membership discussed above (see also Jetten et al., 2015).
In addition, there is no information regarding the type of contact (e.g., video calls, phone calls, emails, online messaging) each respondent reports beyond how frequently they engaged in in-person and online contact before and during the pandemic. For instance, in-person interaction could – and likely does – differ from video-calls in terms of social and affective benefits (Dhakal et al., 2022; Tibbetts et al., 2021). Previous research has highlighted that in-person interactions with friends are associated with more positive affect, and the effect did not extend to zoom interactions (Dhakal et al., 2022; Kesselring et al., 2021). It could be that online interactions had to be in tandem with in-person interactions to have protective effects (Sommerlad et al., 2022; Tibbetts et al., 2021). Future research could investigate the different types of in-person and online interactions individuals engage in, and the features of in-person interactions that seem to be particularly beneficial to well-being. Finally, participation in this study required access to a computer, which could have reduced the socioeconomic diversity in our sample, potentially limiting somewhat the generalizability of these results.
Conclusion
Our research highlights the importance of having multiple, varied social relationships in an active, complex social network (i.e., more embedded networks). Having greater network complexity may mitigate adverse outcomes for well-being (a less positive/more negative valence bias), and we speculate that this might unfold through a mechanism of increased social support and/or self-esteem. Maintaining one’s social network complexity, particularly in times of stress and uncertainty, is instrumental in protecting against increases in negative affect, and threats to our emotional well-being, more generally.
Supplemental Material
Supplemental Material - Greater social network complexity mitigates pandemic-related negativity
Supplemental Material for Greater social network complexity mitigates pandemic-related negativity by Eisha Haque, Nicholas R. Harp, and Maital Neta in Journal of Social and Personal Relationships.
Footnotes
Declaration of conflicting interests
The author(s) declared no potential conflicts of interest with respect to the research, authorship, and/or publication of this article.
Funding
The author(s) disclosed receipt of the following financial support for the research, authorship, and/or publication of this article: This work was supported by the National Institutes of Health (NIMH111640; PI: Neta; NIDA T32 DA022975; Trainee: NRH), NSF (CAREER Award, # 1752848; PI: Neta; RAPID Award, #2031101; PI: Neta).
Open research statement
As part of IARR’s encouragement of open research practices, the authors have provided the following information: This exploratory research stemmed from a larger study that was pre-registered. The aspects of the research that were pre-registered were the hypotheses, the study design, and the data analysis plan. The registration was submitted to: ![]() and can be found here osf.io/t7sr6. The data used in the research cannot be publicly shared but are available upon request. The data can be obtained by emailing:
and can be found here osf.io/t7sr6. The data used in the research cannot be publicly shared but are available upon request. The data can be obtained by emailing:
Supplemental Material
Supplemental material for this article is available online.
Appendix
* indicates a question not from the original measure and added for this study. Unless otherwise specified, all questions were answered on a slider from 0 to 7 or more.
This questionnaire is concerned with how many people you see or talk to on a regular basis both now and prior to the pandemic, including family, friends, workmates, neighbors, etc. Please respond and answer each question carefully. Answer the follow-up questions where appropriate. 1. Which of the following best describes your marital status? a. Currently married & living together or living with someone in marital-like relationship b. Never married and never lived with someone in a marital-like relationship c. Separated d. Divorced or formerly lived with someone in a marital-like relationship e. Widowed 2. How many children do you have? 3. How many of your children do you see or talk to on the phone at least once during an average two-week period? 4. *Prior to the pandemic, how many of your children did you see or talk to on the phone at least once during an average two-week period? 5. Are either of your parents living? a. Neither b. Mother only c. Father only d. Both Mother and Father 6. Do you see or talk on the phone to either of your parents at least once during an average two-week period? 7. *Prior to the pandemic, did you see or talk on the phone to either of your parents at least once during an average two-week period? 8. Are either of your in-laws (or partner’s parents) living? a. Neither/Not applicable b. Mother only c. Father only d. Both Mother and Father 9. Do you see or talk on the phone to either of your partner’s parents at least once during an average two-week period? a. Neither/Not applicable b. Mother only c. Father only d. Both Mother and Father 10. *Prior to the pandemic, did you see or talk on the phone to either of your partner’s parents at least once during an average two-week period? a. Neither/Not applicable b. Mother only c. Father only d. Both Mother and Father 11. How many other relatives (other than your spouse, parents, & children) do you feel close to? 12. How many of these relatives do you see or talk to on the phone at least once during an average two-week period? 13. *Prior to the pandemic, how many of these relatives did you see or talk to on the phone at least once during an average two-week period? 14. How many close friends do you have? (Meaning people that you feel at ease with, can talk to about private matters, and can call on for help) 15. How many of these friends do you see or talk to at least once during an average two-week period? 16. *Prior to the pandemic, how many of these friends did you see or talk to at least once during an average two-week period? 17. Do you belong to a church, temple, or other religious group? (If not, check ‘no’ and skip to the next question). a. Yes b. No 18. How many members of your church or religious group do you talk to at least once during an average two-week period? (This includes at group meetings and services). 19. *Prior to the pandemic, how many members of your church or religious group did you talk to at least once during an average two-week period? 20. Did you attend any classes (School, university, technical training, or adult education) on a regular basis? (If not, check ‘no’ and skip to the next question). a. Yes b. No 21. How many fellow students or teachers do you talk to at least once during an average two-week period? (This includes at class meetings). 22. * Prior to the pandemic, how many fellow students or teachers did you talk to at least once during an average two-week period? 23. Are you currently employed either full or part-time? (If not, check ‘no’ and skip to the next question). a. Yes b. No 24. How many people do you supervise? 25. How many people at work (other than those you supervise) do you talk to at least once during an average two-week period? 26. * Prior to the pandemic, how many people at work (other than those you supervise) did you talk to at least once during an average two-week period? 27. How many of your neighbors do you visit or talk to at least once during an average two-week period? 28. *Prior to the pandemic, how many of your neighbors did you visit or talk to at least once during an average two-week period? 29. Are you currently involved in regular volunteer work? (If not, check ‘no’ and skip to the next question). a. Yes b. No 30. How many people involved in this volunteer work do you talk to about volunteering-related issues during an average two-week period? 31. *Prior to the pandemic, how many people involved in this volunteer work did you talk to about volunteering-related issues during an average two-week period? 32. Do you belong to any groups such as social clubs, recreational groups, trade unions, commercial groups, professional organizations, groups concerned with children like the PTA or Boy Scouts, groups concerned with community service, etc. (If you don’t belong to any such groups, check ‘no’ and skip to the next question) a. Yes b. No 33. How many members of these group(s) do you talk to about group-related issues during an average two-week period? 34. * Prior to the pandemic, how many members of these group(s) did you talk to about group-related issues during an average two-week period?
References
Supplementary Material
Please find the following supplemental material available below.
For Open Access articles published under a Creative Commons License, all supplemental material carries the same license as the article it is associated with.
For non-Open Access articles published, all supplemental material carries a non-exclusive license, and permission requests for re-use of supplemental material or any part of supplemental material shall be sent directly to the copyright owner as specified in the copyright notice associated with the article.