
Abstract
Pseudowords, or non-real words, were introduced to the Yes/No (YN) vocabulary test format to provide a means of checking for overestimation of word knowledge by test takers. The purpose of this study is to assess the assumption that more pseudoword checks (false alarms) indicate more instances of overestimation of word knowledge in YN tests. Thirty English classes in five different Japanese universities with TOEIC® scores ranging from 230 to 730 participated (n = 490). YN test results were compared with a multiple-choice test of the same 96 real words to provide a way to check directly for instances of underestimation and overestimation of word knowledge on the YN tests. Results showed that students from the higher proficiency universities had a slightly higher pseudoword false alarm rate than students from the lower ability universities (4.28% and 3.96%, respectively). However, overestimation rates were considerably lower for these same students from the higher proficiency universities (3.24% and 5.67%, respectively). This discrepancy between false alarm rates and overestimation rates questions the value of pseudowords for measuring overestimation in YN vocabulary tests when student ability levels differ significantly.
Keywords
Yes/No vocabulary tests (also known as checklist tests) remain a popular format for measuring students’ receptive vocabulary knowledge partially because of their ease of use. In these tests learners are presented with a list of words, usually selected from word frequency lists, and asked to signify their knowledge of each item by either checking that word, or by selecting either ‘yes’ or ‘no’. These tests can be used to measure students’ overall vocabulary size where a large sampling of words is necessary, or for determining specific vocabulary knowledge in preparation for upcoming language activities. Read (2007, pp. 112–113) notes that ‘Despite its simplicity, the Yes/No format has proved to be an informative and cost-effective means of assessing the state of learners’ vocabulary knowledge, particularly for placement and diagnostic purposes.’ Although these tests may be useful for determining a person’s breadth of vocabulary knowledge, there is a consensus of opinion criticizing their inability to measure the depth of lexical knowledge (Chapelle, 1998; Ishii & Schmitt, 2009; Laufer & Goldstein, 2004; Read, 2000, among others).
As Yes/No (YN) tests rely solely on ‘self reporting’, the actual knowledge of the students can not be verified. One concern with the YN format is whether test results accurately reflect the test takers’ knowledge of the selected items, or if the results overestimate the number of words actually known (Read, 1993, 2000). To compensate for the potential of students claiming knowledge of words they actually do not know the meaning of (overestimation), pseudowords were introduced to the vocabulary checklist test by Anderson and Freebody (1983). Pseudowords were introduced to the field of second language acquisition by Meara and Buxton (1987). This use of pseudowords in YN tests has remained widespread through present-day versions. In these tests, knowledge of a real word is known as a hit, while claiming knowledge of a pseudoword is a false alarm (FA). Not claiming knowledge of a real word is labeled a miss and not claiming knowledge of a pseudoword is a correct rejection. Claiming knowledge of words that do not exist is seen as an indication of falsely claiming knowledge of real words (overestimation). The test results from learners who claim knowledge of pseudowords are adjusted downwards using a variety of formulae, to better reflect the actual vocabulary size (Beeckmans, Eyckmans, Janssens, Dufranne, & Van de Velde, 2001). Presently, four adjusting formulae predominate in the literature (Huibregtse, Admiraal, & Meara, 2002). Selecting which correction formula best adjusts for the number of FAs in relation to the number of hits remains unresolved within the field.
Although pseudowords may counteract the problem of overestimation, their use in YN tests is not without its own difficulties. Creating adequate pseudowords is a challenge in itself as they ‘should respect the phonotactic and morphological rules of the target language’ (Eyckmans, 2004, p. 27), but ‘not bear meaning’ (Huibregtse et al., p. 227). Anderson and Freebody (1983) discuss two methods of creating pseudowords. One method, pseudo-derivatives, entails adding a prefix or suffix to a real word, so ‘loyal’ becomes ‘loyalment’. In the second method, one or two vowels and/or consonants are substituted in a real word, so ‘boy’ becomes ‘poy’.
Another weakness that has been found with the YN test is that it ‘does not perform well with low level learners, who respond unpredictably to the pseudowords’ (Beeckmans et al., 2001, p. 240). Apparently, low level students ‘often misread items in the test in unpredictable ways’ (Meara, 1996, p. 42), with cognates being especially problematic. Cameron similarly found that pseudowords created problems for her weaker (English as an Additional Language) students, ‘many of whom had scores heavily reduced by the number of non-words they checked as ‘known’’ (Cameron, 2002, p. 159). Cameron reported FA rates of 25%. Barrow, Nakanishi and Ishino (1999), testing Japanese university students reported a FA rate of 8.4%. Eyckmans (2004) tested French students studying Dutch and discussed a series of YN test experiments, reporting FA rates of 13.5% and 24.8%. In one of her experiments, a FA rate of 8.7% was achieved, likely because the test instructions included a warning that some of the words would be tested in a subsequent translation test. Using a similar warning of subsequent re-testing, Mochida and Harrington (2006) reported a FA rate of 4.4%. In a more recent paper, Harrington and Carey (2009), without providing any warning of possible re-testing, reported FA rates averaging 17%. One further problem with pseudowords is that they may influence some students to become too conservative with their vocabulary knowledge by not checking words that they actually know (underestimation) (Beeckmans et al., 2001; Eyckmans, 2004; Mochida & Harrington, 2006).
A number of researchers have suggested that pseudowords are unnecessary, as they do not contribute to the reliability of the YN test results. Mochida and Harrington (2006) assessed YN test performance as a predictor of subsequent performance on a multiple-choice (MC) test – the Vocabulary Levels Test (VLT) (Nation, 1990, versions 1 and 2, designed by Schmitt, Schmitt, & Clapham, 2001). They found raw ‘hits’ to be the best indicator of VLT scores; whereas the application of any of the four correction formulae ‘was as likely to increase the difference between the scores on the YN test and the VLT’ (Mochida & Harrington, 2006, p. 91). By including the same VLT test items in the YN tests, these researchers were able to check directly for instances of overestimations and underestimations of word knowledge in the YN tests. By comparing rates of underestimation and overestimation across the word frequency levels focused on in their study (2K, 3K, 5K, 10K, as well as the Academic Word List (AWL), Coxhead, 2000), these authors also found that both underestimation and overestimation means along their standard deviations (SD) increased with word (item) difficulty level. Mochida and Harrington further determined that the correlation between FAs and overestimations (which was expected to be strong as overestimation was the impetus for the original inclusion of pseudowords in YN tests; Anderson & Freebody, 1983), was relatively low (r = .37). Based on these findings, Mochida and Harrington (2006, p. 92) concluded that ‘it may be possible to dispense with pseudowords altogether and still obtain an accurate measure of the individual’s actual vocabulary knowledge.’ Shillaw (1996), studying Japanese learners, similarly found little difference between YN test results without pseudowords and test results containing pseudowords. He also proposed that YN tests containing only real words may be able to replace the present pseudoword versions (Shillaw, 1996). Harrington and Carey (2009) additionally suggested that: ‘It is possible that pseudowords are not necessary at all and that the appropriate instruction set will prove adequate to minimize guessing, especially for particular learner backgrounds’ (Harrington & Carey, 2009, p. 624).
Aims
The general purpose of this research is to answer Mochida and Harrington’s call for further research concerning the effects of pseudowords on ‘learners at lower levels of proficiency’ (Mochida & Harrington, 2006, p. 91). The specific aim is to examine the relationship between FAs and overestimation in YN vocabulary tests with Japanese university students of varying levels of English proficiency. Two types of YN tests were used: one containing real words only and a second containing the same real words plus pseudowords. A third conventional VLT style MC vocabulary test, which utilized L1 definitions of the same real words found in the YN tests, was also used to allow for analysis of overestimation versus underestimation of word knowledge in the YN tests. All tests were designed to measure the construct receptive vocabulary knowledge. Results of these tests will be used to answer the following questions:
Do FA rates increase as university English ability levels decrease?
Do overestimation rates also increase as university English ability levels decrease?
How well do FAs represent overestimation of vocabulary knowledge in the YN tests when English proficiency levels vary?
Sample
Originally 34 English classes in six different Japanese universities participated in this study. English ability measures ranged from below 90 on the TOEIC® Bridge (230 on the TOEIC®, Educational Testing Service, n.d.) at the lowest level university through 800 on the TOEIC® at the highest level university. Two groups were created in each university, one for each of the two YN test sets – 48A + 80B or 48B + 80A. In total 598 students completed all three tests: either one of the two YN test sets plus the subsequent MC test. However, the MC test proved too easy for the highest level university. With 20% of those students scoring 96 of 96, the lowest scoring 90, and a mean of over 93.84 words, a ceiling effect had occurred. As this rendered all MC test comparisons with the YN test basically meaningless, this university’s results have been removed from this study (n = 55). A further 53 students’ results were also deleted for reasons discussed below, leaving a sample size of 490. Prior to testing, the relative English proficiency level of each university was determined in consultation with the other participating teachers. Regrettably TOEIC® or other similar measures were not available for all five institutions; however the determined ranking was confirmed by both the YN and MC test results. Universities will be presented in ranked order from one to five, highest to lowest.
Method
This study is similar to Mochida and Harrington (2006), with a few important distinctions. Whereas Mochida and Harrington (2006) focused on a small number of advanced English learners (n = 36), this study focused on a large number of students from five Japanese universities with varying levels of English proficiency (n = 490). Also, whereas Mochida and Harrington (2006) focused their analysis on differences between the frequency level of the items (2K, 3K, 5K, 10K, or AWL), this study’s analysis focused on differences between the proficiency levels of the universities. Another difference is that where Mochida and Harrington’s YN tests were computerized; this study’s YN tests were paper versions. The test instructions for the pseudoword tests also differed. In this study students were not advised that they may be tested on some of the real words in the future as was done in Mochida and Harrington (2006). It was felt that such a warning might cause the students to become too conservative and lead them to underestimate their word knowledge. The test instructions for both pseudoword test versions 80A and 80B were as follows:
Instructions: Use a pencil. For the words you know the meaning of, fill in the circle to the right. 鉛筆またはシャープペンシルを使用しなさい。 あなたが意味を知っている単語について、右側のマークを塗りつぶしなさい。
It should be noted that many researchers do not consider it good practice to provide a warning that some of the words do not exist in English. However, at the time of writing the test instructions it was felt that such a warning would be more transparent and thus fairer to the test takers.
Filling in a circle on a YN test form was interpreted as a ‘Yes’ for that word, and not filling in a circle was treated as a ‘No’, with no distinction available between ‘no-responses’ and ‘non-responses’. In Mochida and Harrington’s (2006) computerized YN test, students chose either ‘Yes’ or ‘No’. ‘Non-responses’ in that study were rare (.05%), and they were also treated as ‘no-responses’ for the purposes of analysis. Finally, where Mochida and Harrington (2006) utilized an English only MC test (Schmitt et al., 2001), this study used L1 translations in the questions of the VLT style MC test (three L1 questions blocked with six English distractors).
An initial word list was created for the pilot study for this project, completed in 2009, by randomly selecting 96 words from an item bank composed of words from a variety of sources including: the VLT (Nation, 1990); the Vocabulary Size Test (Nation & Beglar, 2007); Webb’s translation test (Webb, 2008); in the following word frequency ranges: 0–1000, 1001–2000, 2001–3000 (50%, 33.33%, 16.67%, respectively). Word frequencies were based on the General Service List (GSL) (West, 1953, as adapted by Bauman & Culligan, 1995). These sources were chosen to allow for the possibility of comparing results with a variety of other studies. Care was taken to avoid any English words which had been adopted by the Japanese language (English loan words, or gairaigo – 外来語), whose primary translation into L1 is katakana (ナイス (naisu/nice), for example).
Using the Rasch item measures obtained in the pilot study, the 96 words were sorted into two lists of roughly equal difficulty to create YN tests 48A and 48B. Six of the words from the pilot study were too difficult for the 82 test takers, receiving no hits; and six words were too easy, receiving the maximum 82 hits each. These easy items were replaced by six words of lower frequency. The six new words changed the GSL frequency percentages to: 1K – 44.8%; 2K – 38.5%; and 3K – 16.7%. The six new words were sorted into either test (48A or 48B) based on their BNC-20 frequency level (Nation & Cobb, n.d.). The final 96 items, including the six new words, were subsequently found to be in the following BNC-20 frequency levels: 1K = 48 words; 2K = 27 words; 3K = 10 words; 4K = two words; 5K = four words; 6K = three words; 7K = one word; 10K = one word. A second series of YN tests was created by adding 32 pseudowords (discussed below) to each of the 48 item tests to create tests 80A and 80B.
In each university, two groups of comparable English ability were created by the participating teacher. The first group received the 48A then the 80B YN tests, with the other group receiving the 48B then the 80A tests. Any students or classes writing the same form, either 48A and 80A, or 48B and 80B, were disqualified from participating in the study, as encountering the same 48 words a second time might make pseudoword recognition easier, thereby skewing the FA results. Regrettably one class of 42 students in the lowest university wrote 48A and 80A, so all their results were deleted. This did leave the two groups unbalanced, with the 48A–80B group having fewer students from the lowest university than the 48B–80A group, which did affect YN scores (Table 1). Further, 11 students at another university did not adequately understand the test instructions for pseudoword tests (80A and 80B, discussed below) and post-test interviews revealed that they intentionally checked the pseudowords. These results have also been deleted leaving 490 participants.
YN test results (k = 48)
Cronbach’s alpha
Following the procedure outlined in Mochida and Harrington (2006), a pseudoword list was prepared for the pilot study using Anderson and Freebody’s (1983) substitution method for 32 words from the three GSL frequency levels, in the following proportions: 1K – 50%, 2K – 33.33%, 3K – 16.67%, respectively. Results of the pilot study suggested that four of the pseudowords – fomul, oligan, steck, and thrait – were problematic and were subsequently replaced by fimul, iligan, sweck, and thait. Unfortunately, three other pseudowords were also mistakenly changed by the spreadsheet program’s spell checker and then re-corrected inaccurately: thraugh, troet, and tuught became thraegh, troit, and tought.
The accuracy of the YN test results were checked by giving students a subsequent VLT-style MC vocabulary test, which tested the same 96 real words using L1 definitions, similar to Ishii and Schmitt (2009). This test was pre-tested by four native English teachers having Japanese ability, and corrected by four native Japanese English teachers with high-level English ability. All item questions and answers were found to be acceptable.
Results
YN tests
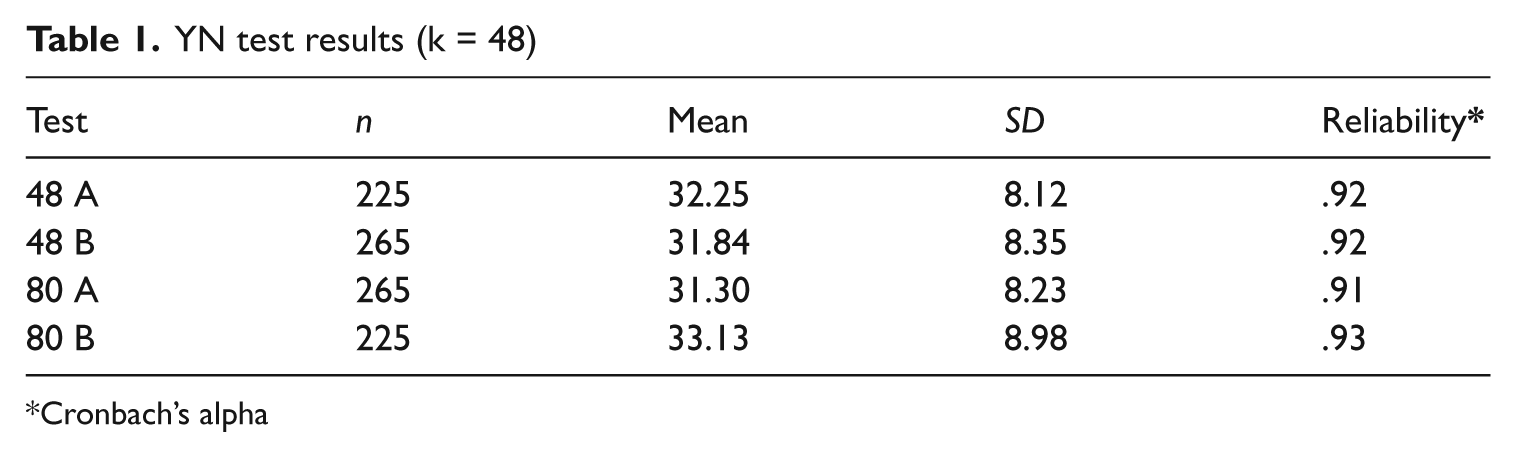
To begin the analysis, the pseudoword results for YN tests 80A and 80B were removed from the data, allowing for direct comparisons of the real word results. Pseudoword results are presented in the following section. Summary results of the four forms (48A and B, 80A and B) can be seen in Table 1. Overall, students knew 32.08 (69.4%) of the 48 real words on these tests, with SDs between 8.12 and 8.98 words, for an average of 8.43. Real word hits ranged from a low of four through the maximum of 48 by one participant each. Reliabilities (Cronbach’s alpha) were between .91 and .93. Tests 48A and 80B had higher means and lower student numbers than 48B and 80A likely due to the 42 deleted results mentioned above. However, an analysis of variance revealed no significant differences between the four test means (F(3, 976) = 2.040, p = .107).
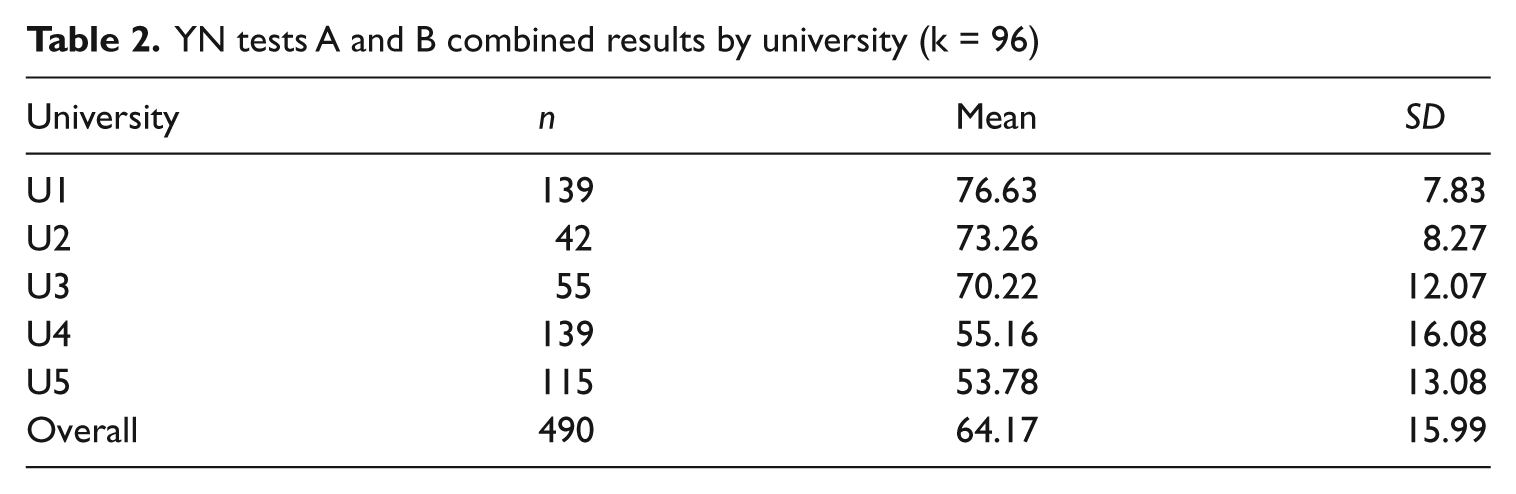
The YN test means and SDs for each of the five universities, ranked from highest to lowest, are listed in Table 2. Students in the top institution knew a mean of 76.6 of the total 96 words (48 items × 2 YN tests). This is approximately 42% more words than their counterparts in the lowest university whose mean was 53.8 words. YN test means for the five universities decrease along with university proficiency level, while SD tended to increase.
YN tests A and B combined results by university (k = 96)
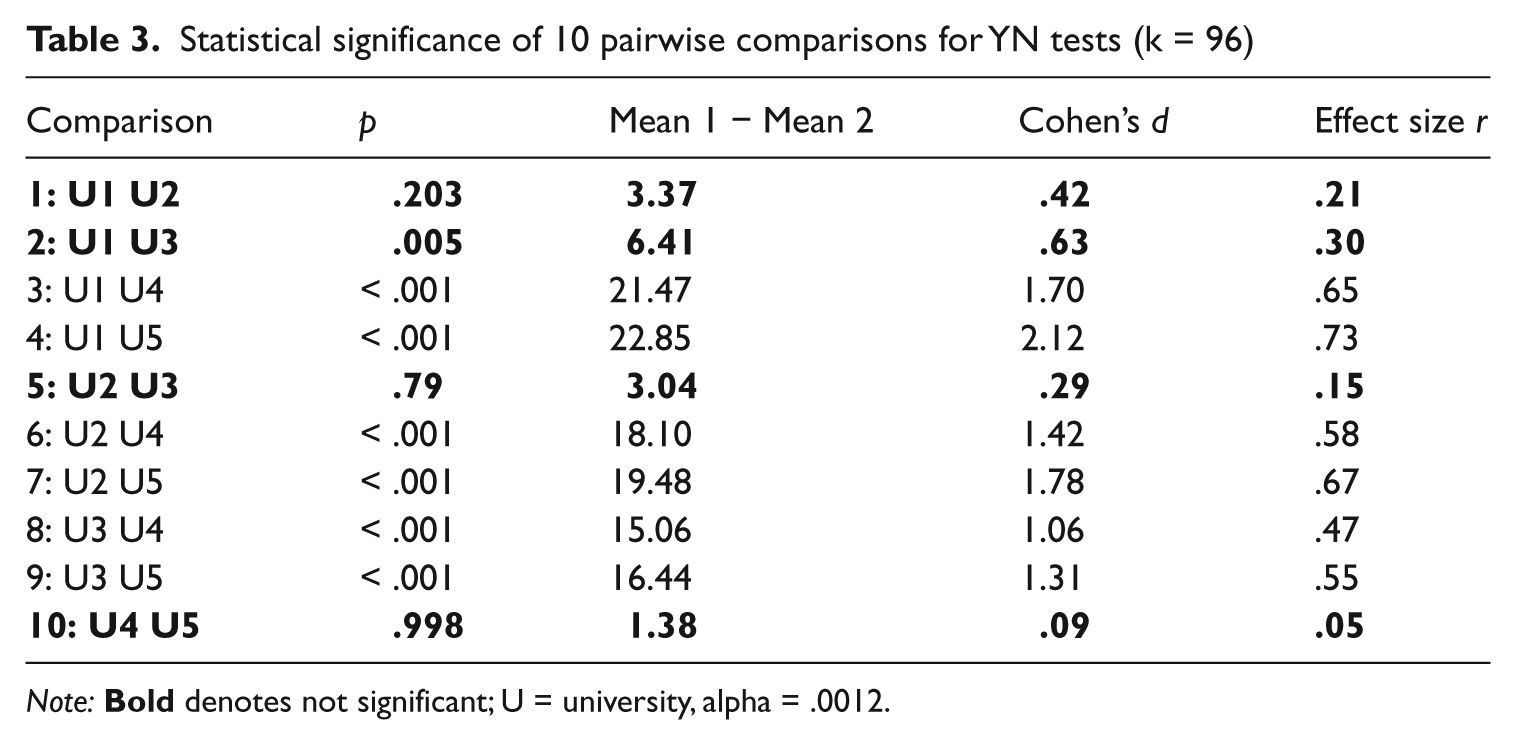
A one-way analysis of variance revealed significant differences between the YN combined means (k = 96) for the five universities (F(4, 485) = 82.83, p < .001). The effect size calculated using eta squared was very large at .41, confirming the significance of the differences. (For eta-squared values Cohen (1988) classified .01 as a small effect, .06 as a medium effect, and .14 as a large effect.) As the range of SDs amongst the five universities (U) was so wide (7.83 –16.08), a post hoc comparison using Tamhane’s T2 test (Hochberg & Tamhane, 1987) was conducted. This test does not require similarity of variance as other post hoc tests such as the Tukey HSD do. The significance level for the tests was set at p = .0012, using a partial Bonferroni adjustment for multiple comparisons (10) on correlated scores (r = −.613) (Uitenbroek, 1997). It revealed that four of the university pairs (U1 & U2, U1 & U3, U2 & U3, and U4 & U5) were not significantly different. All of the other six pairwise comparisons were significantly different (see Table 3). This may suggest that two groups of universities exist: U1, U2 and U3 (the high U group); and U4 and U5 (the low U group). Reflecting the ranking of the institutions, the greatest significant difference was between U1 and U5 (Cohen’s d = 3.41, r = .86). The smallest difference (not significant) was between the lowest two, U4 and U5 (Cohen’s d = .09, r = .05).
Statistical significance of 10 pairwise comparisons for YN tests (k = 96)
Note:
A second analysis of variance (univariate) was conducted with university and test set (A and B) as effects to see if there was any interaction. There was no significant difference between the test sets (A and B) (F(1, 480) = 1.52, p = .22 ). Again, there were significant differences for the five universities (F(4, 480) = 74.00, p < .001) and interaction between test set and university was also significant (F(4, 480) = 3.55, p = .007). This significant interaction was likely the influence of the one class of 42 students from the lowest university whose results had to be disqualified due to writing the same test form – tests 48A and 80A. Again, this accounts for the differences in the sample sizes of tests 48A and 80B versus tests 48B and 80A (n = 225 and 265, respectively). The smaller group had fewer lower level students because of the disqualification, and consequently higher scores.
Pseudowords
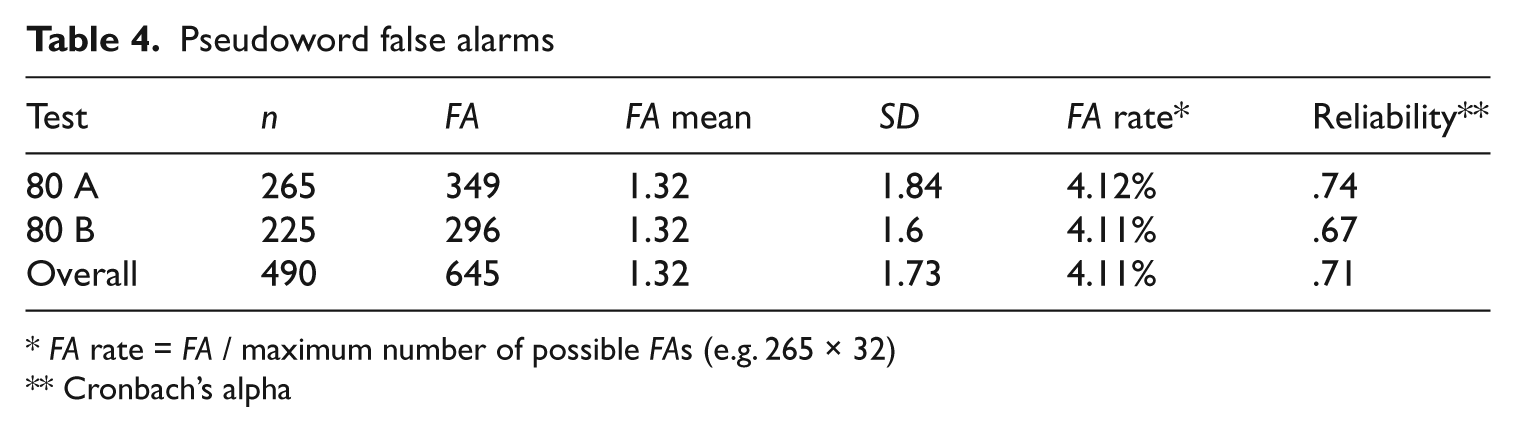
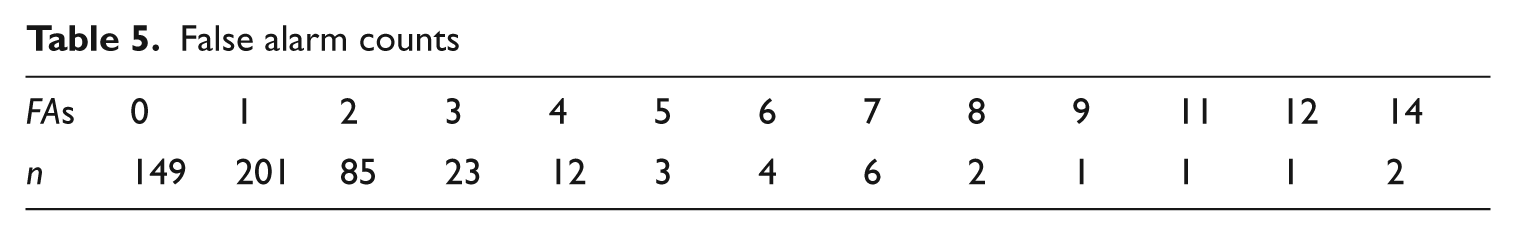
Analysis of the two pseudoword test forms (80A and 80B) produced a total of 645 FAs, a mean of 1.32 FAs. The overall FA rate was 4.11% (see Table 4). More than 30% of the 490 students who took these tests reported no FAs whatsoever and over 70% reported only 0 or 1 FAs. The highest number of FAs was 14, which was reported by two students, one from U3 and another from U4 (see Table 5). The overall reliability (Cronbach’s alpha) of .71 for the 32 pseudowords is substantially lower than the .91 and .92 for the 48 real words in YN tests 80A and 80B.
Pseudoword false alarms
FA rate = FA / maximum number of possible FAs (e.g. 265 × 32)
Cronbach’s alpha
False alarm counts
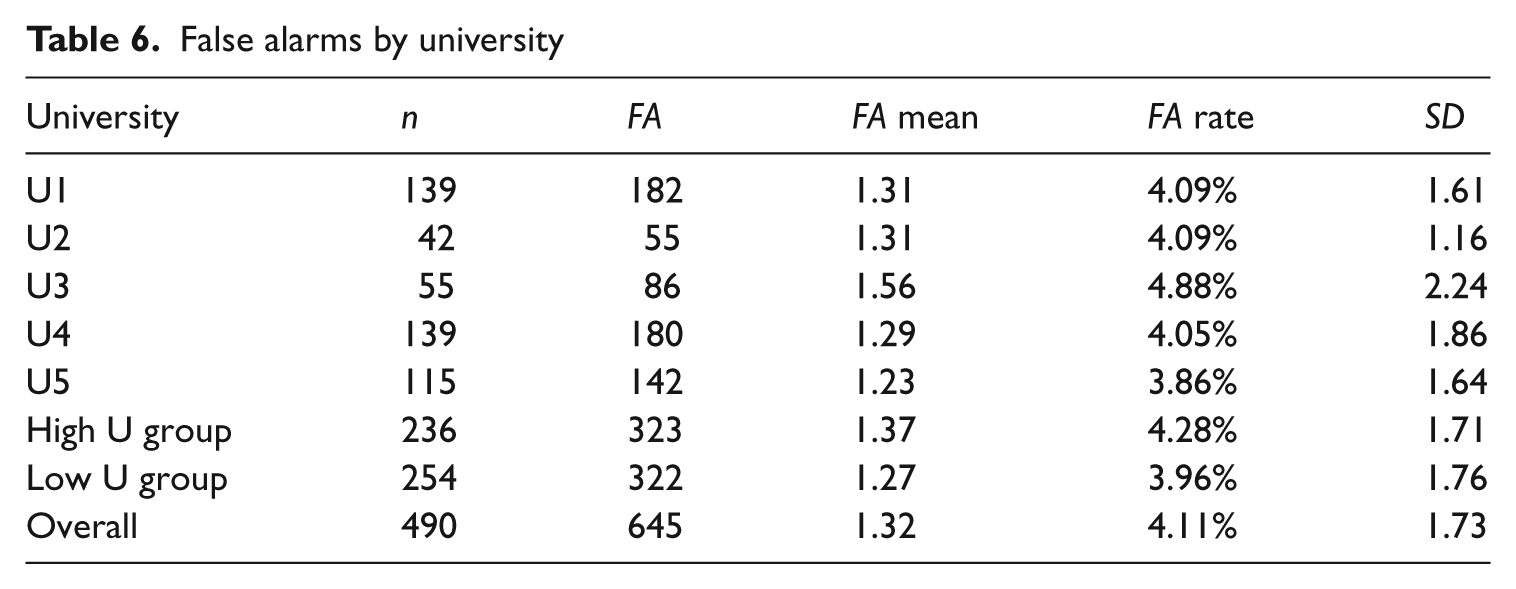
FA counts and means by university and U group are provided in Table 6. Perhaps surprisingly, the lowest university (U5) had the lowest FA mean at 1.23. This was followed by U4 at 1.29; U1 and U2 at 1.31 each; with U3 having the highest FA mean at 1.52. U3 also had the highest SD at 2.24, with the others’ ranging between 1.16 and 1.86. However, a one-way ANOVA did not reveal any significant differences between the universities’ FA means (F(4, 485) = .347, p = .849). An effect size calculation between U3 and U5 confirms the very weak effect of this difference, which was the largest difference between any two universities (Cohen’s d = .17, r = .08). An independent samples t-test confirmed that the difference between the means for the high versus low U groups was not significant (t = .644, df = 488, formulae .520), while an effect size analysis revealed that the difference between the means was very small (Cohen’s d = .06, r = .03).
False alarms by university
MC test
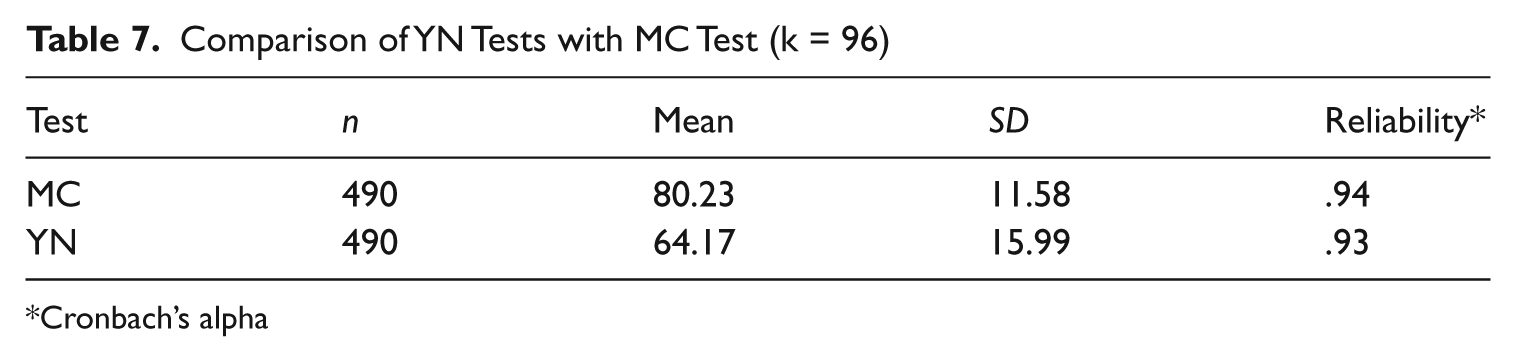
A VLT style MC test was included in the test battery, as a means of checking for overestimation and underestimation of vocabulary knowledge in the YN tests. This MC test resembled the VLT (Nation, 1990), in that questions were presented in sets of three, with six distractors (a 3 × 6 format). With 99 questions, this MC form tested the 96 real words from both YN forms, plus three extra to fill out the test questions. As can be seen in Table 7, the mean MC test score was 80.23 of the total of 96 words, with a SD of 11.58 words and a reliability (Cronbach’s alpha) of .94. YN test scores were roughly 16.06 words lower than the MC test scores, possibly suggesting that the students were conservative on the YN tests, tending to underestimate not overestimate their vocabulary knowledge. Alternately, it is also possible that the MC test questions were simply too easy for these students. A Cohen’s (1988) effect size calculation determined that the difference between the MC and YN tests means was medium (Cohen’s d = 1.22, r = .52).
Comparison of YN Tests with MC Test (k = 96)
Cronbach’s alpha
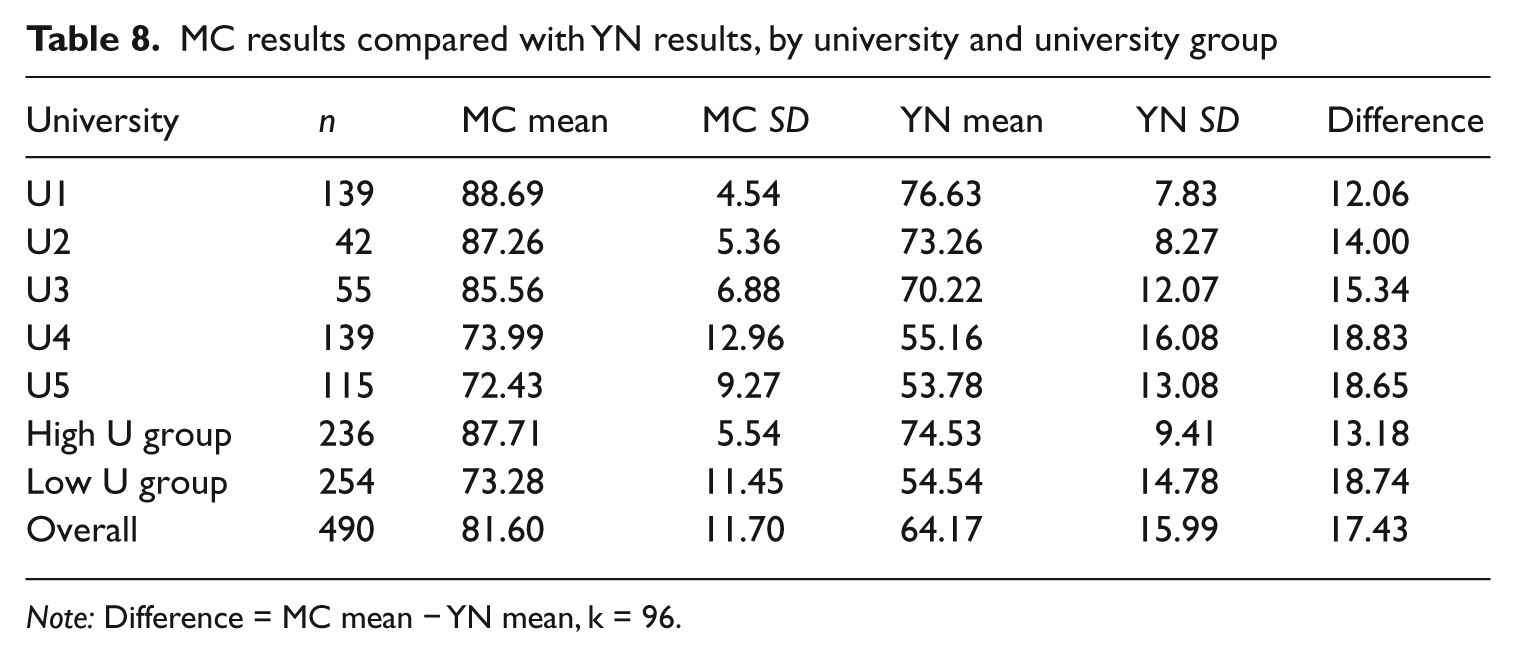
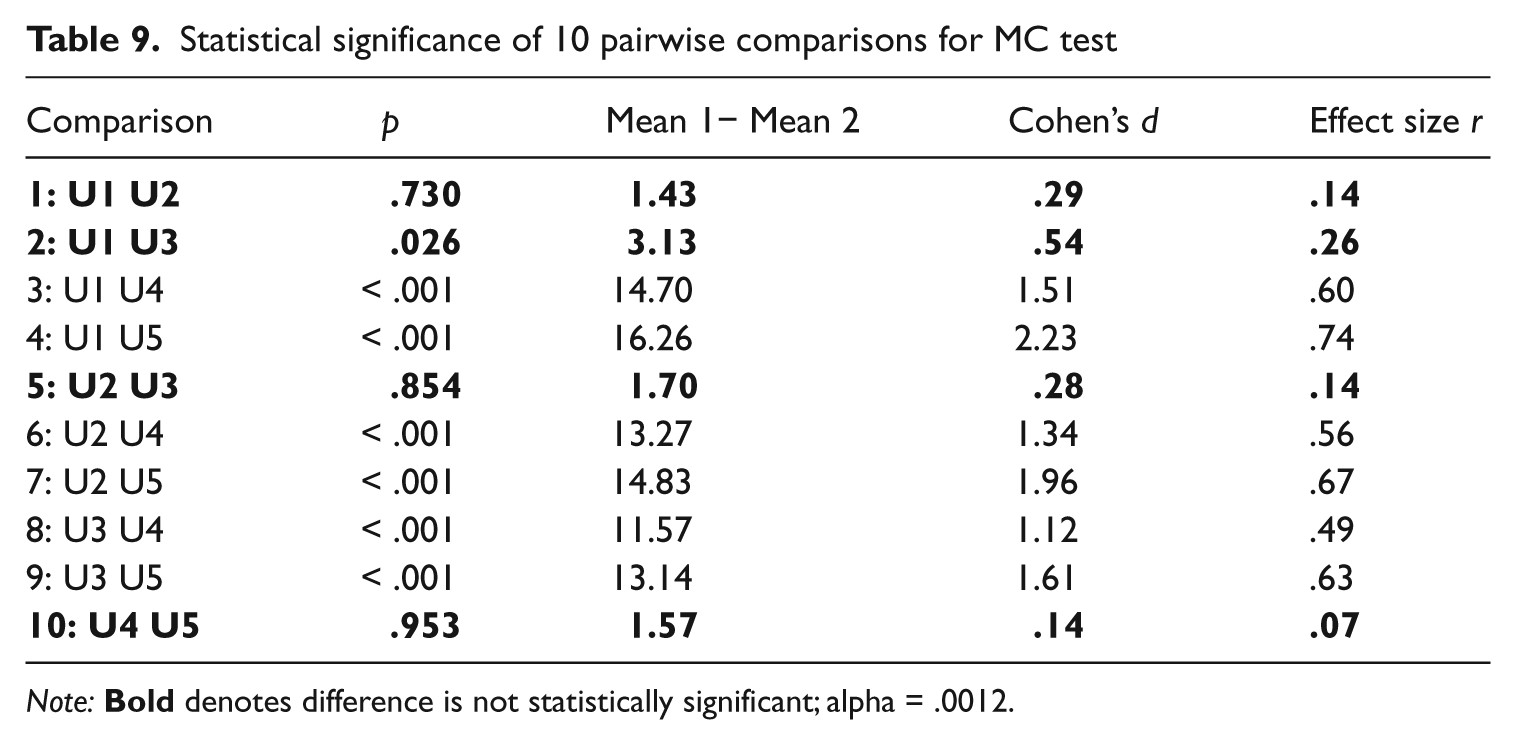
The means and SDs for each of the five universities on the MC tests are listed in Table 8. U1 had a mean of 88.69 and scores ranging from a low of 74 (n = 1) through the maximum of 96 (n = 2, or 1.44%). Unlike the initial top university, these figures do not suggest a strong ceiling effect. Similar to the YN tests, means decreased along with university proficiency, while variance increased. The differences between the MC means and YN means for each university are also listed. These differences generally increase as university proficiency decreases; until U5 which had slightly less difference than U4. A one-way ANOVA also found significant differences between the means for the five universities (F(4, 485) = 79.68, p < .001). The effect size calculated using eta squared was large at .40. Post hoc comparisons, again using the Tamhane’s T2 test, revealed that the same four university pairs were not significantly different (U1 & U2, U1 & U3, U2 & U3, and U4 & U5). All of the other six pairwise comparisons were significantly different (see Table 9). As this second post hoc analysis confirmed the existence of two distinct university groups (the high U group: U1, U2, & U3; and the low U group: U4 & U5), subsequent analysis will focus on these two groups as opposed to the five individual institutions.
MC results compared with YN results, by university and university group
Note: Difference = MC mean − YN mean, k = 96.
Statistical significance of 10 pairwise comparisons for MC test
Note:
Correcting formulae and correlations
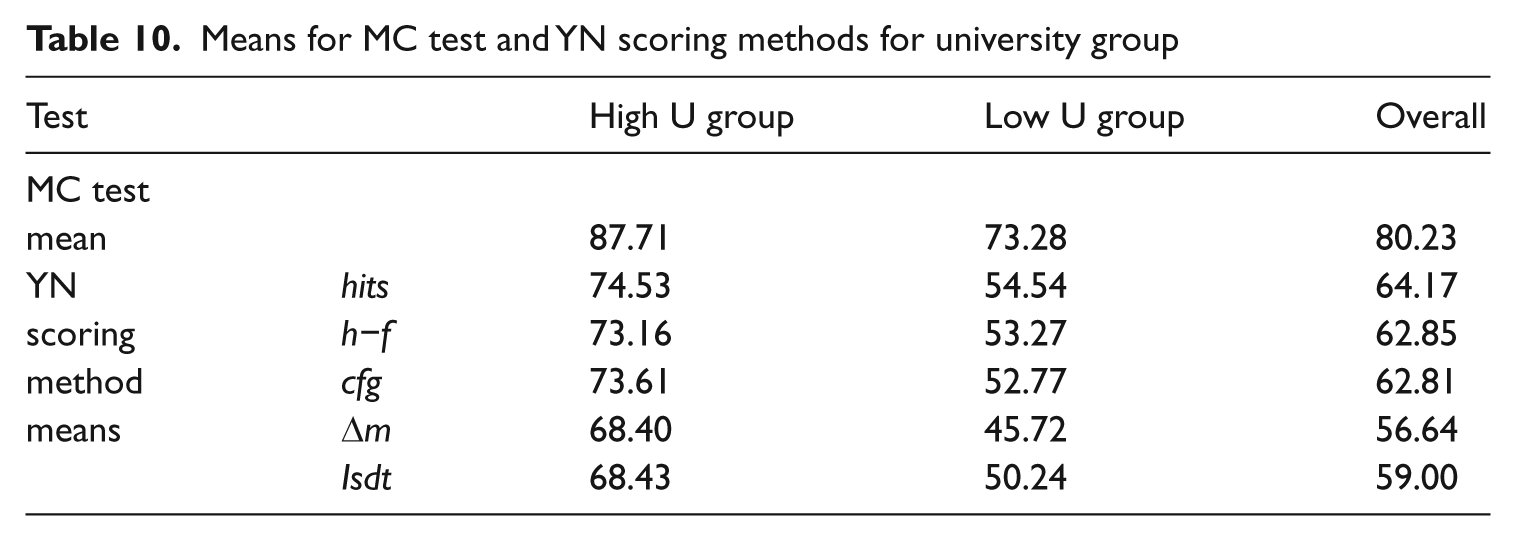
Following Mochida and Harrington (2006), an analysis was performed comparing MC results with YN raw scores (hits) plus the four correction for guessing formulae outlined in Huibregtse et al. (2002). Means for the two U groups and overall are presented in Table 10. As YN means were lower than MC means for all universities the use of each of the four correction formulae increased the difference between YN and MC means, especially the Δm correction formula for the two lowest proficiency universities.
Means for MC test and YN scoring methods for university group
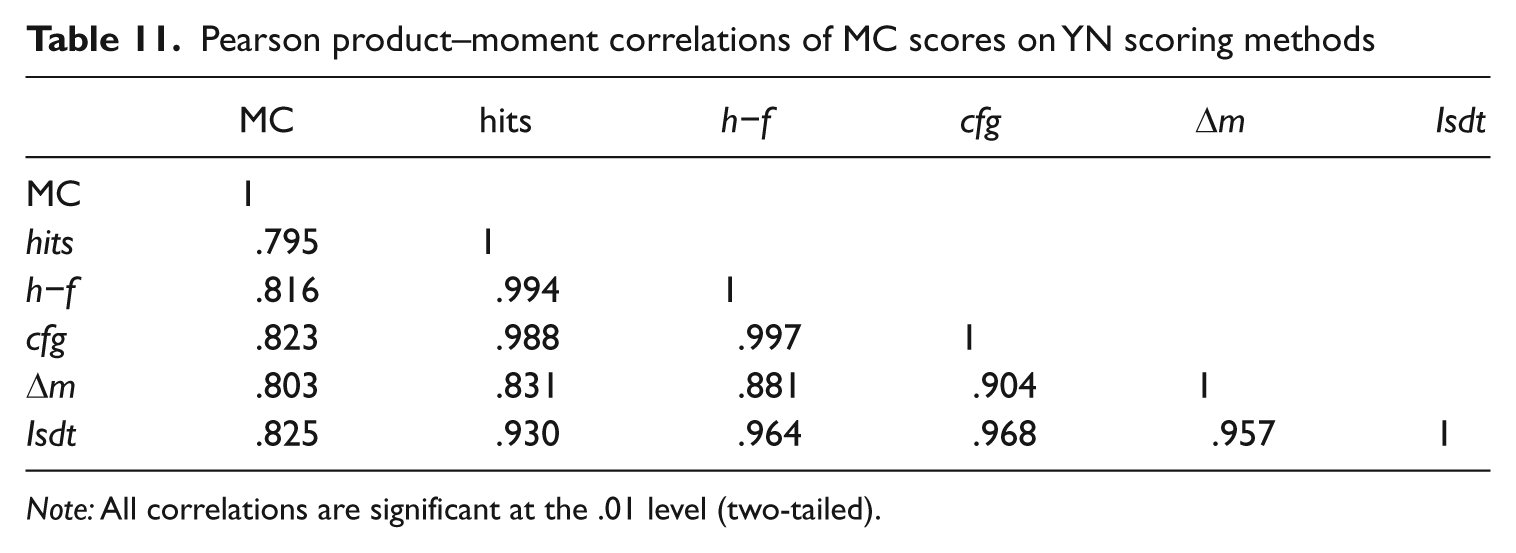
Pearson product–moment correlations between MC test scores and the five YN scoring methods are presented in Table 11. The Isdt formula had the highest correlation with MC results at .825, which was .030 points higher than the correlation on YN hits. Using Chen and Popovich’s (2002, p. 23) t (difference) formula as adapted by Field (2009, p. 192), the difference between the YN hits correlation and those of three of the four correction formulae (h−f, cfg, and Isdt) were all statistically significant (t(diff.) = −7.57, −7.18, and, −3.16, df = 487, p < .001, respectively). However, the difference between hits and Δm was not significant (t(diff.) = −.552, df = 487, formulae .558). Nor was the difference between the h−f and Isdt (t(diff.) = −.187, df = 487, p = .187). These correlations are similar in ranking to those reported in Mochida and Harrington (2006, p. 87), with hits having the lowest correlation and Isdt having the highest, overall.
Pearson product–moment correlations of MC scores on YN scoring methods
Note: All correlations are significant at the .01 level (two-tailed).
Direct comparison of MC scores with YN results
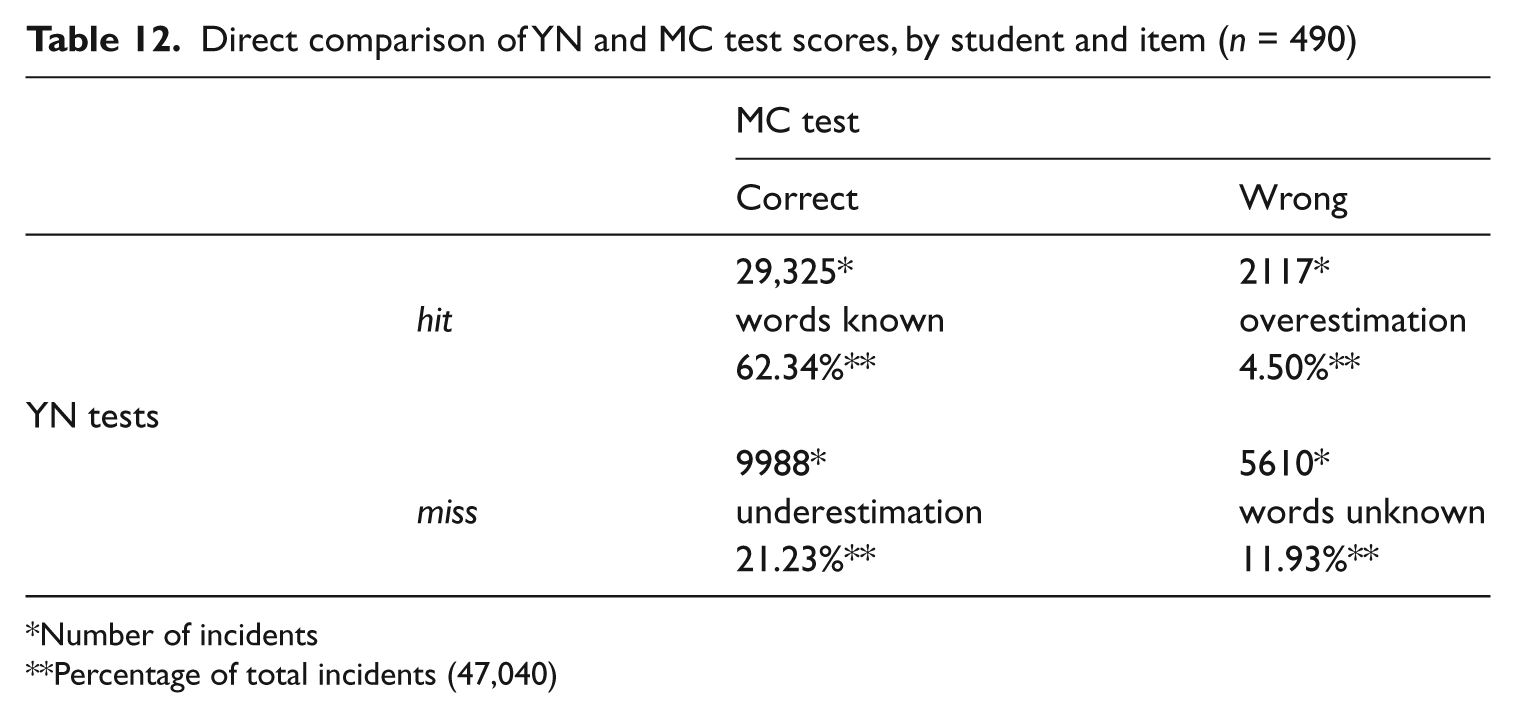
Replicating Mochida and Harrington (2006), each student’s response on each word in the YN tests was matched with his or her answer to that word on the MC test. Total number of incidents and percentages for these matched forms are presented in Table 12. This direct comparison of YN and MC results resulted in a total of 47,040 matches (490 participants × 96 items). A hit on a YN form and a correct answer on the MC test had 29,325 occurrences (62.34%, labeled words known). A miss on the YN form matched with a wrong answer on the MC test occurred in 5610 instances (11.93%, words unknown). It appeared as if the YN and MC test results matched in about 71% of cases. This analysis also revealed that instances of underestimation occurred about 4.7 times more often than instances of overestimation (9988 and 2117, respectively).
Direct comparison of YN and MC test scores, by student and item (n = 490)
Number of incidents
Percentage of total incidents (47,040)
Table 13 presents the YN − MC tests comparison information for the two university groups. The number of words known showed a direct relationship with university ability level, decreasing with proficiency. Conversely, the other three categories (words unknown, underestimation, and overestimation) had an inverse relationship with proficiency level, increasing as university ability decreased. Additionally, underestimation was greater than overestimation by 5.23 times for the high U group and 4.44 times for the low U group.
YN–MC comparison means, by university group (k = 96)

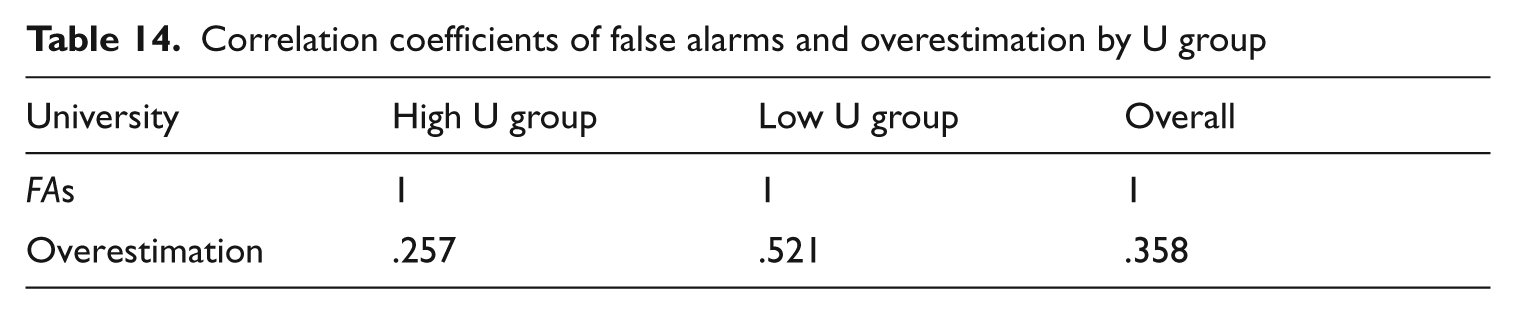
Table 14 shows the correlation coefficients between FAs and overestimation. The overall correlation of .358 is lower than the .370 reported in Mochida and Harrington (2006). The correlation between FAs and overestimation was less than half for the high U group compared with the low U group (.257 versus .521, respectively). Despite the higher FA rate for the high U group (4.28% and 3.96%, respectively; not significant), these correlations suggest that FAs were more strongly associated with instances of overestimation for the low U group. These correlations also reflect the overestimation means reported in Table 13 (3.11 and 5.45, high/low U groups, respectively).
Correlation coefficients of false alarms and overestimation by U group
These higher correlations between FAs and overestimation for the lower universities lead to an investigation to determine whether Mochida and Harrington’s (2006) finding that overestimates increased with item difficulty was also repeated in this study. Accordingly, an item analysis was carried out to determine whether the amount of overestimation increased with word difficulty. This analysis divided the 96 items in this study into three frequency levels based on the BNC-20 frequency listing (Nation & Cobbs, n.d.). The first level is the 1K, or the first 1000 most frequent words in the English language; followed by 2K; and 3K+, for words above the 2K level. Unfortunately, the 21 words in the 3K+ range included six different levels (as discussed above), each of which had too few items for reliable analysis. As can be seen in Table 15, overestimation rates did increase as word difficulty increased. Similarly, overestimation rates increased as university proficiency levels decreased. The overall overestimation rate of 4.5% is lower than the 5.4% reported in Mochida and Harrington (2006).
Item analysis (BNC-20 levels) – overestimation rates
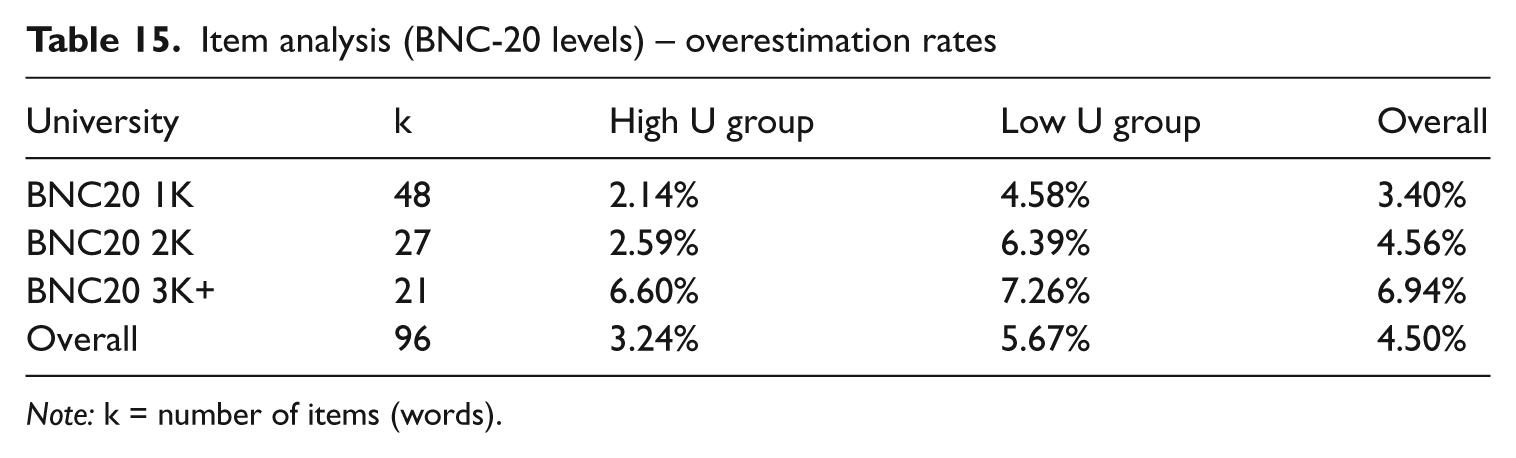
Note: k = number of items (words).
To double-check that the low level students in general had higher overestimation rates than their high level peers (regardless of institution) a high-low analysis based on MC scores was performed. The high 50% of students had an overestimation rate of 2.69% while the low 50% of students had an overestimation rate of 6.32%. Means were 2.58 and 6.07 incidents of overestimation, with SDs of 2.70 and 3.76, respectively. An independent samples t-test confirmed that the difference between the means was significant (t = 8.66, df = 488, p < .001), while an effect size analysis revealed that the difference between the means was medium (Cohen’s d = 1.07, r = .47).
Discussion
These results suggest a number of trends which may be of interest to researchers involved in second language vocabulary testing. Compared to the high U group the low U group had:
lower MC and especially YN test means (see Table 8);
more variance (higher SDs);
a greater spread between MC and YN test means and SDs;
fewer MC – YN matches (words known and words unknown, see Table 13);
higher rates of words unknown, underestimation and overestimation;
but not higher FA rates (see Table 6).
The FA rate of 4.11% reported above is quite close to the 4.4% reported in Mochida and Harrington (2006). Whereas Mochida and Harrington (2006) provided a warning of possible re-testing of some of the test items, this study avoided any such warning, out of concern that one may have made the students too conservative. The low FA rate as well as the greater amount of underestimation than overestimation seem to have justified this approach. The 4.11% FA rate is lower than the one reported in the other YN study which included a re-test warning, Eyckmans (2004) (8.7%), as well as the 8.4% to 25% rates reported in studies not including re-test warnings (Barrow et al., 1999; Eyckmans, 2004; Harrington & Carey, 2009; and Cameron, 2002). Contrary to Meara (1996) and Cameron (2002), the low-level university students did not have higher FA rates than their peers in the high level universities. As pseudowords are included in YN tests as a means of checking for evidence of overestimation, this low FA rate suggests that these Japanese university students were not exaggerating their lexical knowledge. This low FA rate, along with the similar rate in Mochida and Harrington (2006) may seriously question the robustness of the YN format when used on participants from differing L1s and / or cultural backgrounds. Compared to the rates reported by European researchers including Eyckmans and Cameron, mentioned above, these two < 5% FA rates are substantially lower. This lack of robustness may have been alluded to earlier in the quote by Harrington and Carey (2009, p. 624): ‘It is possible that pseudowords are not necessary at all … especially for particular learner backgrounds.’
It should be noted however, that the pseudowords used in this study have been criticized for being too unrealistic. According to one reviewer, only four of the 32 seem to meet the necessary criteria for good pseudowords. These four had a total of 33 checks for a mean of 8.25 FAs. The other 28 had a mean of 21.86 FAs (612/645). If tought, which garnered 296 of the total of 645 false alarms, is removed as an outlier, then the mean number of FAs for the remaining 27 pseudowords drops to 13.70, still higher than the 8.25 FA rate for the four acceptable ones. Despite possibly being unrealistic, these other pseudowords did not appear to artificially depress the FA rate.
The overall correlations between MC results and YN hits as well as the four correcting formulae reported in Table 11 are similar in ranking to those reported in Mochida and Harrington (2006, p. 87), with raw hits having the lowest correlation and Isdt having the highest. These correlations suggest that pseudowords were valuable in the YN tests because the use of the correcting formulae improved correlations with the MC test. The overall correlation between FAs and overestimation of .358 is slightly lower than the .370 reported in Mochida and Harrington (2006). The smaller correlation between FAs and overestimation for the high U group compared to the low U group (.257 and .521, respectively) suggests that pseudowords may be more useful for lower proficiency students, despite their low FA rate.
Mochida and Harrington (2006) also observed that overestimates increased as word frequency declined: from 1% at the 2K frequency level to 11% at the 10K level. Barrow et al. (1999) testing only Japanese university students similarly noted that overestimation rates increased along with item difficulty. The item analysis reported in Table 15 confirmed that overestimation rates did increase as item difficulty increased. However, item difficulty is not the sole factor affecting the difficulty of a test or test question(s). Bond and Fox (2007) explain that the ability level(s) of the test takers, known as person ability, is a second factor affecting the difficulty level of a test or test question(s). For example, an easy test for third-year engineering students would almost certainly be much too difficult for a regular grade-nine math class. This study has demonstrated that overestimation rates also increased as university ability levels decreased. So if overestimation increases as proficiency decreases, the value of pseudowords becomes questionable. As FA rates did not increase with decreasing English ability in this study, the use of any of the correcting formulae (h−f; cfg; Δm; and Istd) could result in an unjust adjustment of the scores of the higher proficiency students, relative to their lower ability peers. For instance, two students (one from each U group) had YN scores of 75 and FAs totaling two. However, the actual number of overestimations by the high U group student and the low U group student were three and five, respectively (similar to the 3.11 and 5.45 overestimation means reported in Table 13). Using the correction formulae (h−f; cfg; Δm; and Istd) the YN scores would be reduced by: 2.00; 1.40; 9.08; and 8.48, respectively. As these reductions apply equally to both students, their application can be viewed as inequitable for the high U group student who had 40% fewer actual instances of overestimation.
Conclusion
A total of 490 Japanese students with TOEIC® scores ranging from 230 to 730, in five different Japanese universities completed a battery of three vocabulary tests: two YN tests, plus a MC test covering the same 96 items. It was found that the low FA rate of 4.11% did not change significantly with university ability levels, but overestimation rates did increase both as item difficulty increased and as university ability decreased. In line with the recommendations found in Mochida and Harrington (2006), Shillaw (1996) and Harrington and Carey (2009), the results of this study suggest that for these Japanese university students, pseudowords may be an unnecessary feature of the YN vocabulary test. Not only do they completely ignore the underestimation of vocabulary knowledge found in YN tests, the use of any of the correcting formulae may unjustly penalize the higher proficiency students who, in this study, had lower overestimation rates. For the students and classes involved in this study, replacing pseudowords with real words might be a better use of the valuable, but limited space available in the YN test format.
This study does suffer from a number of weaknesses, in addition to the pseudowords discussed above. A total of 108 student results had to be deleted due to three different causes: (1) a ceiling effect on the MC test for one university; (2) participants writing the same version of the YN test; and (3) participants intentionally checking pseudowords. Additionally, the original item list was based on the GSL (West, 1953), and not on a more up-to-date corpus based frequency listing such as the BNC-20 (Nation & Cobb, n.d.), which would have allowed for more useful item comparisons. A more balanced design in terms of the word frequencies of the items as well as the number of participants from each university would likely have yielded results which could have been compared more easily. Also, the MC test used may have been too easy for some of these students and this could partially account for the greater amount of underestimation than overestimation found in the direct comparison of YN and MC test scores. Finally, the MC test used in this study has not been validated, so the results of any analysis based on these test scores should be treated with caution.
As the universities and students involved in this study were a convenience sampling as opposed to a random sampling, these results are not generalizable beyond the classes involved. Further research is required to determine if these findings (low and steady FA rates plus overestimation rates which increase as student ability levels decrease) fairly represent Japanese university students. Additional research to determine if overestimation rates actually do increase as ability levels decrease for YN test takers in general might also prove valuable. Should such research verify that overestimation does have an inverse relationship with student English ability level, further research could also investigate the possibility of adjusting the present FA correction formulae to better reflect this relationship.
Footnotes
Acknowledgements
Many thanks Ms. Tokunaga Miki and Messrs. Ozono Shuichi, Yokomitsu Hiroshi, Hoke Shintaro, and Nick Bovee for their assistance in preparing the bilingual multiple choice test. Also many thanks to Messrs. Chris O’Sullivan, Jeremy Boston, Mathew Porter, Richard Grumbine, and David Latz as well as all of their students who participated in this study.