
Abstract
This study explores the attitudes of raters of English speaking tests towards the global spread of English and the challenges in rating speakers of Indian English in descriptive speaking tasks. The claims put forward by language attitude studies indicate a validity issue in English speaking tests: listeners tend to hold negative attitudes towards speakers of non-standard English, and judge them unfavorably. As there are no adequate measures of listener/rater attitude towards emerging varieties of English in language assessment research, a Rater Attitude Instrument comprising a three-phase self-measure was developed. It comprises 11 semantic differential scale items and 31 Likert scale items representing three attitude dimensions of feeling, cognition, and behavior tendency as claimed by psychologists. Confirmatory factor analysis supported a two-factor structure with acceptable model fit indices. This measure represents a new initiative to examine raters’ psychological traits as a source of validity evidence in English speaking tests to strengthen arguments about test-takers’ English language proficiency in response to the change of sociolinguistic landscape. The implications for norm selection in English oral tests are also discussed.
Theoretical background
World Englishes
New lines of sociolinguistic research have acknowledged the pluricentricity of English such as world Englishes (WE) and English as lingua franca (ELF). The Kachru-led line of WE documents the function, status, linguistic maturity, and legitimacy of the emerging varieties especially in erstwhile UK- or US-colonized countries, such as India, and labeled as “outer-circle” contexts (Kachru, 1985). Despite a debate on whether it is a part of WE (Berns, 2008), ELF looks into the nature of English produced by non-native speakers, particularly without the involvement of inner circle speakers. The main research agenda of ELF focuses on phonology, pragmatics, and lexico-grammar (Jenkins, 2006; Siedlhofer, 2004), and reveals systematic and regular forms of English used by speakers of varieties of English (House, 1999). Research efforts put forth by WE and ELF have challenged traditional understandings of the ownership of English and the status of the native speaker norm (Davies, 2003; Widdowson, 1994).The features of users of English in different circle contexts have been thoroughly described and analyzed in The Handbook of World Englishes (Kachru, Kachru, & Nelson, 2006), Handbook of Varieties of English (Kortmann & Schneider, 2005), and The Oxford Guide to World Englishes (McArthur, 2003).
The spread of English and variations in different contexts raise important concerns that speakers in different circles, particularly in international situations, may become mutually unintelligible. The research agenda in intelligibility studies has expanded from a focus on speakers’ linguistic performance (Derwing & Munro, 2005; Field, 2005; Friederici, Kotz, Scott, & Obleser, 2010), listeners in co-sharing responsibility for intelligibility (Levis, 2005), the accommodation skills of speakers and listeners (Seidlhofer, 2004) to contexts without involvement of inner circle speakers, revealing strategies such as convergence and negotiation that help achieve mutual intelligibility (Deterding & Kirkpatrick, 2006; House, 2002, 2003; Meierkord, 2000; Firth & Wagner, 1997). The rich research findings not only complicate the constructs of intelligibility, but forward claims to assess English language learners’ ability to interact with speakers of different varieties of English instead of being judged against an idealized native speaker model (Canagarajah, 2006; Jenkins, 2006). The issues of approaches to evaluation about language learners’ proficiency also provoke debates in the field of language testing.
Such debates generally concern two different ideologies on the norms that test-takers’ performance in large-scale tests should be assessed against: the standard English perspective for the sake of fair measurement results (Elder & Davies, 2006; Elder & Harding, 2008) and the WE paradigm that advances a single norm ignores the linguistic richness in the current English global spread, and is biased against test-takers brought up on different norms (Canagarajah; 2006; Davidson, 2006; Lowenberg, 2002; Spolsky, 1993). Relevant to the latter is the reorientation of test constructs with reference to the target language use (TLU) domain. Construct-wide, as Abeywickrama (2013) argues, a single variety as test input misrepresents the TLU domain in a global context. Therefore, a more accurate representation of the TLU domain for tests used in a wider context is, as Taylor (2006) claims, to include the English varieties that test-takers may encounter in the TLU domain, and to assess test-takers’ ability on “how language diversity is actively negotiated in acts of communication under changing contextual conditions” (Canagarajah, 2006, p. 234).
Language attitude study
The emerging multiple forms of English have drawn the concerns of language testing professionals as potential biasing factors in language tests as raters’ acknowledgment and perception of the varieties may vary, which affect their scoring judgments (Davies, Hamp-Lyons, & Kemp, 2003). This assumption of an attitude–behavior relationship could be substantiated by research findings in the fields of psychology and language attitude, which have important implications in the language test practice should similar results be transferrable, and as such raise concerns about fairness in scoring validity, which is also a fairness issue (Kunnan, 2010). Empirical studies in language attitude have revealed that being identified as non-white in itself (Rubin, 1992) causes non-native speakers to be viewed unfavorably by listeners, regardless of whether they share the same variety (Lindemann, 2002; McKenzie, 2008; Rubin, 1992). The identification generates a negative evaluation of speaker competency (Lindemann, 2002; Rubin, 1992). Furthermore, the attitude–behavior relationship has also been established in psychology (Ajzen & Timko, 1986; Albarracin, Johnson, Fishbein, & Muellerleile, 2001; Fazio, Powell, & William, 1989; Hrubes, Ajzen, & Daigle, 2001). Despite these unfavorable judgments on competency, Giles and Billings (2004) in their extensive review of listener attitudes report that non-standard speech tends to be evaluated more highly in terms of “solidarity” when compared to varieties of standard speech. Non-standard variety speakers are generally rated highly on traits such as honesty and friendliness, particularly when the listeners are learners/speakers of a non-standard variety themselves. Studies on listeners from different ethnic groups also support this attitude and identity relationship (Barona, 2008; Bresnahan, Ohashi, Nebashi, Liu, & Shearman, 2002; Lindemann, 2003; McKenzie, 2008).
Language attitude is a complex construct. In psychology, the structure of attitude has been identified as comprising one or a combination of the three components of feeling, belief and behavioral tendency (Ajzen & Fishbein, 1980; Albarracin, Johnson, & Zanna, 2005; Cargile, Giles, Ryan, & Bradac, 1994). When attitude towards a specific language influences a listener’s judgment of a speaker, language attitude is formed (Cluver, 2000). To capture the complexity of language attitude formation in specific situations, a “social process model of language attitude” was proposed by Cargile et al. (1994). In this model, factors that evoke the formation of language attitude include characteristics of the speakers and listeners, and wider contextual factors, such a speaker’s culture as perceived by listeners, interpersonal history, immediate social situations or a combination of all.
Attitude studies within language testing
Unlike the constructs being conceptualized in the field of psychology, recent studies on rater attitude towards WE have revealed mixed and inconclusive findings. Kim (2005) examined the language backgrounds of raters, their attitudes toward WE, and how they scored the speech performance of six Korean students on the Test of Spoken English (TSE) picture description task, using holistic and analytic scales. Although their ratings on the holistic scales were fairly similar, their different attitudes towards WE significantly affected their analytic ratings on grammar, rate of speech, and task fulfillment, with those labeled as “positive” giving more lenient ratings.
Chalhoub-Deville and Wigglesworth (2005) investigated the rating performance by raters from the inner circle countries, including Australia, Canada, the UK and the US, and found no significant difference in evaluating ESL test-takers’ speaking performance. Similarly Kang (2008), replicating the study design of Rubin (1992), compared college student raters’ attitudes towards Asian and Caucasian groups, and noted no significant effect on their attitudes towards ethnicity, suggesting findings of similar studies may not be always applicable in different contexts. Touching issues on norm selection, Zhang and Elder (2011) compared native and non-native ESL/EFL teacher raters’ rating to national College English Test-Spoken English Test (CET-SET) samples. The results revealed similar outcomes in holistic scores between the two groups of raters, leading authors to imply “these norms may not be as distinct as is sometimes claimed” (p. 14).
Studies focusing on test-takers’ attitudes generally show a welcome embrace of linguistic diversity, but a reservation about bringing the difference to the test. Hamid (2014) examined test-takers’ viewpoints on inclusion of WE in the English oral test as elicited by IELTS data. The findings were mixed: though WE was favored by the majority on a conceptual level, the inclusion of WE-based linguistic features in tests was less supported for reasons of “maintaining standards, fairness, equality, and test-taker interests” (p. 277). A similar test-takers’ orientation to WE was also found in Gu and Yo’s (2014) study using four stakeholder groups, including test-takers, ESL/EFL teachers, score users, and language testing professionals. Looking at the test-takers’ attitude–test performance relationship, Harding (2008) showed that in general test-takers’ attitudes towards speakers with L2 accents of English on an academic listening test were reasonably positive, and that there was no clear relationship between the attitudes towards speakers and their performance on a listening test.
Overall, language assessment research on attitudes indicates a growing interest in placing rater attitude or psychological traits as potential variables affecting arguments on test-taker language proficiency. Nevertheless, the findings may not be generalizable because the studies covered different contexts and the instruments used to investigate rater attitudes were different. It therefore seems necessary to develop a unified instrument that is theoretically sound and empirically driven within language assessment research to measure rater attitudes towards WE.
Construction and validation of a rater attitude instrument
The scale development included three phases: construct elicitation, exploration, and verification. To generalize findings across a variety of English and contexts, the scale includes general statements about issues in rating WE speakers and specific statements on Indian English, the stimulus used in phase two and three. Except phase 1.1., different groups of raters of operational English oral tests were recruited for each phase of the study. Data collection over a 28-month period covered participants aged from 20 to 45 years, and ethical approval was obtained from the Institutional Review Board of the university with which the researcher was affiliated at the time of the study.
Construction phase 1.1: construct elicitation
To capture in fuller detail the features of the tripartite attitude constructs as asserted by psychologists (see aforementioned literature), two scaling methods were selected. Following a common practice in language attitude study, a seven-point semantic differential scale was selected to evaluate raters’ immediate feeling on speakers accompanied by their voices. To measure rater belief and rating tendency, declarative statements were necessary to depict and formulate various issues. As such, a five-point Likert scale (with values ranging from one = strongly disagree to five = strongly agree) was selected. An “un-ratable” option was included to allow any uncertainty in responding to items. Combining the two scales, a “Rater Attitude Instrument” (hereafter RAI) was created.
Sample and procedure
The construct elicitation was generated from two sources. For the Likert scale construction, three American male raters of a phone-based oral proficiency test were each interviewed either once or twice over the phone for approximately 40 minutes each time regarding their viewpoints of WE. A rich interview data set was theme-analyzed to screen out potential items for scale construction. Additional items were drawn from extensive literature review regarding stakeholder attitudes toward WE.
Next for the semantic differential scale items, a “varietal speaker evaluation” (see Hsu, 2012) was conducted, in which 40 undergraduate student raters participated, with a majority American (85%), from a large university in the US Midwest. Eight speech samples that include varieties of outer (including Indian English) and expanding circle English were used to collect an item pool representing raters’ immediate feelings towards WE. Student raters each provided up to three adjectives to describe their feeling of each speaker by completing the sentence, “The speaker sounds …”. A keyword analysis of the adjectives was calculated and adjective pairs with a higher distribution frequency were integrated and classified.
Construction phase1.2: item construction
Development of an item pool
Rater feeling
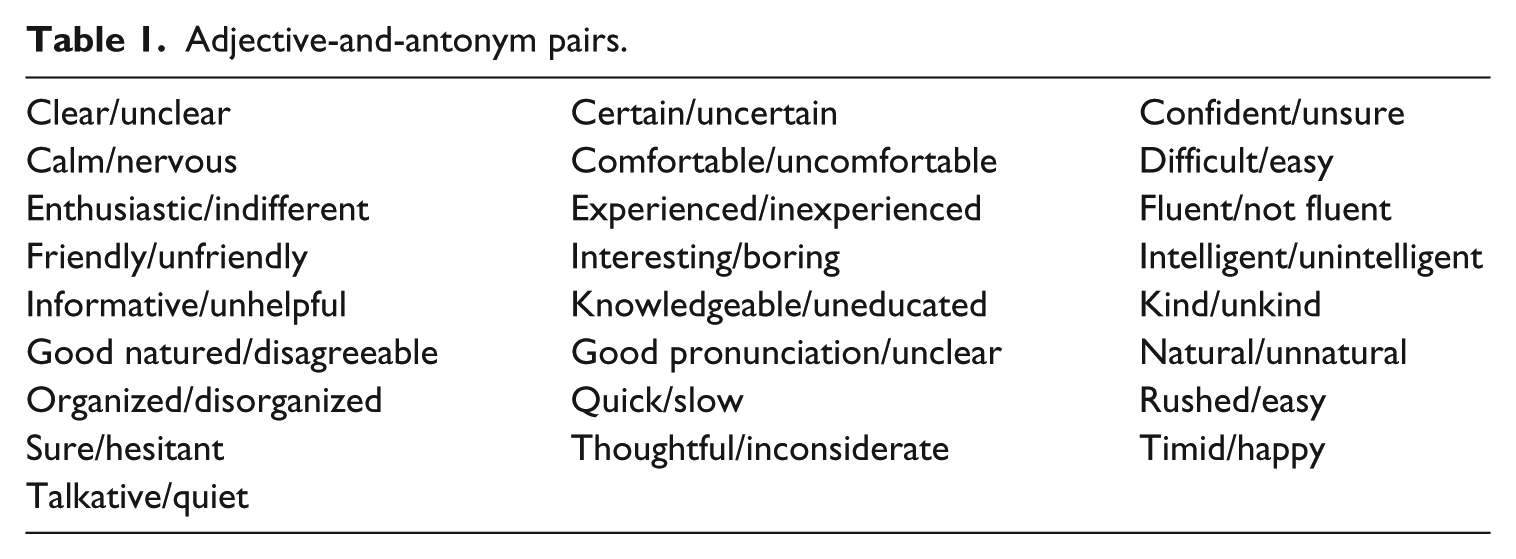
The 25 most frequent adjectives and their opposites in construction phase 1.1 were selected and randomly placed in the seven-point semantic differential scale (see Table 1), following the common practice of scale construction, that is, positive adjectives were not always placed on the right side of the scale.
Adjective-and-antonym pairs.
Rater belief
Guided by the Social Process Model (Cargile et al., 1994), 60 items were developed and categorized to represent two of the attitude constructs: belief and behavior tendency. The hypothetical structures went through a verification examination in construction phase three.
Perceived culture factor. Eight statements concerning raters’ perceived cultural features were constructed. The questions referred to the role of the varieties in second language assessment and institutional and cross-cultural settings. Another five statements measured raters’ perception of WE in general that included their attitudes towards WE status, knowledge of WE speakers’ demographic strengths, and concerns about WE in ESL/EFL teaching and learning.
Expectation of Indian English. Language expectancy theory (Burgoon & Miller, 1985) claimed that discrepancy between expected and actual language use leads to negative evaluations of the speaker. As such, 11 items measuring raters’ expectation of Indian English were included.
Rater behavioral tendency
Rating tendency. Twenty-one items investigated raters’ handling of unfamiliar varieties and their role as active listeners. Items on their actual behaviors were omitted as they are influenced by factors other than attitude, and therefore are not always accurate indicators of attitudes (Mueller, 1986).
Interpersonal history. Fifteen items in this category were designed to evaluate the extent of raters’ exposure to and the degree of familiarity with the varieties.
Rater biasing factors
Apart from attitude constructs, five rater biasing factors reviewed in LT literature were included. These were rater educational and professional experience (Chalhoub-Deville, 1995), residency (Chalhoub-Deville & Wigglesworth, 2005; Kim 2005), rater nationality and native language (Brown, 1995), and gender (McKenzie, 2008; O’Loughlin, 2002), some of which contributed to the extraneous variables that affected the scores. Hence, this section seeks to identify which biasing factor is associated with rater attitudes and ultimately affects rater scoring decisions.
The 60 items were reviewed by a group of experts (N = 4) to maximize the content validity of the instrument (DeVellis, 2003). Included were two doctoral candidates specializing in second language assessment and two researchers with a background in second language acquisition and sociolinguistics. Items were reviewed for clarity, representativeness and comprehensiveness of the constructs and the possibility of bias. Here 15 Likert-scale items were further refined for clarity and conciseness.
Construction phase 2: exploration
Sample and procedure
A new group of 20 raters who participated in this phase of the study had more than six months of experience rating oral proficiency tests for international students seeking placement at their respective universities in the US Midwest. There were 15 female and five male participants with an average age of 35. Of these, 45% held their highest degree in TESOL, 20% in English literature and 35% in other areas. The majority of the participants were native English speakers (55%), 30% were Asians and 15% Russian.
Access was graciously granted to the IELTS speech samples by Cambridge English Language Assessment. Descriptive tasks extracted from the IELTS oral test component were used in phase two and three. The speech samples cover a range of IELTS score bands (i.e., band four, five, six, seven, eight, and nine) awarded to the six Indian test-takers from actual IELTS data. Indian English was used as the sole stimulus across three construction phases given that it has been documented as an established variety and figures much in WE research agenda (Kachru et al., 2006; McArthur, 2003). Each descriptive task lasted 90 seconds.
The RAI was administered on-line. The URL address to access the RAI, speech samples and consent form were sent out to the raters. Each rater provided ratings on the 25 semantic differential scale items for each of the six Indian test-takers, which yielded a total of 150 observations. Raters then proceeded to the Likert questionnaire measuring rater belief and rating tendency. Each scale was accompanied by a comment section to enable raters to provide feedback on qualities such as clarity. The time length for the entire study was approximately an hour, and each rater received $20 upon completion of the study.
Data analysis and results
Rater feeling
Descriptive statistics and internal consistency
The mean for the dataset is 4.84, and only three of the 25 items have a mean less than four. To test the assumption of univariate normality, skewness and kurtosis were checked. A more liberal recommendation on the acceptable levels as proposed by Kline (2005) was used where cutoffs of −3 to +3 for skewness and −10 to +10 for kurtosis were applied respectively. The skewness of the 25 semantic differential scale items ranged from −.984 to .477, and the values for kurtosis ranged from −1.479 to .906, indicating the responses were normally distributed and well within the liberal recommendation.
Cronbach’s Alpha was calculated to assess internal consistency. A value of .880 was obtained, indicating a high level of internal consistency (de Vaus, 2002; George & Mallery, 2003).
The examination of correlation matrix for item consistency revealed that several items had low correlations with most other items. These were evaluated again against other criteria when running factor analysis to verify whether the low correlations were spurious or alternatively helped to clarify the factor structure.
Exploratory factor analysis
A principal component analysis (PCA) was performed to obtain preliminary information on the underlying dimensions of rater feeling, that is, the latent factors representing the items in the scale. Ratings on the 25 semantic differential scale items were assessed for suitability using SPSS 15.0. Evaluation of the correlation matrix indicated that the data was factorable providing a Kaiser-Meyer- Oklin index of .856, which is “meritorious” (Pett, Lackey, & Sullivan, 2003). Bartlett’s test of Sphericity was significant (p = .0000), indicating that the correlation matrix was not an identity matrix and all measures of sampling adequacy were deemed appropriate for data analysis.
Factor extraction and rotation
The PCA with oblimin rotation method was conducted. The choice of oblimin rotation method is based on the assumption that items or factors of rater feeling are most likely correlated to some degree (cf. Pett et al., 2003).The number of factors to extract was determined according to the two criteria: results of the scree plot and eigen values greater than one (Hayton, Allen, & Scarpello, 2004). Inspection of the scree plot seemed to suggest three or four factors, whereas the eigen values suggested five initial factors. The PCA was conducted again to force extractions of only four and three components respectively. Criteria that determined the acceptable number of the factor included: (1) items load substantively (> .30) on only one factor, (2) items load at approximately zero (10 to −0.10) on some other factor (Tabachnick & Fidell, 1989) and (3) interpretability. That is to say, the ultimate decision on the number of factors to extract was based on simple structure and the interpretative clarity of the loadings. As a result, the three factor model attained satisfactory results and was selected. Next, each item was evaluated for possible removal so as to maximize the explained variance. Item communality that measured the proportion of variance of a particular item that is explained by all the factors jointly was used as a guideline for item deletion (Worthington & Whittaker, 2006). Any item with a communality of less than 0.50 was removed because it was not highly correlated with one or more of the factors in the solution (Costello & Osborne, 2005). Consequently, six items/pairs were removed, and PCA was carried out two more times on the remaining items/pairs until the complete item communality was improved and above .50 when six more items/pairs were removed.
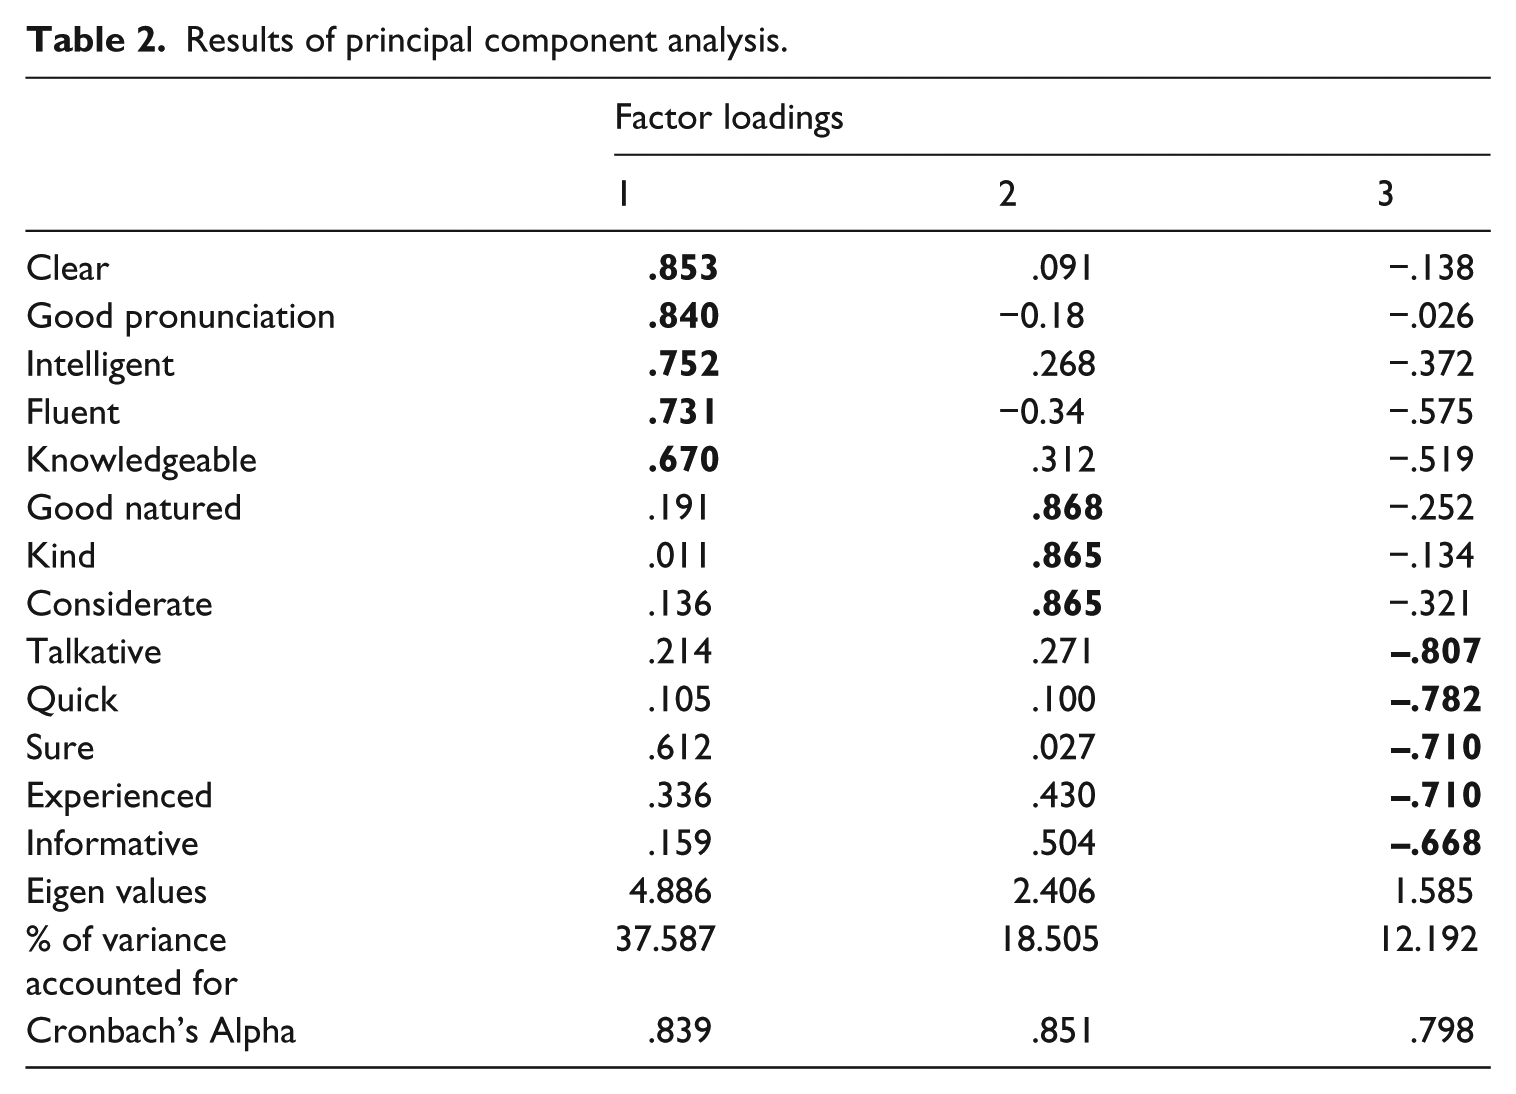
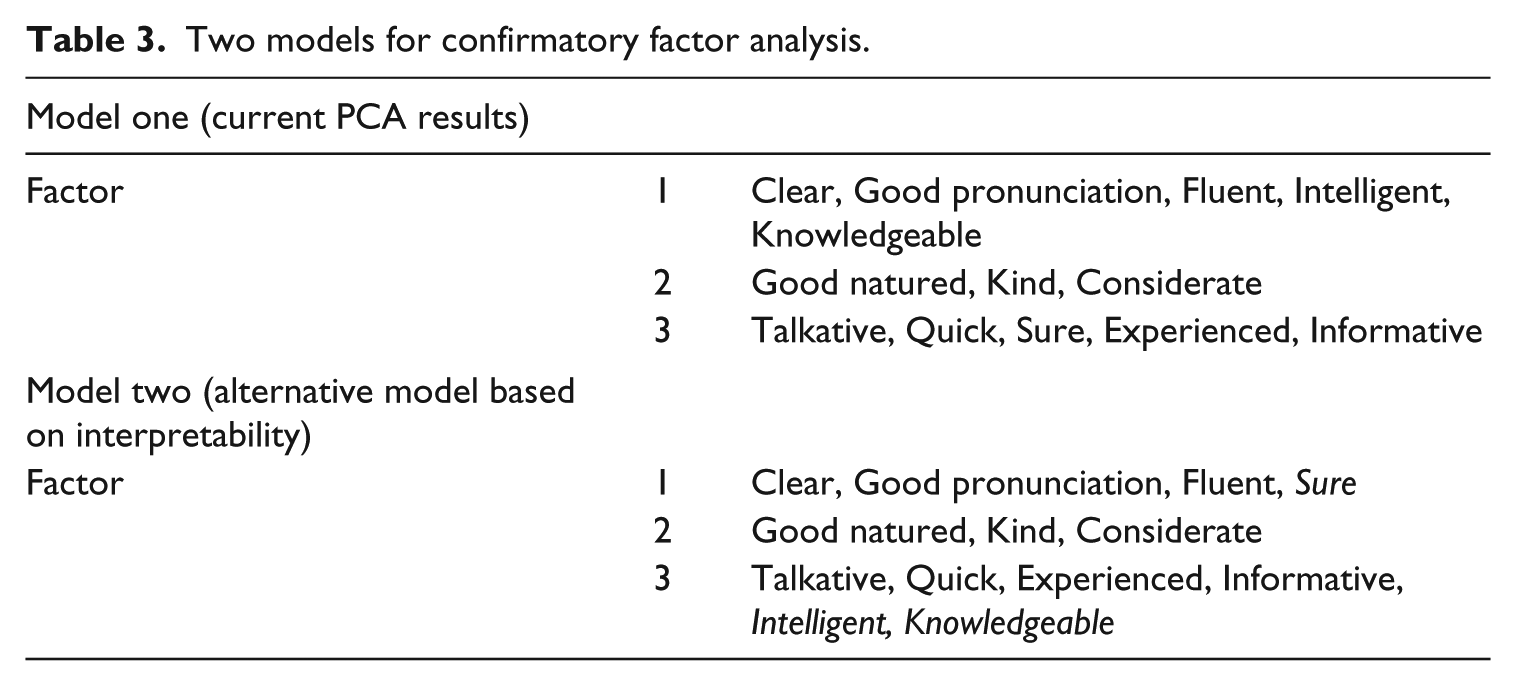
The three factors extracted accounted for 68.28% of the total variance in the items with eigen values greater than one (see Table 2). Note that only positive adjectives in each pair were listed in the table. Factor one was generally evaluated by voice quality, factor two by attractiveness of the speaker, and factor three by speaker’s competence. Given the easy interpretability, two of the items in factor one (Intelligent and Knowledgeable) with a loading of .752 and .670 seem to have a better fit in factor three implying a speaker’s competency. Sure, with a loading of .612 may be regrouped into factor three from factor one. The original and alternative proposed item distributions (see Table 3) facilitated constructing a CFA model in the next phase. Items in italics in model two are the alternative changes.
Results of principal component analysis.
Two models for confirmatory factor analysis.
For the final 13 items on rater feeling, Cronbach’s Alpha was above .80 for the total scale and each factor demonstrated an acceptable degree of internal consistency. The final three-factor model accounted for 68.284% of the total variance.
Rater belief and rating tendency
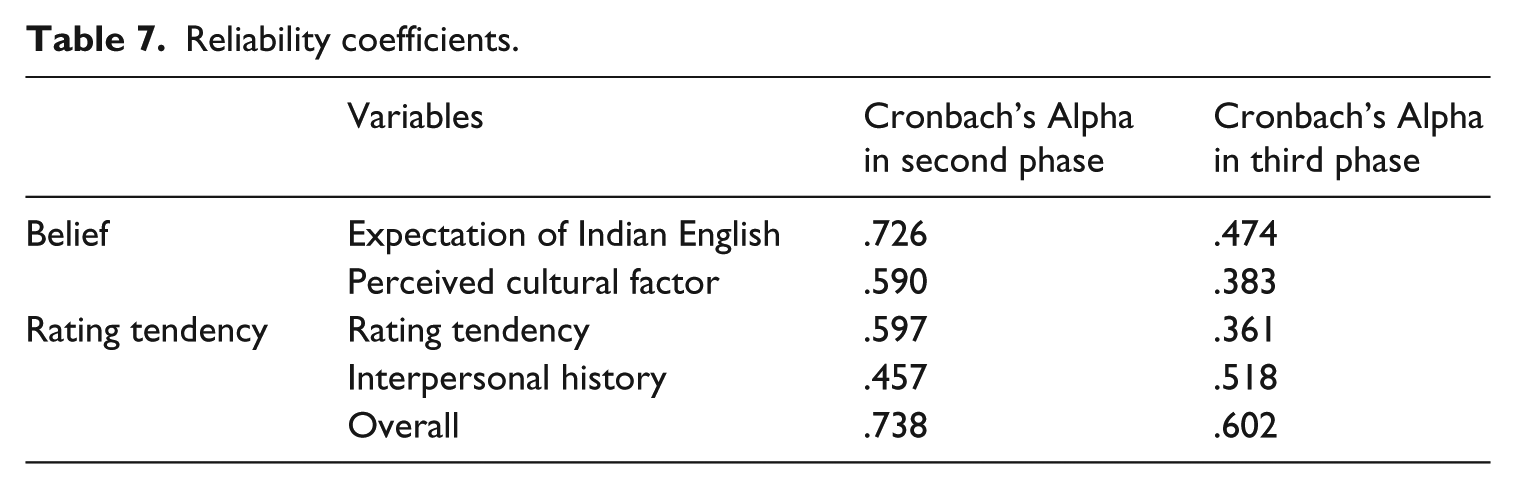
Negatively worded items were reverse coded prior to the analysis so that higher scores indicated a more positive belief or rating tendency. Cronbach’s Alpha was calculated to examine internal consistency, that is, whether the scale items all measure the same underlying attributes. The reliability estimates for the variables range from .260 to .557 with Cronbach’s Alpha of .609 for the overall measure. As it is recommended that a minimum Cronbach’s Alpha of .70 is needed to demonstrate good internal consistency (de Vaus, 2002; George & Mallery, 2003), all items were re-examined to determine if they placed below the desirable value. The alphas of items deleted along with the qualitative input provided by the raters were examined and 13 problematic items across sections were removed to improve questionnaire clarity, resulting in 32 items remaining in the revised scale. Cronbach’s Alpha for the entire questionnaire was improved to .738. As illustrated in Table 7, the Cronbach’s Alpha for each variable was also improved, though only the Expectation of Indian English section satisfied the .70 cutoff value. The other three sections along with their new Cronbach’s Alpha were as follows: Rating Tendency (.597), Perceived Cultural Factor (.590), and Interpersonal History (.457).
Construction phase 3: verification
Sample and procedure
A fresh sample of 96 raters participated in phase three, comprising ESL/EFL instructors at private or university ESL programs in New York City, San Francisco, and India respectively and resided in the areas above at the time of the study. There were 13 Indian and 83 non-Indian participants, comprising 90% Caucasian, 8% Asian, and 2% African. Twenty-three of the raters had experience in rating large-scale English proficiency tests and more than half (54%) had more than six years of ESL/EFL teaching experience with 75% possessing a highest degree in TESOL, 9% in education, and 10% in other areas.
The procedures were consistent with those in phase two, allowing raters to access all required materials, including the RAI, speech samples and consent form.
An email reminder was sent two weeks after the respondents received the link to see if they had not yet completed the study. The time length for the entire study was approximately one hour, and each respondent received $15 for participating.
Data analysis and results
Rater feeling
Descriptive statistics and internal consistency
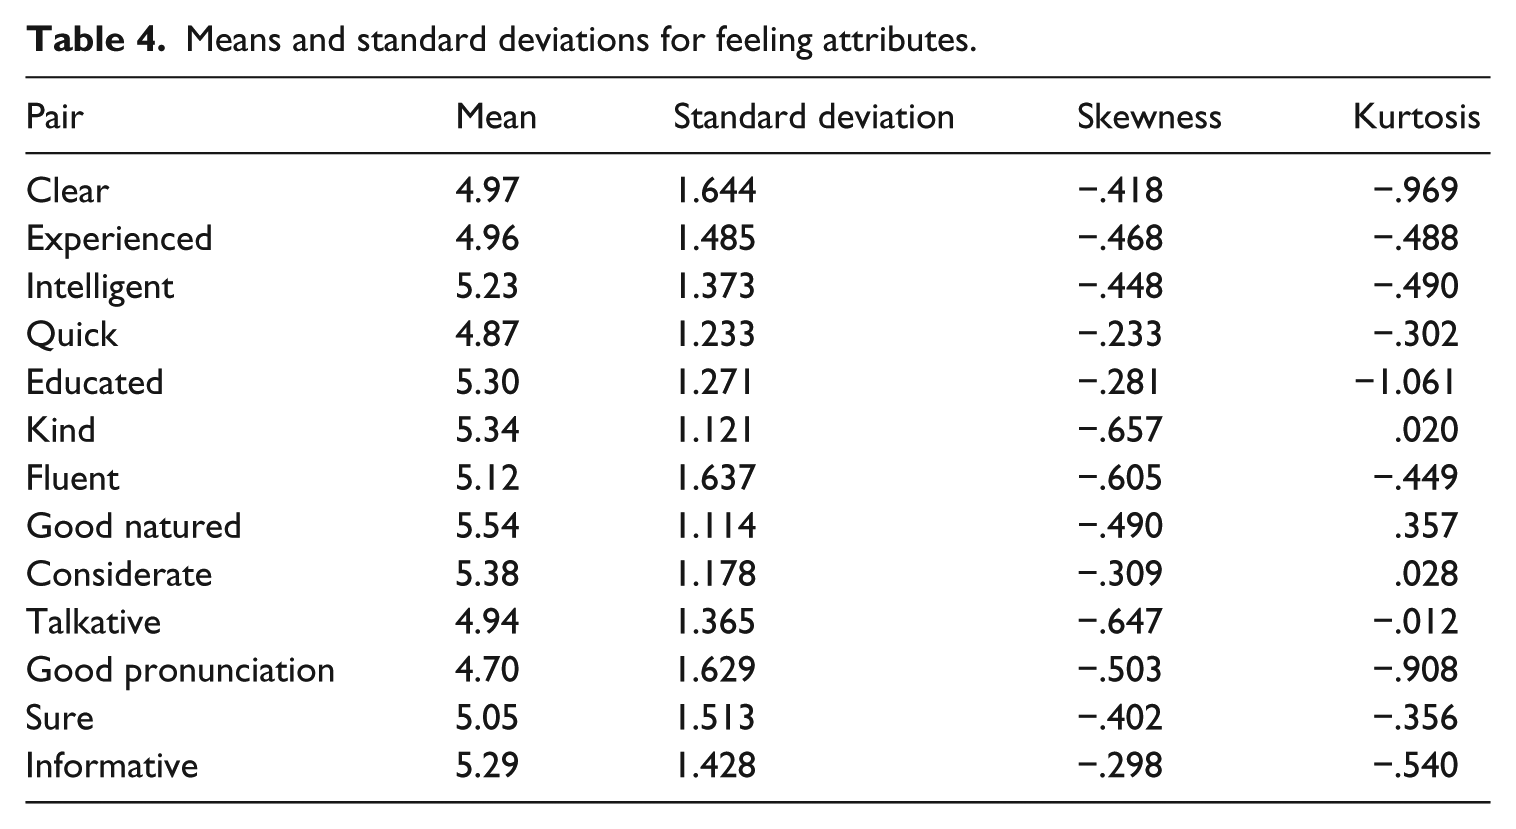
The mean, standard deviation, skewness, and kurtosis were computed (see Table 4). Note that only positive adjectives in each pair were listed in the table. The mean score was 5.13 which provided some implications of raters’ positive feelings of the Indian speakers. The assumption of univariate normality was met as shown in the skewness and kurtosis indexes.
Means and standard deviations for feeling attributes.
Cronbach’s Alpha was .904 for the semantic differential scale, well above the recommended .70 cutoff for good internal consistency reliability (de Vaus, 2002; George & Mallery, 2003).
Confirmatory factor analysis (CFA)
To further provide evidence of construct validity of the measure of rater feeling, CFA was conducted using AMOS 7.0. As the current set of data contained 36 missing values, consideration to impute the missing data was given in case the modification indices (MI) were used to improve the model fit (Byrne, 2001). The data needs to be completed without missing values in order to examine the MI. The expectation maximizing (EM) algorithm was performed to impute missing data as recommended by Schafer and Graham (2002) to minimize bias when only a small amount of missing data occurred. As a result, the full 596 sample size was retained for further CFA.
Two EFA models were evaluated by CFA. The three latent variables were the three factors identified by the previous EFA. The 13 observed variables were the items measuring rater feeling. According to the fit indices, neither model fit the data adequately. An examination of the squared multiple correlation explained that the variances accounted for by each of the 13 items revealed that two of the items, Talkative and Quick, in each model was problematic due to low variance. These two items were then removed in each model and CFAs were re-run. Table 5 provides a summary of CFA goodness-of-fit indices by analysis for the two models. The fit indices for both models show that chi-square was statistically significant for both, while other indices suggested an inadequate fit of the models to the data (Model one: χ 2 = 325.900, df = 41, p =.000; Model two: χ 2 = 198.208, df = 41, p = .000). Other fit indices were examined to determine the best model. As shown in Table 5, the fit indices for model two yielded the better model fit and met the cutoff criteria for acceptable levels.
Summary of CFA goodness-of-fit indices for the two priori models.
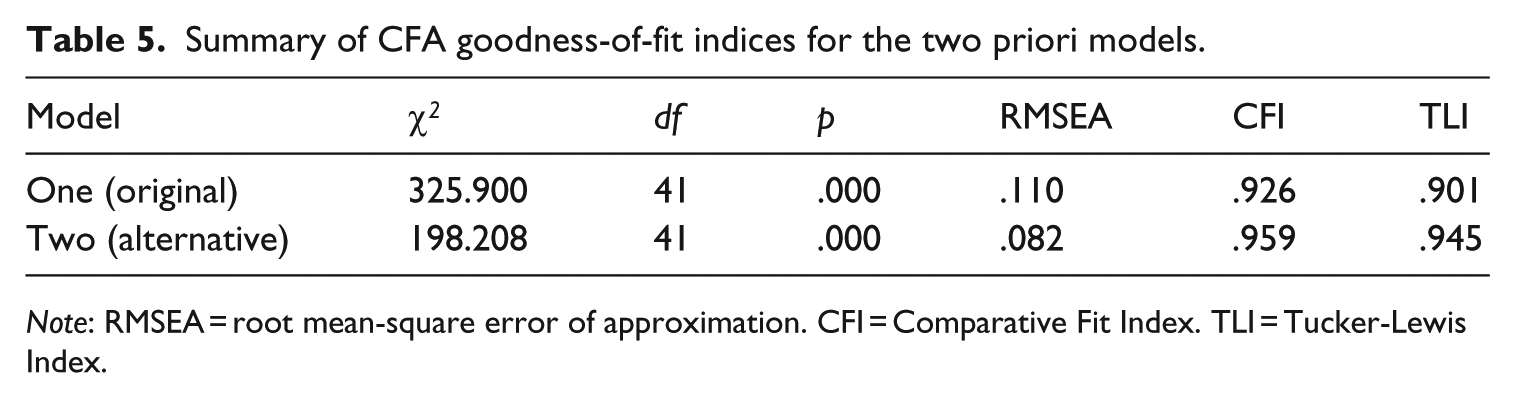
Note: RMSEA = root mean-square error of approximation. CFI = Comparative Fit Index. TLI = Tucker-Lewis Index.
The Comparative Fit Index (CFI; Bentler, 1990) value was 0.959, the TLI was 0.945, and the RMSEA of 0.082 was within the recommended range of model fit (Byrne, 2001). The chi-square difference between the two models is 127.692, indicating a significant improvement (p < .001) in model fit. Thus, the results suggest model two better fits the data.
Factor one, labeled “Speech Competency”, contained four items relevant to speech performance. Factor two was composed of three qualities related to kindness that reflected the speakers’ attractiveness for listeners, and was labeled “Kind-heartedness”. Factor three included four items related to a speaker’s intelligence, as perceived by listeners, and was thus labeled “Intelligence”.
There was moderate correlation between the three factors. The highest correlation was between “Speech Competency” and “Intelligence” (r = .899) followed by “Intelligence” and “Kind-heartedness” at a moderate .481 while the lowest was between “Speech Competency” and “Kind-heartedness” (r = .284). The factor loadings were moderately high, ranging from .624 to .937. The largest and lowest coefficients (i.e., Considerate and Kind) were presented by the two indicators concerning a speaker’s kind-heartedness.
Reliability estimate
Based on the results of the CFA, reliability analyses were run on the final 11 items. Cronbach’s Alpha for the reconstructed 11-item instrument was 0.897 versus 0.904 for the original 13 items, which is considered satisfactory.
Rater belief and rating tendency
Descriptive statistics and test of normality
Table 6 presents raters’ responses to the items. The un-ratable option is not shown here, as it constitutes a small portion of responses to each question. Eight missing data points were detected and mean substitutions used to replace them. The normality assumption using skewness and kurtosis indices were inspected. As before, the acceptable range for normality is an absolute value of skewness index lower than three, and kurtosis index absolute value lower than 10 (Kline, 2005).
Raters’ responses to Likert scale items (%).
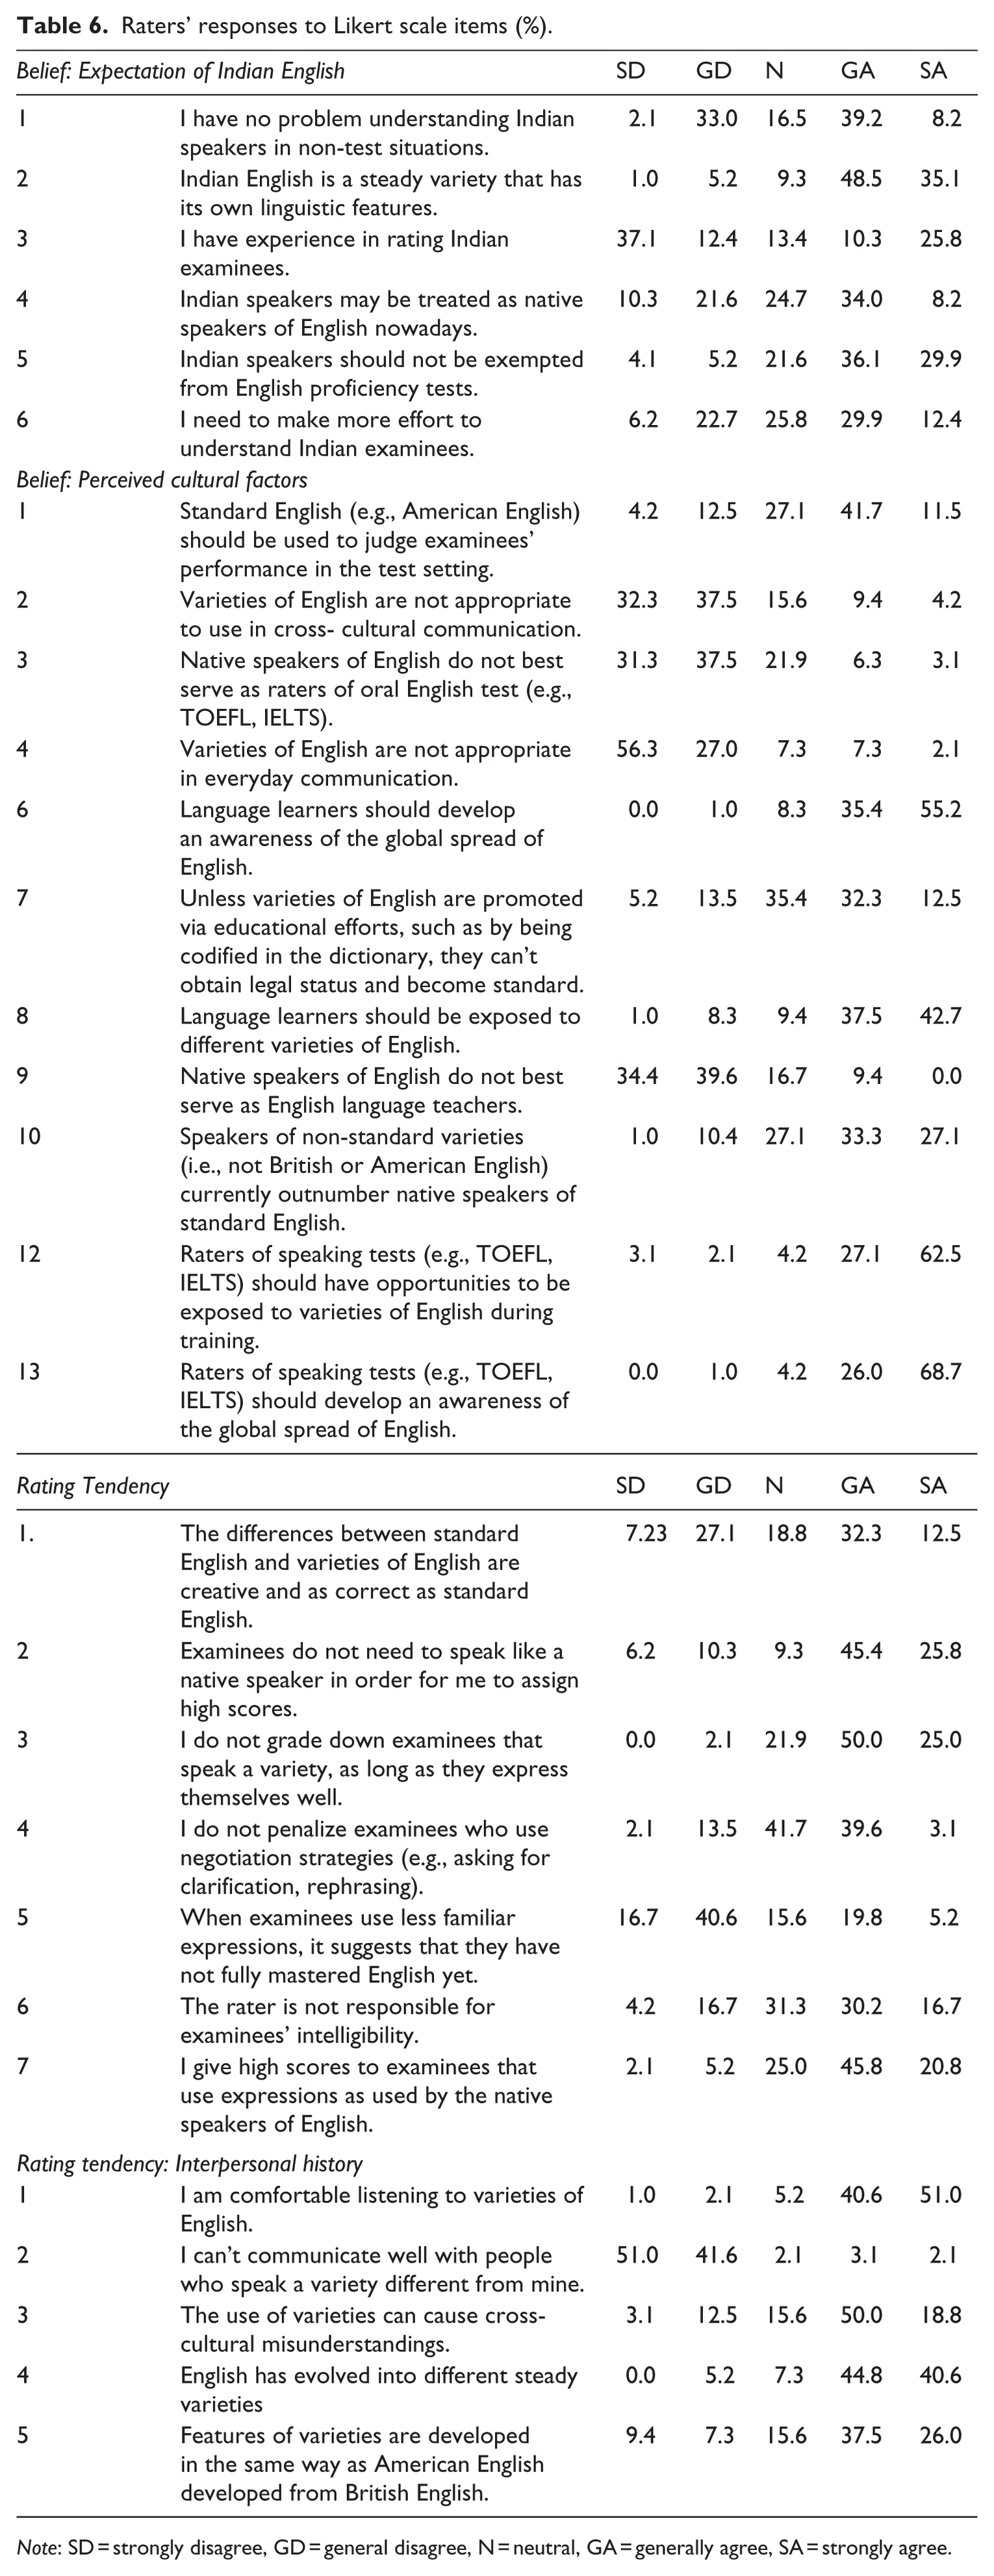
Note: SD = strongly disagree, GD = general disagree, N = neutral, GA = generally agree, SA = strongly agree.
Internal consistency
Table 7 shows the reliability estimate for the total Likert scale and each subscale. Cronbach’s Alpha of .602 for the total scale shows somewhat acceptable internal consistency of the items (de Vaus, 2002; George & Mallery, 2003).The reliability estimate for each subscale in the current phase is generally lower than in the exploratory phase, except for the last subscale, Interpersonal History, which improved from .457 to the current .518. Cronbach’s Alpha scores for other sub-scales are as follows: Expectation of Indian English (.474), Perceived Cultural Factor (.383), and Rating Tendency (.361). Reasons for low reliability were most likely the small number of items in the current sections. Other potential reasons could be the wider range of difficulty of items (Symonds, 1928). In the current study, this could be explained by the fact that raters’ beliefs in WE and rating tendency greatly differed from each other, which led to low reliability. To improve internal consistency, the “alphas of items deleted” was checked, which suggested that removing item 24 would improve the alpha to .628 for the total scale. Thus, this item was discarded.
Reliability coefficients.
Establishing a confirmatory factor model for RAI
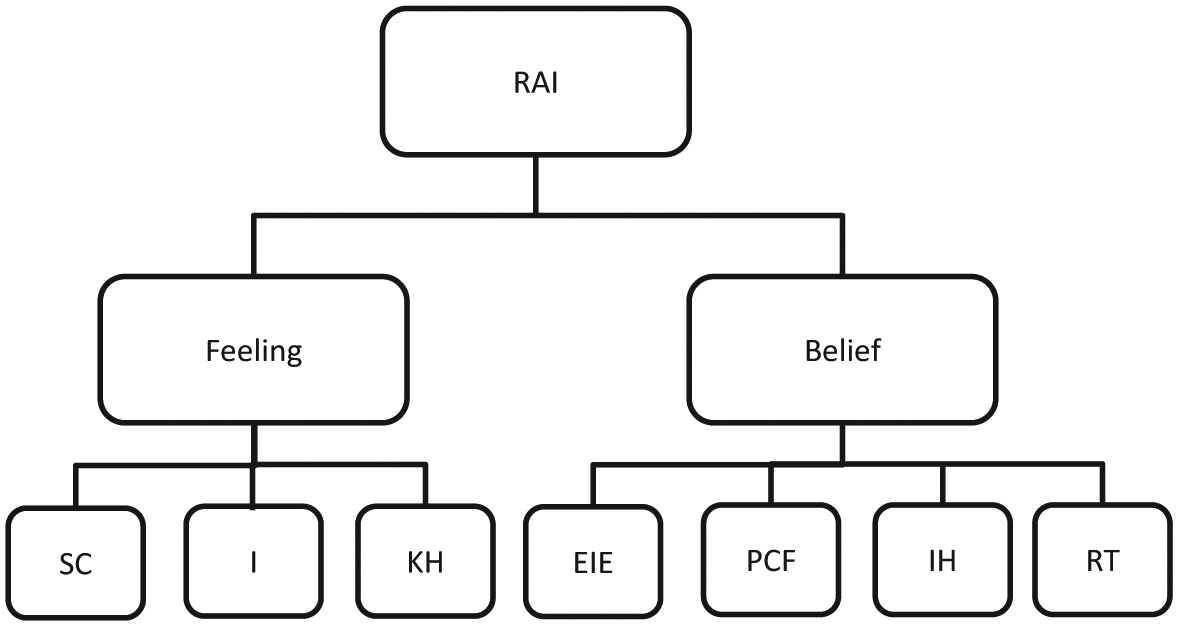
Up to this phase, the construction and data analysis for the RAI were conducted in separate measures representing different dimensions of the attitude constructs. Attempts were made to bring the conceptualized three-dimensional structure of the RAI together and evaluate whether a confirmatory factor model could be established. Towards this end, the minimum number as required to perform CFA needs to be satisfied (Bryne, 2001). The current two measures that constitute the RAI include scores deriving from the two different point scales and need to be standardized to ensure that observations can be compared on a like basis. As such, summated subscale scores were used where each subscale was treated as an indicator (e.g., perceived cultural factor) and the three conceptualized components of attitude construct were treated as latent factors (e.g., belief).This resulted in seven indicators for 96 observations, which is close to the minimum sample size requirement for running factor analysis (MacCallum, Widaman, Zhang, & Hong, 1999). The conceptualized RAI model can be visualized in Figure 1. Next, all subscale scores were standardized by dividing them with their respective perfect scores and multiplied by 100 to yield the proportional scores. Then the weight of each conceptualized tripartite attitude component was added by allocating one-third of the total RAI score. The following equation shows how each rater’s RAI score was calculated:

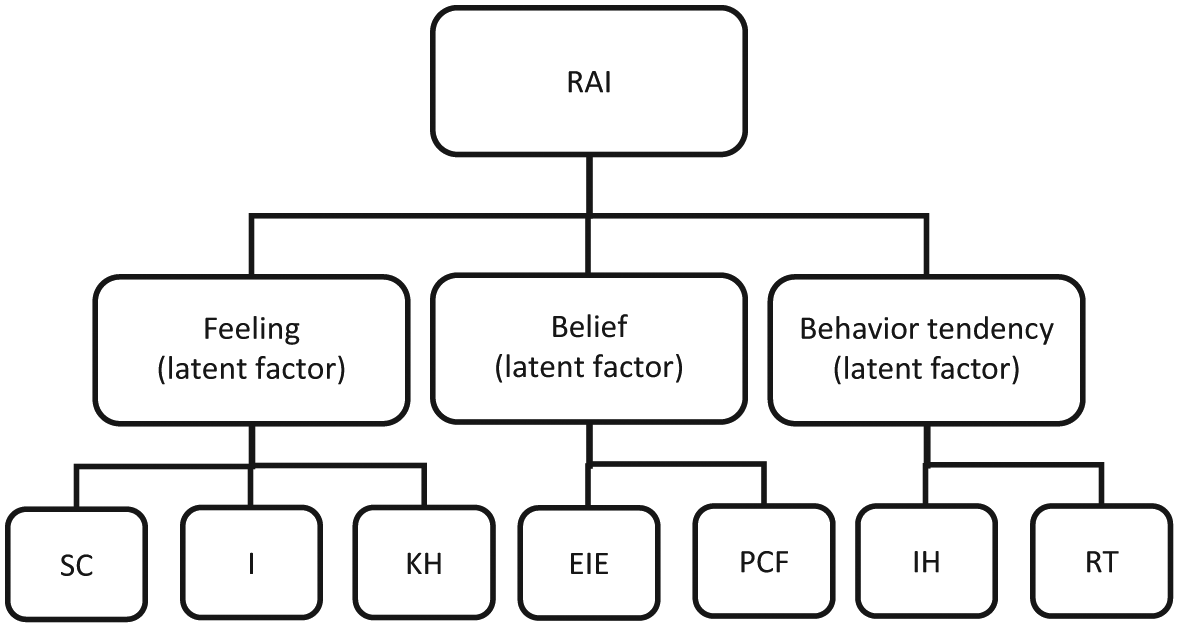
A hypothetical three-factor model of the RAI.
CFA was conducted using AMOS 6.0. As shown in Table 8, all the indices indicate that the model did not fit the data well (see recommendations in Hu & Bentler, 1999). Inspection of the modification indexes, standardized residuals, and factor loadings indicated that a better fit could be obtained by allowing one error covariance (i.e., expectation of Indian English and interpersonal history) to be correlated. The fit indices improved significantly (χ2 = 16.559, p = .167, RMSEA = 0.063, CFI = 0.968, TLI = 0.944) leading the data to better fit into the model.
Goodness-of-fit indices for one-, two-, and three-factor measurement models before vs. after modification.
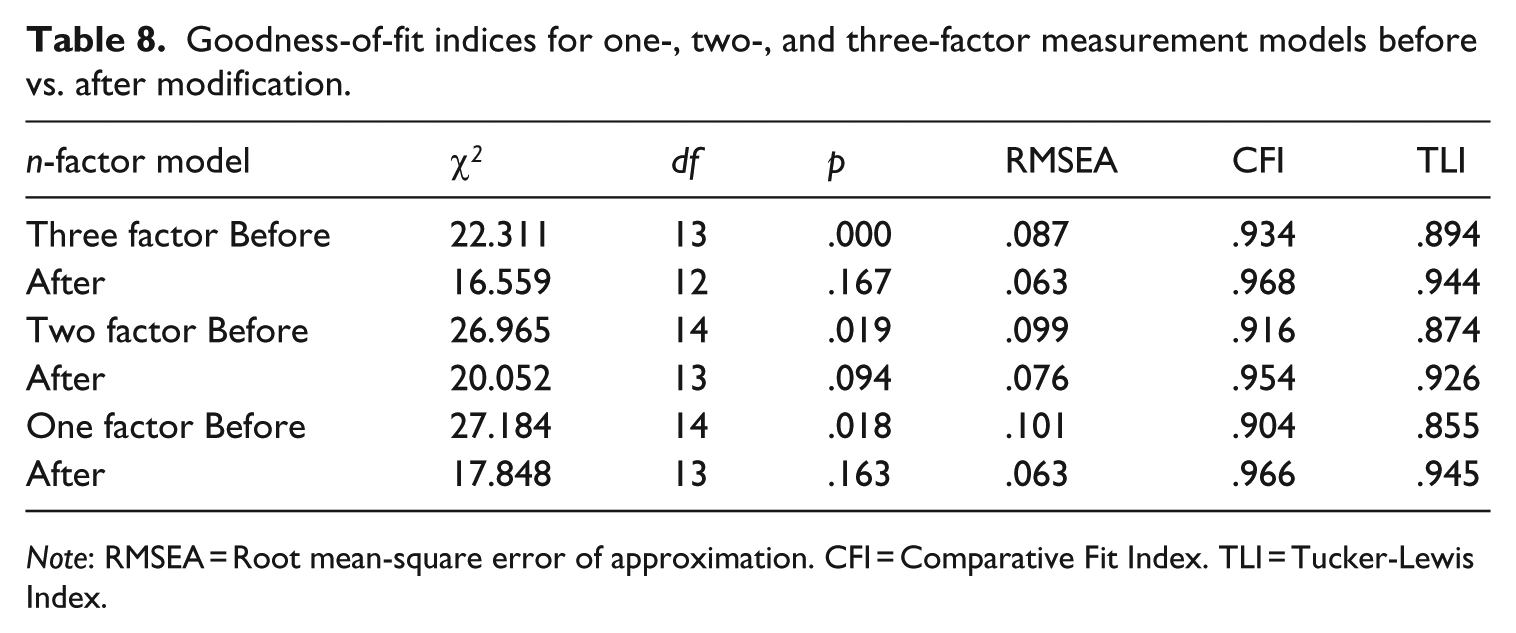
Note: RMSEA = Root mean-square error of approximation. CFI = Comparative Fit Index. TLI = Tucker-Lewis Index.
However, the correlation between belief and rating tendency was strong (r = .925), suggesting these two factors may actually be represented by a single factor. As such, the two-factor model was tested, placing “rater belief” and “rating tendency” together as one latent factor. Raters’ RAI composite scores were re-calculated by weighing each latent factor equally and applying the equation below:

The initial fit statistics for the two-factor model did not meet the standards of a well-fitting model. A modest, though not significant, improvement on fit indices was obtained by correlating the error covariance (i.e., expectation of Indian English and interpersonal history) (χ 2 = 20.052, p = .094, RMSEA = 0.076, CFI = 0.954, TLI = 0.926). The factor loadings of indicators on latent factor of feeling were strong, ranging from .750 (i.e., kind-heartedness) to .932 (level of confidence). Other factor loadings were either low or moderate, with the last indicator, interpersonal history, loading negatively on its respective latent factor. The factor correlation between two latent factors was .164.
Before determining the best model fit, an attempt was made to seek the feasibility of a one-factor measurement model because literature in attitude research also proposes one dimension of attitude construct. The initial fit statistics for the one-factor model was not considered a good fit. An acceptable fit value was obtained after model modification (χ2 = 17.848, p = .163; CFI = .966; TLI = .945; RMSEA = .063). The factor loading of each indicator after modification on its respective factor ranged from −0.197 (expectation of Indian English) to 0.922 (level of confidence). Two negative factor loadings apparently add to the difficulty in interpreting the relationship between the latent factor and indicators.
To determine the best model that fit the data, the χ2 difference test was conducted between each of the two models. This yielded critical values on and above 0.062, suggesting that none of the models provides a significantly best fit to the data. Thus, the selection of the best model had to be determined according to interpretability. The three-factor measurement model established the conceptualized tripartite attitude construct into a confirmatory factor model. All indicators had moderate to strong factor loadings on their respective primary factor. The factor correlation between two of the factors, belief and rating tendency, however, was very high, suggesting the factor overlap, an indication that the items in these two factors may need revision to avoid duplication. In terms of the one-factor model, the results of analysis support the literature of unified attitude construct. Nevertheless, the CFA results suggest the presence of indicators (i.e., Expectation of Indian English and Perceived Cultural Factor) loaded negatively on the latent factor, which may cause interpretation difficulty. The two-factor model supports the multi-dimensional attitude construct, while avoiding factor redundancy, as shown in the three-factor model. Thus, in comparing the three models, the two-factor measurement model appears to best represent the constructs of rater attitude towards WE for the current data set (see Figure 2).
Measurement structure of the RAI.
Discussion and implications
The RAI is an empirically and theoretically grounded means of self-measuring a rater attitude towards Indian English and WE in general. Evidence from psychometric analysis of data supports a two-factor rater attitude measurement model that includes the two dimensions of rater feeling and rater belief. As such, the objective of identifying and establishing a psychometrically driven structure of rater attitude model within the language assessment context was achieved. The RAI represents a new initiative to examine raters’ psychological traits as a source of validity evidence in English speaking tests to strengthen arguments about Indian test-takers’ English language proficiency. Furthermore, the RAI appears to hold the potential of research and diagnostic utility for testing agencies and professionals interested in monitoring and evaluating attitudes held by raters of oral tests and to uncover whether the attitude–behavior tendency relationship, as attested in language attitude literature, is held true in the testing situation by comparing raters’ RAI and actual rating scores to Indian test-takers. The finding may be used to guide the design for the rater training program.
The RAI results reveal complexities of the relevance of WE to English oral tests. Although a general pattern emerging from the data showed raters’ endorsing linguistic diversity, raters’ preferences on norm selection, one of the controversial issues in WE and LT literature, do not reveal a clear pattern (i.e., Belief: PCF1 of the RAI). Slightly more than half of the raters (53.2%) indicate a preference of standard English to judge test-takers’ spoken English, and nearly one-third of the respondents (27.1%) express uncertainty about this selection. Raters’ preference skewed towards standard English resonates with recent literature about test-takers’ attitudes towards WE (Abeywickrama, 2013; Gu & So, 2014; Hamid, 2014). On the other hand, a dominant portion (71.2%) shows raters’ rating tendency or decisions are not based on the extent to which test-takers speak like a native speaker (i.e., Rating Tendency 2 of the RAI), and raters do not grade down test-takers who speak varieties providing they express themselves well (75%). The contrasting finding is similar to the behavioral paradox in language revitalization, due to a mismatch between ideology and practice commitment (Eggington, 2010). That is, one may feel obliged to do something (i.e., preference for standard English), but do the opposite in practice (i.e., a rating that does not follow native speaker norms).
Similar to test-takers’ concerns about being disadvantaged if non-standard varieties are used in the test due to unfamiliarity, raters’ preference of standard English may be attributed to their unfamiliarity with varieties leading to uncertainty in scoring decision. For monologue tasks, allowing varieties gives raters no opportunities to clarify questionable responses. Tasks that require interlocutor and test-taker interaction may suggest a more active involvement and greater listener effort in negotiating intended meanings (Canagarajah, 2006; Elder & Davies, 2006; Jenkins, 2006). To what extent a fair scoring result can be achieved challenges, therefore, interlocutors’ willingness and interviewing styles to engage in meaningful interaction, which may affect test-takers’ performances and scores. Raters’ preferences for standard English may be explained by their concern for fairness in scoring, which is less about dynamic negotiation, but more about comparing the discrepancy between the native speaker model and test-taker performance. Another factor put forth by Elder and Harding (2008) concerning the appeal of standard English among stakeholders is the widely held perception that standard English is more prestigious for teaching and testing purposes.
In contrast, raters’ tendencies as revealed in the RAI, indicating test-takers’ successful communication and task fulfillment regardless of varieties seem an underlying factor for the scoring decision. This is consistent with ELF’s proposition that one needs negotiation skills “to shuttle between different varieties of English and different speech communities” (Canagarajah, 2006, p. 233). Some ELF literature has documented that speakers’ communication and negotiation strategies in simulated conversational or telephone data (House, 2003) resort to topic changes or “let-it-pass principle” on the assumption that misunderstanding does not impede the ongoing and successful conversation. Further research may explore whether these strategies are applicable to raters in the testing situation and, if so, what linguistic and non-linguistic features are “passed” and what features are decisive in scoring decisions. This will help testing communities understand how much varietal features impact oral test scores, how English oral proficiency should be defined in response to the TLU domain in a new geopolitical context, and whether the norm selection debate is held relevant in English oral tests when test-takers’ communication strategies are endorsed by raters.
In terms of the RAI structure, further item modification on the five-point Likert scale measuring rater belief may be needed to increase validity of the RAI. Following the common practice of scale construction, more items than currently remain could be deleted owing to low alpha. Nevertheless, being among the first instruments to measure rater attitude towards Indian English and WE in general in language assessments, the RAI aims for comprehensiveness of concerns addressed by raters, testing professionals and the literature. Newton and Asimakopoulou (2009) argue that “measures of internal consistency give information on reliability, not validity” (p. 580). As such, items that covered the different dimensions of rater attitude constructs were not sacrificed as a result of internal consistency checks. On the contrary, the low alpha in the sections provides valuable indications of rater uncertainty about the questions, and shows the need for further study to unveil related issues.
The two-factor rater attitude measurement model has valuable implications. First, the dimension of rater feeling presents a mix of consistent and contradictory findings to previous language attitude research. Factor two, “Kind-Heartedness”, is in many ways similar to other language attitude studies (Carranza & Ryan, 1975; Ryan, Carranza, & Moffie, 1977) displaying overlapping items. It suggests the concern of raters for the attractiveness of speakers, leading to a broader dimension of evaluating the quality of speech. The third factor, Intelligence, includes items from Zahn and Hopper’s (1985) superiority factor, and consists of elements such as “educated”, and “experienced”, and display rater perception of a speaker’s social status and intellectual achievement. This factor was well correlated (r = .899) with the first factor, “Speech Competency”, suggesting that it is aligned with raters’ feelings towards the level of education of test-takers.
Some results that contrasted with previous language attitude research were observed. Traits in factor one, “Speech Competency”, and factor three, “Intelligence”, labeled as “Superiority” in Zahn and Hopper (1985) are linked to the standard variety in the previous study. Nevertheless, these two factors were rated favorably in the current study when Indian English was used as a stimulus. These contrasting findings may be attributed to two reasons. First, as opposed to the predominant use of undergraduate students in language attitude study, this study involved raters of ESL/EFL teachers who may have greater awareness of WE. Second, most raters were located in metropolitan areas with greater exposure to diverse language learners. Both may lead to more accepting views and feelings towards test-takers of Indian English. To consolidate the current findings, contrasting varieties between outer- and expanding-circle varieties may be used simultaneously to compare responses to traits related to standard and “non-standard” variety, as claimed by previous attitude studies.
Limitations and implications for future research
The choice of stimulus is among the limitations of this study. As only Indian English was used, the results need to be interpreted with caution, as they may not apply to attitudes towards test-takers of other WE varieties, although items relevant to Indian English constitute a small portion of the RAI. Extending the current study using alternative stimuli, such as single outer- or expanding-circle varieties or a combination, would also provide insights into the generalizability of these findings. Another limitation is the role descriptive tasks as an elicitation stimulus of rater attitude and rating performance. Given that task types may affect test scores (Chalhoub-Deville, 1995; Iwashita, McNamara, & Elder, 2001; Wigglesworth, 2001), further research may focus on interaction-oriented speech tasks or a combination of different task types to seek comparable results and broaden understanding of how test-takers’ communication strategies are perceived in relation to raters’ attitude towards WE and, most importantly, to what extent that attitude matters in the scores awarded. This will also clarify whether the interaction strategies as highlighted in the cross-cultural communication by WE researchers are indeed relevant in the testing situation.
Footnotes
Acknowledgements
This paper is based on my PhD dissertation, completed at University of Illinois at Urbana-Champaign. I would like to thank the dissertation advisor, Fred Davidson for his guidance and support throughout the study. I would also like to thank Nick Saville, Gad Lim, April Ginther and Berlitz International Incorporated who helped facilitate the data collection process, and the two anonymous reviewers for LT who made insightful and useful comments.
Declaration of Conflicting Interests
The author(s) declared no potential conflicts of interest with respect to the research, authorship, and/or publication of this article.
Funding
The author(s) disclosed receipt of the following financial support for the research, authorship, and/or publication of this article: This work was funded by TOEFL small grants for doctoral research in second or foreign language assessment, Educational Testing Service, in 2010.