
Abstract
Language proficiency constitutes a crucial barrier for prospective international teaching assistants (ITAs). Many US universities administer screening tests to ensure that ITAs possess the required academic oral English proficiency for their TA duties. Such ITA screening tests often elicit a sample of spoken English, which is evaluated in terms of multiple aspects by trained raters. In this light, ITA screening tests provide an advantageous context in which to gather rich information about test taker performances. This study introduces a systematic way of extracting meaningful information for major stakeholders from an ITA screening test administered at a US university. In particular, this study illustrates how academic oral English proficiency profiles can be identified based on test takers’ subscale score patterns, and discusses how the resulting profiles can be used as feedback for ITA training and screening policy makers, the ITA training program of the university, ESL instructors, and test takers. The proficiency profiles were identified using finite mixture modeling based on the subscale scores of 960 test takers. The modeling results suggested seven profile groups. These groups were interpreted and labeled based on the characteristic subscale score patterns of their members. The implications of the results are discussed, with the main focus on how such information can help ITA policy makers, the ITA training program, ESL instructors, and test takers make important decisions.
Keywords
Introduction
Background
The steady increase of the number of international teaching assistants (ITAs) in US universities over the past several decades (Borjas, 2005; Constantinides, 1987; Elder & Read, 2015; Rounds, 1987) was met with predominantly negative reactions from major stakeholders, including American-born undergraduates and their parents, faculty members, and even ITAs themselves (e.g., Bailey, 1984; Fox & Geneva, 1994; Mestenhauser, 1981; Nelson, 1991; Rubin & Smith, 1990). Central to this negative reception was the concern about the adequacy of ITAs’ academic oral English proficiency (Bresnahan & Kim, 1993; Hendel et al., 1993; Hinofotis & Bailey, 1981). To address this concern, universities with a large number of ITAs institutionalized training and screening procedures to assure that ITAs possess a minimum level of academic oral English proficiency (Ginther, 2003). English as a Second Language (ESL) classes have assumed the training role (Bauer & Tanner, 1994), while mandatory oral proficiency tests have been put into practice to screen out international graduate students who do not meet the required English proficiency standards (Briggs, 1994; Johncock, 1991, Plough, Briggs, & van Bonn, 2010).
English oral proficiency tests for prospective ITAs often elicit a sample of spoken English from test takers under simulated classroom contexts (Plough et al., 2010; Schmidgall, 2013). Test taker performance is then evaluated on multiple subscales, such as grammatical accuracy and pronunciation, by trained raters (Briggs, 1994; Farnsworth, 2004). In this light, ITA tests provide an advantageous context in terms of generating rich information for ITA training. This formative potential of ITA testing results has attracted the interest of researchers and teachers, and some institutions provide test takers with an opportunity to obtain additional feedback. For example, at Purdue University, prospective ITAs who are placed into an ESL course based on their ITA test results discuss their test performance with ESL instructors in an individual session (Elder & Read, 2015). Prospective ITAs at the University of California, Los Angeles (UCLA) can request a similar individual review session with ITA test coordinators, and many of those who came in for the review session evaluated their experience favorably (Schmidgall, 2012).
This study attempts to advance the formative use of ITA test results by introducing a systematic way of extracting academic oral English proficiency profiles of prospective ITAs. In particular, this study presents how the profile information can be obtained from recurring patterns of subscale scores on an ITA test. Proficiency profiles based on subscale scores have considerable potential as valuable feedback to major stakeholders, including ITA training and screening policy makers, ITA training programs, ESL instructors, and test takers. Identification of prevalent subscale score profiles and their alignment with test decisions can provide an empirical means of evaluating the current standards and policies for ITA training and screening. ITA training programs can use such feedback to identify aspects of academic oral English proficiency that a large number of test takers need to improve, and to locate available resources towards those aspects. ESL instructors can use similar information to improve and focus their teaching, and test takers can benefit from knowing which aspects of academic oral English proficiency they need to (or can) improve.
Purpose of the study
This study aims to extract test taker proficiency profiles based on the subscale scores of an ITA screening test to provide meaningful feedback to major stakeholders. The identification of test taker profiles is illustrated using an ITA screening test developed by and used at UCLA. Shared subscale score patterns in the test will be clustered and interpreted to yield meaningful profiles of academic oral English proficiency. To achieve a thorough understanding of the resulting profiles, decision categories of test takers classified into different profile groups will also be examined and compared across different groups. In sum, this study aims to answer the following research question:
What different subscale score profiles of academic English oral proficiency can be meaningfully produced by an ITA screening test?
Review of literature
ITA training and screening
ESL courses have played a central role in university ITA training programs (Kaufman & Brownworth, 2006). A large number of ITA training programs began with an emphasis on pronunciation, especially on accent reduction at the individual phoneme level (Bauer & Tanner, 1994; Kaplan, 1989; Smith, Byrd, Nelson, Barret, & Constantinides, 1992). As researchers realized that accent reduction at the segmental level alone could not guarantee satisfying results (e.g., Derwing, 2008), ITA training programs have diversified to include other components of oral English proficiency into their curricula, such as suprasegmental features (e.g., Anderson-Hsieh, 1990), vocabulary use (e.g., Rubin, 1993; Tanner, Selfe, & Wiegand, 1993; vom Saal, Miles, & McGraw, 1988) and pragmatic knowledge (e.g., Davies, Tyler, & Koran, 2002; Jenkins, 1997). Some programs have further expanded to address non-linguistic components, including American cultural knowledge (e.g., Althen, 1991) and familiarity with the daily lives of typical undergraduate students (e.g., Jia & Bergerson, 2008).
In addition to the ITA training component, a number of universities administer a screening test for prospective ITAs. Most early ITA screening tests took the form of a standardized English proficiency test (e.g., Dunn & Constantinides, 1991; Johncock, 1991). However, owing to their failure to engage directly with academic oral English proficiency (Bier & Friedman, 1982), many universities employed the Speaking Proficiency English Assessment Kit (SPEAK), a locally administered, semi-direct oral proficiency test provided by Educational Testing Service (ETS). Ginther (2003) provides a detailed account of the introduction and use of the SPEAK test in US universities. Other universities internally developed their own ITA screening test (see, e.g., Briggs, 1994; Douglas, 2000; Ginther & Prasad, 2002), which often involve a simulation of a lecture or classroom discussion (Bailey, 1985; Briggs, 1994; Plakans & Abraham, 1990). The discontinuation of the support for the SPEAK test further accelerated the development of internal ITA screening tests. Early surveys of internally developed ITA screening tests reported that these tests typically utilize multiple raters and analytic scoring methods (Bauer & Tanner, 1994; Johncock, 1991). Schmidgall’s (2013) recent survey of 29 university ITA programs showed that simulation tasks continue to be the predominant choice among internally developed ITA screening tests, and test taker performances elicited from the simulation tasks are often evaluated from multiple angles, including pronunciation, vocabulary, grammar, organization, and interactive aspects such as question handling, all of which are directly relevant to communications in classroom settings.
Professionals involved in ITA training have requested research-based approaches towards ITA development. Tapper and Kidder (2006) recommended that researchers and practitioners rely on empirical evidence gathered through research in the design and implementation ITA training programs. Similar suggestions are also offered by Gorsuch (2006) and Papajohn (2006). There have been a number of empirical investigations on various aspects of ITA screening tests, such as test development (e.g., Douglas, 2000; Farnsworth, 2004), rating criteria (Hsieh, 2011; Plough et al., 2010), and relationships with standardized tests (Xi, 2007). However, prior research on ITA tests has seldom focused on recurring patterns of subscale score profiles across a large number of test takers. This is an unfortunate research gap considering the direct relevance of ITA screening test subscales to classroom settings.
Profiles of ITAs’ English oral proficiency
The idea of utilizing test results for improving learning is certainly not new. The main tenet of formative assessment centers on the idea that test results could, and perhaps should, function as feedback to improve learning (see, e.g., Black & William, 1998 for a comprehensive review). The increasing interest in diagnostic assessment (see, e.g., Bejar, 1984) is also closely related to the idea of utilizing test results to enhance learning. The focus of diagnostic assessment has been identifying different profiles of skill mastery observed across learners (Bejar, 1984). By providing the skill mastery information, users of diagnostic assessment aim to give learners more contextualized and beneficial feedback and input.
The important first step in extracting profile information from test results is to decide on the components of the profile. For an ITA screening test, the decision could be made based upon theoretical and empirical models of second language oral proficiency in an academic context. While different models of second language oral proficiency exist (e.g., Bachman & Palmer, 2010; Foster, Tonkyn, & Wigglesworth, 2000; Iwashita, Brown, McNamara, & O’Hagan, 2008; Poehner, 2008), they all appear to agree on one issue: that second language oral proficiency consists of multiple components. While not all of the existing models explicitly discuss the relationships among multiple components of language proficiency, it is reasonable to conjecture that different learners possess different profiles in terms of different language proficiency components. Indeed, different profiles of language learners have attracted the interests of a number of second language acquisition researchers (see, e.g., Gibbons, 1984; Kagan, 2005; Weissberg, 2000).
Pronunciation has been one of the most popular research areas on ITAs’ academic oral English proficiency. Pickering (2001, 2004) has reported evidence of a strong relationship between ITAs’ pronunciation skills and their effectiveness. Given the interactive nature of oral communication (Kachru, 2008; Smith & Nelson, 1985), researchers have focused on how pronunciation impacts the cognitive load of listeners required to process and comprehend ITAs’ speech. This cognitive load, or difficulty, has been conceptualized in relation to intelligibility and comprehensibility. However, the definition of intelligibility and comprehensibility varies across researchers and studies (see, e.g., Coetzee-Van Rooy, 2009; Kennedy & Trofimovich, 2008) without a clear consensus (Isaacs, 2008). Levis (2006) distinguishes narrow and broad definitions of intelligibility, and observes that the broad definition of intelligibility concurs with the meaning of comprehensibility; both can be broadly conceptualized as whether a listener can understand a speaker’s message (Levis, 2006; Munro & Derwing, 1999). The relationship between ITAs’ pronunciation and their comprehensibility in this broad sense has been investigated from multiple angles. Isaacs (2008) shows that undergraduate students’ judgment on whether a nonnative speaker’s pronunciation is good enough for a TA is highly correlated with his or her overall comprehensibility judgment. McGregor’s (2007) investigation reveals a positive correlation between phonological aspects of ITAs’ speech and their perceived comprehensibility. The perceived comprehensibility of ITAs is also found to be correlated with suprasegmental features (Hahn, 2004; Kang, 2010; Kang, Rubin, & Pickering 2010). In addition to pronunciation, spoken English grammar has been another difficult area for ITAs to master. Ard (1989) suggested the lack of grammatical competence as an important issue that can cause communication breakdowns between ITAs and undergraduates students. Salomone (1998) reported how ITAs’ concern about their spoken English grammar influenced their communication with undergraduate students.
Other components of ITAs’ academic oral English proficiency that have attracted researchers’ attention include organization skills and question-handling skills. Researchers have found a strong positive relationship between the comprehensibility of academic lectures and the use of organization markers, lexical ties, and cohesiveness (e.g., Douglas & Myers, 1989; Flowerdew & Tauroza, 1995; Rounds, 1987; Tyler, 1992). The lack of proper organization in ITA speech could impede undergraduate students’ understanding of substantive materials (Duerksen, 1994; Tyler, 1992; Williams, 1994). Furthermore, the distinction between comprehension and production is also relevant to the ITA context. For example, one’s use of communication strategies could compensate for one’s lack of comprehension (Douglas & Myers, 1989). This discrepancy could be addressed by real-time communication such as the question-and-answer class format. Indeed, studies have shown that ITAs could lack proper understanding of the questions, which would ultimately result in frustration for undergraduates (e.g., Chiang, 2009).
Taken together, research investigating different components of language proficiency suggests that ITAs could possess different profiles of academic oral English proficiency in terms of pronunciation, grammar, organization, and question handling. Some ITAs could be regarded as proficient in grammar and organization but lacking intelligibility, while others might display proper organization in their speech but suffer from comprehension problems that could impede communication. These different profiles, then, could play an important role in deciding the types of courses to which an ITA program allocates its resources. For example, if a number of prospective ITAs are proficient in pronunciation but not in organization, offering many ESL courses focusing on phoneme distinctions in the target language may not be effective. The effectiveness and efficiency of instruction and training for ITAs is an important concern given the costs incurred by the host institution and the heavy course load that graduate students have (Hoekje & Williams, 1992; Sequeira & Costantino, 1989). Therefore, enhancing ITA training by utilizing the learner profile information is a desirable and worthwhile objective.
Statistical approaches to obtaining profile information
Statistical models have provided methodological tools for extracting language skill profiles based on information obtained from test administrations. A popular psychometric approach to extracting profile information has utilized a class of restricted latent class models, often called cognitive diagnostic assessment (CDA) models (Leighton & Gierl, 2007). CDA models have provided useful methodological tools for language testing researchers and practitioners who aim to yield skill profile information based on test results (e.g., Jang, 2009; Kim, 2011; Li & Suen, 2013). However, the identification of a CDA model requires a number of items measuring a small number of latent skills. Unfortunately, this is not normally satisfied in most performance assessment situations in which a relatively small number of tasks engage a number of different skills (Luoma, 2004; Weigle, 2002). In addition, skills required for each task are often difficult to specify. These contextual elements of language performance assessments make it difficult to utilize CDA models to obtain skill profiles.
Finite mixture (FM) modeling provides a general and flexible tool for extracting profiles. FM models assume that the data under study consist of heterogeneous groups from different population distributions (McLachlan & Peel, 2000). The main goal of FM models is to estimate the proportion of each group in the data as well as parameters of each group’s population distribution (called the component distribution). For example, if one suspects that the data consist of a mixture of two normal distributions with different means and variances, FM models can be applied to estimate the mean and variance for each component distribution and the proportion of the two component distributions in the data. Therefore, parameters of general FM models include the parameters of each component distribution and the proportion of each component distribution.
FM models share similar objectives with traditional cluster analysis techniques when the main goal is to decompose the data into clusters of homogeneous subgroups. In this light, FM models can be viewed as a type of cluster analysis (Everitt, Landau, Leese, & Stahl, 2011). A crucial feature of FM models that distinguishes them from traditional cluster analysis models is their parametric nature. That is, FM models assume that each component distribution follows a known mathematical distribution. On the other hand, traditional cluster analysis techniques often do not impose a parametric form for each cluster and rely upon distance functions to identify clusters. (For a detailed account of clustering techniques, see Everitt et al., 2011.) FM models are widely used to identify and describe subgroups in a variety of disciplines including medicine (e.g., Schlattmann, 2009), marketing (e.g., Wedel & DeSarbo, 2002), and political science (e.g., Hill & Kriesi, 2001).
Methodology
Test of Oral Proficiency
At UCLA, an internally developed oral proficiency test, called the Test of Oral Proficiency (TOP), has been administered for the purpose of securing minimum oral English proficiency for ITAs since 2004. The TOP consists of two tasks, both of which are rated live by two raters according to four subscales: Pronunciation, Lexical Grammar, Rhetorical Organization, and Question Handling. The scoring rubric for these subscales is in the Appendix. Two trained undergraduate “questioners” are also present in test rooms to ask questions of and to interact with test takers. There are three decision categories: Pass, Fail, and Provisional Pass. The decision is made based on a weighted average of the four subscale scores, namely the total score. In order for an international graduate student to start working as a TA without any restriction, he or she needs to pass the test. When a test taker fails the test, he or she cannot start working as a TA until the TOP is retaken, and the test taker (provisionally) passes the test. Test takers whose scores correspond to the Provisional Pass decision are allowed to work as a TA under the condition that they take any remedial ESL oral skills class of their choosing. UCLA offers four remedial ESL oral skills courses, each of which has a different focus of instruction. Two courses are designed to improve English segmental and suprasegmental pronunciation, respectively. The other two courses focus on communication strategies (e.g., comprehension checks, handling questions) and presentation skills (e.g., organization of presentation, discussion leading), respectively. For now, international students, including Provisionally Passed and Failed TOP test takers, do not receive any systematic guidance regarding the selection of ESL oral skills courses. While the test yields scores for all four subscales, only the total score and the corresponding decision category are reported to test takers. Little information is given to the ESL program that is responsible for offering the remedial ESL courses or ESL instructors who teach those courses.
Participants
From the introduction of the TOP in 2004 to the end of the academic year 2011–2012, a total of 2450 tests were administered. Out of these, this study utilized the subscale scores of 960 test takers that were selected according to the following procedures. For test takers who took the test more than once, only the scores on the first attempt were used in the analysis, since all other test takers’ scores were obtained from their first attempt. The remaining data were further filtered in terms of assigned raters. The TOP program recruits raters among graduate students with a language teaching background. Selected graduate students go through intensive training sessions to learn how to use the TOP scoring rubrics, after which they receive additional training from experienced raters while observing live testing sessions. Raters are paid $30 per rating hour by the TOP program. Since the introduction of the TOP, 56 trained graduate students have served as raters. However, 38 of the 56 raters only rated a small number of test takers during a limited period. The remaining18 raters were selected for this study. Different pairings of these 18 raters were considered, and test takers who were assigned to rater pairs who rated at least five test takers together were included in the analysis. This additional filtering based on assigned raters was to obtain stable subscale score estimates using an item response theory (IRT) model, which will be described later.
Test taker language background and decision categories
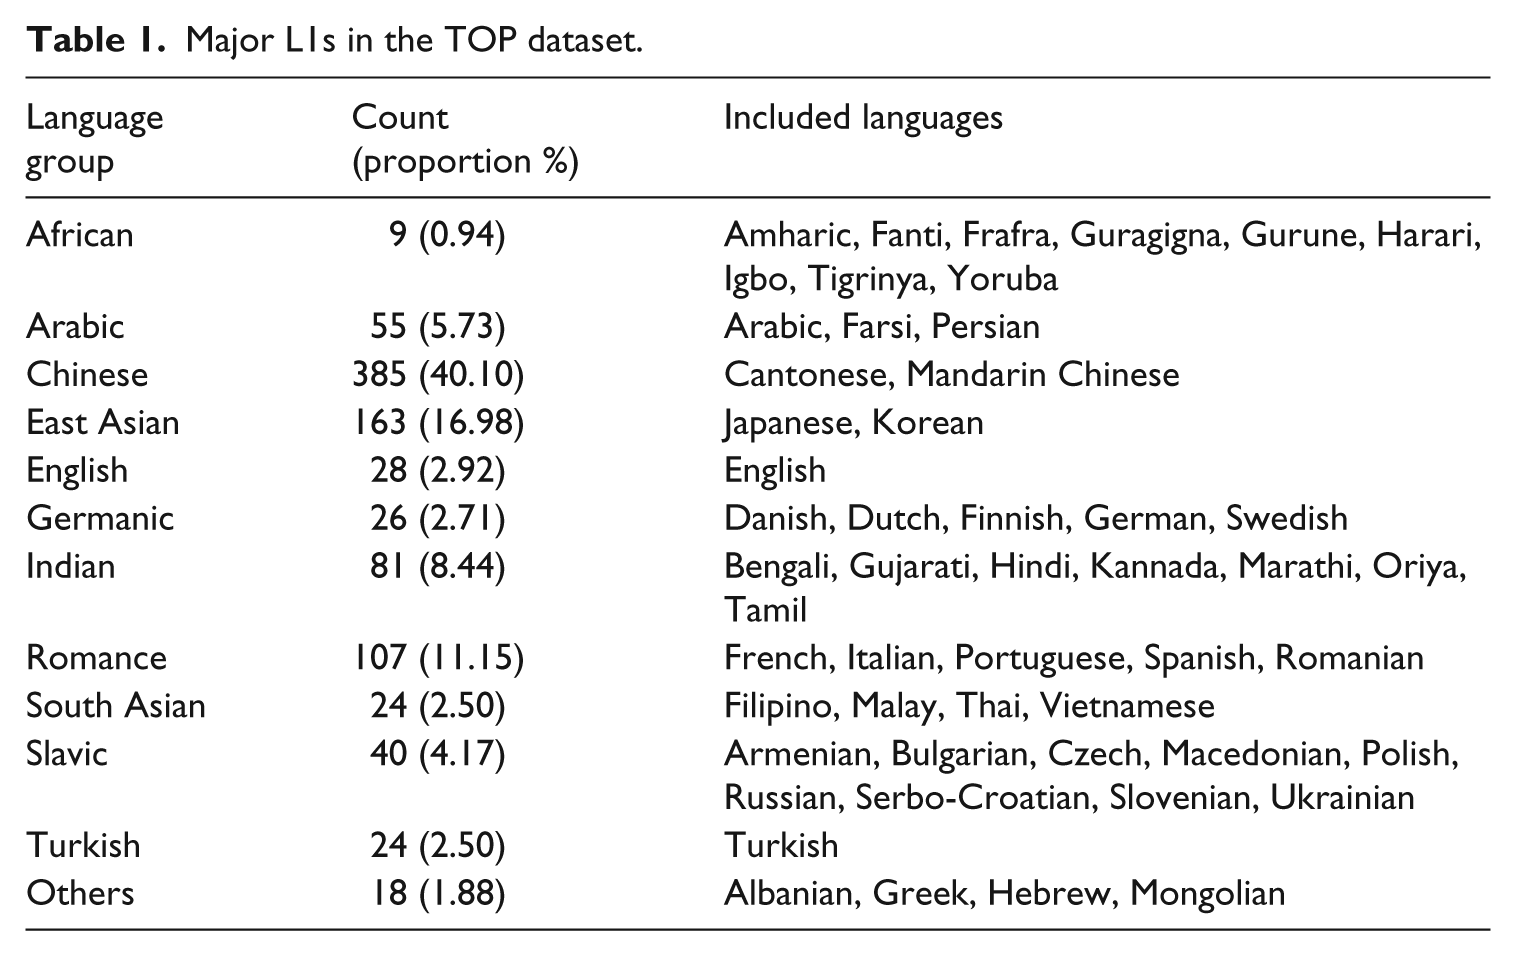
TOP test takers are asked to provide several pieces of background information at registration, including their first language (L1). The 960 test takers spoke a total of 52 different L1s, which are presented in Table 1. To facilitate the presentation, these L1s were put into language groups based on linguistic and/or regional commonalities. Table 1 shows that the proportions of the language groups differed widely. Chinese languages accounted for the largest number of speakers, approximately 40% of the entire sample. East Asian languages, namely Japanese and Korean, comprised the second largest group, followed by Romance languages. The sample also included a small number of native English speakers because of the school policy and multilingual test takers. Students from other English-speaking countries such as Australia, Canada, and the UK are considered international at UCLA. The university policy mandates that every international student, regardless of their L1, must pass the TOP before starting work as a TA. In addition, there were test takers who listed English and another language as their L1. Out of the 960 test takers in the sample, approximately 65% (611) passed the test, while approximately 15% (148) failed. The remaining 201 test takers belonged to the Provisional Pass category, which mandates that they take a remedial ESL oral skills class of their choosing before or concurrent to the beginning of their TA duties.
Major L1s in the TOP dataset.
An overview of analysis procedures
This study utilized IRT-based score estimation and FM modeling to identify different profiles of TOP subscale scores. An IRT model was fitted to the observed TOP scores to estimate subscale scores that account for structural dependency and rater effects. FM models were fitted to the estimated subscale scores to explore groups of TOP test takers who exhibited homogeneous subscale score profiles. Based on the FM modeling result, each test taker was assigned a profile group membership. The following subsections provide detailed descriptions of each of these analysis procedures.
Observed and model-based subscale scores
All TOP subscale scores were on the same four-point scale, from one to four. Since two raters assigned a score for each of the four subscales and each of the two tasks, each test taker received a total of 16 (four subscales × two tasks × two raters) scores. However, since each test taker received four scores (two tasks × two raters) per subscale, dependency among these scores is expected. Another issue relevant to observed TOP subscale scores is the rater effects due to potential differences in severity and discriminating competency. Rater effects are of substantial importance, considering that the ultimate goal of this study was to classify TOP test takers based on subscale score profiles. Since the TOP uses a four-point scale for all subscales, there is only a finite number of possible score patterns. Therefore, even a one-point classification error from one rater could bring about shifts in classification results. This issue was exacerbated by the seldom use of the lowest possible score (i.e. one) across all four subscales, which further reduced the effective number of available score patterns.
This study utilized an IRT model to address the structural dependency and rater effects in the observed TOP subscale scores. In particular, Johnson’s (1996) multi-rater ordinal model was extended to a second-order graded response model (GRM) (Samejima, 1969) to fit the TOP data (for a detailed description of the employed model, see Choi, 2013). The second-order GRM was estimated using Markov chain Monte Carlo (MCMC). As a result, the four scores (two tasks × two raters) within each subscale were weighted and combined, adjusting estimated rater effects, to produce a single subscale score, resulting in four subscale scores in total per test taker. For convenience, these scores will be referred to as the model-based scores in the remainder of this paper. The subsequent FM analysis was conducted based on the model-based subscale scores.
The distributions of the model-based subscale scores and the observed sum scores, which were calculated by simply adding together the two rater scores across the two tasks, are presented in the first and second rows, respectively, of Figure 1. Figure 1 shows that the model-based subscale scores successfully captured the distributional characteristics of the observed sum scores. In particular, multiple modes in the sum score distributions were retained by the corresponding model-based score distributions. The key difference between them was the continuous nature of the estimated model-based scores. This was one of the main motivations for the estimation of model-based subscale scores, since the fine-tuned distinction available with the continuous model-based subscale scores is better suited for a clustering technique that explores underlying group structures. The model-based scores were highly correlated across all subscales, as can be seen in Figure 2.
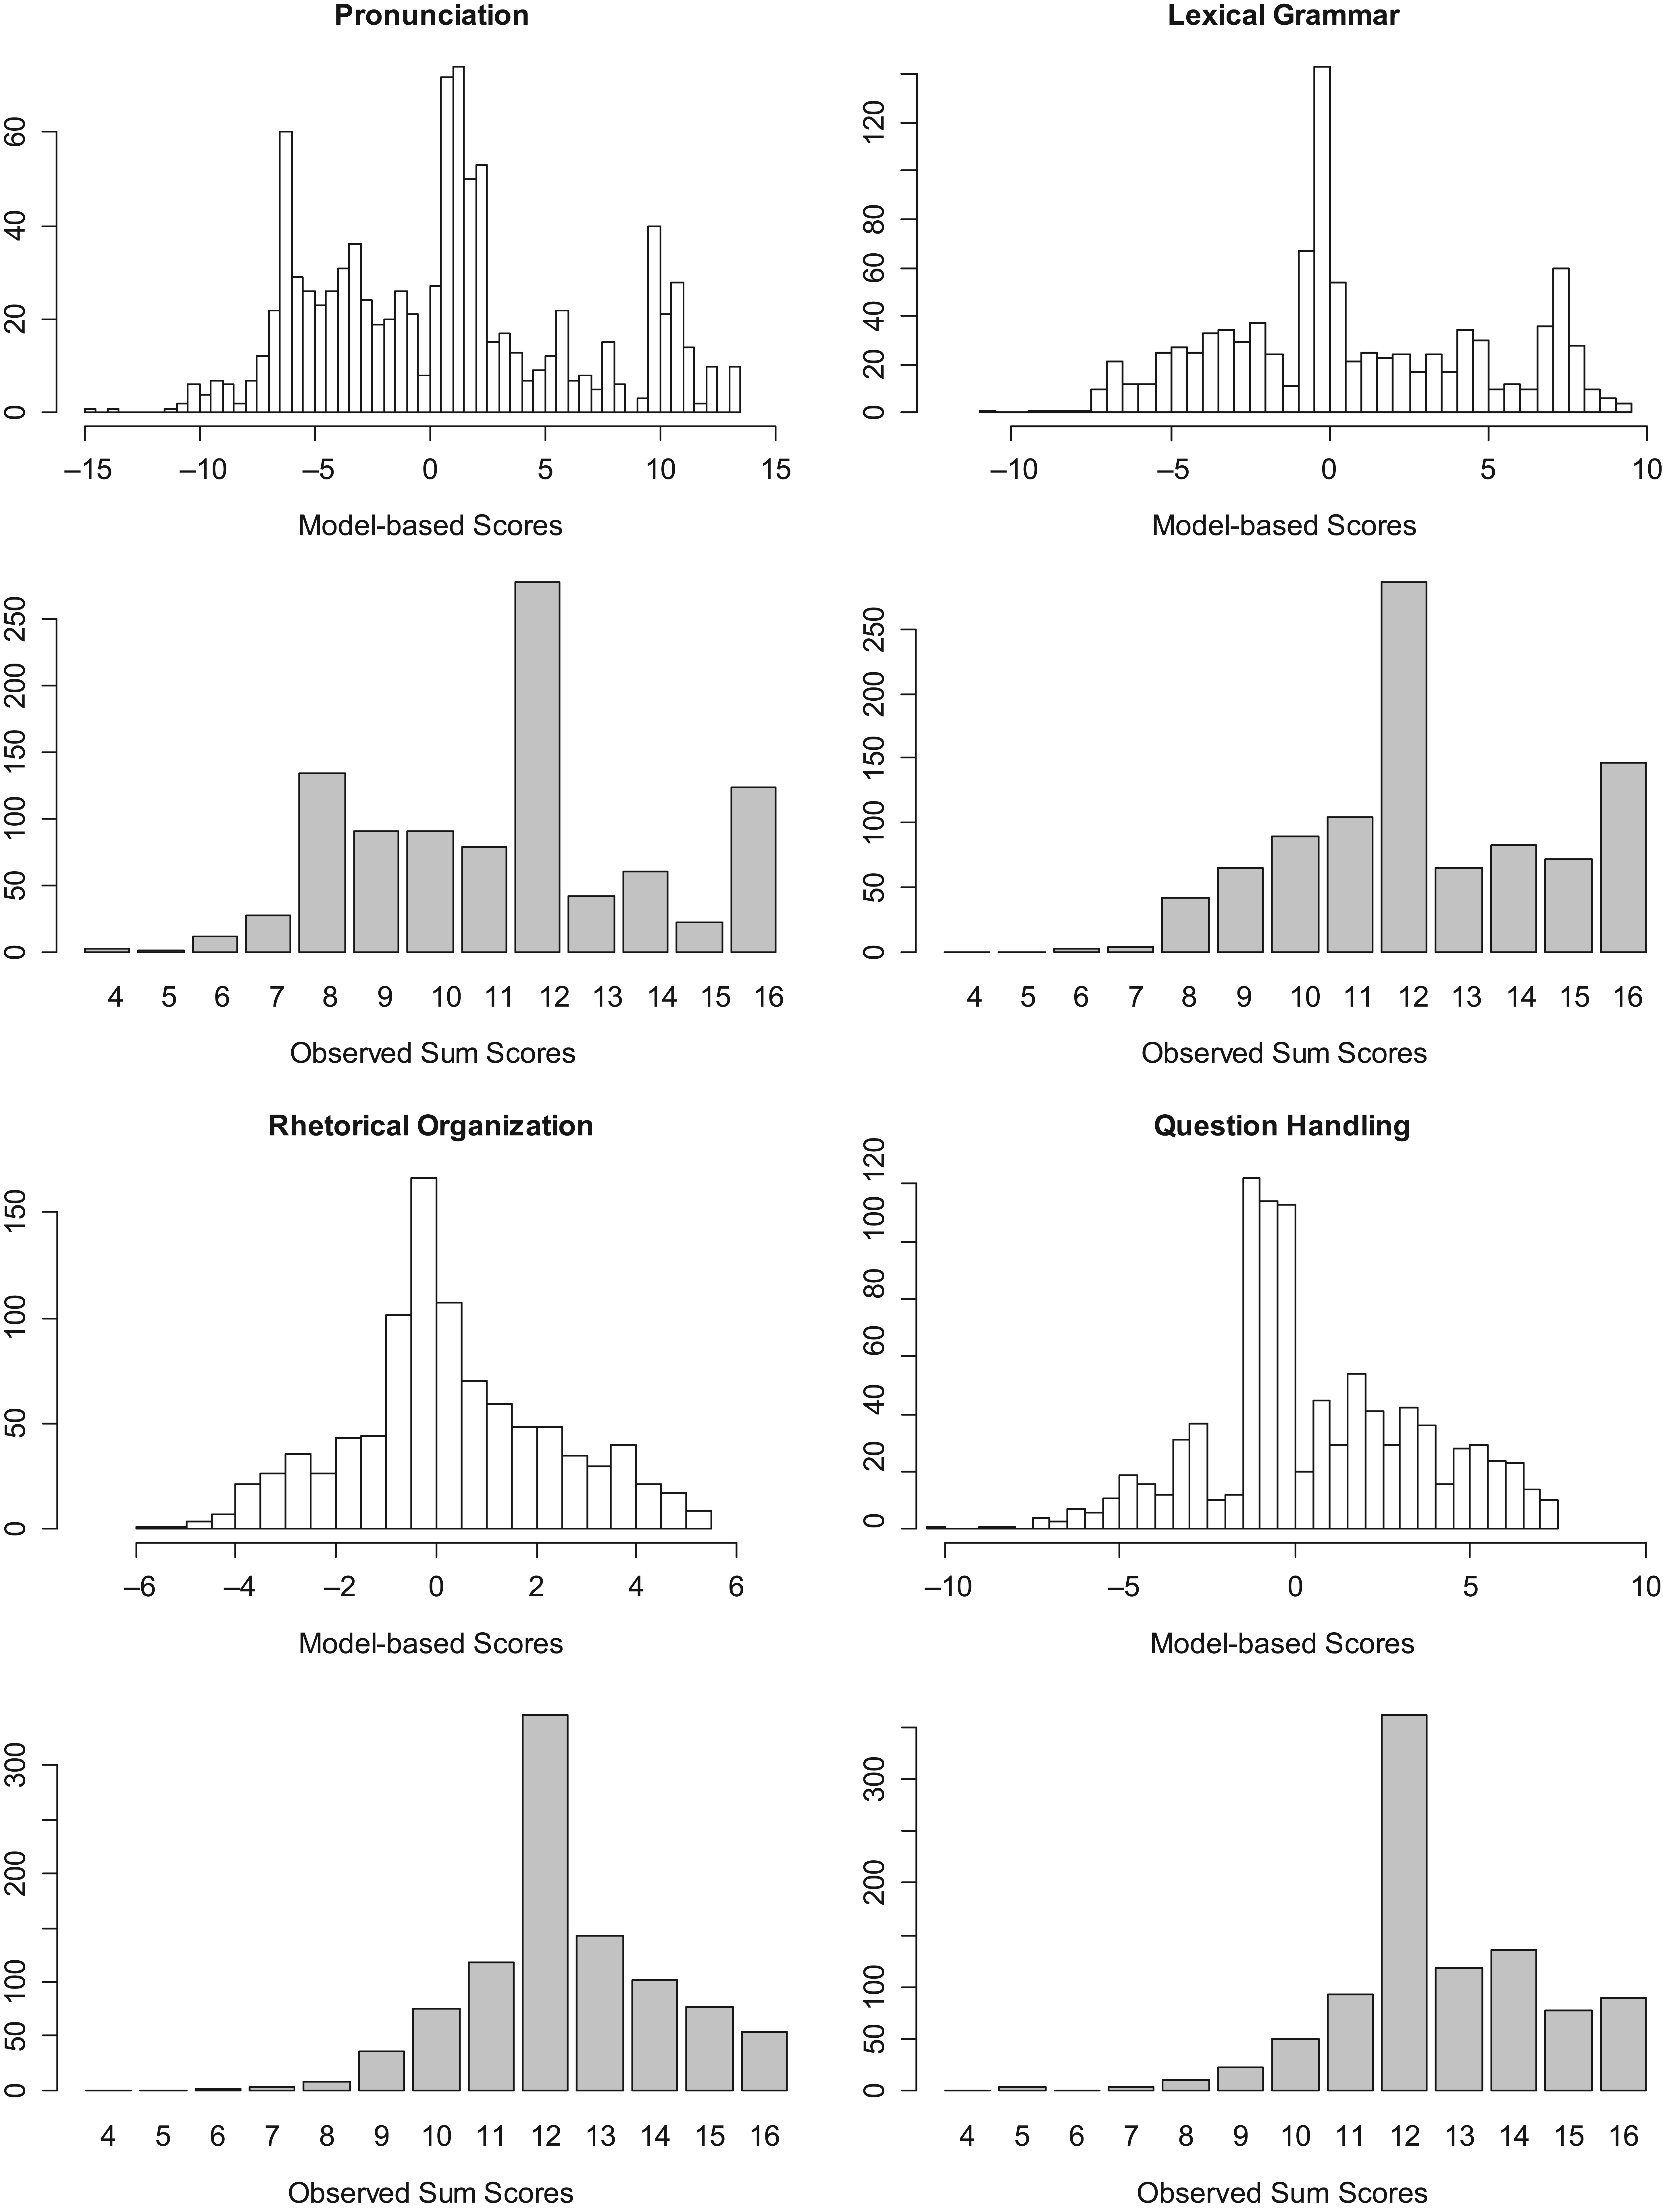
The distributions of the model-based subscale scores (in the first row) and the observed sum scores (in the second row).
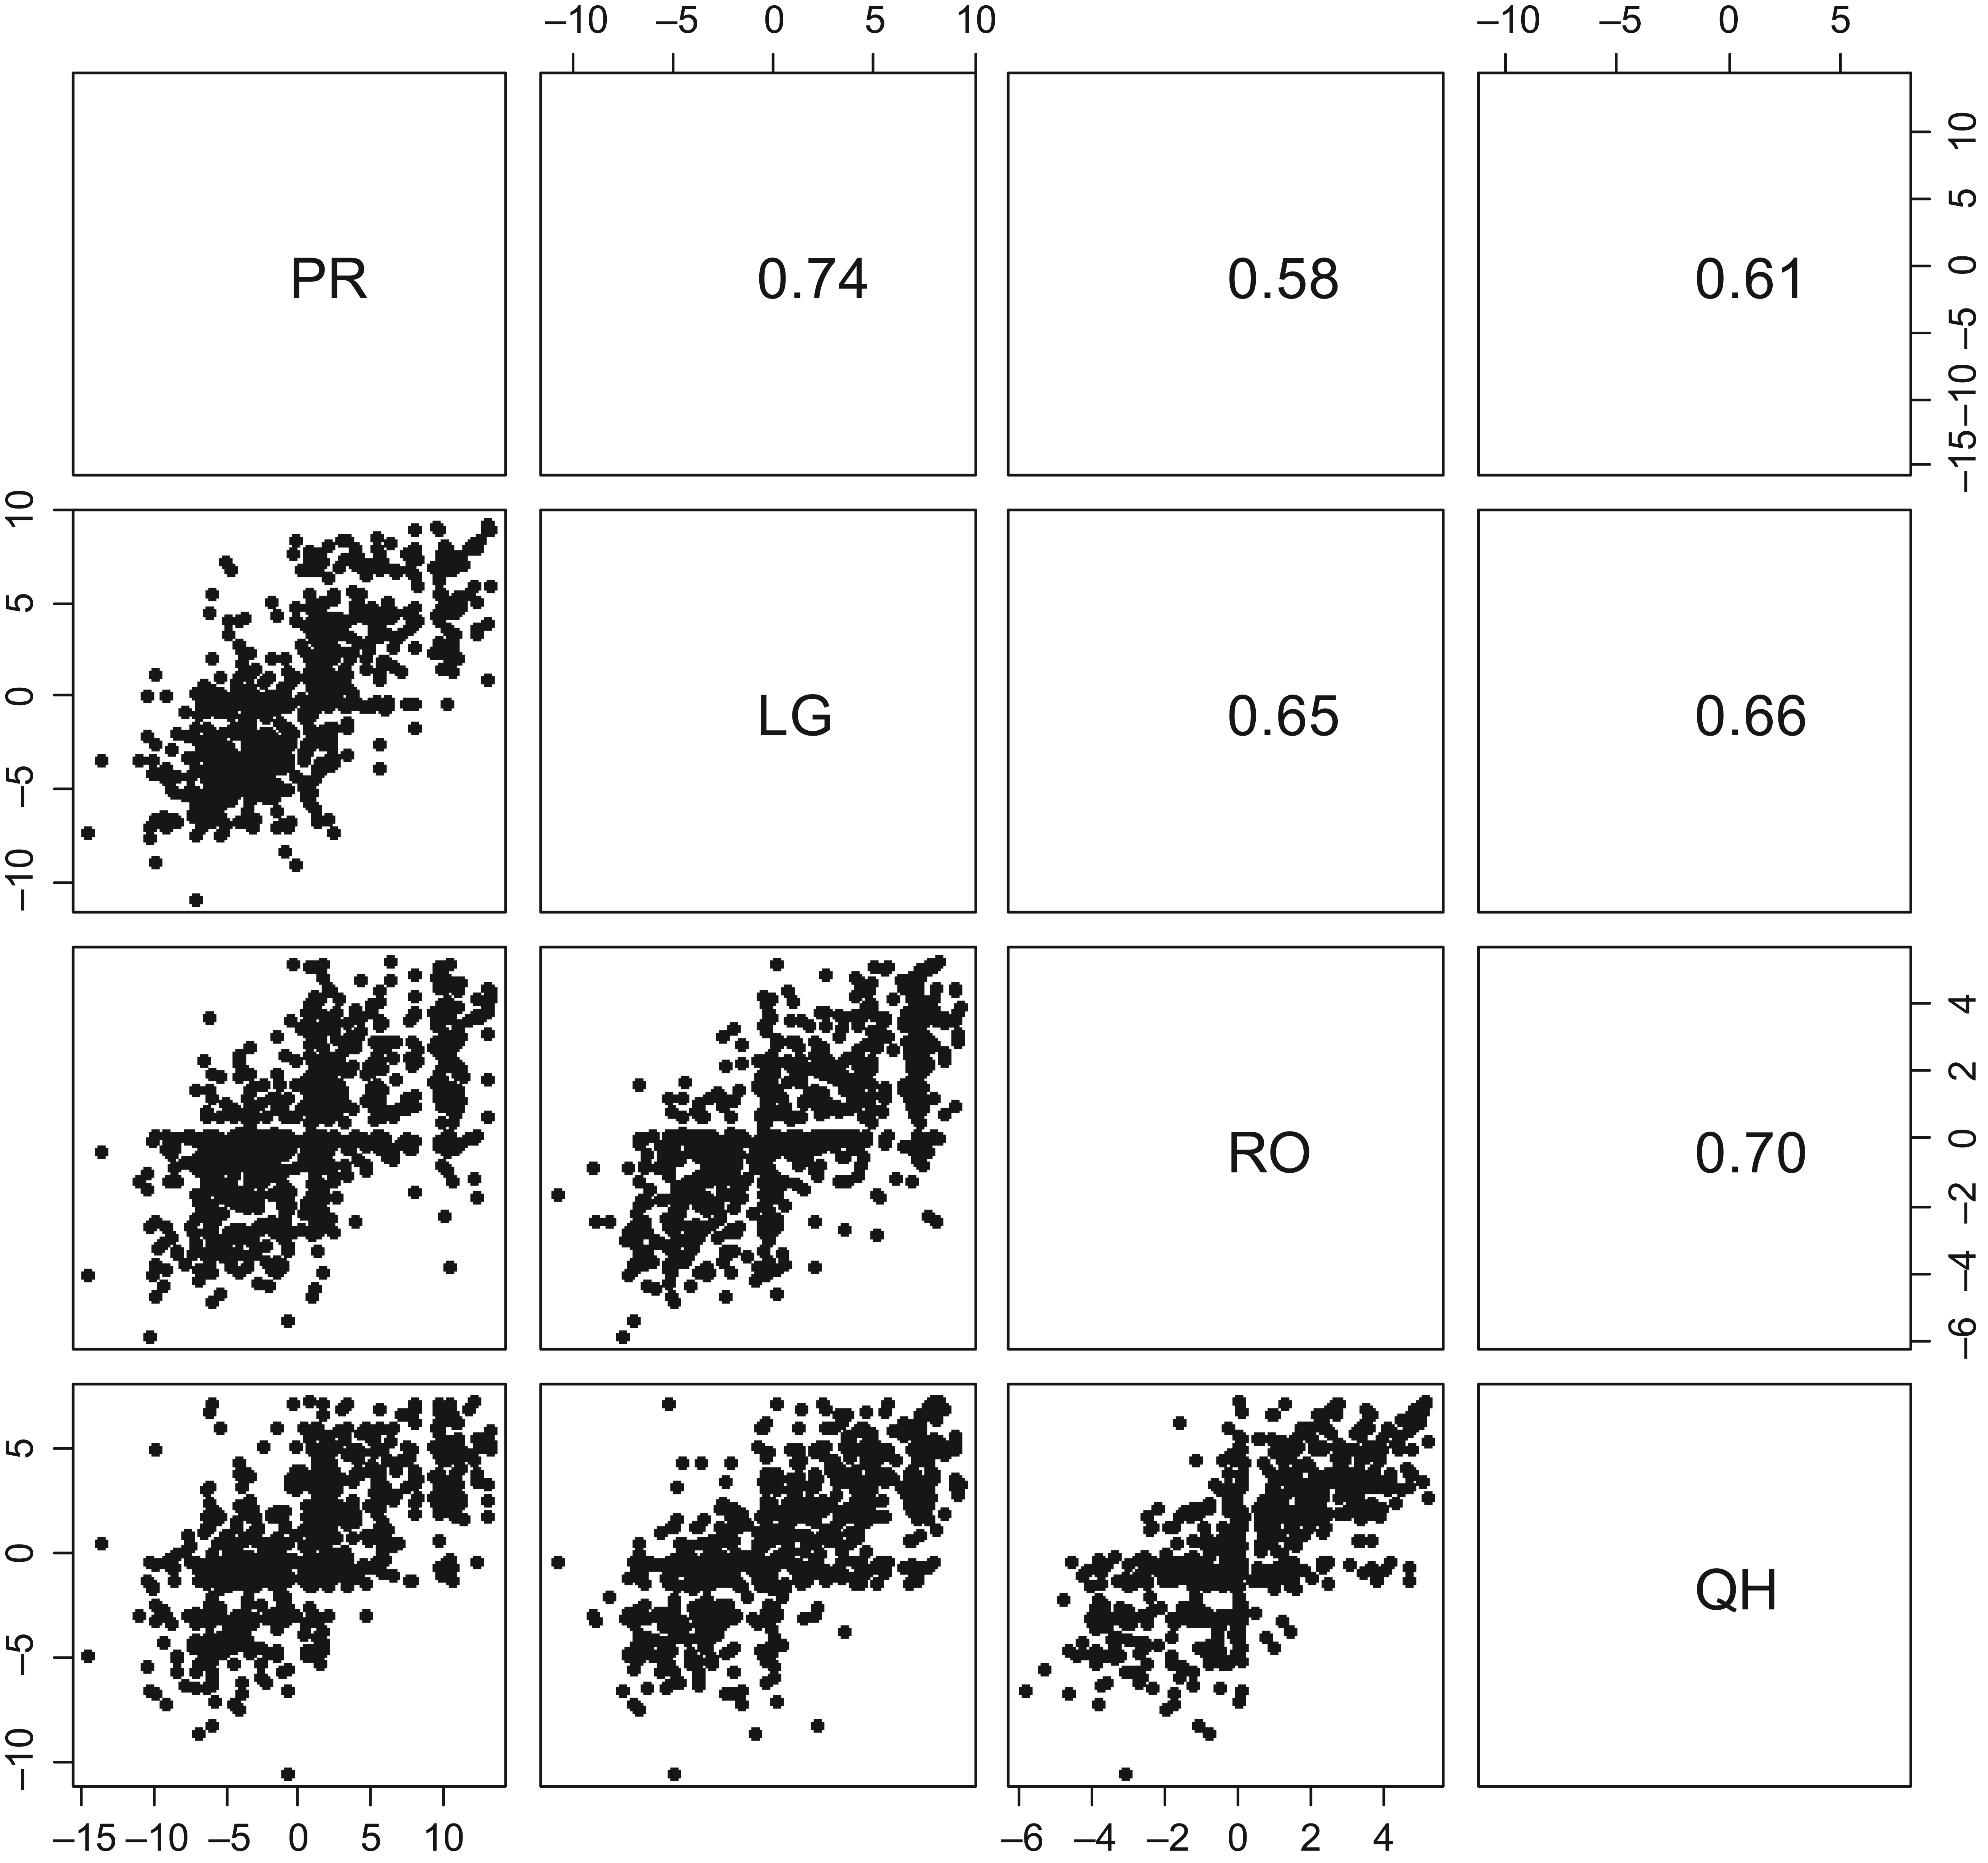
Scatter plots and correlations among the model-based subscale scores. PR=Pronunciation; LG=Lexical Grammar; RO=Rhetorical Organization; QH=Question Handling.
FM analysis
Mixture component distributions
FM analysis requires selecting component distributions. In this study, mixture component distributions were selected based on the empirical distributions of the model-based subscale scores and the structure of the TOP. A visual inspection of the model-based score distributions in Figure 1 suggested that each subscale distribution could be modeled as a mixture of normal distributions. Normal component distributions also have practical advantages, such as ease of computation and interpretation. The dimensionality of component distributions was determined to reflect the test design. In particular, since the TOP consists of four subscales, it was natural to consider four dimensional distributions as mixture components. The examination of the correlation structure among the subscales presented in Figure 2 did not suggest any need to collapse the existing dimensions; although all subscales were highly correlated with one another, none of the estimated correlation coefficients was approaching one. This also supported the choice of four-dimensional component distributions. Consequently, four-dimensional normal distributions were selected as mixture component distributions. The mean vectors and the covariance matrices of four-dimensional normal component distributions were all estimated from the data.
Model fitting
Given the lack of previous knowledge about the number of distinctive profiles, FM models consisting of different numbers of component distributions were fitted to the model-based subscale scores of the 960 test takers. The FM models were estimated using an expectation-maximization (EM; Dempster, Laird, & Rubin, 1977) algorithm with non-parametric hierarchical clustering results as initial values. The model fitting was done using the mclust package (Fraley, Raftery, Murphy, & Scrucca, 2012) in R (R Development Core Team, 2012).
The final model was selected based on statistical goodness of fit and substantive interpretability. The statistical goodness of fit was evaluated using the Bayesian information criterion (BIC; Schwarz, 1978). When different models are compared, one with a smaller BIC value is preferred. The BIC has been successfully applied to mixture modeling for density estimation (see, e.g., Roeder & Wasserman, 1997; Solka, Wegman, Priebe, Poston, & Rogers, 1998). Furthermore, simulation results suggest that BIC performs better in finding the number of components than other indices including the Akaike information criterion (see, e.g., Cho et al., 2013; Dasgupta & Raftery, 1998; McLachlan & Peel, 2000). The generalized variances of component distributions were also monitored. In particular, solutions involving a component distribution with extremely small generalized variance were carefully investigated to avoid spurious solutions. Moreover, given the exploratory nature of this study, it was important to find a clear solution which could lead to better understanding of the TOP dataset. Consequently, substantive interpretability was also considered in the evaluation of different solutions.
Results and discussion
Model selection
The focus of model selection was to find the number of underlying subscale profile groups that could account adequately for the data. For a statistical evaluation, the BIC values of the best fitting models conditional on the number of groups were calculated. Models with more than ten groups yielded consistently increasing BIC values as the number of groups increased, and therefore were not considered further. There were three modes within the range of one to 10, namely the four (BIC: 18,080.99), seven (BIC: 17,833.24), and 10 (BIC: 17,997.76) group solutions. Solutions corresponding to the three modes were examined in terms of the generalized variances of component distributions as well as interpretability. The 10-group solution contained several seemingly spurious groups with very small generalized variances. Both the four-group solution and the seven-group solution appeared legitimate in terms of the generalized variances and interpretability. However, the seven-group solution was preferred because of the following two reasons. The seven-group solution fit the data better than the four-group solution as indicated by the smaller BIC. Furthermore, the four-group solution yielded larger classification uncertainties. Consequently, the seven-group solution was selected as the final model.
The selected final model provided the probability of a test taker’s being classified into each of the seven groups. As an illustration, the estimated classification probabilities for the first five test takers are provided in Table 2. A test taker was classified into the group that had the highest classification probability. For example, Test Takers 1, 2, and 5 in Table 2 were classified into Group 2, while Test Takers 3 and 4 were classified into Groups 3 and 4, respectively.
An excerpt of the estimated classification probabilities.
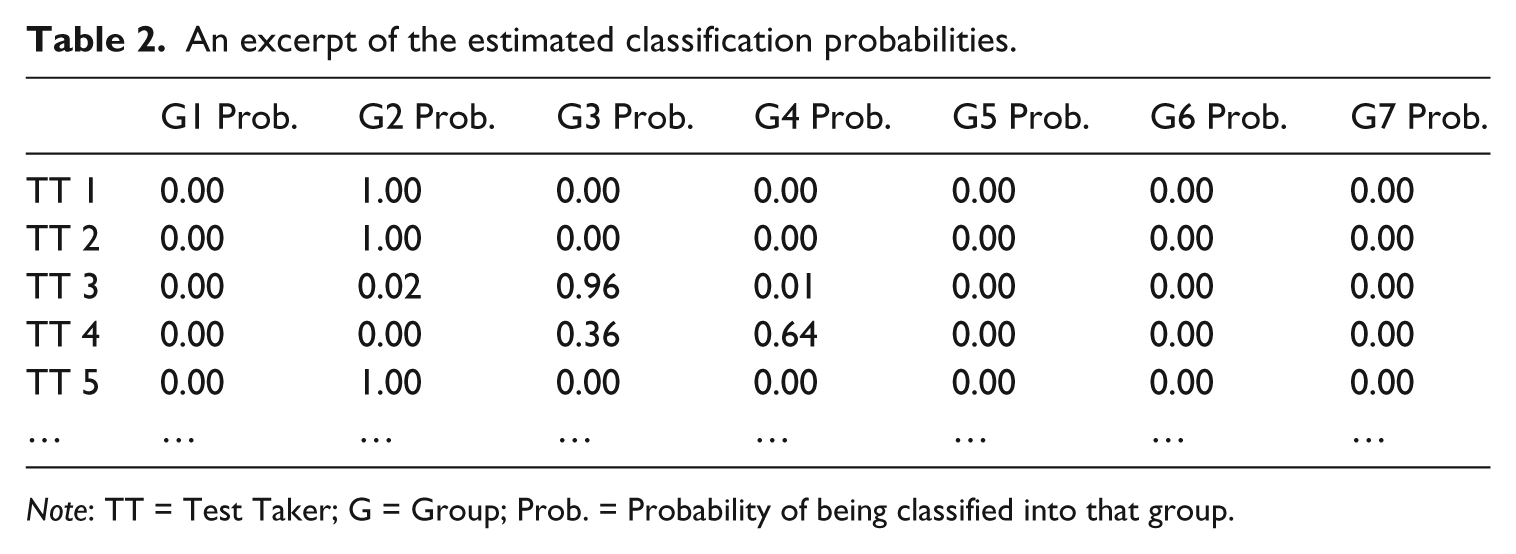
Note: TT = Test Taker; G = Group; Prob. = Probability of being classified into that group.
The uncertainty involved in classification was in general quite small. Classification uncertainty can be calculated as the difference between one and the highest classification probability. For example, the classification uncertainty of Test Taker 3 in Table 2 was 0.04 (i.e., 1 – 0.96). The final model classified more than half of the test takers with less than 10% uncertainty. Furthermore, 810 out of the 960 test takers were given a group membership with classification uncertainties lower than 30%.
To facilitate the interpretation of the final model, it was decided to focus on test takers who were assigned a component group membership with a high degree of confidence. Consequently, test takers whose classification uncertainty exceeded 30% were not considered in interpreting the profile group structure suggested by the final model. The choice of the 30% cutoff, while essentially arbitrary, was driven by practical considerations. The 30% cutoff provided a reasonable degree of confidence in the classification results, while retaining approximately 85% (810) of the entire sample. The reduced sample of 810 test takers retained the major characteristics of the entire TOP dataset in terms of linguistic background and TOP decision categories. This provided a justification for focusing the interpretation of the classification results on the reduced sample of 810 test takers. For simplicity, the reduced sample will be referred to as the interpretation sample in the remainder of this section.
Interpretation of the subscale score profile groups
This subsection presents the group structure suggested by the final model in detail. For each of the seven groups, group members’ model-based subscale score patterns are presented. Since there were four subscales, model-based subscale scores were four-dimensional data, which cannot be presented in a straightforward manner. To address this difficulty, the model-based subscale scores of each group are demonstrated using six bivariate scatter plots that exhaust all possible pairs of the four subscales. To facilitate the interpretation, model-based subscale scores were transformed into z-scores and mapped onto the plots, and the decision categories of group members were overlaid using different symbols. Finally, each group is labeled based on its group members’ characteristic subscale score patterns.
Group 1
Group 1 comprised approximately 10% (83) of the interpretation sample. Figure 3 provides the distributional characteristics of the model-based subscale scores for the members of Group 1. Figure 3 also shows that all Group 1 members passed the test. The characteristic feature of this group was the concentration of the Pronunciation and Lexical Grammar scores around the highest possible values (recall that the plots show z-scores), as can be seen in Figure 3(a). Figures 3(b) to (f) illustrate that the variances in Rhetorical Organization and Question Handling accounted for almost all of the within-group variance. However, even in the two latter subscale dimensions, variations were mostly limited to above-average areas.
Bivariate relationships between the model-based subscale scores (Group 1).
The distributional characteristics of the model-based subscale scores illustrated in Figure 3 provided a basis for a clear understanding of Group 1. The characteristic subscale score pattern observed in Group 1 was consistent with a pattern expected from a fully proficient English speaker, such as a native English speaker. The TOP scoring rubric was designed such that even a typical native speaker of English should be able to receive perfect scores on Pronunciation and Lexical Grammar, but not necessarily on Rhetorical Organization and Question Handling, in that the rubric requires excellence in performance for the perfect scores on the latter two subscales (see the TOP scoring rubric in the Appendix). However, a fully proficient English speaker is still likely to score above the average of the TOP test taker population on the two latter subscales. All Group 1 members passed the test, which also supports interpreting Group 1 as the group of fully proficient speakers of English. The linguistic background of Group 1 members was in line with this interpretation. Most test takers who identified their L1 as English were classified into Group 1.
In sum, test takers who were classified into Group 1 possessed a score profile that is consistent with what would be expected from a fully proficient English speaker. The linguistic background and the decision categories of Group 1 members agreed with the shared profile. The subscale score pattern and the background of group members made it clear that Group 1 members possessed a near-native level of academic oral English proficiency. Consequently, Group 1 was labeled as the Full Proficiency group.
Group 2
Group 2 accounted for approximately 20% (155) of the interpretation sample. The members of Group 2 turned out to have a similar subscale score pattern to test takers in the Full Proficiency group (Group 1), with one important difference: the model-based scores of Group 2 members varied across all four subscales, as shown in Figure 4. The model-based scores of almost all Group 2 members were located around the top-right quadrant of all bivariate plots in Figure 4, which indicates that most Group 2 members scored above average on all four subscales. Therefore, a typical Group 2 test taker could be regarded as having above-average abilities on all four subscales.
Bivariate relationships between the model-based subscale scores (Group 2).
The subscale score pattern observed in Group 2 corresponded to what would be expected from a typical test taker with advanced academic oral English proficiency. A test taker who is highly proficient in academic oral English should be able to score well on all four subscales and pass the test. Figure 4 shows that Group 2 members met both expectations; the vast majority of Group 2 members scored above-average on every subscale, and all Group 2 members passed the test. However, even a highly proficient second or foreign language speaker is expected to make some pronunciation errors and could carry a distinguishable accent (see, e.g., Bongaerts, 1999; Fayer & Krasinski, 1987; Yeni-Komshian, Flege, & Liu, 2000). In addition, occasional grammatical errors and unnatural word choices are commonly found in the speeches of proficient but non-native speakers of a language (see, e.g., Han, 1998; Ju, 2000). It was, therefore, not surprising to see variations in the Pronunciation and Lexical Grammar scores among highly proficient English speakers.
The model-based subscale scores suggested that test takers in Group 2 possessed advanced academic oral English proficiency across all subscales. Furthermore, every Group 2 member passed the test. Considering the subscale score pattern and the TOP decision category that characterized the members of Group 2, it was reasonable to label Group 2 as the High Proficiency group.
Group 3
Group 3 comprised approximately 20% (184) of the interpretation sample. Figure 5 gives the bivariate distributions of the model-based scores among the four subscales in Group 3. Variations were observed in all six scatter plots. The variations in Pronunciation and Lexical Grammar were concentrated around the below-average region. Rhetorical Organization and Question Handling scores varied slightly more. As expected from the widely varying scores on all subscales, all three decision categories were present in Group 3. The proportions of the Fail and Pass categories were comparable, each of which accounted for approximately 20% of Group 3.
Bivariate relationships between the model-based subscale scores (Group 3).
The subscale score pattern characterizing Group 3 could be regarded as a middle ground between all-high profiles observed in the two previous groups and an all-low profile consisting of low scores across all subscales, which will be described next. It was clear that the test takers in Group 3 did not perform as well as the members of the two previous groups. However, many Group 3 members received around- and even above-average scores on more than one subscale. In addition, the majority of Group 3 members belonged to the Provisional Pass category, which functions as a middle category between Pass and Fail.
Test takers who were classified into Group 3 shared a subscale score pattern that could be characterized as intermediate. The majority of Group 3 members belonged to the Provisional Pass category, which lies between the Pass and Fail categories. Compared to the full- and high-proficiency possessed by the members of the two previous groups, Group 3 members could be regarded as having an all-intermediate profile. Consequently, Group 3 was labeled the Intermediate Proficiency group.
Group 4
Group 4 comprised approximately 10% (78) of the interpretation sample. Figure 6 shows the distributions of the model-based scores and bivariate relationships among the subscales for test takers in Group 4. Within-group variation was evident in all six plots, but mostly confined to the lower-left quadrants. This indicates that the test takers classified into Group 4 received mostly below-average scores on all subscales. The difference between Group 4 and the High Proficiency group was noteworthy. Group 4 test takers turned out to share a subscale score pattern that was almost the exact opposite of the pattern shared by the High Proficiency group members; Figures 4 and 6 show two groups of test takers that are almost mirror images of each other.
Bivariate relationships between the model-based subscale scores (Group 4).
Given the low model-based scores, it is not surprising that most test takers (61 out of 78) in Group 4 belonged to the Fail category. This subscale score pattern of Group 4 largely corresponded to a profile expected from a test taker with a low level of academic oral English proficiency. There was only one test taker who passed. Considering the low scores on all subscales, that particular student appeared to have been erroneously assigned the pass category owing to rater effects. Few test takers in Group 4 achieved above-average scores on any of the subscales. The majority were given lower model-based scores across all subscales than the Intermediate Proficiency group members. Considering the subscale score pattern and the predominant decision category, it was decided to label Group 4 the Low Proficiency group.
Group 5
Test takers who belonged to the previous four groups turned out to possess flat profiles. That is, most of their model-based scores were either above average (the Full Proficiency group and the High Proficiency group), around average (the Intermediate Proficiency group), or below average (the Low Proficiency group) on all subscales. Group 5 differed from the previous four groups in that its members were widely scattered in some dimensions while highly concentrated with little variance in other dimensions, as can be seen in Figure 7. Group 5 members were highly homogeneous in terms of Rhetorical Organization and Question Handling. In contrast, they differed widely in terms of their Pronunciation and Lexical Grammar scores, as can be seen in Figure 7(a). Approximately 15% (136) of the interpretation sample were classified into Group 5.
Bivariate relationships between the model-based subscale scores (Group 5).
From a TOP decision point of view, Group 5 can be divided further into two subgroups: test takers who passed the test (81 out of 136) and who did not (55 out of 136). Given the little variance in Rhetorical Organization and Question Handling, the decision category for Group 5 test takers was largely determined by their Pronunciation and Lexical Grammar scores, as can be seen in Figure 7(a). In particular, most test takers in the upper-right quadrant of Figure 7 (a) passed the test, whereas those in the lower-left quadrant did not. Figures 7(b) through (e) illustrate the same impact.
Group 5 was interesting in that its members showed a non-flat profile. Test takers classified into Group 5 were homogenous in terms of their Rhetorical Organization and Question Handling scores, but differed widely along the Pronunciation and Lexical Grammar subscale dimensions. Considering the non-flat subscale score pattern characterizing Group 5, it was decided to keep its label as descriptive as possible. In particular, Group 5 was labeled as the Varying Pronunciation/Grammar group, given its large variance in the two subscale dimensions.
Group 6
Group 6 members, who accounted for approximately 15% (129) of the interpretation sample, shared similar scores on the Pronunciation subscale, while varying considerably along the other three subscale dimensions. The subscale score patterns of Group 6 test takers, therefore, were not flat. Figure 8 presents the model-based score distributions of Group 6 test takers. Figures 8(a), (b), and (c) illustrate the lack of variance in Pronunciation. The Pronunciation scores of Group 6 members were concentrated slightly above the average. On the other hand, each of the Lexical Grammar, Rhetorical Organization, and Question Handling scores was distributed across the whole range except around the lowest extremes.
Bivariate relationships between the model-based subscale scores (Group 6).
Test takers who were classified into Group 6 presented another case of a non-flat profile. While their Pronunciation scores were highly concentrated around the average, all other subscale scores varied considerably. Most test takers in Group 6 passed the test, including many who received below-average scores on other subscales, owing to the higher weight assigned to Pronunciation. In sum, Group 6 could be characterized by the concentration of the Pronunciation scores around the average, and therefore was labeled as the Average Pronunciation group.
Group 7
Group 7 members, who accounted for approximately 5% (45) of the interpretation sample, presented a third case of a non-flat score profile. Figures 9(a), (c), and (e) show that members of this group were homogeneous in terms of Pronunciation, Lexical Grammar, and Question Handling, concentrated around the corresponding averages. Rhetorical Organization was the sole source of within-group variance, as can be seen in Figures 9(b), (d), and (f). The variance of the Rhetorical Organization scores was relatively small with most test takers distributed around the average. Extreme scores were not observed in Group 7. All Group 7 members passed the test.
Bivariate relationships between the model-based subscale scores (Group 7).
The variance of the Rhetorical Organization scores, in contrast to the lack of variance on the other subscales, might have to do with a difference in the nature of Rhetorical Organization compared to the other subscales. In particular, the prior preparation of a test taker is directly relevant to Rhetorical Organization, but not necessarily to the other subscales. In order to receive a high score in Rhetorical Organization, a test taker needs to give a presentation in a coherent and clear manner, which can be enhanced with thorough preparation. Therefore, the characteristic subscale score profile of Group 7 might be interpreted as reflecting the impact of prior preparation on Rhetorical Organization among test takers whose proficiency is around average in terms of the other three subscales.
Group 7 test takers could be characterized by variance in Rhetorical Organization and homogeneity in terms of Pronunciation, Lexical Grammar, and Question Handling. This might be interpreted as the impact of preparation, considering that good preparation is necessary for receiving a good score on Rhetorical Organization. Given the characteristic Rhetorical Organization variance, it was decided to label Group 7 the Varying Organization group.
Implications
This study was conducted in the local context of the TOP. Consequently, the implications of the findings can be best illustrated within that context. First and foremost, the findings of this study can provide valuable information to enhance ITA training. The types of profile groups and the composition of each group in terms of TOP decision categories can be used as an empirical basis on which to make decisions as to which courses should be offered. The Varying Pronunciation/Grammar group provides a particularly informative example; the decisive role of Pronunciation and Lexical Grammar and the around-average scores on the other two subscales suggested that the members of this group who did not pass the test can be best served by interventions focusing on their Pronunciation and Lexical Grammar skills. UCLA currently offers two ESL oral skills courses that are devoted to improving segmental and suprasegmental pronunciation. These two courses also cover spoken grammar, and therefore, will suit the needs of Varying Pronunciation/Grammar group members. On the other hand, the Low Proficiency group members will need ESL courses that cover aspects of English oral proficiency relevant to all four subscales in a more balanced manner. These balanced courses can be properly structured as a sequence, given practical considerations such as class time and available instructors. The Intermediate Proficiency group members who did not pass the test can then take a part of such a sequence, since a slight, within-group improvement on any of the four subscales would lead them to pass the test, as can be seen in Figure 5.
The profile group structures identified in this study can serve as empirical evidence in order to evaluate the current ITA screening standards at UCLA. The High, Intermediate, and Low Proficiency groups largely corresponded to the three TOP decision categories, which can be considered as supporting evidence for the current standards. The subscale score pattern and the predominant decision category of Low Proficiency group members are also informative for the evaluation of the current policy for failing test takers. It is clear from Figure 6 that, with only one exception, even the highest scoring test takers in the Low Proficiency group failed to pass the test. This suggests that most test takers in the Low Proficiency group would not be able to pass the test with moderate improvements on any of the four subscales. Therefore, the current policy which does not allow failing test takers to start working as a TA until they retake and (provisionally) pass the test can be supported by this empirical finding.
However, the results of this study presented mixed evidence as to whether the current policy for provisionally passed test takers can be justified. Provisionally passed test takers in the Intermediate group, as can be seen in Figure 5, would pass the test with a slight improvement on any of the four subscales. Assuming the positive contribution of ESL oral-skills courses to a test taker’s academic oral English proficiency, it is reasonable to expect that these test takers would benefit from any ESL oral-skills course available to them. On the other hand, it is noteworthy that provisionally passed test takers in the Varying Pronunciation/Grammar group shared around-average Rhetorical Organization and Question Handling scores that were comparable to those of many test takers in the High Proficiency group. This non-flat profile of the Varying Pronunciation/Grammar group suggests that provisionally passed test takers in this group would benefit less from courses focusing on skills relevant to Rhetorical Organization or Question Handling. In this light, it is desirable to revisit the current policy that allows all provisionally passed test takers to take any of the available ESL oral-skills courses. At the very least, test takers with a subscale score profile that clearly resembles the characteristic profile of the Varying Pronunciation/Grammar group should be instructed to take courses focusing on pronunciation, oral grammar, or vocabulary uses.
In addition, the results of this study provide important insights to the impact of the current total score calculation and the corresponding TOP standards. As noted earlier, the calculation of the final score favors test takers who score highly on the Pronunciation subscale by giving a higher weight to Pronunciation than the other subscales. Consequently, most test takers in the Average Pronunciation group were able to pass the test despite large variances on the three subscales other than Pronunciation, as can be seen in Figure 8. That is, test takers with around- or above-average scores on Pronunciation can pass the test even with low scores on the other subscales. It is not clear whether this was intended or considered when the score weights and the decision standards were established. The three other subscales capture important aspects of test takers’ academic English oral proficiency, and therefore, it may not be desirable for the Pronunciation subscale to dominate the pass–fail decision. Whether test takers with a probable profile consisting of an above-average Pronunciation score and below-average scores on all other subscales would be regarded as proficient enough to qualify as a TA is an important question that needs to be addressed in a standard setting study. The results of this study can provide a focused dataset for such a standard setting study by identifying test takers classified into the Average Pronunciation group.
The profile group information can also be utilized in a bottom-up fashion at the individual instructor or test taker level. The instructor of an ESL class can use the proportion of each profile group in the class to help identify specific needs of the students. For example, when the majority of a class consists of Low Proficiency group members, the instructor can expect that the class would benefit from a balanced approach covering all four aspects of academic oral English proficiency measured by the TOP. On the other hand, the choice of which aspects to focus on can be quite different when the instructor realizes that the class consists mostly of Varying Organization group members. The findings of this study can also inform the decisions of test takers who did not pass the test or would like to improve their English regardless of their test results. The profile group membership of each test taker can be easily attached to the current score report by default or upon request. Test takers who did not pass the test will be able to make informed decisions about appropriate ESL courses to take based on the profile information. Even test takers who passed the test can use their profile information to select ESL courses that can help further improve their academic oral English proficiency.
This study also has methodological and substantive implications at a more general level. This study employed a combination of IRT and FM modeling to investigate subscale score profiles, which can be applied to many language performance assessment contexts to explore group structures. In particular, a multivariate normal mixture model based on IRT scale scores can provide a practical tool for applied linguists and language testing specialists who hope to extract profile information from language performance assessment data. From a substantive point of view, this study presented a structure of academic English oral proficiency which emerged through the exploration of different subscale score profiles. In particular, the Varying Pronunciation/Grammar group and the Average Pronunciation group demonstrated the important role of pronunciation in distinguishing different profiles and determining TOP decision categories. While the generalizability of the resulting profiles was not investigated or claimed, these profiles can contribute to an understanding of the multifaceted construct of academic English oral proficiency.
Conclusions
Summary of the findings
The research question was addressed in the context of the TOP. The model-based subscale scores of 960 TOP test takers were estimated using an IRT model to account for structural dependencies and rater effects contained within the observed rater scores. FM models with four-dimensional normal components were fit to the model-based subscale scores estimated in the previous section. The BIC and substantive interpretability were considered in model selection. The final model suggested seven profile groups in the TOP dataset, and assigned with high confidence most test takers to one of seven groups. The first group consisted of fully proficient test takers, and therefore, was labeled as the Full Proficiency group. Groups 2, 3, and 4 comprised test takers with high-, intermediate-, and low-academic oral English proficiency, respectively. Group 5 was labeled as the Varying Pronunciation/Grammar group since its members shared a subscale score pattern that varied only in terms of Pronunciation and Lexical Grammar. Group 6 consisted of test takers whose Pronunciation scores were concentrated around the average, and therefore, was labeled as the Average Pronunciation group. Group 7 consisted of test takers who varied only in terms of Rhetorical Organization, and therefore, was labeled as the Varying Organization group. Concrete ways the ESL program, ESL instructors, and test takers can use these findings to help make important decisions were proposed.
Limitations and suggestions for future studies
This study was situated in a local setting and exploratory in nature, and therefore, the results are dependent upon the investigated test taker population. Although the methodologies employed to identify the profile groups can be applied to many similar settings, the specific proportions and structure of the seven profile groups and their characteristics may not generalize to other settings. Furthermore, by focusing on the subscale scores given by raters, this study did not investigate the performance characteristics in terms of discourse features. These limitations can be addressed in future research studies. Other ITA screening tests that yield subscale scores can be analyzed using the approach illustrated in this paper. Such efforts will provide empirical evidence that could lead to a better understanding of academic oral English proficiency. Moreover, it would be worthwhile to investigate empirically the effectiveness of the resulting profiles as feedback in ITA classrooms. Another extension of this study would be an analysis of discourse features of test taker performances that belong to different profiles. Corpus-based investigations of such performances in terms of the use of academic vocabulary, discourse markers, and lexical bundles appear particularly promising in that they could provide information that addresses qualitative differences between profiles.
Footnotes
Appendix
Appendix: TOP scoring rubric

| TOP Scoring Rubric | ||||
|---|---|---|---|---|
| Score Categories | 4 | 3 | 2 | 1 |
| Phonetic & Phonological Competence | Accent not distracting. Pronunciation does not impede communication. Near-native Pronunciation | Accent slightly distracting. Pronunciation rarely or slightly impedes communication. Possible pronunciation errors, but not distracting. | Accent somewhat distracting. Pronunciation somewhat impedes communication. Persistent and frequent errors in pronunciation that distract listeners. | Pronunciation severely impedes communication. |
| Lexical/Grammatical Competence | Near-native word choice and/or oral grammar. If errors occur they are not very noticeable. Errors do not impede communication. | Some errors but rarely major. Somewhat distracting word choice and/or oral grammar. Appropriate use/range of vocabulary and grammar structure for situation and errors slightly impede communication. | Grammar errors common in more complex constructions. Some errors in simple constructions. Major and severely- distracting word choice and/or oral grammar. Lexical errors somewhat impede communication. | Major and severely distracting word choice and/or oral grammar. Lack of grammar/lexis- severely impedes. communication May be satisfactory for very simple communication |
| Rhetorical Organization | Excellent overall organization and use of transitions between sentences and topics: effective use of rhetorical questions. Successful macro and micro rhetorical organization. Clearly organized discourse positively contributes to communication. | Good overall organization and use of transitions between ideas/sentences. Discourse is appropriately organized and structured. Ideas are logically connected to one another with appropriate cohesive devices. Organization does not significantly impede communication. | Minimal overall organization and/or incorrect use of transitions between ideas/sentences. Discourse not well organized and difficulty articulating main topics and/or subtopics. Errors in use of cohesive devices and organization of ideas somewhat impede communication. | No overall organization and/or ineffective use of transitions between ideas/sentences. Discourse is generally not organized or structured. Errors in use of cohesive devices and lack of organization of ideas severely impede communication. |
| Question Handling | Provides substantial and comprehensive responses when appropriate. Clearly restates questions to demonstrate understanding. Provides appropriate answers and develops responses that connect answers to the presentation and does not diverge from the presentation. Uses appropriate methods to ensure that responses are understood and thus that questions are adequately answered. | Responds appropriately to questions. May ask for clarification. Consistently shows evidence of question comprehension. | Sometimes does not respond appropriately to questions, showing evidence of insufficient question comprehension. Often asks for clarification, even for fairly simple questions. Attempts to answer questions but may provide inappropriate or incomplete responses. Hedges questions. | Unable to understand, questions and/or to answer questions. Often responds inappropriately, offering answers that are not relevant to questions. Needs clarification very often, even for basic things. |
Acknowledgements
I would like to thank Lyle Bachman and Li Cai for their guidance and advice for this research. I am also grateful for Gary Ockey, Danielle Guzman-Orth, Spiros Papageorgiou, and Don Powers for their helpful feedback on an earlier version of this paper. Lastly, I thank the editor and three anonymous reviewers for their comments and suggestions.
Declaration of Conflicting Interests
The author(s) declared no potential conflicts of interest with respect to the research, authorship, and/or publication of this article.
Funding
The author(s) received no financial support for the research, authorship, and/or publication of this article.