
Abstract
The quality of sign language interpreting (SLI) is a gripping construct among practitioners, educators and researchers, calling for reliable and valid assessment. There has been a diverse array of methods in the extant literature to measure SLI quality, ranging from traditional error analysis to recent rubric scoring. In this study, we want to expand the terrain of SLI assessment, by exploring and evaluating a novel method, known as comparative judgment (CJ), to assess SLI quality. Briefly, CJ involves judges to compare two like objects/items and make a decision by choosing the one with higher quality. The binary outcomes from repeated comparisons by a group of judges are then modelled statistically to produce standardized estimates of perceived quality for each object/item. We recruited 12 expert judges to operationalize CJ via a computerized system to assess the quality of Chinese Sign Language interpreting produced by 36 trainee interpreters. Overall, our analysis of quantitative and qualitative data provided preliminary evidential support for the validity and utility of CJ in SLI assessment. We discussed these results in relation to previous SLI literature, and suggested future research to cast light on CJ’s usefulness in applied assessment contexts.
Keywords
For many deaf and hard of hearing people, access to educational, medical, legal and other public services hinges largely on sign language interpreting (SLI) (Marschark et al., 2004; Van Dijk et al., 2011; Xiao et al., 2015). Provision of quality SLI services is, therefore, of paramount importance to ensure the welfare of deaf and hard of hearing citizens and, more broadly, social equality and accessibility. To achieve better SLI quality, researchers need to disambiguate the concept of “interpreting quality” (De Wit & Sluis, 2014; McKee, 2008), because only when a clear understanding of what constitutes quality interpreting is obtained can SLI quality be accurately defined and gauged. Trainers and educators also need to improve pedagogical practices in order to help more student interpreters meet increasingly stringent graduation requirements. Furthermore, interpreter certification authorities (as gatekeepers of professional practice) need to institute efficient mechanisms to screen competent practitioners.
Arguably, it is critical to the above endeavors to measure the quality of SLI in a reliable and valid way, so that high-stakes decisions (e.g., admission, selection, professional certification) can be made with confidence. Specifically, in SLI-related research, assessment of SLI usually produces quantitative measures of interpreting quality, to be correlated with other variables of interest (e.g., personality traits; see Rudser & Strong, 1986), or used as dependent variables to investigate potential effects of independent variables (e.g., directionality; see Van Dijk et al., 2011). In training and education, formative assessment of SLI aims to generate feedback and foster student self-directed learning (Witter-Merithew et al., 2001) and summative assessment is conducted to determine the final achievement of students (Bontempo & Hutchinson, 2011; Schick et al., 1999). In professional certification, testing and assessment of SLI constitutes an indispensable component, evidenced by major certification testing systems around the world (e.g., Australia’s National Authorities for Translators and Interpreters/NAATI testing, the Association of Visual Language Interpreters of Canada/AVLIC testing, the USA’s Registry of Interpreters for the Deaf/RID certification; see also Russell & Malcolm, 2009). These systems invariably require test candidates to interpret between spoken and signed languages in a test situation.
Central to these testing practices is rater-mediated assessment of SLI, based on a given scoring method. In the literature, there has been a diverse array of scoring methods used to evaluate and assess SLI quality, including impressionistic scoring (Strong & Rudser, 1986; Van Dijk et al., 2011), error analysis (Cokely, 1986), item-based scoring (González et al., 2010; Van Dijk et al., 2011), multi-methods scoring (Strong & Rudser, 1985), and rubrics-referenced, scale-based scoring or rubric scoring (Bontempo & Hutchinson, 2011, NAATI, 2019; Schik et al., 1999; Wang et al., 2015). Such methodological plurality attests to the persistent efforts of SLI researchers to refine and innovate scoring practices with the aim of achieving reliable and valid measurement.
To contribute to previous efforts, we conducted a methodological exploration in the present study, trying to utilize an alternative method, known as comparative judgment, to assess SLI quality. The method of comparative judgment (hereafter CJ), rooted in psychophysical analysis (Thurstone, 1927), is used to scale perceived magnitude of a physical stimulus such as loudness and brightness. Human judges need to compare two like objects (e.g., in our study, two renditions) and make a dichotomous decision about their relative quality (i.e., choosing the rendition with higher quality). The dichotomous outcomes from a series of comparisons between different pairs of renditions by a panel of judges are then modeled statistically to produce standardized estimates for the quality of each rendition. These estimates can be used to locate each rendition along a continuum of perceived quality. The outcome of the process is a scaled rank order (i.e., a logit-based scale) of all renditions from worst to best quality.
Apart from our intention to extend earlier explorations, another motivation behind the study was to evaluate the usefulness of comparative judgment in SLI assessment, given that it reportedly has the potential to mitigate or even circumvent a number of problems associated with the previous scoring methods (e.g., labor-intensiveness, extensiveness of rater training; see Pollitt, 2012; Steedle & Ferrara, 2016). Thus, in the study we recruited a group of expert judges to operationalize comparative judgment via an online platform to assess Chinese Sign Language (CSL) interpreting in the voice-to-sign direction. We draw on Weir’s (2005) socio-cognitive validation framework to evaluate the criterion-related validity, scoring validity, and utility of the comparative judgment method.
Literature review
In this section, we first review previous SLI literature, focusing on the concept of “SLI quality” and highlighting current consensus on its definition. We then provide an overview of the relevant scoring methods used to evaluate SLI, and foreground their respective strengths and potential weaknesses. Last, we introduce the method of CJ, expound underlying rationales, and describe its applications in relevant assessment contexts. By doing so, we hope to establish a knowledge base for the current study, and to provide a conceptual argument for the utility of CJ in SLI assessment.
Quality of sign language interpreting
“Quality” in SLI can be a contested construct, 1 subject to different understanding and description by different stakeholders (e.g., consumers, employers, practitioners, researchers) based on the motives, needs and knowledge base they bring to specific interpreted interactions (De Wit & Sluis, 2014; McKee, 2008; Xiao & Yu, 2009). Such differences, however, seem to be more of degree than of kind. The quality of SLI generally revolves around a common set of parameters or criteria, although different weightings may be assigned to individual criteria. For instance, in a survey study to understand the quality of SLI among signed and spoken language interpreters of diverse experience in New Zealand, McKee (2008) identified three major criteria to characterize quality SLI, including accuracy, target message clarity, and professionalism and ethical conduct. However, there was considerable diversity regarding how the interpreters rank-ordered the relative importance of these criteria. In Xiao and Li’s (2013) survey of quality of CSL interpreted news on Chinese TV, deaf viewers listed “comprehensibility” as the top criterion, followed by “smooth delivery with moderate speed”. In another study to explore the quality of sign language interpreters in the Netherlands, De Wit and Sluis (2014, p. 78) reported that the deaf sign language users weighed relevant quality criteria differently as a function of different communicative contexts. Nevertheless, they all prioritized the criterion of faithful and understandable interpretation.
Put simply, SLI quality is conceptualized as a multifaceted and multidimensional construct. In general, the previous literature suggests four major quality dimensions that can be used to characterize interpreted rendition, including (a) informational fidelity, (b) sign language use, (c) presentational features, and (d) strategic responses. Each of these dimensions is described below.
Informational fidelity refers to the degree of faithfulness of target language rendition, and usually subsumes such notions as accuracy and completeness (Bontempo & Hutchinson, 2011; Cokely, 1986; De Wit & Sluis, 2014; McKee, 2008; Russell & Malcolm, 2009; Strong & Rudser, 1985; Van Dijk et al., 2011; Wang et al., 2015). These notions can be further operationalized as the presence/absence of miscues (i.e., omissions, additions, substitutions, intrusions, and anomalies; see also Cokely, 1986; Wang et al., 2015).
Sign language use pertains largely to characteristics of how sign language is used in interpreting. Relevant characteristics can be categorized into two groups. The first relates to manual aspects of sign language, including clarity of signs/fingerspelling (e.g., hand shape, movement, placement, and orientation), appropriateness of vocabulary and register (e.g., specialized terminology, language style), and correctness of grammar and structure (e.g., grammaticality, use of space, classifiers, tenses, indexing) (see Bontempo & Hutchinson, 2011; Russell & Malcolm, 2009; Strong & Rudser, 1985; Wang et al., 2015). The second relates to non-manual aspects of sign language (i.e., non-manual markers/signals), including mouthing, eye gazing, facial expressions, body shifting, and head tilting (Bontempo & Hutchinson, 2011; De Wit & Sluis, 2014; Russell & Malcolm, 2009; Wang et al., 2015). These non-manual markers/signals are important in sign language, as they are used to modify verbs, adjectives, and other adverbs, and also to convey grammatical information such as constructed dialogue and sentence types (e.g., wh-question).
Presentational features concern how a rendition is delivered by sign language interpreters to target audiences. Closely associated with “delivery features” in Wang et al. (2015) and Xiao and Li (2013), and “fluency” in Bontempo and Hutchison (2011), presentational features include fluency/disfluency (e.g., pauses, hesitations), smoothness, rhythm, and pace, as well as control and flow of language.
Finally, strategic responses have to do with interpreters’ meta-cognitive decision making to manage the interpreting process. Specifically, interpreters make strategic decisions to adjust time lag (i.e., decalage or voice-sign span), to switch between free-literal interpretation continuum (i.e., interpretation versus transliteration), to deploy tactics to reduce cognitive load and ensure comprehensibility (i.e., strategic omission, anticipation), and to manage overlap and turn-taking in dialogic interactions (Bontempo & Hutchinson, 2011, “interaction/role aspects”; Wang et al., 2015, “processing skills”).
In conclusion, our review of the previous literature shows that SLI educators, researchers and testers have mainly drawn on the above four macro-level criteria to assess and evaluate SLI quality, although definitions of quality parameters may differ from one context to another due to divergent assessment purposes and theoretical frameworks of SLI quality. As such, it can be argued that the validity of any scoring methods, current and future, rests on the extent to which the multifaceted and multidimensional nature of SLI quality can be operationalized and represented in relevant scoring guides. For a rater-mediated assessment of SLI quality to be valid, raters should base their evaluative judgment or scoring decisions on relevant quality criteria agreed on by SLI stakeholders.
Assessment of sign language interpreting
To generate quantitative measures of SLI quality, educators and researchers have trialed and applied at least five scoring methods, including impressionistic scoring, error analysis, item-based scoring, multi-methods scoring, and rubric scoring (see also Han, 2021).
Impressionistic scoring usually requires raters to rely on general impressions to estimate the overall quality of an interpreted rendition, based on a polytomous scale. For instance, Van Dijk et al. (2011) solicited the judges’ opinion about SLI quality by asking them to respond to the question “How good do you think the interpreted narrative is in comparison to the source narrative?” based on a seven-point scale (see also Strong & Rudser, 1986). Although impressionistic scoring seems to be quick and convenient, it may fail to capture the multifaceted construct of SLI quality (i.e., construct underrepresentation) and is susceptible to rater bias. Consequently, it is considered an ad hoc/expedient scoring method, usually restricted to research settings (see Strong & Rudser, 1986; Van Dijk et al., 2011).
The error analytic method, illustrated by Cokely’s (1986) taxonomy of interpreter miscues (e.g., omission, addition, substitution), is based on human coders’ meticulous analysis of target language rendition against source language message to detect and classify errors or miscues according to a given typology. An analysis of this kind focuses mostly on lexical items (in addition to morphemes and non-manual signals) and produces frequency counts as an indicator of SLI quality. Essentially, coders use a dichotomous scale (e.g., 1 = “correct”, 0 = “incorrect”) to evaluate whatever instances of rendition he or she may consider as being potentially problematic. Despite the fact that error analysis has the potential to generate a nuanced description of an interpreted rendition (in terms of its weaknesses), the validity of such analysis depends on the theoretical soundness of error typology and on the degree of inter-coder agreement. This method is also labor intensive and time consuming. As such, error analysis remains largely an analytic method for SLI research (see Cokely, 1986).
Item-based scoring, exemplified by González et al. (2010), who describe a trilingual interpreter proficiency test in the USA (involving English, Spanish, and ASL), requires raters to apply a dichotomous scale (i.e., 1 = “acceptable”, 0 = “unacceptable”) to evaluate a set of preselected, expert-judged scoring stimuli (i.e., scoring units or items) that reflect critical lexical, syntactic and discursive elements of source language (see also Van Dijk et al., 2011). In this way, item-based scoring represents an enhanced version of the error analytic method. Although both methods focus mostly on local errors, item-based scoring predetermines a list of important items informed by empirical job analysis and expert panels, whereas in the error analytic method the origin of potential errors is subject to individual coders’ judgment. The itemized approach potentially enhances objectivity of the method, as raters’ scoring consistency has reportedly improved (see González et al., 2010). Nonetheless, it is still unknown how global aspects of SLI (e.g., informational completeness, overall fluency) could be assessed with this method. Equally uncertain is its practicality and efficiency, particularly considering that González et al. (2010, pp. 74–75) employed consensus scoring (i.e., raters resolve scoring discrepancies on any disputed items by reaching a consensus among a group of raters) to evaluate a relatively large number of scoring units in each rendition.
Multi-methods scoring seems to be a confluence of impressionistic scoring and error analysis, as demonstrated by Strong and Rudser (1985), wherein raters need to analyze interpreters’ output by responding to five questions about each proposition (i.e., a unit of text that carries a single semantic idea). In that study, Question 1 asked raters to use a four-point scale to indicate the level of accuracy of a given proposition, which resembles the impressionistic scoring method. Then, Questions 2, 3, and 5 required raters to enumerate possible miscues, based on error analysis of each proposition. Scores obtained in each question were then aggregated as the measure of SLI quality. Although Strong and Rudser (1985) provided preliminary evidence of inter-rater reliability regarding the aggregated scores, it is uncertain whether raters’ individual decisions made on each question were consistent (e.g., one problematic instance of rendition could be classified by different raters as different types of error). In addition, it seems that the multi-methods scoring approach inherits, and compounds, the weaknesses of both impressionistic scoring (e.g., construct underrepresentation) and error analysis (e.g., labor intensiveness).
Rubric scoring has been gaining traction in SLI assessment (Bontempo & Hutchinson, 2011; NAATI, 2019; Schick et al., 1999; Wang et al., 2015), echoing a similar trend in spoken-language interpreting and written translation assessment (see Han, 2018, 2020). In brief, the rubric scoring is characterized by raters’ utilization of a rubric-referenced analytic rating scale to assess SLI quality. Usually, a rating scale is defined by multiple macro-level assessment criteria, each of which encompasses detailed descriptors focusing on a number of micro quality criteria and corresponding to each level of an SLI performance continuum. When assessing SLI, raters need to attend to each assessment criterion and provide separate scores. A case in point is the analytic rating scale described in Wang et al. (2015) to assess English-to-Auslan interpreting. It consists of four macro assessment criteria with differential weightings, including (a) accuracy/equivalence and completeness of message, (b) target text features (i.e., grammaticality, idiomaticity, register, and affect), (c) delivery features/public speaking (i.e., clarity of production, fluency, prosody), and (d) processing skills (i.e., time lag, free-literal interpretation, strategic operations), with relevant descriptors being provided for each of the five performance levels (i.e., poor, average, good, very good, excellent). The rubric scoring seems to be an efficient method, given that it reflects fairly well the multifaceted construct of SLI quality and is capable of generating multiple scores in a relatively short period of time. However, findings from Wang et al. (2015) suggest moderate inter-rater reliability on rubric scores overall (i.e., Pearson’s r = .66 across three rater pairs), statistically significant differences in rater severity, and differential use of the rubrics among the raters.
Taken together, the developmental trajectory of the scoring methods outlined above demonstrates the ongoing scholarly effort to ameliorate current practices and to search for efficacious solutions. Apart from the specific weaknesses associated with each scoring method, there are three common issues that may render their application less appealing. First, almost all the methods entail extensive preparation to make scoring possible. For example, in terms of error analysis, orthographic transcription of both source and target texts is a prerequisite to comparative evaluation (see, e.g., Cokely, 1986); regarding item-based scoring, the preselection of scoring units relies heavily on collective expert judgment. Preparatory work of this kind is necessarily repetitive, tedious, and laborious. Second, even after all the groundwork is laid, rigorous rater training is considered a desideratum for achieving rater consistency (e.g., González et al., 2010; Wang et al., 2015), which should involve conceptual introduction, pilot scoring, norming, and interactive discussion (see Han, 2018). Such training may take hours, if not days, to ensure a consistent understanding of the assessment construct among raters and to achieve a desirable level of rater reliability (Han, 2018). Third, when scores are obtained from different raters, one still needs to decide on a score resolution method to generate final scores for decision making. However, there has been no broad-based agreement on the best practice of score resolution in SLI assessment. Some prefer consensus scoring (e.g., González et al., 2010), while others seem to rely on composite scoring (i.e., the parity method) whereby final scores are formed by summing or averaging all original scores from different raters (e.g., Strong & Rudser, 1986; Van Dijk et al., 2011). These potential weaknesses justify our search for alternative methods to mitigate and circumvent existing problems.
Comparative judgment
As has been described previously, the method of CJ involves judges comparing one object against another in terms of a global construct. The rationale underpinning CJ is Thurstone’s Law of Comparative Judgement (Thurstone, 1927), which, in simplistic terms, is that humans tend to be more reliable and accurate when making relative judgment (such as pairwise comparison) than making absolute judgment (i.e., deciding on the value of an object in isolation as in the case of rubric scoring). In theory, the relative nature of CJ contributes to the reliability of CJ-based measurements. Previous application of CJ in educational assessment indicates that the scale (i.e., rank-ordering or the scaled continuum of a perceived property) created by CJ can be highly reliable, according to scale separation reliability (SSR) indices (ranging from .62 to .93 with an average of .80; see Verhavert et al., 2018).
Given that CJ does not impose specific criteria on judgment, there is a legitimate concern over the judges’ reliance on personal preferences in making binary decisions, thus making CJ-based measurements less objective and valid. However, according to previous literature in which problem solving in mathematics, students’ understanding of chemistry experiments, and English essay writing have been assessed (e.g., Jones & Inglis, 2015; McMahon & Jones, 2015; Steedle & Ferrara, 2016), the validity of CJ is grounded in cumulative consensus by a group of expert judges over a series of repeated paired comparisons conducted individually.
A number of safeguards are built into CJ to ensure its validity. First, CJ involves expert judges who have developed in-depth understanding of a given construct and accumulated extensive experience of evaluating it. The rationale behind this requirement is that expert judges are, by any rate, more likely to make valid judgments than non-experts. Second, CJ requires a relatively large number of expert judges (i.e., strength in numbers). For instance, in a meta-analysis of 27 CJ-based assessments, Verhavert et al. (2018) found that the average number of judges in CJ was 28, dwarfing that of raters in traditional SLI assessment (typically two to three raters). Indeed, CJ deliberately draws on collective wisdom in modeling judges’ decisions statistically. Third, each judge must complete multiple paired comparisons. According to the meta-analysis by Verhavert et al. (2018), an average of 20 comparisons are conducted by each judge and the objects of the researchers’ interest are compared 27 times on average. Lastly, although each judge makes decisions on their own, the compared objects are deliberately connected between judges (i.e., data connectivity). Here, we illustrate with a very basic scenario in which four objects (i.e., A, B, C, and D) are compared by two judges (i.e., Judges 1 & 2): one out of many ways to establish connectivity is that Judge 1 conducts CJ on any possible pairs of A, B, and C, while Judge 2 conducts CJ on pairs of B, C, and D. In this scenario, the object of B serves as a Connecter, potentially linking all pairwise comparisons. Conceivably, expert judges may still rely on their idiosyncrasies to make judgments from time to time. The iterative process of CJ, however, helps accommodate the potentially heterogeneous understandings of a given construct among a community of expert judges (Jones & Inglis, 2015). As such, a broad homogeneity across judges’ interpretations of a construct could be expected (McMahon & Jones, 2015). Ultimately, the validity of CJ-based measurements hinges on the collective expertise of judges making multiple comparisons that involve different objects.
Apart from claims concerning reliability and validity, CJ seems to be more practical than traditional SLI scoring methods. To begin with, CJ involves little preparatory arrangement such as transcription of target texts and preselection of scoring units. All it requires is a scheme for making pairwise comparison, which can be facilitated by many user-friendly computerized systems/platforms (e.g., ACJS, e-scape, No More Marking, Pair-Wise). Additionally, unlike traditional scoring methods that necessitate extensive rater training prior to operational scoring, virtually no training is required for judges in CJ beyond a minimal briefing session to introduce judges to the method (Jones & Inglis, 2015; Steedle & Ferrara, 2016). Furthermore, because of its relative nature, CJ may expedite decision making, which stands in contrast to absolute judgment (e.g., rubric scoring) that requires raters to pinpoint an exact value for SLI quality. Last, as statistical modeling (e.g., Bradley–Terry–Luce model, Rasch logistic model) involved in CJ considers, by default, all binary decisions from all judges, there is no need to decide on a score resolution method, which has led to controversies among SLI testers using other methods (i.e., composite versus consensus scoring). However, one limitation of CJ would be that it typically requires a relatively large number of judges to be involved in paired comparison, which may make the method less practical in certain settings.
Despite these reported advantages, there has been very little research so far to trial CJ in SLI assessment. In particular, to the best of our knowledge, no researchers have investigated the reliability, validity and utility of CJ in the context of SLI quality assessment. Against this background, we conducted this exploratory study to pilot and evaluate the method of CJ in assessment of CSL interpreting. Our purpose for doing so is two-fold: a) to expand the boundary of SLI assessment, and b) to interrogate the usefulness of CJ in a relatively new assessment terrain. Specifically, we investigated four research questions (RQ) in the present study:
RQ1: To what extent are comparative judgments of CSL interpreting reliable?
RQ2: To what extent are comparative judgments of CSL interpreting valid in relation to a criterion measure (i.e., criterion-related validity)?
RQ3: What quality criteria do judges draw on to make comparative judgments of CSL interpreting (i.e., scoring validity)?
RQ4: How do judges perceive the utility of comparative judgment?
Method
Recordings of Chinese Sign Language interpreting
In the current study, we evaluated a total of 36 CSL interpretations. These interpretations were sourced from a larger corpus of 100 video recordings of voice-to-sign simultaneous interpreting collected from an educational assessment. In the assessment, the interpreters, who were freshman and sophomore SLI majors, interpreted for a 395-word, two-and-a-half-minute speech delivered by a native Mandarin Chinese speaker on the topic of deaf people’s access to public services in China and the USA.
After the assessment, the students answered a questionnaire, providing background information (e.g., gender, age, year of study). For the sake of practicality, we used stratified random sampling to draw 36 video recordings to be evaluated in our research. These selected samples were expected to represent different qualities of interpretation.
Judges
To evaluate the interpretations, we recruited a total of 12 judges (denoted by J01 to J12) and asked them to complete a questionnaire on their background. The reason why we were only able to recruit 12 judges in our study, which is lower than the average of 28 judges reported in Verhavert et al.’s (2018) meta-analysis, is the limited availability of qualified judges for assessing Chinese SLI. Table 1 summarizes relevant information about their background.
A summary of demographic information of the judges.
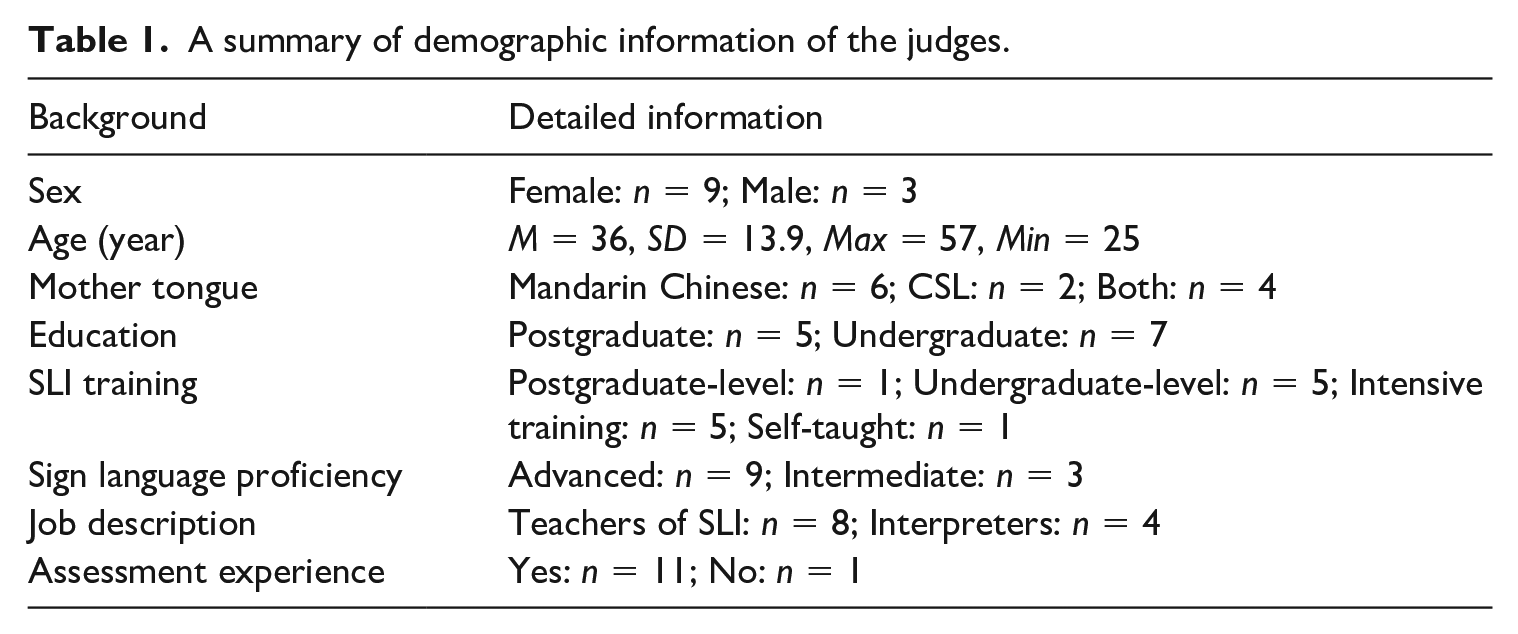
The judges had an average age of 36; most of them were female (n = 9, 75%), with only three male judges. In terms of language background, four judges self-reported both Mandarin Chinese and CSL as their mother tongues, six indicated Mandarin Chinese as their native language, and the remaining two were native signers. Regarding educational background, five of the judges (41.7%) had obtained postgraduate degrees; all judges had received at least intensive training on SLI, with six having been trained professionally. In addition, 75% of the judges (n = 9) identified themselves as advanced users of CSL (i.e., being able to use the language competently and fluently in different contexts). With regard to their employment, eight judges were primarily teachers of SLI (five of them were semi-active interpreters working on a piecemeal basis), and four judges were full-time sign language interpreters who interpreted for public/private events on a weekly basis. Almost all of them (n = 11) indicated that they had prior experience of evaluating SLI (e.g., educational assessments, corporate appraisals, interpreting contests), but had never heard of or used CJ. Based on this body of data, we were confident that this group of judges could be considered a community of SLI experts.
Computerized comparative judgment system
In the study, we relied on a computerized online system, called No More Marking (NMM) (https://www.nomoremarking.com/), to operationalize CJ and compute relevant results, primarily because the NMM system is freely available. Within this system, judges work in unique environments in which, for each judgement, two randomized objects to be compared are presented on the computer screen side by side. Judges are required to evaluate the two objects and select the one that has a higher level of a given quality by clicking a “left” or “right” button. Judges can also provide qualitative justifications for their decisions by typing their comments in a pop-up box (by clicking a comment button). Although providing such justification is not mandatory in the NMM system, we asked our judges to do this (as can also be seen below). All of the above information is automatically recorded in the NMM system for detailed analysis later.
Despite its functional convenience, the NMM system is somewhat restrictive when it comes to the content to be uploaded to its system. It allows users to upload only scanned written works in PDF format (e.g., writing samples, translated texts), thus precluding the transfer of video-based interpreting recordings online. To overcome this problem, we first coded each recording as, for example, S75, meaning that the recording was from Student no. 75. We then copied the codes (i.e., a total of 36 codes corresponding to the video recordings) into 36 PDF files, each file containing only one coding. Next, we uploaded the PDF files into the NMM system, so that a random list of paired codes could be generated. Finally, we sent the 36 video recordings (each about 2.5 minutes) to each judge via email. When conducting CJ, each judge could therefore view/listen to the pair of videos, as indicated by the NMM system, evaluate their quality, and make binary decisions.
Operationalization of comparative judgment
Before the official CJ, we provided a brief training of about one hour to the judges. Specifically, we sent them the transcript of the source-language speech and asked them to familiarize themselves with its content. We also introduced the method of CJ and the NMM system, and provided a detailed explanation on how to conduct CJ. We emphasized that each judge only needed to choose the better interpreted version, based on their own understanding of SLI quality. We further guided the judges to register and have a trial run of completing four pairwise comparisons.
On the following day, we asked the judges to evaluate the 36 recordings independently and submit their results within one week. Essentially, they needed to make binary decisions and provide justification. The judges evaluated the interpretations against the source speech and/or its transcript.
Given the 36 recordings, the number of all possible pairwise comparisons is 36 × (36−1)/2 = 630, which would represent a substantial amount of work for each judge. Previous research suggests that judgments from a relatively small number of pairings can lead to a satisfactory level of scale separation reliability (McMahon & Jones, 2015; Pollitt, 2012). Furthermore, a meta-analysis on the reliability of CJ shows that 10–14 judgments per performance can result in reliability levels (i.e., scale separation reliability) of .70 (Verhavert et al., 2019). Based on this information, we asked each judge to complete 30–33 judgments, and the NMM system also ensured that each recording was evaluated at least 10 times.
The rubric scoring-based criterion measure
In order to produce a criterion measure, we recruited another four raters to use Wang et al.’s (2015) analytic rating scale (see also the “Literature review” section above) to assess the same 36 SLI performances. The four raters were all CSL interpreting educators and practitioners, with an average age of 44.5 years old. Wang et al.’s scale consisted of four five-point sub-scales featuring the following: (a) accuracy/equivalence and completeness of message, (b) target text features, (c) delivery features/public speaking, and (d) processing skills. We implemented a fully crossed rating design in which each rater assessed each SLI performance on the four rating dimensions. Given that Wang et al.’s (2015) rubrics cover a wide range of quality dimensions and, arguably, is the only validated scale for SLI assessment, we treated the results from the four raters as the criterion measure to be compared with the CJ-based results, thus producing criterion-related validity evidence.
Post-hoc questionnaire
Once the judgments were completed, we sent an electronic questionnaire to each judge involved in CJ, eliciting their perceptions, comments and feedback. The questionnaire consisted of nine open-ended questions (for details, see Supplementary Data), four of which are particularly relevant to our study (i.e., Questions 1, 2, 8, and 9). In Question 1, we tried to understand what aspect(s) of SLI the judges had relied on when making decisions; in Question 2, the judges were asked to nominate the five most important criteria they had relied on in CJ and rank them according to their importance; in Question 8, we examined the judges’ perceptions about potential advantages and disadvantages of CJ-based assessment; and in Question 9, we asked the judges to suggest possible assessment contexts where CJ could be fruitfully used. Ten judges returned their filled questionnaires to us (a response rate of 83%).
Data analysis
Analysis of the binary comparative judgments
The binary decisions by the judges were automatically analyzed in the NMM system, based on the Bradley–Terry–Luce model (Bradley & Terry, 1952; Luce, 1959). However, given that the printout from the NMM system provides a limited amount of statistical information (e.g., homogeneity index being absent), we also performed Rasch analysis, via FACETS 3.80.0, on the same set of the binary data to produce logit-based estimates of student ability (or the quality of the videos), as well as other useful statistics including homogeneity index (Q), separation (strata) index (H), and separation reliability (R) (see Eckes, 2015). In particular, we followed Linacre’s guide to analyze pairwise comparison data. 2 We modeled the rater facet as a dummy facet used only for fit analysis, weighed each observation (i.e., “win = 1” or “lose = 0” decision) by 0.5, and 3) input every observation in the file twice (for details of our FACETS script, see Supplementary Data). According to Linacre, these set-ups could increase computational stability.
To answer RQ1 (i.e., reliability), we provided two types of statistical evidence concerning (a) each judge’s internal self-consistency, indicated by judges’ infit statistics, and (b) scale separation reliability (SSR), indicating the reliability of the scale produced by CJ (which is actually the separation reliability index for the student/person facet). Here, the infit statistics can be used to evaluate whether a given judge has behaved consistently in relation to other judges in the group. Again, because of the exploratory nature of our study, we chose a relatively loose fit range (i.e., 0.5 < infit < 1.5) to examine judge internal self-consistency (see Wright & Linacre, 1994). Based on the infit values, judges could be categorized into three types: (a) overfitting judges who are overly predictable (i.e., overfit: infit ⩽ 0.5), (b) misfitting or underfitting judges who do not contribute meaningfully to measurement (i.e., misfit/underfit: infit ⩾ 1.5), and (c) acceptable judges whose decision pattern is consistent with the model prediction (i.e., acceptable: 0.5 < infit < 1.5). According to Myford and Wolfe (2003), misfits are more problematic than overfits, because the former can cause more disturbances to the measurement process. In addition, the SSR index can be interpreted similarly to reliability coefficients in classical test theory as the ratio of true variance to observed variance (Verhavert et al., 2018). According to Verhavert et al. (2019), for low-stakes assessment, reliability levels of .70 or higher are deemed sufficient, which we also used in the present study.
Analysis of the rubric scores
To obtain rubric-based, Rasch-calibrated estimates (in logits) of student ability, we again used FACETS 3.80.0 to perform many-facet Rasch measurement analysis on the dataset (students/videos: n = 36; raters: n = 4; assessment criteria: n = 4). To answer RQ2, we provided statistical evidence of concurrent (criterion-related) validity, by correlating the CJ-based logit estimates with the rubrics-based logit estimates of student ability. As such, the Pearson’s correlation coefficients could be considered a proxy measure of criterion-related validity.
Analysis of the judges’ comments on the paired comparisons
In order to understand the substantive meaning underlying the CJ-based measures of SLI quality (i.e., RQ3), we needed to know what assessment criteria had guided the judges to make binary decisions. If the judges factored irrelevant characteristics (e.g., familiarity with candidates’ accent, see Huang 2015) into their decisions, the meaning of the CJ measures cannot be equated with SLI quality as traditionally defined. This aspect of the scoring procedure pertains partly to what Weir (2005) calls scoring validity.
To gain insights into the meaning of the CJ measures (i.e., scoring validity), we analyzed two types of qualitative data: (a) the judges’ comments on Questions 1 and 2 in the post-hoc questionnaire, and (b) the judges’ comments on their CJ decisions. Two trained coders (i.e., two postgraduate students whose research interest was SLI) conducted manifest content analysis of the qualitative data. Informed by the previous literature (see the “Quality of sign language interpreting” section), the coders first scrutinized the data several times to familiarize themselves with the content and to identify tentative themes. Then, the coders discussed with each other and developed an initial coding scheme, based on the literature (primarily Bontempo & Hutchinson, 2011; Strong & Rudser, 1985; Wang et al., 2015) and also the data. They reviewed the data again to fine-tune the themes and proceeded to code the judges’ answers and comments separately. The inter-coder percentage agreement index was 89%, and the coding discrepancies (about 10%) were adjudicated by the first author.
Analysis of the post-hoc questionnaire data
To answer RQ4 (i.e., the perceived utility), we again content-analyzed and coded the qualitative responses to Questions 8 and 9 in the post-hoc questionnaire. In specific, we examined advantages and disadvantages of CJ as perceived by the judges, as well as CJ’s potential applicability in different assessment contexts.
Results
Overall results from Rasch analysis
We conducted multiple Rasch analyses on the two datasets: (a) the judges’ comparative judgments (i.e., the binary data), and (b) the raters’ rubric scores (i.e., the polytomous data). Regarding the binary data, in our first analysis (Binary – Analysis 1), the infit statistic for J07 was larger than 2 (infit = 2.48). We therefore conducted the second analysis (Binary – Analysis 2) without J07. The results show that the infit statistic for J06 was again larger than 2 (infit = 2.45). We therefore conducted the third analysis without J06 (Binary – Analysis 3). Table 2 summarizes overall statistical information for the student/video and the judge facets produced from the Rasch analysis (i.e., Binary – Analysis 3). Regarding the polytomous data, as we identified an excessively large infit statistic for S41 (infit = 5.28) in our first analysis (Polytomous – Analysis 1), we conducted our second analysis (Polytomous – Analysis 2) without S41. We present in Table 3 the overall statistical information for the student/video, the rater, and the criterion facets from the Rasch analysis (i.e., Polytomous – Analysis 2).
Rasch-based statistics for the judges’ comparative judgments (Binary – Analysis 3).
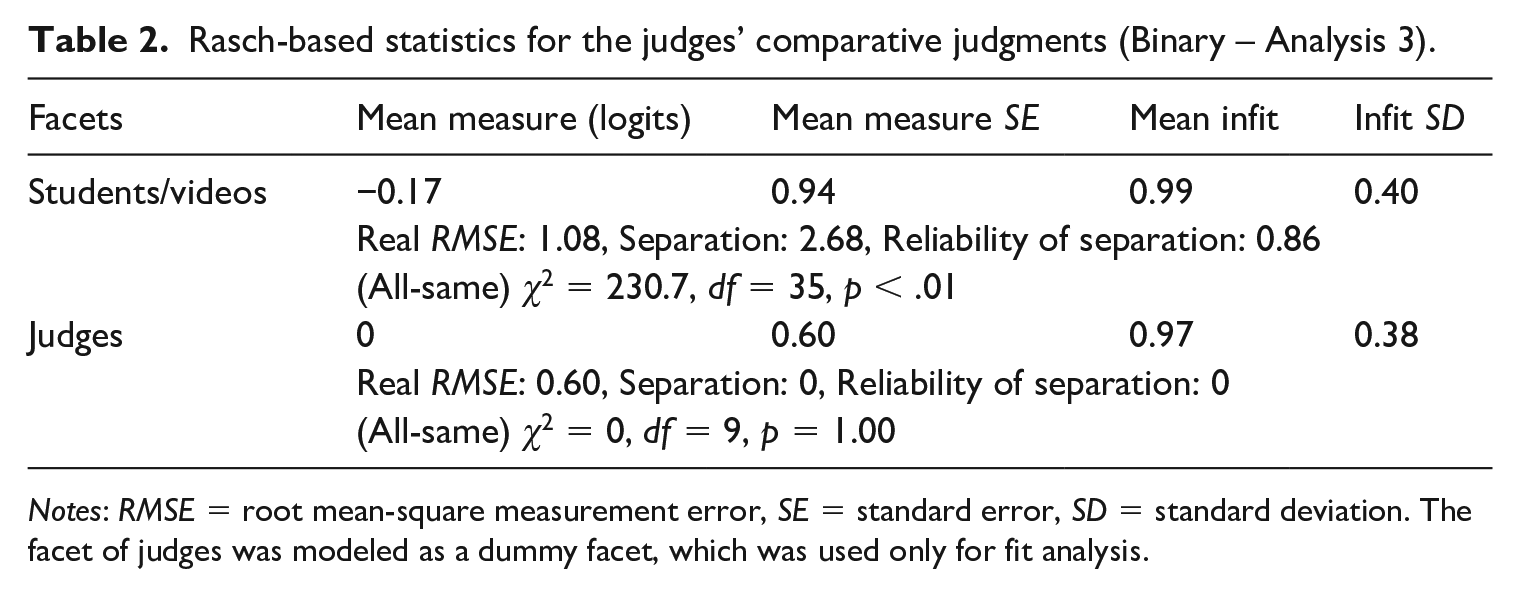
Notes: RMSE = root mean-square measurement error, SE = standard error, SD = standard deviation. The facet of judges was modeled as a dummy facet, which was used only for fit analysis.
Rasch-based statistics for the raters’ rubric scores (Polytomous – Analysis 2).
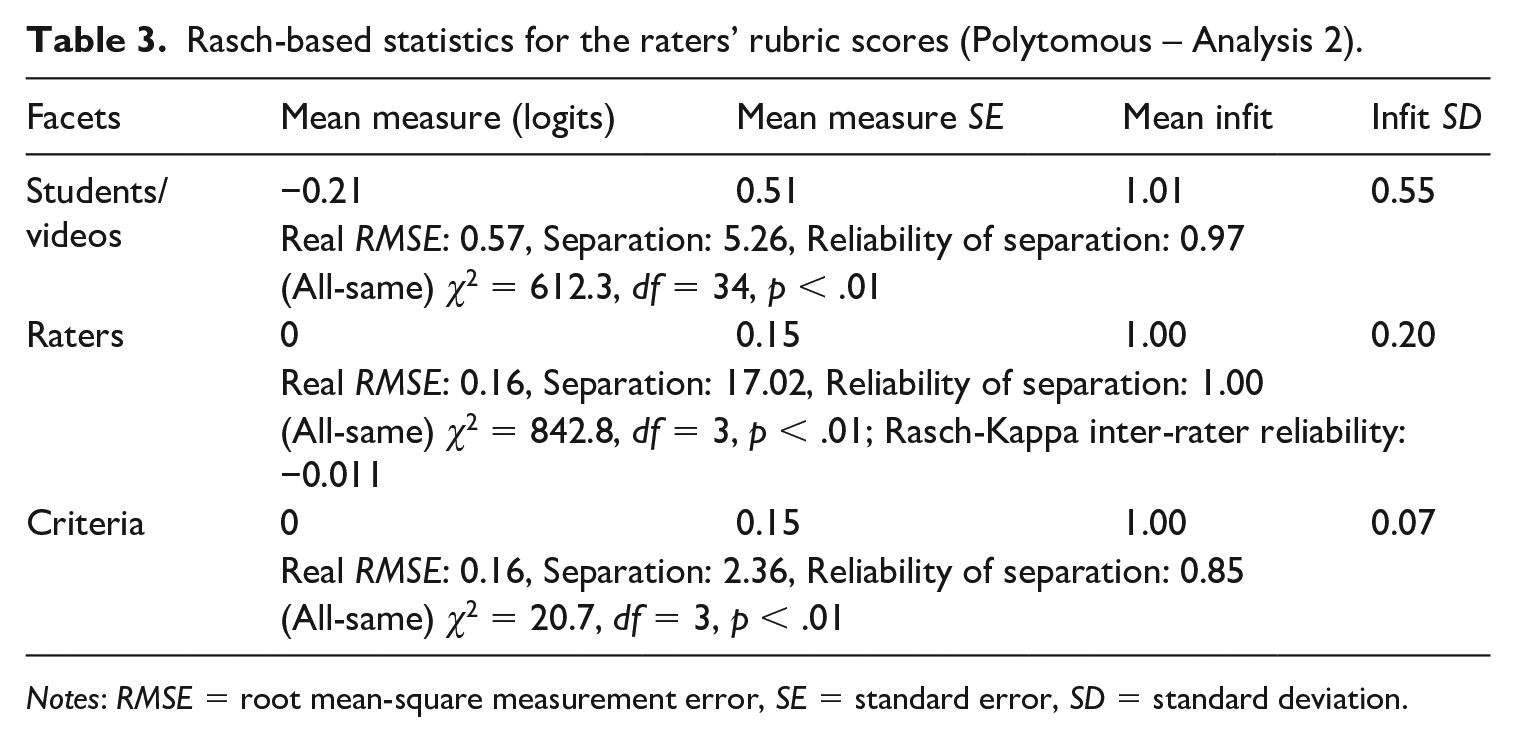
Notes: RMSE = root mean-square measurement error, SE = standard error, SD = standard deviation.
As can be seen in Table 2, the students/videos could be differentiated from one another (regarding their ability/quality) with a relatively high level of reliability (R = 0.86). In Table 3, the Q, R, and H indices suggest that the raters using rubric scoring could be reliably differentiated in terms of their severity. In addition, the Rasch-Kappa inter-rater reliability value was close to zero, meaning that the raters as a group provided ratings that met the rater independence assumption. 3 We need to caution, however, that the values of standard error for the mean logit estimates are relatively large for both the student and the judge facets, meaning relatively low measurement precision. For detailed measurement and calibration results for each facet in each Rasch analysis, see Supplementary Data.
RQ1: Reliability evidence
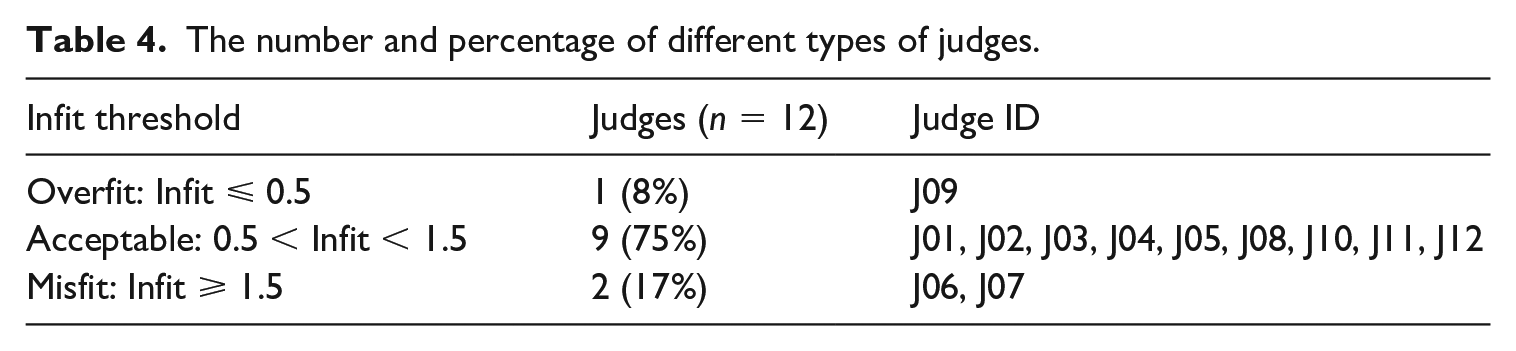
Table 4 summarizes the distribution of overfitting, misfitting, and acceptable judges. As can be seen in Table 4, the majority of the judges (75%) were fairly consistent in their decision making; one judge (J09) was identified as an overfit, and two judges as misfits (J06 & J07). For detailed calibration results concerning the judge facet, see Supplementary Data.
The number and percentage of different types of judges.
In addition, the scale separation reliability (SSR) index reached .86 (as can be seen in Table 2), indicating a relatively high level of reliability of the scale produced by CJ.
RQ2: Criterion-related validity evidence
Concerning the criterion-related validity evidence, the CJ-based logit estimates of student ability had a strong correlation with the rubric-based logit estimates of student ability, Pearson’s r = .793, p < .05. This means that the two scoring methods were able to rank-order the SLI performances in a relatively consistent manner, an indicator of the criterion-related validity of the CJ-based measures.
RQ3: Scoring validity evidence
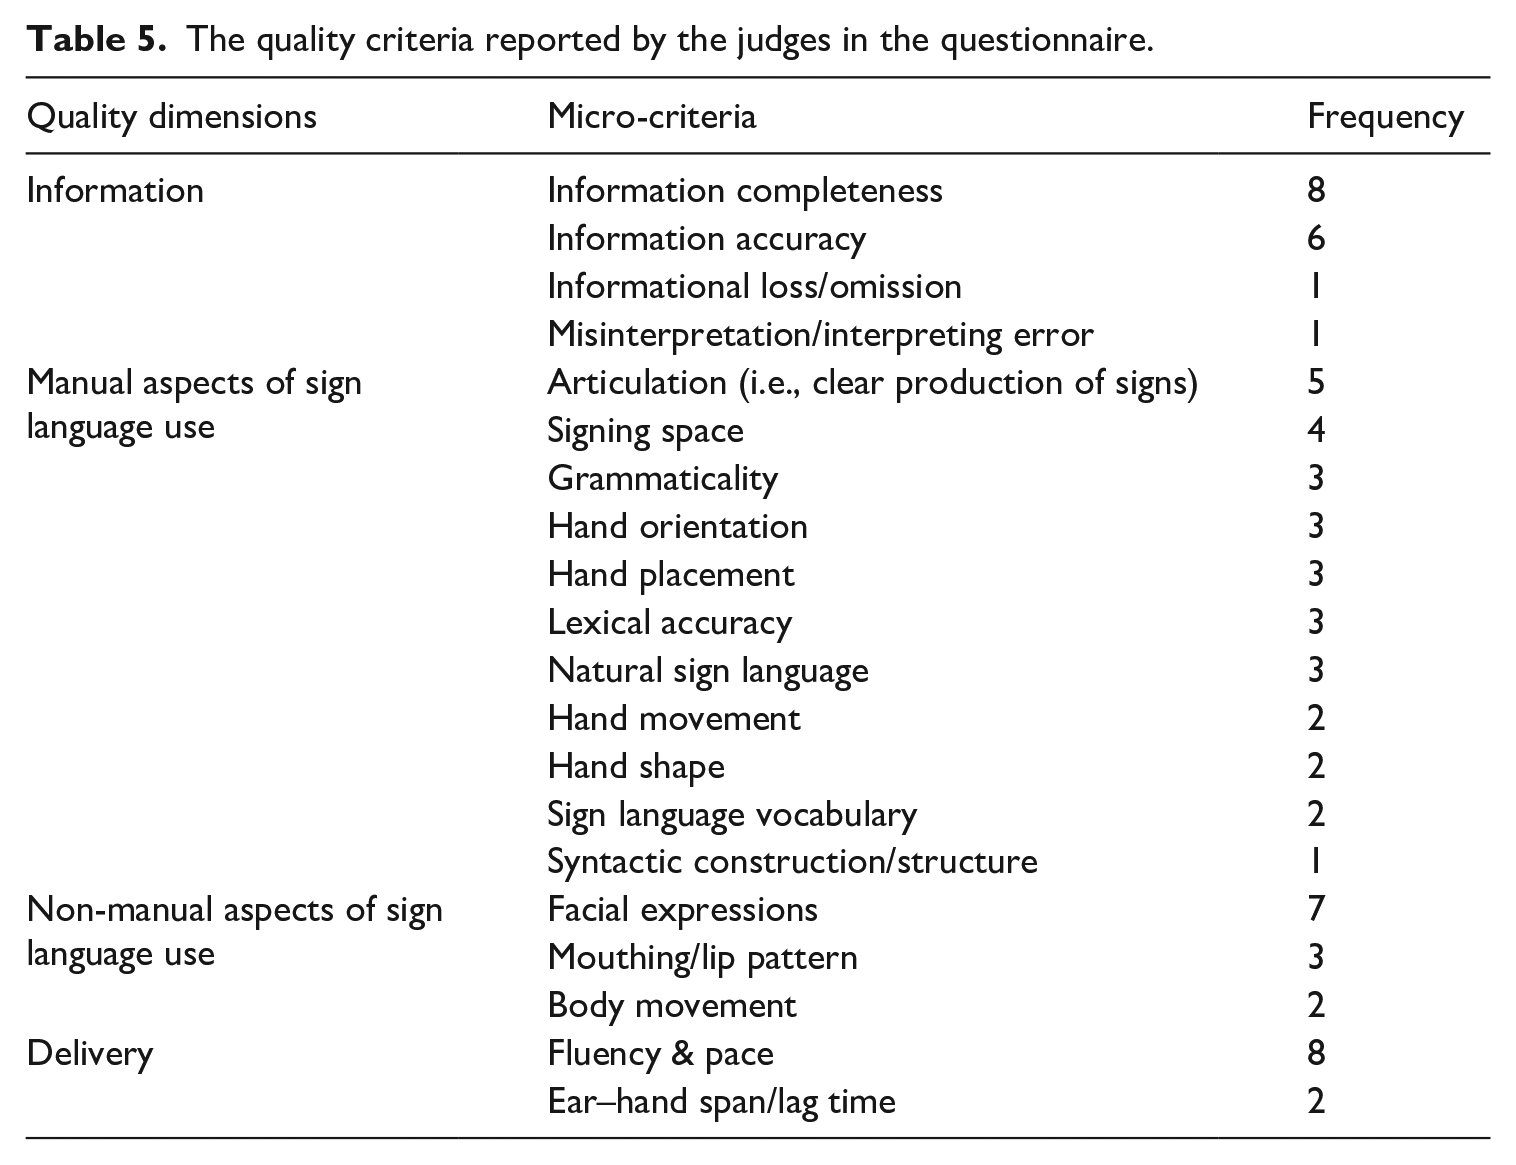
Our content analysis of the questionnaire data shows that, overall, the judges relied on 22 micro-criteria, as can be seen in Table 5. These micro-criteria could be categorized into four major dimensions of SLI quality: (a) information, (b) manual aspects of language use, (c) non-manual aspects of language use, and (d) delivery. It seems that six micro-criteria were mentioned more frequently, including (a) information completeness (n = 8, 12%), (b) fluency and pace (n = 8, 12%), (c) facial expressions (n = 7, 10%), (d) information accuracy (n = 6, 9%), (e) articulation (n = 5, 7%), and (f) signing space (n = 4, 6%).
The quality criteria reported by the judges in the questionnaire.
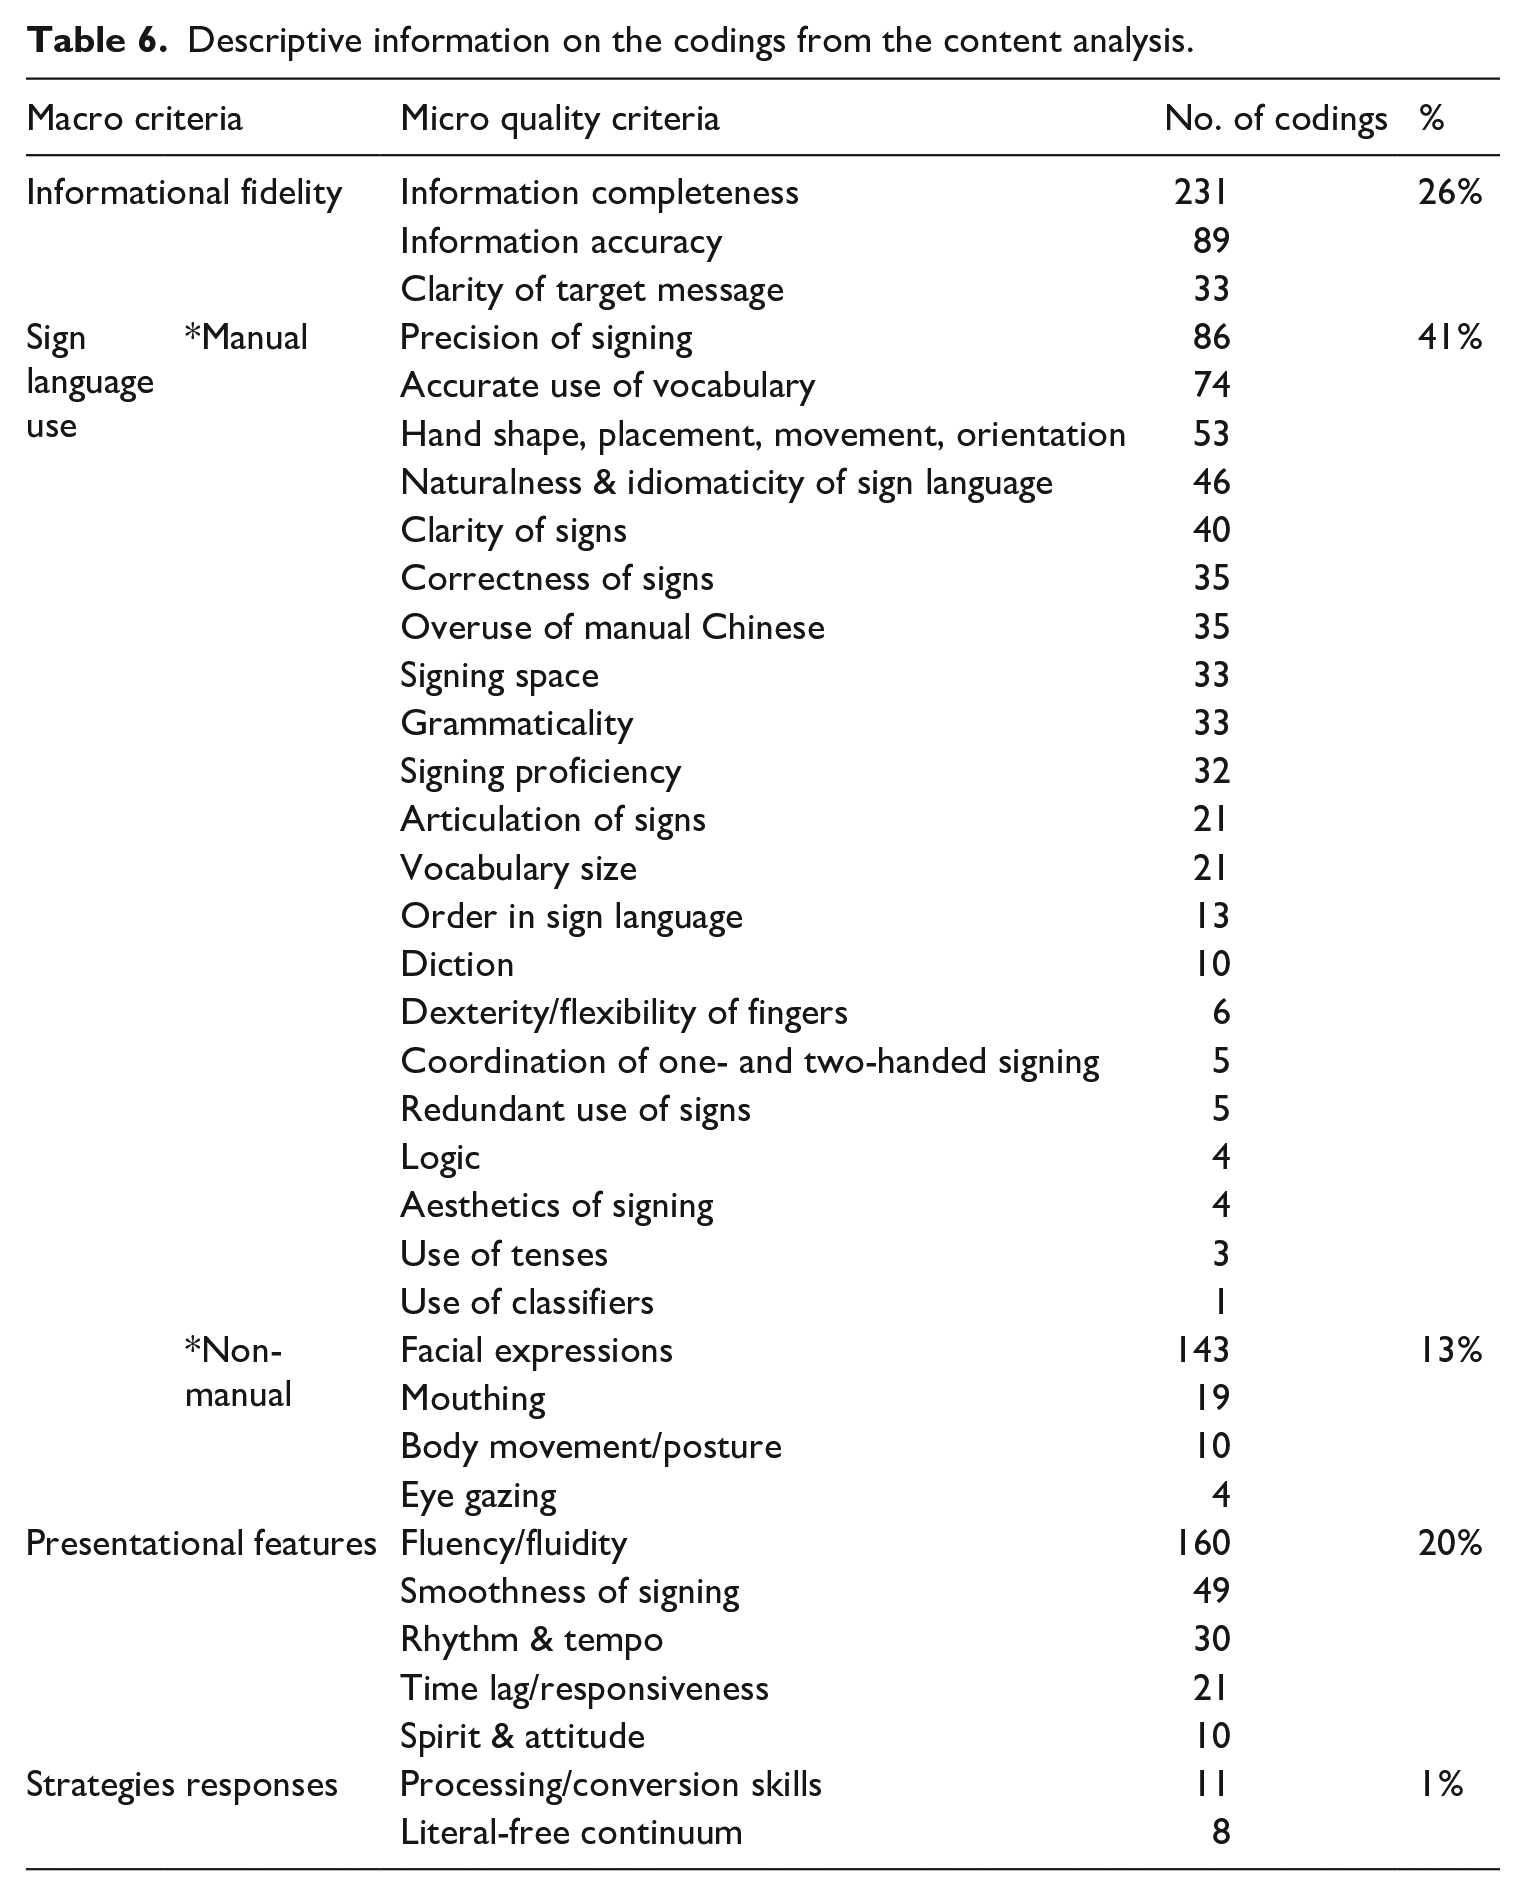
To gain an in-depth understanding of the judges’ decision-making process, we further analyzed the qualitative justification for a total of 370 decisions made by the 12 judges. The content analysis of the judges’ comments resulted in a total of 1378 codings relating to 35 micro quality criteria. 4 On average, each judge relied on four assessment criteria in each decision. As can be seen in Table 6, the 35 micro criteria fell into four major categories corresponding to the four macro-level criteria identified in the literature review. One pattern observed in Table 6 is that the manual aspects of sign language use accounted for the largest proportion of the codes (i.e., 41%), followed by informational fidelity (26%), presentational features (20%), and the non-manual aspects of sign language use (13%). The least coded area seems to be strategic responses (1%). Another pattern is that, overall, the judges seem to have drawn heavily on a few micro quality criteria in their decision making. Using the arbitrary threshold of 70 coded units (i.e., about 5% of all coded units), we were able to identify six significant micro criteria, listed in a descending order according to their frequency count: (a) information completeness (n = 231, 17%), (b) fluency/fluidity (n = 160, 12%), (c) facial expressions (n = 143, 10%), (d) accurate use of vocabulary (n = 74, 5%), (e) information accuracy (n = 89, 6%), and (f) precision of signing (n = 86, 6%). These significant criteria spanned over three macro assessment criteria: informational fidelity (17% + 6%), sign language use including both manual (6% + 5%) and non-manual aspects (10%), and presentational features (12%).
Descriptive information on the codings from the content analysis.
RQ4: Perceived utility
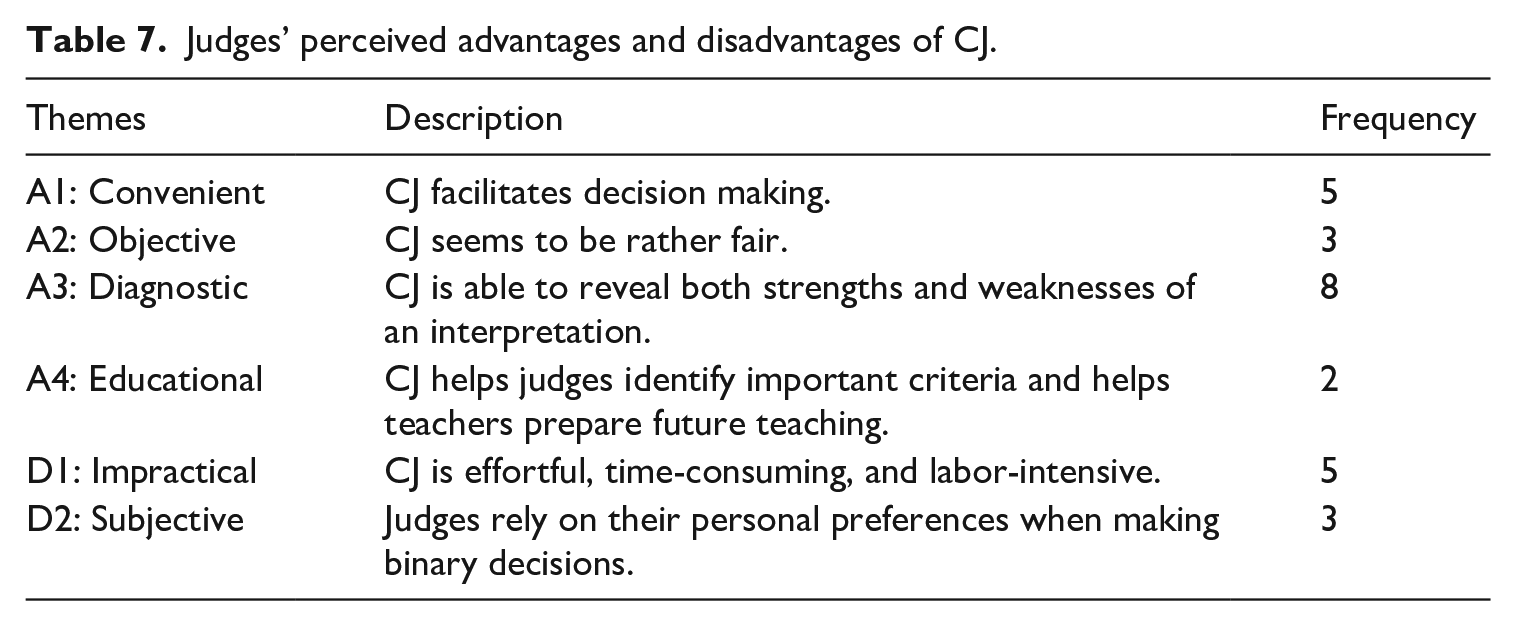
Based on the judges’ answers to Question 8, we identified four advantages (A) and two disadvantages (D) of CJ. Table 7 displays each advantage and disadvantage, their pertinent description and frequency count. As can be seen in Table 7, although some judges perceived CJ to be convenient and objective (i.e., A1 & A2), others found it impractical and subjective (i.e., D1 & D2). This contrast can be seen from the following direct quotes.
A1: (Using CJ), I was able to differentiate the better interpreted version in a relatively fast and straightforward manner (from J08).
D1: When two interpretations were close to each other in terms of their quality, I had to interrogate certain aspects of interpretation, which required more time and effort (from J09).
A2: CJ was similar to blind peer review, and it was thus rather fair (from J07).
D2: When the judges were left on their own to choose as many criteria as possible to evaluate interpretation, their decision making could be affected by personal preferences and therefore tended to be biased (from J01).
Apart from the above results, we also found two advantages of CJ, one being its diagnostic capability (A3) and the other its educational benefits (A4), illustrated by the following two quotes.
I found that CJ was a sufficient method to analyze the merits of sign language interpretation, which helps me plan my future teaching (from J04). By pairwise comparison, I was able to identify, in a transparent way, the strengths and weaknesses of the interpretations. Personally, this process was useful in terms of helping me pinpoint relevant evaluation criteria (from J05)
Judges’ perceived advantages and disadvantages of CJ.
Regarding the potential applicability of CJ (see Figure 1), the majority of the judges (n = 9) believed that CJ could be fruitfully utilized in formative assessment, primarily because of the diagnostic and pedagogical benefits (see the following quote from J01).
Repeated paired comparisons would help students learn from others’ strengths and weaknesses, and also help teachers provide more targeted instruction in the future.
Meanwhile, a few others thought that CJ was applicable in small-scale testing and interpreting contests, citing the reason that CJ is fairer and more straightforward when one needs to evaluate two interpretations of similar quality (e.g., J10).
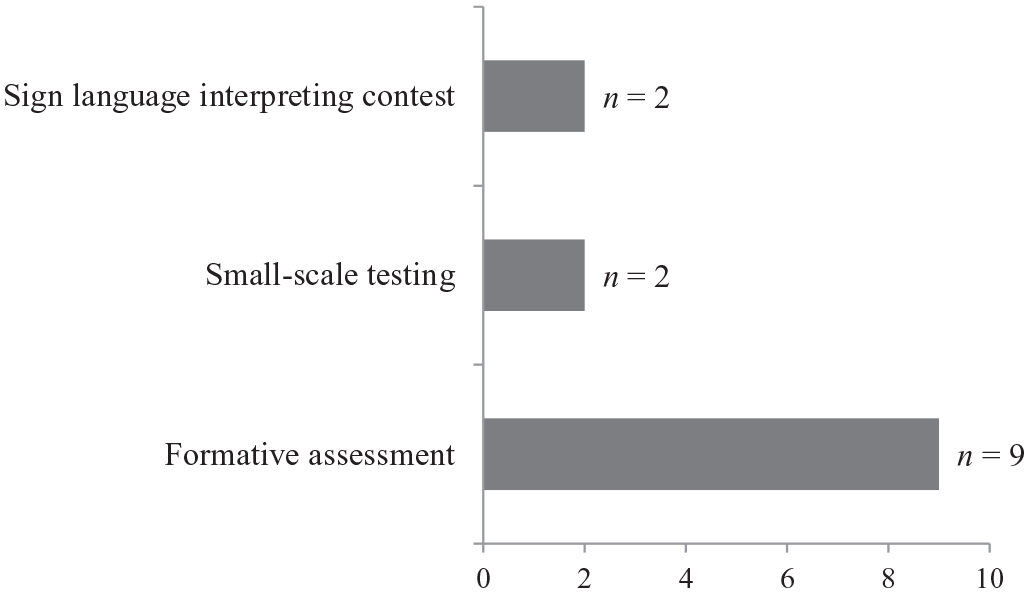
Assessment scenarios in which CJ is applicable.
When it comes to the assessment scenarios where CJ would be inappropriate, the majority of the judges believed that CJ was less useful for large-scale testing, largely because of its inefficiency (demonstrated by the following quotes).
When there are too many students involved in testing, CJ would require a huge amount of workload. It is also possible that longer duration of evaluation fatigues judges, which would ultimately undermine the quality of evaluation (from J02). The workload involved in CJ would be enormous. In addition, a fair proportion of examinees in large-scale testing could be equally competent. Judging their performances is extremely time-consuming and susceptible to error (from J10).
Discussion
In terms of reliability, CJ seemed to fare well in SLI assessment overall. According to the infit statistics, most of the judges (n = 9, 75%) made judgments consistently. Additionally, the SSR index reached a relatively high value of .86, which happens to be slightly higher than the mean reported in Verhavert et al.’s (2018) meta-analysis of 27 CJ-based assessments. In general, the SSR index compares fairly well with the reliability estimates of the rubric scores reported in Wang et al. (2015) for the English-to-Auslan interpreting, in which inter-rater reliability estimate (calculated in Pearson’s r) ranged from .41 to .87, with an average of .66 across three rater pairs.
Regarding the criterion-related validity of CJ, the quantitative evidence of the Pearson’s correlation coefficient (r = .793) signals a relatively high level of concurrent validity of the CJ-based logit estimates of student ability.
Regarding the scoring validity, our content analysis of the qualitative data suggests that the assessment criteria used by the judges in CJ were generally overlapping across the two data elicitation methods (i.e., reflective retrospection and real-time justification), particularly when it comes to the most significant micro criteria. The analysis of the questionnaire-based retrospective data identified six quality criteria frequently mentioned by the judges, including (a) information completeness (n = 8, 12%), (b) fluency and pace (n = 8, 12%), (c) facial expressions (n = 7, 10%), (d) information accuracy (n = 6, 9%), (e) articulation (n = 5, 7%), and (f) signing space (n = 4, 6%). These criteria and their ranking were cross-validated by the similar results from the analysis of the judges’ real-time comments: (a) information completeness (n = 231, 17%), (b) fluency/fluidity (n = 160, 12%), (c) facial expressions (n = 143, 10%), (d) accurate use of vocabulary (n = 74, 5%), (e) information accuracy (n = 89, 6%), and (f) precision of signing (n = 86, 6%). Such a high degree of correspondence indeed bolsters our confidence in the credibility of the judge-reported data.
More importantly, this collection of assessment criteria reported by the judges represents a close mapping of the important quality criteria crystallized by the literature review (see the “Quality of sign language interpreting” section). This close mapping can be construed as evidence for the scoring validity of the CJ-based measurements. Once again, we want to emphasize that CJ’s validity builds on the collective judgment of a group of experts. Although an individual judge may use somewhat different quality criteria in certain situations, these differences are reduced by the iterative and interconnected process of CJ.
When it comes to the perceived utility of CJ, although the judges spoke highly of potential educational benefits brought about by CJ, they held divergent opinions about its efficiency and objectivity. More specifically, the practice of CJ was believed to produce positive impact on student learning because it represents a useful means to help students find out strengths and weaknesses of their renditions and obtain in-depth understanding of assessment criteria (i.e., A3 & A4). This is probably why many judges suggested applying CJ in formative assessment.
In addition, despite some voices in support of CJ’s convenience and objectivity (i.e., A1 & A2), a number of the judges found CJ impractical and subjective (i.e., D1 & D2). As a result, they opposed the use of CJ in large-scale testing. In hindsight, we believe that such negativity towards CJ can be accounted for by two factors. First, our study required each judge to key in their justification for each decision, which inevitably called for more cognitive effort, increased workload overall, and lengthened response time. This created an impression of CJ as impractical. In fact, the judges’ provision of detailed comments is optional, depending on assessment purposes. In the current study, we asked for the judges’ comments for the sake of eliciting validity evidence. Second, the judges’ labeling CJ as being subjective and biased could be attributed to their lack of understanding or misunderstanding of how CJ actually operates (given that they were all first-time users). The judges thought that the individual decisions of each judge were directly converted to final scores (or rankings), thus expressing concerns over personal preferences in choosing quality criteria, and fearing insoluble inter-judge discrepancies. As we have stressed above, instead of considering judges’ decisions in isolation, CJ embodies collective wisdom by pooling together and analyzing all judges’ decisions to create standardized estimates of perceived quality.
Finally, when comparing CJ with the previous scoring methods, we can make the following observations, based on our findings. First, CJ seems to be reliable overall, at least in parallel with previous scoring methods (e.g., rubric scoring, see Wang et al., 2015). Second, CJ seems to involve a comprehensive array of quality criteria in judges’ decision making, an encouraging indicator of relatively strong scoring validity. It thus compares well with some scoring methods (e.g., rubric scoring) and, arguably, may make stronger validity claims than others (e.g., error analysis, item-based scoring). Third, it would appear that CJ is intuitive, convenient, and easy, even for first-time users. Without too much preparation or extensive training, CJ tends to be more practical overall than other scoring methods like error analysis. In addition, had we scrapped the requirement of providing justification for each decision and provided a little bit more information on the underlying mechanism of CJ, we might be able to cut the response time by a significant margin and obtain more positive feedback from the judges. Fourth, it would seem that CJ represents an ideal candidate for formative assessment, given its stronger capability to reveal students’ strengths and weaknesses in a transparent manner than other assessment methods. This potentially unique advantage may make CJ more appealing for SLI educators. Finally, we want to emphasize that when readers try to appreciate the positive results reported in the study, they are encouraged to consider the comparatively less preparatory work involved in CJ (e.g., extensive rater training) than in other scoring methods like rubric scoring and the additional requirement we imposed on the judges (i.e., provision of detailed comments for each decision).
Conclusion
In this exploratory study, we trialed the method of comparative judgment in the assessment of Chinese Sign Language interpreting and also evaluated its reliability, validity, and utility. Our analysis of both quantitative and qualitative data suggests that, on the whole, comparative judgment produced reliable and valid measurements, although the judges expressed divergent views about its utility. The negative perceptions (i.e., impractical and subjective) could be explained by our artificial requirement on the judges to provide detailed comments on each decision and by our failure to inform the judges of how their binary decisions would be used to estimate SLI quality. Nonetheless, the encouraging results from the study provide an empirical argument for the usefulness of comparative judgment in SLI assessment.
Going forward, we envisage three possible directions of future research to elucidate the process of comparative judgment and to explore its potential benefits in applied assessment contexts. First, we need to understand the cognitive process of the judges’ decision making, when they are faced with different pairs of renditions (e.g., two renditions of similar quality and of drastically different quality). Better knowledge of this process contributes to scoring validity of comparative judgement-based measurements. In the current study, this would mean that we could further analyze the judges’ comments on their decisions to find out the most frequently mentioned quality criteria when a certain video was chosen over another.
Second, we need to collect empirical data on the functionality of different scoring methods currently available for SLI assessment, including comparative judgment. By doing so, we would be able to make informed decisions to ensure that a given scoring method aligns with specific assessment goals (i.e., an optimum method for a given purpose).
Third, given its educational and practical benefits, we may need to evaluate comparative judgment as applied in formative and summative assessment in interpreter training. Specifically, we could investigate whether comparative judgment outperforms other methods in terms of promoting student learning and of reducing scoring workload for teachers.
Finally, considering that comparative judgment represents a novel method for many SLI educators and researchers, we call for further research on its usefulness and applicability in different SLI assessments. After all, better assessment contributes to better learning and, it is hoped, to better SLI quality.
Supplemental Material
sj-pdf-1-ltj-10.1177_02655322211038977 – Supplemental material for A comparative judgment approach to assessing Chinese Sign Language interpreting
Supplemental material, sj-pdf-1-ltj-10.1177_02655322211038977 for A comparative judgment approach to assessing Chinese Sign Language interpreting by Chao Han and Xiaoyan Xiao in Language Testing
Supplemental Material
sj-pdf-2-ltj-10.1177_02655322211038977 – Supplemental material for A comparative judgment approach to assessing Chinese Sign Language interpreting
Supplemental material, sj-pdf-2-ltj-10.1177_02655322211038977 for A comparative judgment approach to assessing Chinese Sign Language interpreting by Chao Han and Xiaoyan Xiao in Language Testing
Supplemental Material
sj-pdf-3-ltj-10.1177_02655322211038977 – Supplemental material for A comparative judgment approach to assessing Chinese Sign Language interpreting
Supplemental material, sj-pdf-3-ltj-10.1177_02655322211038977 for A comparative judgment approach to assessing Chinese Sign Language interpreting by Chao Han and Xiaoyan Xiao in Language Testing
Supplemental Material
sj-pdf-4-ltj-10.1177_02655322211038977 – Supplemental material for A comparative judgment approach to assessing Chinese Sign Language interpreting
Supplemental material, sj-pdf-4-ltj-10.1177_02655322211038977 for A comparative judgment approach to assessing Chinese Sign Language interpreting by Chao Han and Xiaoyan Xiao in Language Testing
Footnotes
Declaration of Conflicting Interests
The author declared no potential conflicts of interest with respect to the research, authorship, and/or publication of this article.
Funding
The authors disclosed receipt of the following financial support for the research, authorship, and/or publication of this article: This work was support by China's National Social Sciences Foundation (grant number: 19BYY005).
Supplemental material
Supplemental material for this article is available online.
Notes
References
Supplementary Material
Please find the following supplemental material available below.
For Open Access articles published under a Creative Commons License, all supplemental material carries the same license as the article it is associated with.
For non-Open Access articles published, all supplemental material carries a non-exclusive license, and permission requests for re-use of supplemental material or any part of supplemental material shall be sent directly to the copyright owner as specified in the copyright notice associated with the article.