
Abstract
This three-level meta-analysis investigated the human–machine correlation of automated speech evaluation (ASE) systems. Sixty-seven studies representing 392 effect sizes were included. The results indicated a positive overall correlation (r = .654, p < .001) between machine and human scoring of speech. Pooled effect sizes across speaking constructs showed the highest correlation for delivery (r = .784), followed by overall speaking proficiency (r = .686), fluency (r = .618), pronunciation (r = .606), content (r = .574), and grammar and vocabulary (r = .499). A clear upward trend was observed in ASE studies, from the traditional machine learning stage (r = .597), to the deep learning application stage (r = .641), and further to the transformer-driven stage (r = .680). Moderator analysis revealed significant moderating effects on the overall human–machine correlation from 10 variables: publication year, publication type, unit of sample, age group, level of task constraints, rater expertise, inter-rater reliability, system developer, feature engineering, and algorithm type. However, no significant moderating effects were observed for level of task integration, scoring method, system architecture, and automated speech recognition (ASR) accuracy. We propose key considerations for future ASE development, offering insights for educators and policymakers in integrating ASE into education.
Introduction
Automated speech evaluation (ASE) systems have become more commonly used in language testing and learning in recent years. These systems enhance scoring consistency (Khabbazbashi et al., 2021; Y. Wang et al., 2018) and significantly lower costs by reducing the need for recruiting, training, and monitoring human raters (Brown, 2012). To apply them in practical settings, generating an evidence-base supporting the accuracy of ASE is crucial. A common approach to demonstrating ASE’s performance involves examining the correlation between machine-generated scores and those assigned by human examiners, hereafter referred to as “human–machine correlation.”
With advancements in automated speech recognition (ASR) and machine learning technology, researchers have refined ASE models at multiple levels, including construct coverage, model architecture, and scoring algorithms. While current ASE systems demonstrate strengths in evaluating acoustic dimensions of speaking (e.g., pronunciation and fluency), challenges persist in assessing higher-order dimensions such as content and coherence (Zechner, 2019). Furthermore, variations in model architecture, scoring algorithms, and other design-related factors may lead to differences in ASE accuracy, which in turn affect their applicability in diverse contexts. Therefore, it is essential not only to obtain an overall understanding ASE systems’ performance and their evolving capabilities in assessing different speaking skill components, but also to identify the key factors that moderate system performance. This will enable identification of ASE’s strengths and limitations, guiding future system improvement. While correlation is only one of several metrics used to assess the reliability of automated scoring systems (Rotou & Rupp, 2020), it remains the most frequently reported metric in ASE research, making it suitable for meta-analytic synthesis.
A review of existing literature reveals a generally positive human–machine correlations for ASE systems. Nevertheless, there exists substantial variation in the strength of the correlations in different ASE systems across studies. To our knowledge, the only study that has systematically summarized the key findings, methods, and materials used in ASE systems is Saito et al. (2023), which reported a general human–machine correlation of 0.6–0.8. However, they only discussed 11 representative studies—a relatively small sample. As of the time of writing, there was no existing meta-analysis that uses statistical models to synthesize the pooled correlations between human and machine scores across studies. Additionally, from a technical perspective, previous meta-analyses tend to use a two-level model to synthesize effect sizes, failing to account for the dependency and hierarchical structure of data, where multiple effect sizes are reported within a single study. A three-level meta-analytic model can overcome this data dependency issue by estimating both within-study and between-study variance (Assink & Wibbelink, 2016), thus enhancing the robustness of the findings.
Therefore, in the present study, we conducted a three-level meta-analysis to synthesize extant findings on human–machine correlations in ASE research. Analyses were conducted from three perspectives: across (1) all included studies, (2) studies assessing different speaking constructs, and (3) studies at different stages of technological development. Additionally, potential moderators influencing system performance were examined. The scope of this meta-analysis is limited to ASE systems evaluating monologues and simulated conversations without covering real human-to-human conversational speech and interactions mediated by spoken dialogue systems (Karatay & Xu, 2025; Ockey & Chukharev-Hudilainen, 2021).
Literature review
Assessing oral proficiency
Oral proficiency has traditionally been assessed by human raters. Trained raters are expected to comprehensively assess different aspects of the performance, ensuring that the resulting scores are an accurate representation of test takers’ language proficiency and align with the scoring criteria. However, human scoring is susceptible to various imperfections including inconsistencies between and within raters, leniency or severity in scoring, halo effects, and potential rater drift (Engelhard, 1994, 2002). To mitigate these issues and enhance reliability, rigorous rater training, systematic moderation, and double rating are crucial (Brown, 2012). However, implementing these processes requires substantial resources in terms of time, labor, and financial investment (Zhang, 2013). With the rapid advancements in speech processing and machine learning technologies, automated methods for assessing test takers’ oral proficiency have become increasingly prevalent, offering faster, more consistent, and cost-effective feedback (Z. Wang et al., 2018). Given these advantages, ASE has been widely adopted in large-scale tests developed by major testing institutions (e.g., Versant English Test, TOEFL iBT). Alongside these developments, independent researchers and university teams have increasingly developed automated scoring systems for local use (Van der Walt et al., 2008).
Automated speech evaluation system
An ASE system is a complex mechanism, usually built with a cascade structure that includes three key components: (a) an automated speech recognizer, which translates the input audio files into a transcribed sequence of words; (b) a feature extraction program which extracts construct-relevant features (typically handcrafted) from speech recognizer output and the speech signals; (c) a scoring model trained on a set of human-scored spoken responses. The system initiates with analyzing and transcribing students’ spoken responses using ASR technology. Next, a feature extraction module automatically extracts a series of features from the original audio files and the transcribed text. This process ultimately produces metrics used to evaluate the students’ oral proficiency. Finally, the scoring model uses various algorithms to aggregate feature scores and produce students’ final scores or proficiency levels (see Figure 1). More recently, end-to-end systems have emerged (Park & Choi, 2023; Wang et al., 2021), leveraging deep learning to automatically extract acoustic or textual representations and directly map input speech to scores, thereby managing the entire scoring process integrally without an intermediate feature engineering process.
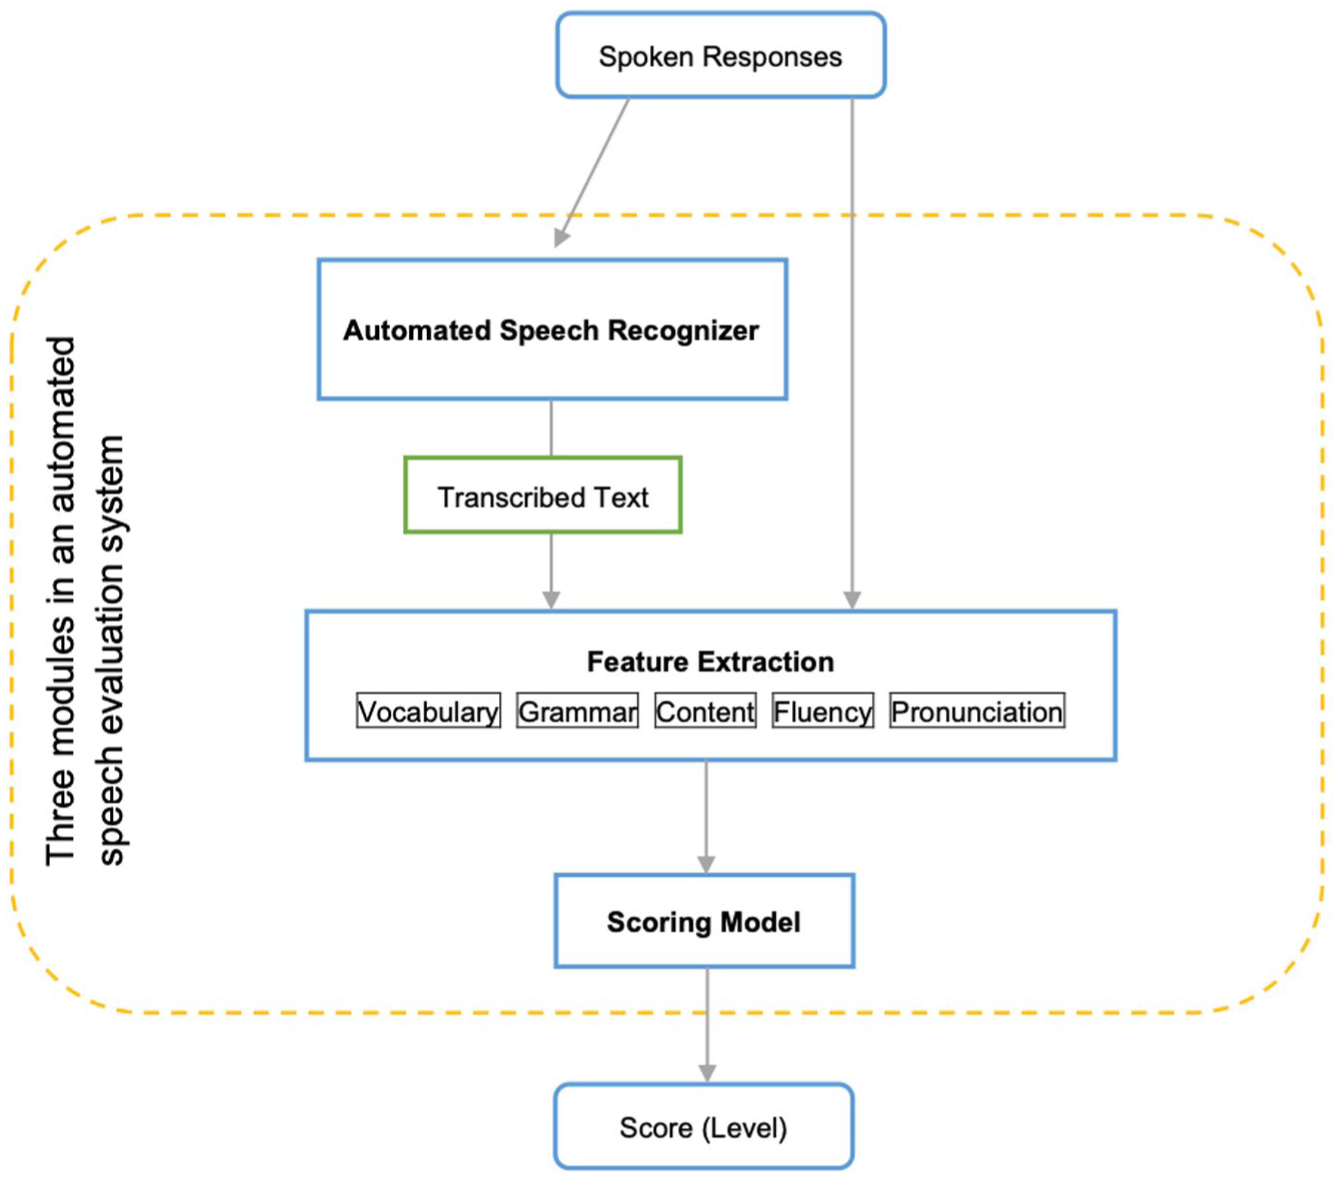
Schematic illustrating the typical cascade architecture used in automated speech evaluation systems.
ASE’s technological development can be broadly divided into three phases. In the traditional machine learning stage (before 2010), systems primarily focused on pronunciation scoring (Cucchiarini et al., 2000; Franco et al., 2000), extracting limited acoustic features from highly constrained, low-entropy tasks such as read-aloud or repeat-aloud. 1 In these tasks, the learner’s predictable output enables the speech recognizer to maintain high accuracy, resulting in a relatively high human–machine correlation. However, such tasks can be controversial due to construct underrepresentation and a lack of authenticity (Galaczi, 2010). Recent advances in ASR transcription accuracy, driven by the large-scale application of deep learning since the 2010s (Hinton et al., 2012; Yu & Deng, 2015), have ushered in the deep learning application stage (2011–2017). These improvements enabled ASE systems to assess broader dimensions of spoken proficiency, including grammar, vocabulary, content, and coherence (Bhat & Yoon, 2015; Chen & Zechner, 2011; Xie et al., 2012). Task designs have accordingly evolved from low-entropy tasks to more complex, high-entropy tasks (see Footnote 1) that elicited spontaneous speech, such as monologues (Handley & Wang, 2023; Zechner et al., 2009) and simulated dialogues (Evanini et al., 2015; Qian et al., 2019). With the prevalence of transformer models (Vaswani et al., 2017), ASE entered the transformer-driven stage (2018–2024), which enabled context-aware and multimodal representations of speech. This stage has spurred exploratory research on fluency modeling in dialogic speech (Matsuura et al., 2022). Nevertheless, automated scoring of interactive speech remains challenging, primarily due to issues such as overlapping speech and the lack of robust operational measures for interactional competence (Xu & Knill, in press).
Despite this technological trajectory, it remains unclear whether ASE systems meet accepted benchmarks for automated scoring (r ⩾ .70; Rotou & Rupp, 2020). Assessing speech has historically been more challenging than assessing writing, as automated writing evaluation (AWE) systems typically achieve higher human–machine correlations (r > .85; Hussein et al., 2019). With recent technological improvements making ASE increasingly feasible, it is timely to conduct a quantitative synthesis of ASE performance and to identify which constructs and task types ASE systems are particularly adept at evaluating. While some reviews have summarized human–machine correlation across ASE systems (Saito et al., 2023), no meta-analysis to date has examined the overall pooled effect size in ASE or identified moderators affecting it. ASE performance is likely moderated by a range of factors. Subject characteristics, such as age group and the scoring unit (e.g., part-level items vs. aggregated speaker-level scores), can shape how performance is represented (Bannò & Matassoni, 2024; Hannah et al., 2022). Task characteristics, including level of task integration and constraints, further influence the linguistic and cognitive demands placed on test takers (Bhat & Yoon, 2015; Yoon et al., 2018). Human scoring practices (e.g., scoring method, rater expertise, and inter-rater reliability) condition the benchmarks against which ASE is evaluated (Bijani, 2018; Khabbazbashi & Galaczi, 2020). System design features (e.g., ASR accuracy, feature engineering, and modeling algorithms) determine how effectively the system captures relevant speech information (Chen Tao, et al., 2018; Xi, 2010). Collectively, these factors suggest that ASE performance is context-dependent and may vary systematically across tasks, populations, scoring practices, and system configurations.
Three-level meta-analytic model
Research on the assessment of ASE systems typically presents diverse outcomes based on the utilization of distinct evaluation datasets and calculation models for scoring. As a consequence, multiple effect sizes are generated within a single study. Common methods to tackle this problem involve picking one effect size from each study, calculating the average effect size within each study, or ignoring the issue altogether (Harrer et al., 2021). However, these methods ignore the dependency of effect sizes. Recently, a three-level meta-analysis has gained prominence (Assink & Wibbelink, 2016; Cheung, 2014; Van den Noortgate et al., 2013). This method has more solid mathematical underpinnings and is designed to preserve the inherent value of individual effect sizes while effectively addressing dependency in effect sizes. Unlike traditional meta-analytic models, which account for only sampling variance (level 1) and between-study variance (level 3), the three-level meta-analytic model captures the hierarchical structure of the data by also integrating within-study variance (level 2). This additional level reflects variance among multiple effect sizes reported within the same study (Harrer et al., 2021). Considering the potential advantages outlined above, we employed a three-level approach in the meta-analysis reported in the present study.
Research questions
In this evidence synthesis, we comprehensively investigated the human–machine score correlation of ASE through research questions (RQs):
RQ1. What is the overall human–machine correlation in ASE systems (a) across all studies, (b) by speaking subconstructs assessed, and (c) by stages of technological development?
RO2. What factors may moderate the magnitude of the human–machine correlation?
Method
This study followed the Reporting Items for Systematic Reviews and Meta-Analyses (PRISMA) checklist (Page et al., 2021), which provided standardized guidelines for reporting each stage of the meta-analysis (see supplementary files Wang & Min, 2025, on the Open Science Framework [OSF]) https://osf.io/ts3mb/.
Identifying primary studies
A combination of electronic and manual search methods was employed to identify primary studies. We first conducted an electronic search up until June 2025, utilizing databases such as Web of Science, Scopus, and ProQuest. The search query was structured using Boolean operators to create the subsequent search syntax. The keywords and combinations used include “automat* speech scor*” OR “automat* speak* assess*” OR “automat* speech assess*” OR “automat* speak* scor*” OR “automat* speech evaluat*” OR “automat* speak* evaluat*” OR “automat* proficiency assess*” OR “automat* proficiency scor*” OR “speech scor*” OR “computational proficiency scor*.” Subsequently, a manual search approach was employed including (1) examination of prominent journals in the domains of ASE, aiming at identifying articles that were in the process of being published; (2) investigation of prior literature reviews to confirm the absence of any inadvertently overlooked relevant studies; and (3) application of White’s “ancestry” approach (2009) to scrutinize the reference lists of eligible studies.
Inclusion and exclusion criteria
Following the identification of primary studies, specific inclusion and exclusion criteria were implemented to select studies for the final analysis.
Data requirements
Studies should report quantitative data on the correlation coefficients (e.g., Pearson and Spearman) between human and machine scoring of speech, as these can be interconverted and transformed to Fisher’s z for analysis. Studies that lacked adequate inferential statistics were excluded. Evaluation metrics such as weighted kappa, quadratic weighted kappa (QWK), mean square error (MSE), root mean square error (RMSE), mean absolute error (MAE), and percentage agreement are commonly used to assess ASE performance (Rotou & Rupp, 2020), but are not directly convertible to correlation coefficients for comparison. Therefore, these values are available in the coding table (see supplemental files in Wang & Min, 2025) but were not included in the study.
Content requirements
To be included in our evidence synthesis, studies needed to:
- employ ASE technology to evaluate speaking performance and include human scoring.
- focus on speech scoring. Studies focusing on other skills (e.g., writing, listening, or reading) were excluded.
- target second language (L2) learners of English. Studies evaluating the speech of native English speakers were excluded.
- evaluate English as the target language. Studies focusing on other languages were excluded but are listed in a supplemental file on OSF (Wang & Min, 2025).
- written in English.
Study selection
The feasibility of the inclusion and exclusion criteria was discussed by the first author and a PhD student in Applied Linguistics. They independently examined 10% of the primary studies and reached complete agreement. Ultimately, the first author identified 67 studies that met the inclusion criteria, with 392 effect sizes. The study selection process was conducted using Endnote 20 for identification and initial screening and Zotero 7.0.16 for assessing eligibility and final inclusion. Figure 2 shows the PRISMA flowchart of the study identification, screening, and selection procedure. The full reference list of included studies is available in Wang and Min, 2025.
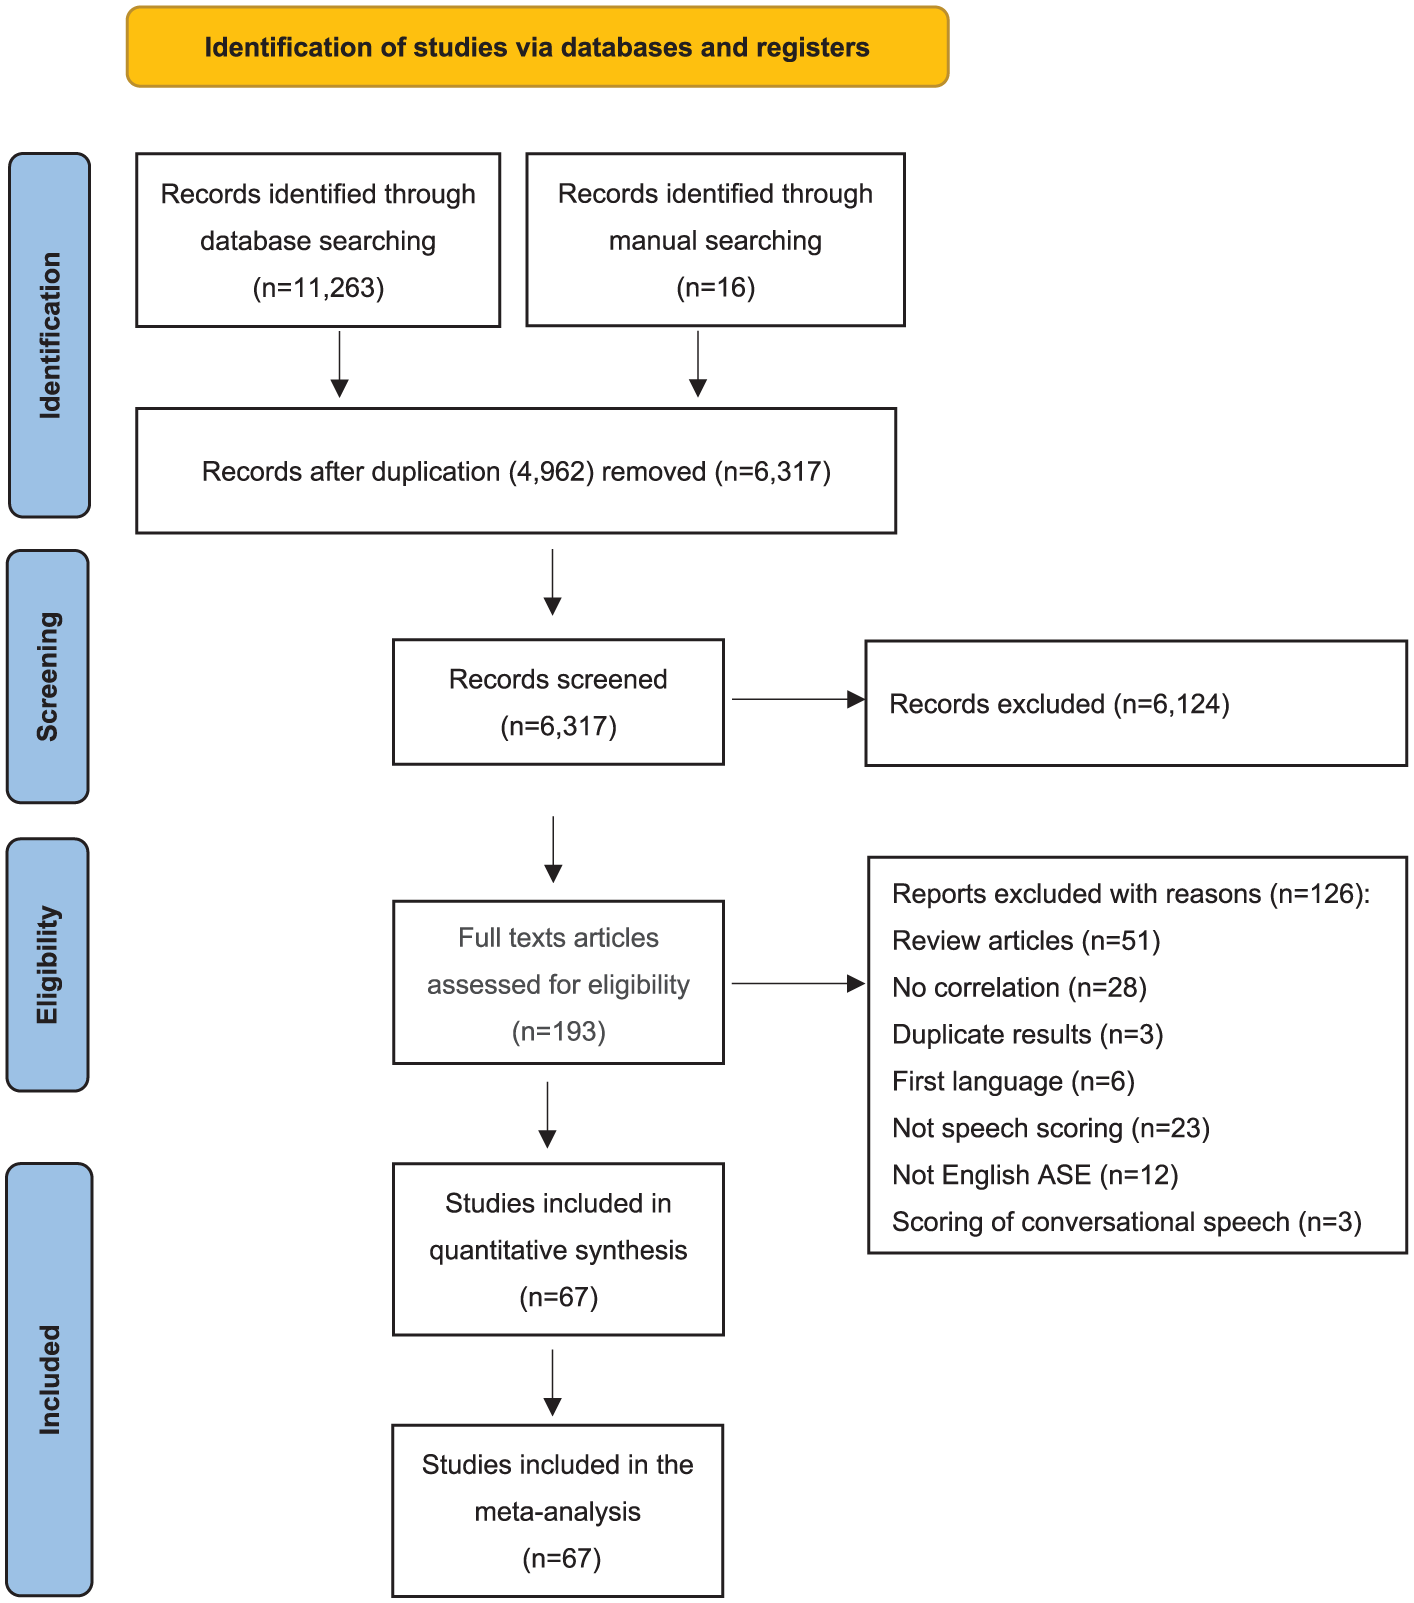
PRISMA flowchart of study selection procedure.
Coding scheme
Following Plonsky and Derrick (2016), we develped a coding scheme for data extraction, including observed reliability and potential moderators: (a) study identifiers, (b) subject characteristics, (c) task information, (d) human scoring characteristics, (e) automated scoring characteristics, and (f) outcome information. For a more detailed breakdown of these categories, please refer to Table 1.
Coding scheme categories, variables, values, and definitions used for data extraction.
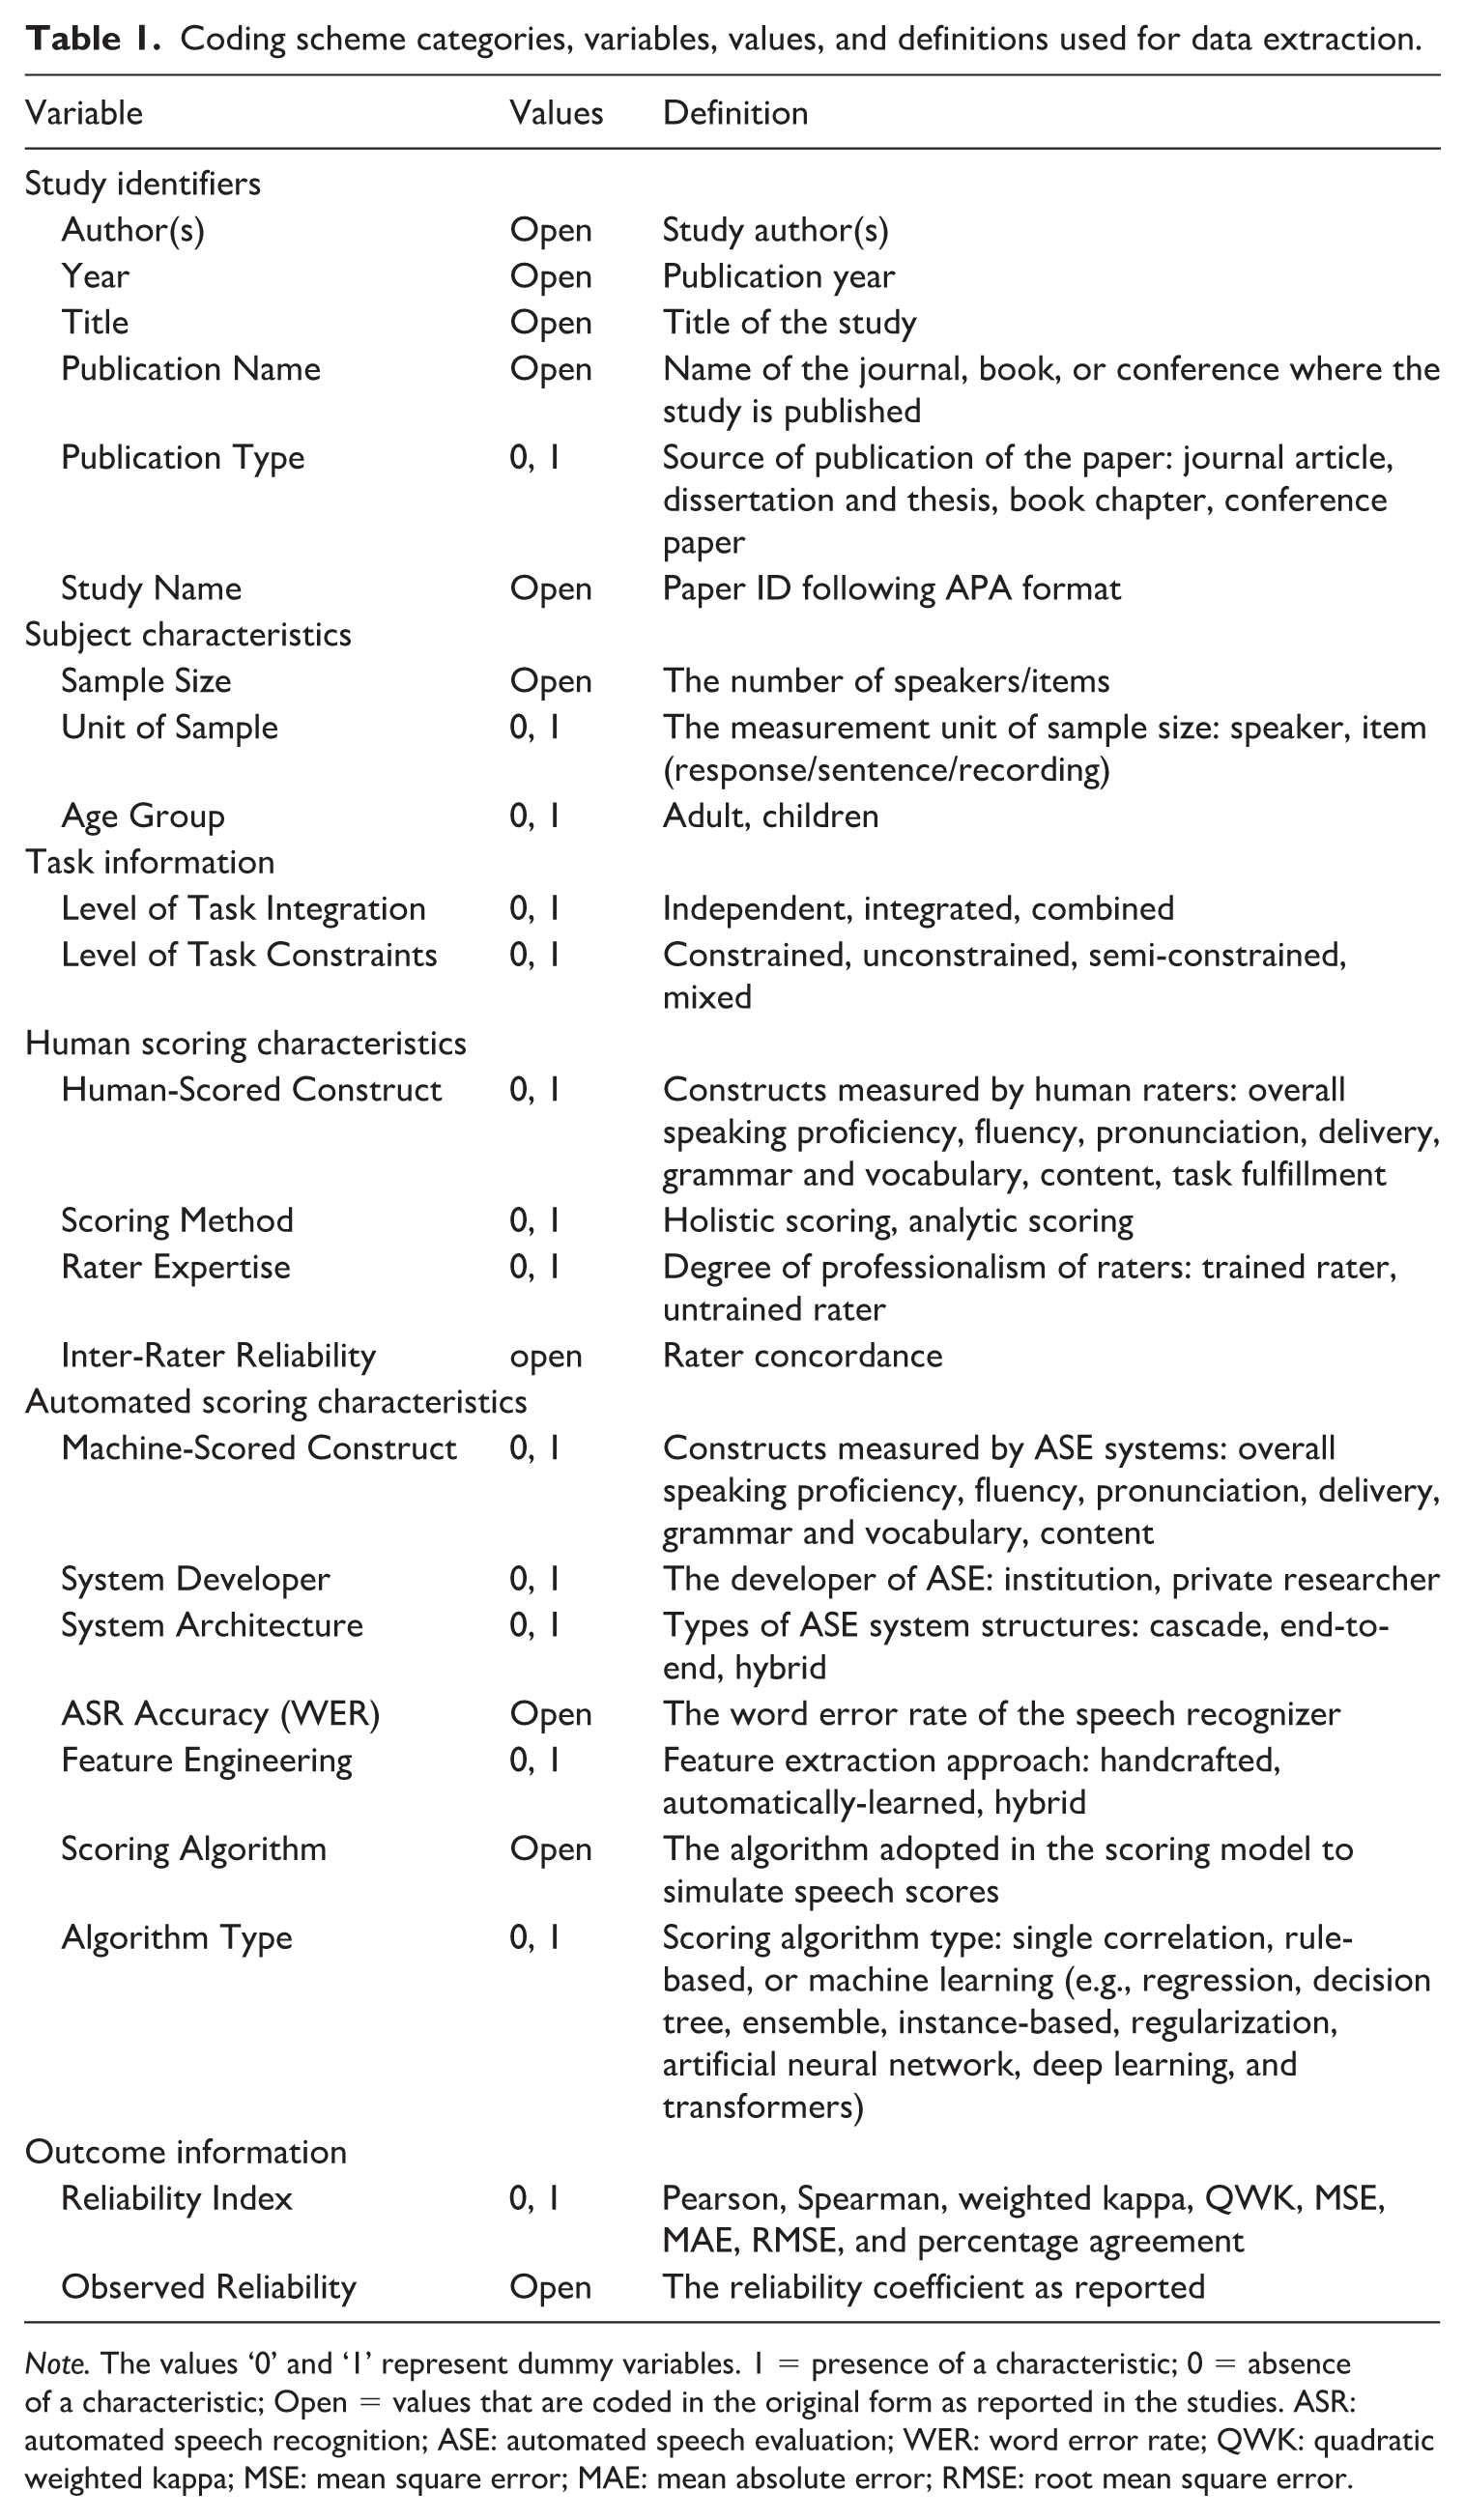
Note. The values ‘0’ and ‘1’ represent dummy variables. 1 = presence of a characteristic; 0 = absence of a characteristic; Open = values that are coded in the original form as reported in the studies. ASR: automated speech recognition; ASE: automated speech evaluation; WER: word error rate; QWK: quadratic weighted kappa; MSE: mean square error; MAE: mean absolute error; RMSE: root mean square error.
Study identifiers
Several study-related identifying variables, including author(s), year, title, publication name, and study name, were coded. Publication type was coded as a categorical variable using dummy variables.
Subject characteristics
Sample size and the unit of sample size were coded, with the former being continuous and the latter being categorical (speaker level or item level). Speaker-level correlation measured the correlation between a speaker’s total speaking score and machine-generated score, while item-level correlation pertained to the correlation between humans and machines in individual responses, sentences, or recordings. Age group (adult, children) was coded as categorical data.
Task information
The level of task integration refers to the type of tasks used in the speaking test, which were classified as independent tasks (e.g., independent monologue), integrated tasks (e.g., read-to-speak), or combined tasks (tasks of both types). The level of task constraints refers to the degree to which the task constrains a speaker’s speech. Four types of task constraints were coded as constrained (e.g., read-aloud and repeat-aloud), unconstrained (e.g., monologue), semi-constrained (e.g., timed picture description), or mixed (a combination of these forms). Specifically, a semi-constrained task involves speech guided by specific prompts, allowing for spontaneous production while keeping the linguistic content somewhat predictable (Saito et al., 2023).
Human scoring characteristics
Human-scored construct refers to the construct of interest reflected in human-scoring rubrics. It was categorized into: overall speaking proficiency, fluency, pronunciation, delivery, grammar and vocabulary, content, and task fulfillment. Fluency pertains to aspects such as speech rate, breakdowns, and repair strategies (Skehan, 2003). Pronunciation relates to the clarity of speech, including both segmental features (e.g., articulation of sounds and phonemes) and suprasegmental features (e.g., intonation, stress, and rhythm). Delivery emerged as a holistic construct that integrates fluency and pronunciation, emphasizing the clarity and smoothness of speech. Grammar and vocabulary denote the accuracy, diversity, and sophistication of grammatical structures and vocabulary usage. Content refers to features such as topic relevance, cohesion, appropriateness, organization, and logicality of the speaking response. Task fulfillment measures the overall success of communication, including intelligibility, comprehensibility, and the use of pragmatic strategies. If the scoring rubric covers multiple dimensions of the aforementioned constructs, it is classified as an evaluation of overall speaking proficiency. The scoring method was categorized into two types: holistic and analytic (Khabbazbashi & Galaczi, 2020). Two types of rater expertise were coded: (a) trained raters (e.g., scoring experts or teachers) who have undergone procedural training, including potentially rater calibration, standardization, and/or consensus scoring, and (b) untrained raters (i.e., lay listeners), who did not benefit from any such training. We coded inter-rater reliability as open data to reflect the quality of human scoring.
Automated scoring characteristics
Machine-scored constructs were categorized into six types: overall speaking proficiency, fluency, pronunciation, delivery, grammar and vocabulary, and content. The developer of ASE was coded as an institution or a private researcher. We identified three types of systems: cascade systems, end-to-end systems, and hybrid systems. Word error rate (WER) was coded to reflect the accuracy of the speech recognizer. Feature engineering was categorized based on the feature extraction approach: handcrafted, automatically learned, and hybrid approaches that combined both methods. Handcrafted features refer to acoustic or linguistic features that are manually designed and selected by experts. Automatically learned features are typically extracted through deep learning, which automatically captures and encodes both acoustic and linguistic representations. Scoring algorithms were grouped into three categories: (1) basic correlation-based methods (e.g., single correlation), (2) rule-based approaches, and (3) machine learning algorithms. The machine learning algorithms were further categorized into eight subtypes based on similarities in form or function (Brownlee, 2023): regression, decision tree (DT), ensemble methods, instance-based learning, regularization techniques, artificial neural networks (ANN), deep learning (DL), and transformer-based algorithms. Single correlation measures the relationship between individual feature variables and human scoring. Rule-based algorithm refers to those that produce scores using explicit, deterministic formulas without training on data. Among machine learning methods, regression algorithms encompass a variety of methods, including Gaussian process regression, multiple linear regression, logistic regression, cumulative link mixed models, and linear (mixed) models. Ensemble models include techniques such as extreme gradient boosting, gradient-boosted trees, and random forests. Instance-based models are represented by methods such as support vector machines and cosine similarity. Regularization algorithms include methods such as LASSO regression and elastic net regression. ANN refers to algorithms such as multilayer perceptron and simple neural network regression. DL encompasses models such as LSTM-RNN, BLSTM-RNN, MemN2N, LSTM, RNN, and DNN. Transformer-based algorithms include BERT, XLNet, and multimodal transformer.
Outcome information
Eight types of reliability indices were coded: Pearson, Spearman, weighted kappa, QWK, MSE, RMSE, MAE, and percentage agreement. However, as previously mentioned, weighted kappa, QWK, MSE, RMSE, MAE, and percentage agreement were excluded from the meta-analytic model because they could not be directly converted into correlation coefficients for comparison. Additionally, a continuous variable was used to code the values of the indices.
Supplementary information
The meta-analysis separately coded each correlation coefficient from studies that reported multiple effect sizes. Notably, we focused on correlation metrics reported in the model evaluation phase rather than the training phase. When multiple sources (e.g., reports, articles, or patents) reported the same evaluation results, only one was included to avoid duplication.
Reliability of coding
The present study involved two coders: the first author and a linguistics PhD student. Initially, the first author developed the coding protocol and trained the second coder. During the pilot phase, they coded 14 studies (approximately 20% of the total) and discussed discrepancies to refine the protocol. Subsequently, both coders used the revised standard independently on all studies, achieving an agreement rate of over 95% for all codes. The inconsistencies were resolved through discussion.
Data analysis
Effect size calculation
In our meta-analysis, the correlation coefficient (Pearson and Spearman) was chosen as the primary measure of effect size due to its widespread use and ease of interpretation. For studies reporting Spearman’s rank-order correlation coefficients, we converted these values to Pearson correlation using Myers and Sirois’s (2014) formulas. To accurately calculate the average effect size and conduct unbiased significance tests, we transformed r into Fisher’s z before conducting our meta-analysis. This conversion helped address skewness in the distribution of correlation coefficients (r) (Borenstein et al., 2009; Harrer et al., 2021; Lipsey & Wilson, 2001). Finally, Fisher’s z scores were transformed back into Pearson’s r for easier interpretation and alignment with conventional reporting standards.
Three-level meta-analysis
The statistical analyses were performed using the metafor package (Viechtbauer, 2010) in the R 4.2.0 environment (R Core Team, 2022). To reduce bias in variance estimates, Restricted Maximum Likelihood Estimation (REML) was applied (Van den Noortgate et al., 2015). Initially, we calculated the pooled human–machine correlation across all included studies, as well as across six constructs (overall speaking proficiency, fluency, pronunciation, delivery, grammar and vocabulary, and content) and three technological development stages of ASE (traditional machine learning, DL application, and transformer-driven stage). Subsequently, we examined heterogeneity in correlations both within and between studies. To assess within-study heterogeneity (level 2), a three-level model (incorporating sampling variance, within-study variance, and between-study variance) was compared with a two-level model (encompassing only sampling variance and between-study variance). Significance was determined through a one-sided log-likelihood-ratio test, indicating the presence of variance at the second level. The distribution of variance at each level of the model was calculated following Cheung’s (2014) method. Moderator analysis was considered when significant heterogeneity in correlations within and between studies was observed.
Publication bias
We used funnel plots to examine potential publication bias for (a) all included studies, (b) studies assessing any of the six constructs (overall speaking proficiency, fluency, pronunciation, delivery, grammar and vocabulary, and content), and (c) studies across the three technological stages of ASE development (traditional machine learning, DL application, and transformer-driven stage). Peters et al. (2008) proposed that an asymmetric funnel plot could indicate the influence of publication bias on the data. Additionally, we employed Egger’s test (Egger et al., 1997) to assess the statistical significance of the plots’ asymmetry. If a significant asymmetry is observed, we employed the trim and fill method to rectify the asymmetry in the plots. This involved imputing missing effect sizes (Duval & Tweedie, 2000a, 2000b).
Methodological appraisal
We conducted a methodological appraisal of included studies using the COSMIN checklist (Mokkink et al., 2018). As this review focuses on reliability, the relevant indicators (e.g., correlation, kappa, and agreement) were already the core outcomes of our coding framework and were systematically reported in the coding table (see Wang & Min, 2025). Inter-coder agreement on these indicators reached 98.7%, revealing high coding consistency. Overall, the include; d studies provided sufficient reporting of reliability evidence in line with COSMIN standards. Therefore, no additional quality appraisal was conducted.
Results
Outlier diagnosis and descriptive statistics
Outliers were defined as data points with z-scores falling below −3.29 or above 3.29 (Tabachnick & Fidell, 2013). No outliers were identified in either the distribution of raw effect sizes or Fisher’s z-transformed values. Ultimately, a total of 67 independent samples and 392 effect sizes were included in the final analysis published from 2007 to 2024.
The coded information from each study and its dummy variable version can be found in Wang and Min, 2025). Most coded variables were present in every study, each reporting the required effect size, and the majority contained information about the relevant moderators. For missing data on moderator variables, we excluded these data points from analyses while doing the moderator analysis of that category.
Publication bias and sensitivity analyses
Potential publication bias was detected in (1) all included studies, (2) studies assessing overall speaking proficiency, and (3) studies from the traditional machine learning stage and the transformer-driven stage. This was indicated by the asymmetrical distribution of funnel plots and further supported by the statistically significant results (p < .05) from Egger’s tests (see Wang & Min, 2025). Duval and Tweedie’s (2000a, 2000b) trim and fill method was used to rectify the asymmetry. No publication bias was detected in studies targeting specific subconstructs (fluency, pronunciation, delivery, grammar and vocabulary, and content) or those from the DL application stage, as suggested by symmetric funnel plots and non-significant Egger’s test results.
Model selection and overall effect size (RQ1)
We compared the three-level model with the conventional two-level random effects model. The three-level model demonstrated lower values of both the Akaike Information Criterion and the Bayesian Information Criterion compared to the two-level model. In addition, the log-likelihood ratio test comparing the two models showed a statistically significant difference (p < .001). This corroboration reveals that the three-level model provided a better fit than the two-level model. We therefore adopted the three-level model in the present meta-analysis.
As shown in Table 2, a positive correlation of .654 (95% CI [.609, .695], p < .001) was found for the overall human–machine correlation of all included studies. Calculating overall effect sizes based on the machine-scored speaking constructs separately, positive correlations were found by ASE assessing overall speaking proficiency (r = .686, 95% CI = [.640, .728], p < .001), fluency (r = .618, 95% CI = [.435, .752], p < .001), pronunciation (r = .606, 95% CI = [.502, .693], p < .001), delivery (r = .784, 95% CI = [.679, .857], p < .001), grammar and vocabulary (r = .499, 95% CI = [.321, .643], p < .001) and content (r = .574, 95% CI = [.417, .697], p < .001). Human–machine correlations in ASE also showed a clear upward trend across technological phases: r = .597 (95% CI = [.453, .711], p < .001) in the traditional machine learning stage (2007–2010), r = .641 (95% CI = [.578, .697], p < .001) in the DL application stage (2011–2017), and r = .680 (95% CI = [.606, .742], p;S < .001) in the transformer-driven stage (2018–2024). (For forest plots, see Wang & Min, 2025).
The pooled effect sizes (human–machine correlations).
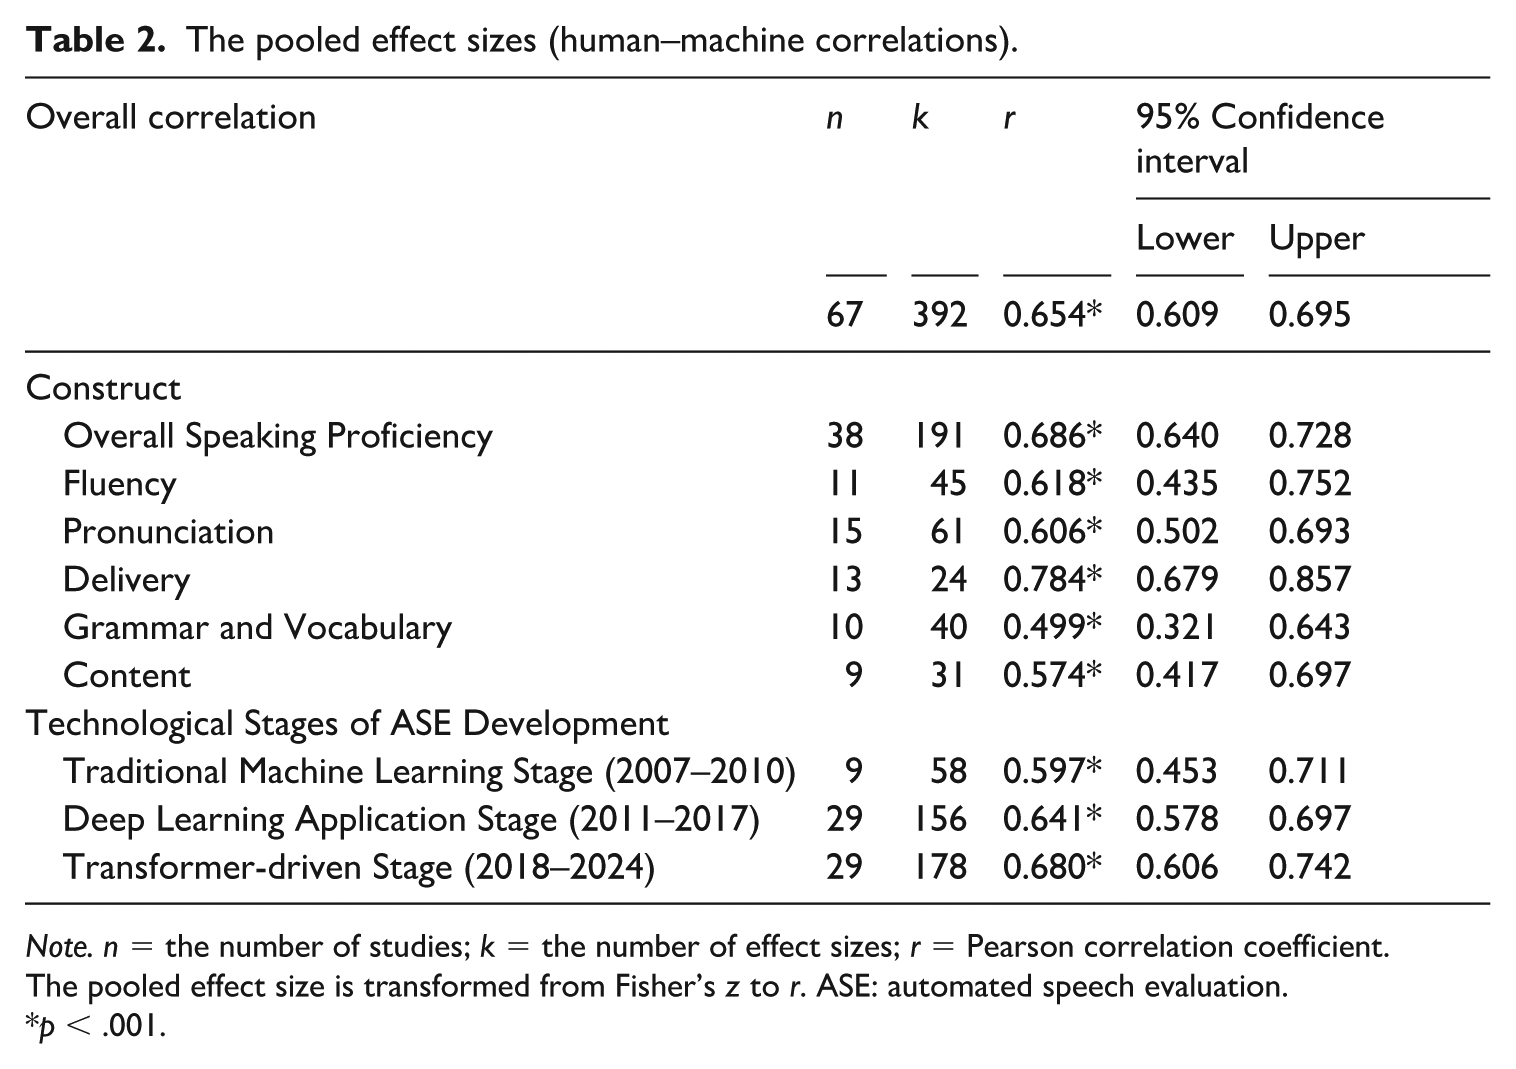
Note. n = the number of studies; k = the number of effect sizes; r = Pearson correlation coefficient.
The pooled effect size is transformed from Fisher’s z to r. ASE: automated speech evaluation.
p < .001.
Test of heterogeneity and moderator analysis (RQ2)
Concerning the overall human–machine correlation, the estimated variance values were as follows:
Descriptive Statistics of Moderators in the Meta-Analysis and Moderator Analysis.

Note. The variability in the sums of the variables is attributed to missing information and data dependency issues. n = number of studies, k = number of effect sizes, Mean r = effect size expressed as a Pearson’s correlation.
Asterisks denote the significance levels from the omnibus tests.
p < .05; **p < .01; *p < .001
The outcomes of the moderator analysis are also summarized in Table 3 (for more details, see Wang & Min, 2025). Among the 14 examined moderators, 10 variables—Publication Year, Publication Type, Unit of Sample, Age Group, Level of Task Constraints, Rater Expertise, Inter-rater Reliability, System Developer, Feature Engineering, Algorithm Type—exhibited significant moderating effects. The remaning variables were found to have no significant moderating effects in this meta-analysis.
Publication year
Publication year (2007–2024), treated as a continuous variable, was found to be a significant moderating factor, F(1, 390) = 4.515, p = .034. The regression coefficient for publication year was significant (β = .017, p < .05), indicating that more recent studies were associated with stronger overall effect sizes.
Publication type
Publication type was a significant moderator, F(3, 388) = 3.708, p = .012. Higher human–machine correlation can be found in conference papers (r = .689) and journal articles (r = .645), while the correlations reported in dissertations (r = .353) and book chapters (r = .280) were relatively lower.
Unit of sample
We found that human–machine correlation was significantly moderated by the unit of sample (F(1, 390) = 37.607, p < .001). When the unit of sample was at the speaker level, a larger effect size was obtained (r = .718), compared to when it was at the item level (r = .555).
Age group
Age group was identified as a significant moderator (F (1, 300) = 7.904, p = .005). The human–machine correlation was higher when the participants were children (r = .776) than when the participants were adults (r = .629).
Level of task integration
Task integration was not a significant moderator, F (2, 385) = 1.903, p = .151. However, studies employing integrated tasks (r = .696) indicated a higher human–machine correlation than independent tasks (r = .646) and combined tasks (r = .652).
Level of task constraints
The level of task constraints had a significant moderating effect, F (3, 384) = 3.235, p = .022. ASE systems achieved a significantly higher human–machine correlation when assessing mixed tasks (r = .814) compared to constrained tasks (r = .650) and unconstrained tasks (r = .632). No significant differences were observed in the human–machine correlation among constrained, unconstrained, and semi-constrained tasks (r = .677).
Scoring method
We found that the human scoring method was not a significant moderator, F(1, 385) = 0.034, p = .854, although the human–machine correlation of ASE trained on human holistic scoring (r = .654) was higher than that trained on human analytic scoring (r = .648).
Rater expertise
Rater expertise was a significant moderator, F(1, 388) = 4.301, p = .039. Higher human–machine correlations were observed when the speaking materials were rated by trained raters (r = .663) than by untrained raters (r = .523).
Inter-rater reliability
Inter-rater reliability significantly moderated the effect sizes, F(1, 222) = 112.354, p < .001. The positive regression coefficient (β = .878, p < .001) indicated that effect sizes increased as inter-rater reliability improved.
System developer
Studies conducted by institutions (r = .682) reported higher human–machine correlations compared to those by private researchers (r = .570). This difference was statistically significant, F(1, 390) = 5.871, p = .016.
System architecture
The architecture of ASE systems was not a significant moderator, F(2, 280) = 2.6, p = .076. However, hybrid systems (r = .739) and end-to-end systems (r = .717) demonstrated higher human–machine correlations compared to cascade systems (r = .670).
ASR accuracy (WER)
ASR accuracy, measured by WER, was not a significant moderator, F(1, 211) = 1.27, p = .261. The negative regression coefficient (β = −0.305) suggested that a lower WER was associated with a higher human–machine correlation in ASE systems.
Feature engineering
The method of feature extraction—whether handcrafted, automatically-learned, or a hybrid approach—was a significant moderator, F(2, 389) = 7.059, p < .001. When features were extracted using a hybrid (r = .757) or automatic learning approach (r = .697), the reported human–machine correlation was higher compared to when handcrafted features were used (r = .640).
Algorithm type
We also found algorithm type to be a significant moderator, F(9, 380) = 4.8, p < .001. ASE systems reporting a single correlation (r = .433) showed significantly lower effect size than those utilizing DT (r = .666), DL (r = .688), ensemble (r = .691), or regularization methods (r = .714). ASE using transformer (r = .743), artificial neural network (r = .746), and rule-based algorithms (r = .752) presented significantly higher correlations than those adopting instance-based (r = .646) or regression (r = .659) algorithms.
To further explore which type of ASE the moderating variable is moderating, we selected the significant moderating variables and present another moderator analysis on six ASE datasets assessing different constructs (overall speaking proficiency, fluency, pronunciation, delivery, grammar and vocabulary, or content). The results are shown in Table 3 (for more details, see Wang & Min, 2025).
Publication year
Publication year significantly moderated human–machine correlation in ASE measuring grammar and vocabulary, F(1, 38) = 7.826, p = .008, β = .057. For overall speaking proficiency (β = .011), fluency (β = .036), pronunciation (β = .005), delivery (β = .032), and content (β = .019), the effects were not statistically significant, but all showed positive trends.
Publication type
Publication type was not a significant moderator in the ASE datasets measuring all six subconstructs.
Unit of sample
For ASE assessing overall speaking proficiency, F(1, 189) = 62.329, p < .001, and delivery, F(1, 22) = 7.648, p = .011, the unit of sample was identified as a significant moderator. In contrast, it did not significantly moderate ASE when assessing other subconstructs. Notably, the human–machine correlation was consistently stronger when samples were analyzed at the speaker level compared to the item level across all cases.
Age group
Significant moderating effects were found in ASE studies assessing overall speaking proficiency, F(1, 160) = 5.122, p = .025, grammar and vocabulary, F(1, 34) = 4.508, p = .041, and content, F(1, 26) = 29.687, p < .001, but not in those assessing delivery. Human–machine correlations tended to be higher in studies targeting child speakers.
Level of task integration
Notably, the level of task integration had a significant moderating effect in ASE studies evaluating content, F(2, 28) = 20.192, p < .001. In this condition, studies employing integrated (r = .627) and combined tasks (r = .550) demonstrated a significantly stronger human–machine correlation than those using independent tasks (r = .441).
Level of task constraints
Significant moderating effects were found in ASE studies assessing overall speaking proficiency, F(3, 183) = 3.322, p = .021. Studies using constrained tasks (r = .745) reported higher human–machine correlation than those using unconstrained tasks (r = .668). In contrast, no significant moderating effects of task constraints level were observed in ASE studies assessing fluency, pronunciation, and delivery.
Rater expertise
Significant moderating effects were observed in ASE studies assessing overall speaking proficiency, F(1, 189) = 15.985, p < .001, with higher effect sizes reported in studies involving trained raters (r = .692) compared to those with untrained raters (r = .387). Rater expertise was not a significant moderator in ASE studies assessing fluency, pronunciation, and delivery.
Inter-rater reliability
Inter-rater reliability (IRR) significantly moderated ASE studies assessing overall speaking proficiency, F(1, 125) = 174.329, p < .001, delivery, F(1, 16) = 16.271, p < .001, grammar and vocabulary, F(1, 12) = 9.942, p = .008, and content, F(1, 7) = 79.094, p < .001. Human–machine correlations increased with IRR in all examined conditions (all βs positive).
System developer
The system developer significantly affected human–machine correlations in studies on overall speaking proficiency, F(1, 189) = 4.931, p = .028, but not in other subconstructs. Across all subconstructs except pronunciation and delivery, studies conducted by institutions reported higher correlations than those by private researchers.
System architecture
Notably, the system architecture was found to have a significant impact on the dataset of overall speaking proficiency, F(2, 177) = 3.648, p = .028, but not in those targeting other subconstructs. End-to-end and hybrid systems consistently outperformed cascade systems in alignment with human ratings across all subconstructs except fluency.
Feature engineering
Feature engineering was not a significant moderator for human–machine correlation in any subconstruct. Nevertheless, across all datasets, systems using automatically extracted or hybrid features consistently demonstrated higher human–machine correlations than those relying solely on handcrafted features.
Algorithm type
Algorithm type was found to be a significant moderator in ASE studies assessing overall speaking proficiency, F(8, 180) = 2.832, p = .006, and delivery, F(7, 16) = 3.693, p = .014, but not in those evaluating other subconstructs. Furthermore, systems employing more advanced algorithms, such as ANN and transformers, generally demonstrate superior human–machine correlation compared to traditional algorithms such as regression and support vector machines.
Discussion
This meta-analysis aimed to achieve two objectives: (a) to investigate the overall correlation between human and machine scoring of speech across three dimensions: all included studies, studies targeting specific speaking subconstructs, and studies conducted at different technological stages of ASE development; and (b) to identify factors moderating human–machine correlation. Regarding the overall correlation of all included studies, we found an aggregated value of .654. According to Rotou and Rupp (2020), a correlation coefficient of r = .70 serves as a threshold for minimally acceptable performance in evaluating automated scoring systems. The overall correlation falls below that threshold, indicating that current ASE performance is not yet satisfactory. In contrast, AWE systems typically achieve correlations above 0.85 (Hussein et al., 2019), highlighting a substantial gap. This discrepancy underscores the need for substantial improvements in accuracy before ASE can be considered for use in high-stakes testing. Under current conditions, human raters must continue to play an essential role.
Regarding human–machine correlations for individual subconstructs assessed by ASE systems, only delivery achieved an acceptable human–machine correlation (r = .784). While the correlations for overall speaking proficiency (r = .686), fluency (r = .618), pronunciation (r = .606), grammar and vocabulary (r = .499), and content (r = .574) were all below the commonly accepted threshold of 0.70, fluency and pronunciation nonetheless demonstrated comparatively higher correlations. The findings suggest that ASE systems are currently more accurate in evaluating delivery, fluency, and pronunciation. This advantage can be attributed to a historical focus on these dimensions and significant technological advancements. Early ASE development prioritized these constructs due to their direct link to features such as speech rate, pause duration, and pitch variation, which are easier to quantify. Furthermore, improvements in ASR technology, driven by DL techniques and large-scale data availability, have significantly enhanced the precision of these evaluations. This also aligns with previous research indicating that fluency and pronunciation are key features in ASE models and are given greater weight in the scoring model due to their higher correlation with human scoring (Higgins et al., 2011; Zechner et al., 2009).
While ASE systems assessed these speech delivery constructs presented relatively stronger human–machine correlations, concerns about the construct coverage (Xi, 2010) and authenticity (Galaczi, 2010) of these systems have been previously discussed and persist. With advancements in speech recognition technology, ASE systems have extended beyond speech delivery features to incorporate more complex constructs, such as grammar and vocabulary features. However, their pooled human–machine correlation remains relatively lower. This is because systematic linguistic differences exist between spoken and written modes, with spoken communication less structured, more fragmented, and repetitive when compared to written discourse (Xi, 2010). Many ASE systems employ syntactic and lexical complexity metrics similar to those used for written texts to predict oral proficiency. Although research has shown the predictive power of these features on oral proficiency (Crossley & McNamara, 2013; Iwashita et al., 2008; Lu, 2012), there is still a significant gap in ASE systems extracting features more suited to written rather than spoken discourse. Some scholars have attempted to address this by exploring new indicators for transcribed texts of spoken discourse and spoken corpora. For example, Yoon and Bhat (2012) and Bhat et al. (2014) introduced a novel approach by proposing new grammatical features based on shallow processing. These features, derived from part-of-speech tag sequences extracted from a substantial corpus of learners’ spoken responses, have been advanced as providing better indices of grammatical complexity compared to features based on deep syntactic analysis. ASE’s lower human–machine correlation in assessing grammar and vocabulary features can also be explained by ASR limitations. Since feature extraction depends on ASR transcriptions, transcription errors can affect the evaluation of grammar and vocabulary features. Although the accuracy of ASR in many ASE systems has improved substantialy (e.g., WER of around 20% in Speech Rater), it is still not comparable to automated essay evaluation, which extracts features based on original texts. Additionally, advanced ASR (e.g., OpenAI Whisper) may also overcorrect grammatical errors during transcription. This, in turn, could result in an inaccurate evaluation of grammatical and vocabulary features. However, a recent study (Bannò et al., 2024) suggests that ASE systems show potential for detecting and correcting grammatical errors in learner speech using an end-to-end approach.
The study further highlighted the limited accuracy of ASE systems in assessing content features. While DL techniques have improved the accuracy of assessing this higher-order dimension, ASE systems still lag behind human raters in making judgments about content quality. This limitation stems from the inherent complexity of content evaluation, which requires a holistic understanding of topic development, organization, logicality, and contextual appropriateness. However, advancements in large language models are gradually narrowing this gap. Future developments could leverage generative AI to evaluate higher-level features of spoken responses, offering more personalized and nuanced feedback alongside detailed score reports. Human raters excel in judgment and understanding higher-order language constructs, which machines struggle to capture (Xi, 2010; Yoon & Zechner, 2017). Therefore, the future of automated scoring may benefit from a human–machine collaborative approach, akin to the “human-in-the-loop” concept (Wu et al., 2022). This approach would combine the strengths of both machines and humans, enabling more accurate and comprehensive assessment outcomes.
Regarding human–machine correlations across three major technological phases of ASE development, we found an increasing trend from the traditional machine learning stage (2007–2010) to the DL application stage (2011–2017), and further to the transformer-driven stage (2018–2024). This trend likely reflects advances in core NLP and ASR modeling techniques—ASE’s two fundamental modules—whose progress has driven improved human–machine correlations. Early systems were built on handcrafted features that focused on shallow linguistic cues, which limited their ability to capture spontaneous speech. The adoption of DL in ASR and NLP (e.g., Hinton et al., 2012; Yu & Deng, 2015) enabled more robust modeling of acoustic and linguistic patterns, laying the foundation for multimodal approaches that combine speech and text inputs. More recently, transformer-based models have introduced context-aware representations that further enhance ASE performance.
For the second objective, this meta-analysis found that human–machine correlation is moderated by some factors. One key factor is the publication year, with ASE system performance improving significantly over time (2007–2024), consistent with the trend observed in human–machine correlations across the three major technological phases of ASE development. Over the years, ASE systems have evolved to incorporate more open-ended tasks and assess a broader range of constructs (Chen, Zechner, et al., 2018; Fu et al., 2020; Kang & Johnson, 2018; Saito et al., 2023; Zechner et al., 2009). While broader construct coverage may lower the overall correlation by including more challenging dimensions, the overall trend still shows a marked improvement. This underscores ASE’s growing potential for applications in large-scale, low-stakes assessments (Xi et al., 2012). However, its application in high-stakes testing still requires a higher correlation, stronger validity evidence, and human judgment.
Our analysis revealed that the human–machine correlation reported in conference papers was higher compared to journal articles, dissertations, and book chapters. This difference may be partially explained by the fact that conferences in speech and natural language processing (e.g., Interspeech and Association for Computational Linguistics [ACL] annual meeting) are often primary venues for introducing technical innovations in automated scoring. These conferences are known for their rigorous peer-review processes and publish archival-quality proceedings.
Our moderator analysis revealed significant variations in human–machine correlation based on the unit of sample, specifically whether ASE generated item-level scores or speaker-level scores. A higher human–machine correlation was found at the speaker level than at the item level, both in all ASE studies, and in those focusing on subconstructs. This is because speaker-level scores aggregate multiple responses from the same speaker, which reduces random error, leading to a more stable measure of overall performance. Such aggregation captures the consistency of a speaker’s abilities across different prompts, as Bannò and Matassoni (2024) have noted. These findings underscore the need for automated speaking tests to include multiple tasks, as scores from a single task provide a less accurate indication of oral proficiency. Tests limited to one or two tasks are therefore less likely to yield reliable results. However, item-level scores should not be ignored, for they provide vital score information from analytic sections. As Chen, Zechner et al. (2018) have highlighted, automated scoring systems often evaluate machine performance based on item-level human–machine correlations. Therefore, in the scoring model fitting process, it is important to consider not only the overall score correlation, but also the sub-score correlations between human and machine scoring. Such an approach would both help ensure the stability of automated scores across different tasks, and support a validity argument for the generalizability link (Xi, 2010).
To our surprise, we found a higher human–machine correlation in ASE assessing children’s speech than adults. This finding contrasts with previous studies, which suggested that the higher word error rates in speech recognition of children’s speech led to less reliable automated scoring (Hannah et al., 2022). This might be attributed to the fact that most of the studies on children’s speech we found were published in conference proceedings, where cutting-edge algorithms, such as neural networks (Metallinou & Cheng, 2014; Qian et al., 2019) and transformers (Wang et al., 2021) were employed. Given these advanced technologies, it is likely that other moderating variables, beyond the age group itself, affected the result.
Additionally, the level of task integration was a significant moderator for ASE studies assessing content features. Studies adopting integrated tasks (r = .627) indicated a higher correlation compared to combined tasks (r = .550) and independent tasks (r = .441). For content scoring in integrated tasks, the features for evaluation are generally clear and often involve methods of content vector analysis, capturing semantic similarities between students’ responses and the prompts in integrated tasks (Yoon et al., 2018). In contrast, independent tasks often feature unrestricted topics, which pose greater difficulty in selecting appropriate representative features.
Level of task constraints was a significant moderator. Among the four task types, mixed tasks (r = .814) elicited higher human–machine correlation than constrained speech tasks (r = .650) and unconstrained tasks (r = .632). This may be because mixed tasks provide a more comprehensive and consistent measure of students’ speaking proficiency. However, ASE systems did not show a significant difference in human–machine correlation when assessing constrained versus unconstrained tasks, suggesting that they perform comparably across both types. While evaluating unconstrained tasks has traditionally been seen as a challenge for automated scoring (Bhat & Yoon, 2015; Zechner et al., 2009), this meta-analysis indicates that ASE systems are capable of handling a wider range of task types with similar effectiveness.
Notably, when considering the quality of human ratings, we evaluated both rater expertise and inter-rater reliability as qualitative and quantitative standards. Our analysis revealed that the human–machine correlation was significantly lower when untrained raters (r = .523) evaluated spoken responses compared to evaluations conducted by trained raters (r = .663). This observation aligns with previous research (Bijani, 2018), which suggests that untrained listeners tend to exhibit lower IRR and are more prone to biases compared to trained raters. However, other studies highlight that a speaker’s ability to be understood by regular listeners (comprehensibility) is a significant aspect of L2 proficiency, suggesting that untrained listeners can offer valuable insights into communicative effectiveness (Bridgeman et al., 2012). In line with this, we observed that when human ratings are more reliable (higher IRR), automated scores can more effectively align with human judgments. This finding underscores the importance of ensuring high-quality, consistent ratings from expert human raters in the development of automated scoring systems (International Test Commission and Association of Test Publishers, 2022, pp. 61–63). Organizing multiple ratings to maintain the quality of human evaluations can further improve the reliability of ASE training and the quality of evaluation data.
Regarding system architecture, the results indicated that systems using an end-to-end approach outperformed cascade systems. As Chen, Tao, et al. (2018) have noted, end-to-end systems are more economical in feature development compared to cascade systems and show advantages in predictive performance. However, given concerns about construct validity, whether such systems can be applied to large-scale or high-stakes assessments still requires rigorous validation procedures.
Additionally, this study found ASE systems adopting an automatically learned approach in the feature extraction process performed better than the handcrafted approach. Automatic feature extraction methods typically leverage advanced machine learning models, enabling statistically more precise feature representation. In contrast, handcrafted feature extraction relies on traditional NLP techniques, which involve significant manual effort and rely on external datasets for development. The mismatch between the dataset used for model development and the target sample could have contributed to the lower human–machine consistency. For example, many NLP techniques are trained on written texts, and applying them to spoken samples may result in reduced consistency and construct underrepresentation, as the features of spoken language differ significantly from those of written language. Therefore, in line with Davis and Papageorgiou (2021) and Yoon and Zechner (2017), we suggest that the feature selection process include human judgment.
Another significant moderator was the algorithm type. Follwing Brownlee’s (2023) classification framework, we categorized the scoring model algorithms into 10 types and assessed their performance. Compared to widely used baseline regression models, other traditional machine learning algorithms, such as decision trees, support vector machines (instance-based methods), and random forests (ensemble methods), did not yield significant differences in ASE performance. While general DL models (e.g., LSTM-RNN, BLSTM-RNN, MemN2N, and DNN) outperformed regression-based approaches, these gains were not always statistically significant. However, more advanced neural architectures, particularly ANN (e.g., MLP) and transformer-based models (e.g., BERT and XLNet), significantly enhanced the accuracy and robustness of the scoring systems by integrating sophisticated neural architectures. These advanced algorithms, when implemented in end-to-end systems, exhibit greater stability and adaptability, particularly with unseen data (Gupta et al., 2024). However, despite these advantages, they introduce the challenge of the black box effect (Harding, 2025; Khabbazbashi et al., 2021), where the mechanisms behind the model’s success are difficult to interpret (Castelvecchi, 2016). This presents a challenge in high-stakes or diagnostic testing scenarios, where score interpretability and construct representation are crucial (Xi, 2023; Xu et al., 2024). Therefore, we suggest that the choice of algorithm be made in alignment with the specific objectives of the assessment.
Finally, despite the advances in technology and algorithms, ASE systems still face challenges in detecting and scoring unusual responses, which could undermine reliability (Gao et al., 2024; Xi, 2023). Given these limitations, we emphasize the importance of maintaining a human–machine hybrid approach, where human judgment works alongside automated scoring to reduce potential risks and ensure more reliable model performance (Xi et al., 2012; Xu et al., 2021).
Limitations
This study is subject to limitations that need to be taken into account. First, our study was limited to articles written in English, potentially leading to the omission of valuable research published in other languages. Future studies should broaden their search to non-English language sources to minimize any potential language bias (Plonsky, 2024). Second, this meta-analysis did not cover ASE studies using human-to-human dialogue tasks or human–AI interactions mediated by spoken dialogue systems. As this field is emerging, further research is needed to evaluate these areas. Third, we selected human–machine correlation as the effect size, as it is commonly reported. However, effect size selection in meta-analyses should be based on rigorous criteria, not just data availability (Plonsky, 2024). Moreover, human–machine correlation reflects association rather than agreement, which may overstate the actual performance of automated scoring systems (Xu et al., 2021). Future research should consider additional metrics, such as weighted kappa, QWK, MAE, MSE, RMSE, and percentage agreement, to provide a more comprehensive evaluation of ASE systems. Fourth, several other potential moderators remain for future research. Although we coded task constraints to reflect task entropy, we did not examine whether the speech type—spontaneous or prepared—affects the human–machine correlation. While unconstrained tasks tend to elicit more spontaneous speech and constrained tasks more prepared speech, these concepts are not identical. Additionally, the distribution of human scores may negatively affect ASE performance, but due to limited information in the original studies, we did not include this as a moderator. Finally, we evaluated the moderating effect separately. However, interaction effects between moderators may lead to substantial multicollinearity in the analyses (Hox et al., 2017). To gain a deeper understanding of ASE, future studies should adopt multiple moderator models to test for interaction effects between moderators.
Conclusion and implications
This meta-analysis examined the overall human–machine correlation of ASE systems from three dimensions as well as factors moderating the correlation using a three-level meta-analytic approach to synthesize all available data, solving the dependency issue of effect sizes in traditional meta-analysis. Our findings suggest that ASE systems generally fall short of the commonly accepted human–machine correlation (typically 0.7), and lag behind automated essay scoring systems, which often report correlations above 0.85 (Hussein et al., 2019). ASE systems tend to perform better in evaluating aspects related to speech delivery, including fluency and pronunciation, but show considerably lower correlations in assessing grammar and vocabulary, and content. In addition, human–machine correlation has shown a clear upward trend, increasing from the traditional machine learning stage, to the DL application stage, and further to the transformer-driven stage.
Additionally, the strength of correlation was significantly moderated by factors such as publication year, publication type, the unit of sample, age group, the level of task constraints, rater expertise, inter-rater reliability, system developer, feature engineering, and algorithm type. Notably, human–machine correlation in ASE has improved over time, coinciding with advancements in machine learning technology, which have enhanced the accuracy of both ASR, and scoring model predictions. However, ASE systems assessing spontaneous speech in unconstrained tasks still exhibit relatively lower human–machine correlation, suggesting that there is room for improvement. Moreover, systems developed by institutional research teams generally report higher human–machine correlations than those by private researchers. Furthermore, higher correlation was found in ASE employing advanced end-to-end structures, which can automatically extract features without the need for extensive manual feature engineering. Finally, both the training process and the reliability of human ratings serve as the prerequisites for ASE system performance.
Based on these findings, we proposed suggestions for future development of ASE systems. From a testing perspective, there is a gap in identifying features that accurately capture spoken grammar and vocabulary. Generative AI could also be used to assess higher-order features (e.g., logicality, topic development, and task fulfillment) and provide individualized feedback with detailed score reports. Additionally, expanding ASE to under-researched languages is essential to enhance fairness and inclusivity. From a technical perspective, we advocate enhancing human rating reliability through rigorous rater training and multiple ratings and report the human rating distribution to establish a robust dataset for model training. While advances in DL and large language models have improved ASE in accuracy, task diversity, and efficiency, their application in high-stakes assessments requires careful consideration. We suggest incorporating human judgment in feature extraction and model selection and maintaining a human–machine hybrid approach to reduce potential risks and ensure more valid ASE systems.
Footnotes
Acknowledgements
We are sincerely grateful to the reviewers and the editor for their constructive feedback on this work, and to our team members for their continuous support, insightful suggestions, and generous sharing of experiences.
Author contributions
Declaration of conflicting interests
The authors declared no potential conflicts of interest with respect to the research, authorship, and/or publication of this article.
Funding
The authors disclosed receipt of the following financial support for the research, authorship, and/or publication of this article: This research was supported by the Zhejiang Provincial Planning Office of Philosophy and Social Science (26QNYC003ZD).
Open practices
Supplemental material
Supplemental material related to this article (list of included studies, coding framework, extended results) is available on the Open Science Framework (OSF; Wang & Min, 2025): ![]() .
.