
Abstract
A key psychometric phenomenon in educational testing is differential item functioning (DIF), which evaluates whether specific test items function differently across subgroups of examinees who have the same level of the underlying (latent) ability. DIF happens when examinees with the same latent trait have different probabilities of correctly responding to a test item, influenced by their subgroup membership. This study aims to illustrate the application of the recursive partitioning Rasch tree model, shortly called the Rasch tree, to examine DIF in a large-scale German reading comprehension test for fifth-grade elementary students across gender, socioeconomic status, immigration status, personality disposition, and the need for cognition. Unlike the conventional DIF detection methods, the Rasch tree does not require a pre-specification of groups for exploring DIF, and continuous covariates can be easily included in the analysis. To investigate DIF of the test, item responses of 4,252 students were analyzed. The Rasch tree analysis generated nine non-predefined nodes, with slightly different patterns of item difficulties. Eleven items were flagged as exhibiting moderate and large DIF in the four splitting nodes. No splits were produced based on the need for cognition. The results indicated that the combination of the covariates impacted students’ test performance.
Keywords

Introduction
A main concern in educational testing is the detection of potential biases, including differentially functioning items that might compromise the validity of test score interpretations and uses as well as the fairness of assessments (AERA et al., 2014). One statistical approach allowing researchers to investigate the functioning of test items across different groups of examinees is differential item functioning (DIF; Holland & Thayer, 1988). As a form of measurement bias, DIF occurs when examinees with the same level of ability being measured, but from different groups (e.g., gender, age, race/ethnicity, educational level), have different probabilities of correctly responding to an item (Gamerman et al., 2018). Detecting DIF is essential for ensuring fairness and equity in measurement across subgroups because it helps reduce biases that could affect the validity and reliability of test scores. Failure to address DIF leads to inaccurate interpretations of test scores and disadvantages certain groups of examinees (Engelhard & Wang, 2021).
Several statistical techniques have been proposed to explore DIF (see Berrío et al., 2020 for a review). One group of methods is based on a matching variable that partitions the sample into reference and focal groups, including the Mantel-Haenszel test (MH) and logistic regression modeling. A second group comprises item response theory (IRT)-based methods (Magis et al., 2015), including those grounded in the Rasch model (Rasch, 1960/1980), which assume that an IRT model holds within each subgroup and compare parameter estimates or areas between item response functions across subgroups. Common examples include the likelihood ratio test, Raju method, and Wald test, all of which can be used within both Rasch and broader IRT frameworks to examine whether item parameters are invariant across groups.
Although these methods are statistically powerful and provide a clear interpretation of between-group differences, their major limitation is the requirement to predefine two or more groups (Effatpanah et al., 2025, 2026a). Therefore, other relevant characteristics are more likely to be overlooked (Strobl et al., 2015). For example, comparing only males and females may disregard DIF associated with other meaningful variables (e.g., age, ethnicity, socioeconomic status) and cause spurious group differences that fail to reflect more subtle variation among examinees (Effatpanah et al., 2025; Komboz et al., 2018).
With respect to the restrictions of the traditional DIF methods, recent methodological advances have proposed machine learning-based techniques for exploring DIF within the Rasch model (e.g., Henninger et al., 2023; Komboz et al., 2018; Strobl et al., 2015). These approaches are based on model-based recursive partitioning (Zeileis et al., 2008), which combines the decision tree paradigm (Morgan & Sonquist, 1963) with structural change tests (Zeileis & Hornik, 2007). More specifically, Strobl et al. (2015) developed an approach known as recursive partitioning Rasch tree model, or shortly called Rasch tree, for detecting DIF in the Rasch model. Henninger et al. (2023) recently proposed an extended version of the Rasch tree that explores DIF in a data-driven manner, quantifies effect sizes, and identifies DIF items. This extension has addressed a key limitation of earlier machine learning-based DIF methods, which primarily focus on subgroup detection rather than on the magnitude and substantive relevance of DIF. Although this approach is effective at detecting DIF, it has not received much attention within the field of language testing so far, especially for investigating DIF of reading comprehension tests in large-scale standardized assessments. Therefore, this study aims to illustrate the application of the Rasch tree in a language testing context by investigating DIF of a large-scale German reading comprehension test for fifth-grade elementary students.
(Recursive Partitioning) Rasch Tree
The Rasch tree is an integration of the Rasch model (Rasch, 1960/1980) with recursive partitioning techniques from machine learning and econometrics. Recursive partitioning is a set of methods from machine learning that recursively divide datasets into smaller subsets based on the values of predictor variables to generate homogeneous subgroups within the sample (see Strobl et al., 2009, for a comprehensive review). Model-based recursive partitioning DIF detection methods combine decision tree algorithms with parametric models like the Rasch model. They partition the feature space (i.e., the space occupied by all covariates or predictor variables) based on differences in item difficulty parameters estimated by the Rasch model (Effatpanah et al., 2025, 2026b).
Unlike traditional DIF detection methods that require pre-specification of focal and reference groups, the Rasch tree approach is a data-driven method and searches across covariates and their possible split points to identify subgroups with significant differences in item difficulty parameters. In this framework, possible DIF sources are represented by covariates (e.g., age, gender, first language, or educational background as examinee characteristics). The method performs one split at a time and then continues to search for further splits within the resulting subgroups, generating a tree structure that reflects complex DIF patterns across multiple covariates. In other words, while the covariates are pre-specified, the Rasch tree automatically determines where and how to partition the sample based on empirical evidence of DIF, with each split conditioned on preceding partitions (Henninger et al., 2023). Therefore, the resulting tree should be interpreted as exploratory, indicating data-driven evidence rather than a formal test of pre-specified hypotheses. Continuous variables can also be incorporated into the analysis without any categorization in this approach (Effatpanah et al., 2026b).
There are several consecutive steps for inferring the structure of a Rasch tree (Effatpanah et al., 2025). First, a joint Rasch model is fitted to the whole sample. Second, the Rasch model parameters are estimated for all participants through iterative procedures based on conditional maximum likelihood (CML) estimation. Third, item parameter stability across covariate levels is assessed using a structural change test. After estimating a Rasch model fsor the whole sample, the algorithm tests whether item parameters are invariant across subgroups defined by a covariate (e.g., age). If DIF is present, item parameters will be systematically different between the subgroups defined by the covariate. However, in the absence of DIF, they will show random fluctuations and are expected to be stable across covariate levels. For each covariate, a parameter instability is computed using an M-fluctuation test based on likelihood ratio statistics, with Bonferroni-adjusted p-values (Zeileis et al., 2008). The covariate with the smallest significant adjusted p-value (i.e., < .05) is selected for splitting.
Fourth, when a covariate is selected, the algorithm detects the most suitable cut-point by maximizing the split log likelihood (i.e., the sum of the log likelihood for two distinct models). All viable cut-points are tested to identify the optimal value at which the sample can be divided (Effatpanah et al., 2025).
Finally, these steps are recursively repeated within each subgroup (or node) until either a predetermined minimum sample size per node is reached to ensure estimation, or no further significant parameter instability is detected.
As Henninger et al. (2023) argue, Rasch trees identify global DIF sources but do not provide item-level DIF detection or effect-size estimates. In large samples, especially in large-scale assessments, these models also produce complex tree structures because they depend on significance testing. With large samples, even small item differences become statistically significant, which makes trees larger and more difficult to interpret (Effatpanah et al., 2025; Henninger et al., 2023).
Considering these problems, Henninger et al. (2023) proposed a new stopping criterion for the Rasch tree method based on the MH log odds ratio, aligning with Educational Testing Service’s (ETS’) DIF classification scheme. In this approach, an effect size measure is used to halt tree growth when only minimal item parameter differences exist across subgroups. Henninger et al. (2023) showed that this criterion reduces unnecessary splits in large samples, flags large DIF items, and reduces Type I error rates. Table 1 shows that the ETS-MH classification (Holland & Thayer, 1988) categorizes DIF as negligible (A), moderate (B), or large (C). Shervish’s p-value (Paek & Holland, 2015) is used to test whether the absolute MH log odds ratio
ETS Heuristic Classification for the Mantel-Haenszel Log Odds Ratio Method.
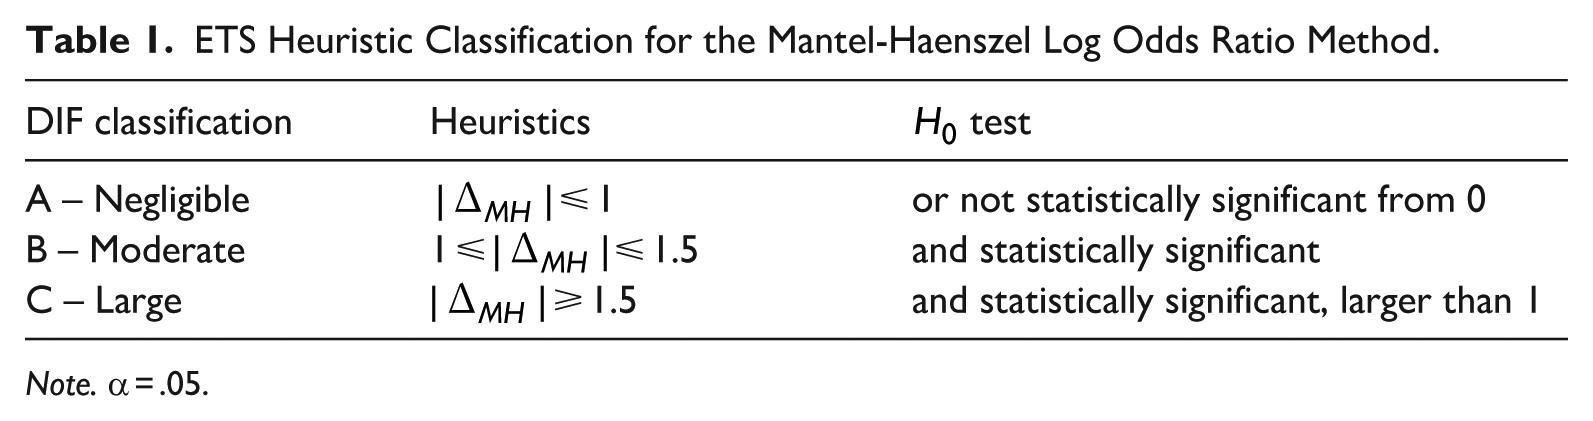
Note. α = .05.
Method
Data
The dataset used in the present study comprises item-level responses (missing values were coded as incorrect responses) of a full cohort of Luxembourgish fifth graders (N = 4,252 elementary students) to a large-scale German reading comprehension test. Data were collected in 2023 as part of Luxembourg’s national school monitoring program, Épreuves standardisées (ÉpStan; Martin et al., 2015). There were 2,096 (49.3%) boys and 2,156 (50.7%) girls ranging in age from 8 to 13 years (M = 10.27, SD = 0.533). Tests were administered by teachers during regular class time and students were expected to complete the paper-and-pencil-based test in 50 minutes. The test evaluates whether students have achieved proficiency levels deemed essential in the previous learning cycle. Test and item development took place at the Luxembourg Centre for Educational Testing (LUCET), which is responsible for conducting the national large-scale assessment ÉpStan in Luxembourg. Although German is the language of instruction in Luxembourg’s elementary schools, it is usually students’ second or even third language (cf. Ottenbacher et al., 2024). This context highlights the importance of conducting DIF analyses during test development and validation. All items were subject to systematic development procedures (item writing and reviewing) involving content experts (linguists and psychometricians) as well as teachers of the respective grade. The items were empirically pretested and their psychometric properties were evaluated using the Rasch model.
Students also completed a demographic questionnaire and two short scales measuring personality disposition and need for cognition. Background information included age, gender, and socioeconomic status (SES). Of the total sample, 702 (16.5%) were first-generation immigrant students, 1,527 (35.9%) were second-generation, and 2,023 (47.6%) were native. SES was indexed by the International Socioeconomic Index of Occupational Status (ISEI; Ganzeboom, 2010), which is based on parental education, occupation, and income. Based on the test score distribution in our dataset, students’ SES was categorized into three groups: low (16.25–34.41; n = 1,074, 25.3%), medium (35.31–52.70; n = 1,148, 27%), and high (58.33 69.90; n = 2,030, 47.7%). To assess students’ need for cognition, five items from Preckel and Strobel (2017) were administered using a 4-point Likert-type scale (1–4). The Need for Cognition Scale for Children (NFC-KIDS) measures students’ intrinsic drive to engage in and enjoy thinking and problem-solving activities. Additionally, to assess short markers of students’ personality disposition, five items on the same 4-point Likert-type scale were also administered. Of these, two items measured openness and three items measured conscientiousness.
Data Analysis
A preliminary analysis was conducted to investigate psychometric properties of the reading comprehension test and the scales, including descriptive statistics, reliability estimates, and assessments of unidimensionality as well as correlations among variables. This analysis was conducted to explore potential sources of construct-irrelevant variance (CIV) and any anomalies in the data. Due to space limitations, the results are provided in Supplementary Appendix A.
The reading items were subjected to Rasch tree analysis (see the R codes in Supplementary Appendix B) to identify DIF across gender, SES, immigration status, the Need for Cognition, and the Personality Disposition using the psychotree package (Zeileis et al., 2025) in R (R Core Team, 2025). The emergence of several nodes suggests that a single dichotomous Rasch model does not hold for the entire sample and that different subgroups of students, defined by their group membership and relevant covariates, show different item difficulty patterns. In addition to the above-mentioned procedure for the Rasch tree, the widely used ETS classification scheme based on the MH log odds ratio was used to determine when to stop partitioning. A minimum node size of 120 was also set in the Rasch tree to ensure stable parameter estimation.
To evaluate the practical impact of detected DIF items, we conducted a person-level DIF impact analysis. First, we estimated a Rasch model using all items and the full sample to obtain global item difficulty and person ability estimates, which defined the operational reference scale. Second, for each terminal node in which DIF was detected, we re-estimated a Rasch model using only the non-DIF items within the respective node subsample, assuming measurement invariance of these items. Because Rasch model calibrations are identified up to an additive constant, the node-specific calibration may differ from the global calibration by a location shift. To align the node-specific scale with the global reference scale, we computed the mean difference between the global and node-specific difficulty estimates of the common (non-DIF) items and used this value as an additive linking constant (mean/mean linking). The node-specific person ability estimates were then transformed onto the global metric by adding this constant. Finally, for each student within the respective node, we computed the difference between the global ability estimate (based on all items) and the DIF-adjusted ability estimate (based on non-DIF items, linked to the global scale). The mean and distribution of these differences were used to quantify the magnitude of DIF impact and to evaluate whether the detected DIF posed a substantive threat to score interpretation.
Results
The item responses were analyzed for any group disparities caused by students’ covariates. As shown in Figure 1, the resulting model indicates how test items were partitioned based on a combination of the covariates, yielding more than one terminal node. There were nine nodes in the model, with five terminal nodes as illustrated by rectangles at the lowest part of the tree (Nodes 2, 5, 6, 8, and 9). In each of the terminal nodes, estimates of item difficulty are graphically shown for the 40 items. The x-axis of the profile plots across the terminal nodes shows the items, while the y-axis displays the range of item difficulties, varying from −3.49 to 3.91 logits. In the first node (p < .001), differences in immigration status produced distinct item difficulty patterns and partitioned the sample into two different subgroups, separating first- and second-generation students from native students. The resulting non-native subgroup (Node 2) included 2,229 students. Within the native group, students were further partitioned into two daughter nodes based on their gender (Node 3, p < .001). Among girls, SES led to an additional split (Node 4, p < .001), forming two subgroups: students from low/middle SES backgrounds (Node 5, n = 455) and those from high SES backgrounds (Node 6, n = 561). Among boys, personality disposition produced a further partition (Node 7, p = .005), dividing students with lower personality scores (⩽ 18, Node 8, n = 703) from those with higher scores (> 18, Node 9, n = 304). These splitting patterns indicate variations in item difficulty parameters across the subgroups. This constitutes empirical evidence that the measurement invariance failed to hold among students of different subgroups and that they were differently impacted by DIF across the covariates. Notably, no splits were produced based on the Need for Cognition.
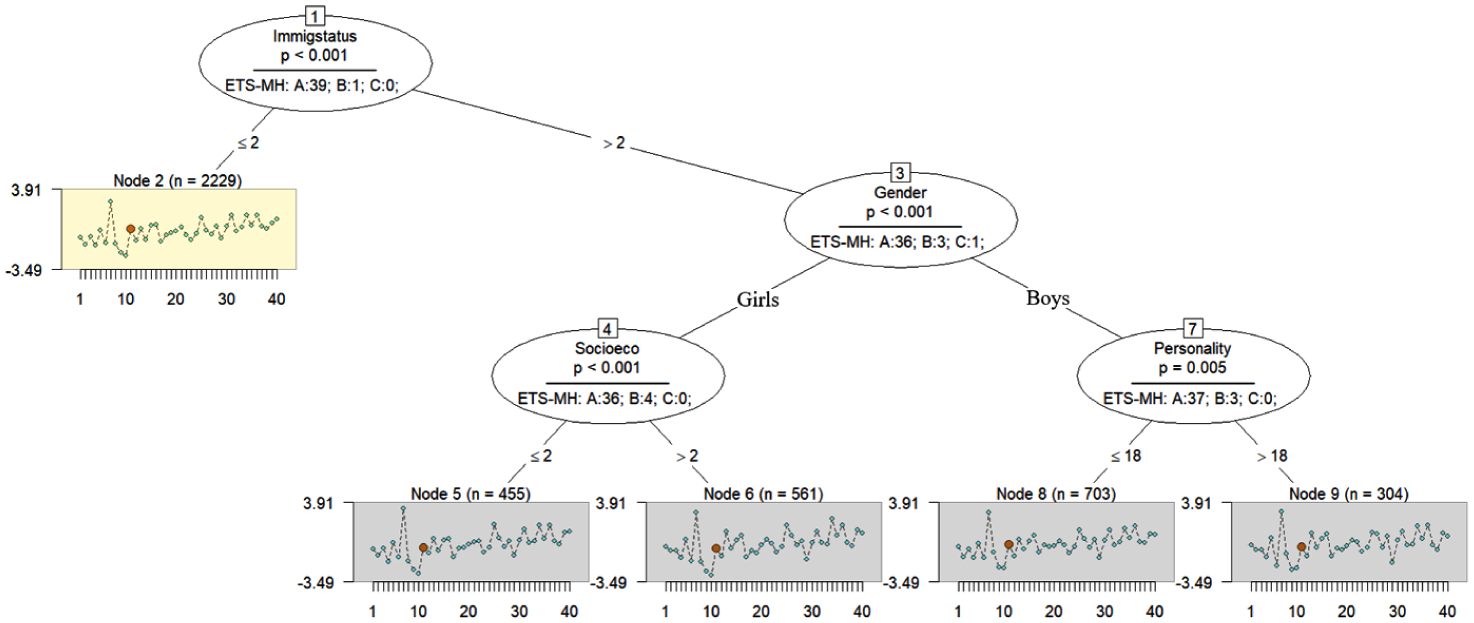
Profile plot of the Rasch tree for the reading comprehension test.
The tree also incorporates ETS-MH DIF classifications (A, B, and C) at each split, highlighting different levels of DIF across the nodes. In the profile plot, items with moderate DIF are shown by medium-sized orange circles and DIF-free items by small blue circles. Note that the items in the terminal nodes are linked to the oval for Node 1. Effect sizes in the first node indicated that 39 items were classified as having negligible or no DIF (Category “A”), only one item (Item 11) was classified with moderate DIF (Category “B”), and no items were classified with large DIF (Category “C”) based on the covariate “immigration status.” Therefore, although the split was statistically significant, the magnitude of DIF at this level was generally small. Further analysis of effect sizes at the other splitting nodes (Nodes 3, 4, and 7) indicated that the most items fell into category “A,” but several items showed moderate or large DIF, and the direction of these effects varied. In Node 3, the “gender” split yielded one item with a large DIF (Item 8) and a substantial positive effect size (1.901 logits), indicating that the item was considerably more difficult for the boy subgroup than the girl subgroup. Items 10, 25, and 34 showed moderate DIF (Category “B”), with effect sizes exceeding ± 1 logit, suggesting meaningful changes in item difficulty. In Node 4, Items 4, 7, 19, and 34 had moderate DIF regarding the “socioeconomic status” among girls, with effect sizes ranging approximately from −1.200 to 1.083 logits. Their direction indicated that some items were more difficult for lower-SES students (positive values), whereas others were relatively easier (negative values), reflecting non-uniform patterns of (dis)advantage. Items 6, 23, and 38 were also classified as Category “B” in Node 7 concerning the “personality disposition,” with effect sizes reaching −1.613 and 1.233 logits. The results of effect sizes and DIF classifications for all the splitting nodes are available in Supplementary Appendix C.
To further illustrate how the magnitude and direction of DIF should be interpreted, the terminal nodes presented in Figures 1 and 2 provide a clear example of how these classifications are reflected in subgroup-specific differences in item difficulty. For example, Item 38 showed moderate DIF (effect size = −1.544), and its estimated difficulty was 0.171 logit in Node 8 and −0.539 logit in Node 9. These nodes were generated based on the interaction of immigration status, gender, and personality disposition. The difference indicates that Item 38 was more difficult for students in Node 8 (boys with lower personality disposition scores within the non-immigrant group) than for those in Node 9 (boys with higher personality disposition scores). Another example is Item 4 at splitting Node 4 that was produced based on the interaction of immigration status, gender, and socioeconomic status. Item 4 showed moderate DIF with an effect size of 1.083 logits. Examination of the node-specific difficulty parameters indicated that the item was more difficult for students in Node 6 than for those in Node 5.
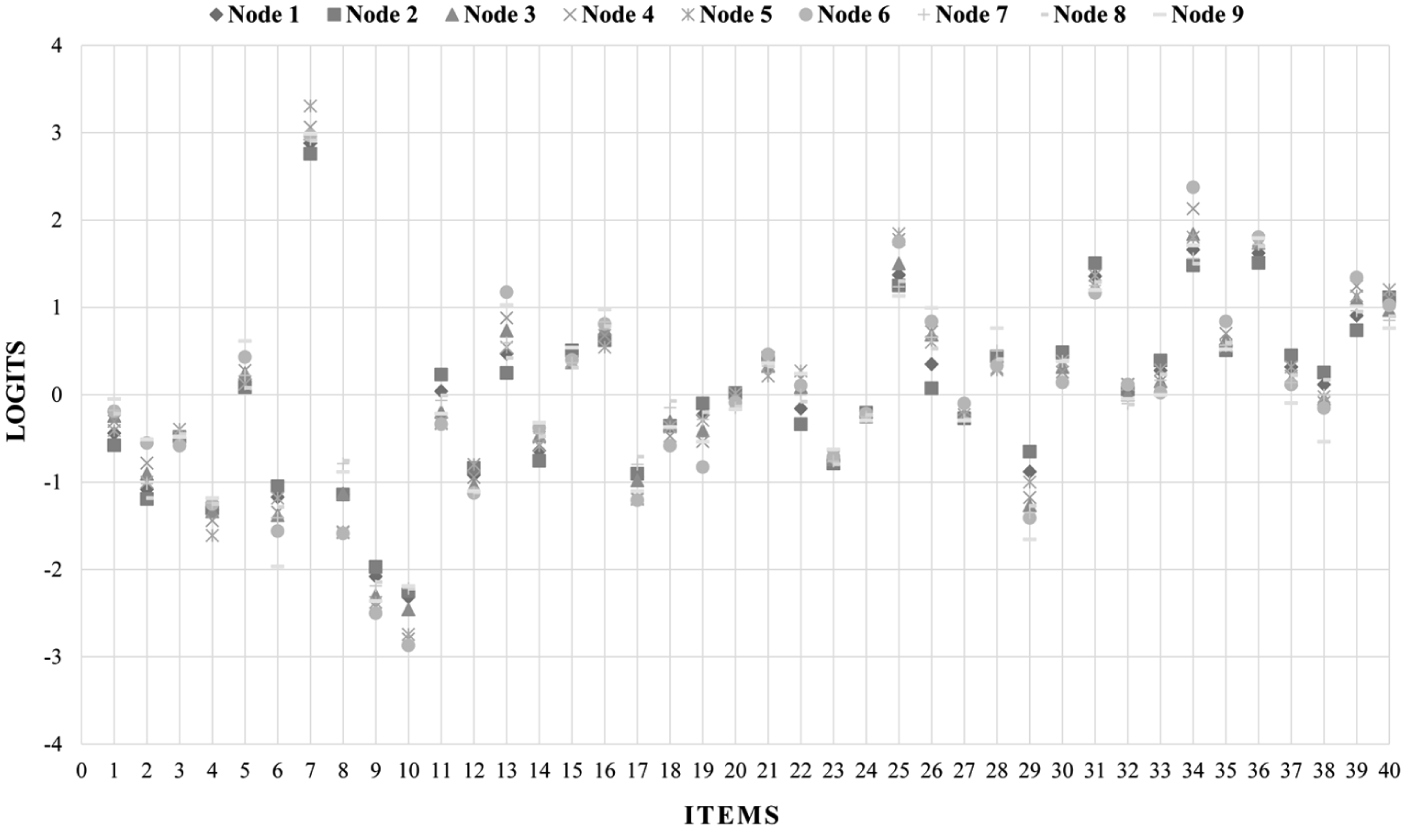
Item difficulty patterns within the nodes.
In Rasch trees, item difficulty parameters are estimated separately within each node and rely on specific parameter constraints. Therefore, their absolute difficulty values should not be compared across nodes. The difficulty level of the reading items within each node was further analyzed. The pattern of item difficulties in the nine nodes is depicted in Figure 2. For instance, in Node 1, Items 7, 34, and 36 were the most difficult, whereas Items 10, 9, and 4 were the easiest with −2.318, −2.080, and −1.318 logits, respectively. Similarly, in Node 9, Items 7, 36, and 34 were the most challenging, while Items 9, 10, and 6 were the easiest ones. This stability in rank ordering suggests that, despite localized DIF effects in specific items, the overall difficulty level of the reading test was mostly invariant across the subgroups. The results are available in Supplementary Appendix D.
To examine the practical consequences of DIF at the person level, we compared global ability estimates (based on all items) with DIF-adjusted ability estimates (based on non-DIF anchor items) using a cut-point of |0.20| logits. This cut-point was used to identify practically meaningful differences in ability estimates. In Rasch measurement practice, differences of approximately 0.20–0.30 logits are usually considered small but noticeable deviations in measurement (e.g., Wright & Stone, 1979). The cut-point was thus selected as a conservative criterion for identifying students whose scores were meaningfully affected by DIF. Due to space limitations, the results are available in Supplementary Appendix E. Across all terminal nodes, mean differences were close to zero (range: −0.065 to 0.008 logits), indicating no substantial systematic bias at the group level. However, variability differed across nodes. Node 2 showed minimal dispersion (SD = 0.065) and only 10 students exceeded the |0.20| criterion, suggesting negligible practical impact. In contrast, Nodes 5, 6, 8, and 9 exhibited larger variability (SDs between 0.190 and 0.295). The largest effects were observed in Node 6 (SD = 0.295), where 204 students exceeded the cut-point. Similarly, 202 students in Node 8 and 120 students in Node 5 showed practically meaningful score differences. These findings indicate that although DIF had little effect on mean ability estimates at the group level, a number of students experienced changes in their individual scores.
Discussion and Conclusion
The results showed that there are slight differences in item difficulty patterns across students in the resulting nodes, conditional on the partitioning covariates, and the Rasch tree could reflect the underlying interaction between the covariates and the test items. Immigration status, gender, SES, and personality disposition were variables that impacted item responses in a recursive and non-linear manner. At first, the students were partitioned into two subgroups based on their immigration status. Native students were split into further subgroups based on their gender. Girls were then split regarding their SES, whereas boys were partitioned by their personality disposition. The overall tree structure is in line with theoretical assumptions about the role of sociocultural and dispositional factors in reading performance. Previous studies have reported that immigration status, gender, and SES are main predictors of reading performance and differential test functioning (e.g., Meyer et al., 2019; Wang, 2021). The split on personality dispositions also indicates its role with (academic) engagement, self-regulation, and test performance. The absence of splitting based on Need for Cognition indicates that this variable did not have a meaningful contribution to DIF and is likely to impact reading comprehension at a global level (e.g., total scores) but not systematic item-level differences.
It should be noted that DIF only shows statistical differences in item responses across subgroups. It does not indicate problems in item development or provide conclusive evidence of CIV. Studies in language testing and assessment contexts have shown that content experts cannot usually find clear cognitive or linguistic reasons to explain group differences when they review DIF items (e.g., Geranpayeh & Kunnan, 2007). Therefore, DIF does not necessarily indicate problematic items, but it shows different performance across subgroups that need further analysis. Consequently, DIF findings should be interpreted with caution, and statistical evidence should be followed by qualitative or substantive review before decisions for item revision are made.
Although it is not the purpose of this illustrative brief report to provide a detailed content analysis of the items exhibiting DIF, a brief content review with the test developer and content specialist indicated that differences in performance across subgroups can be due to several item-related characteristics. Some items required open-response formats or sentence completions (mainly involving paraphrasing or inserting words or phrases drawn from the text), which increased students’ linguistic and cognitive load. Other possible reasons for DIF included ambiguous correct response options, reliance on deduction or world knowledge, complex text passages, and linguistic features (e.g., negation, passive voice, or phonetic similarity) among distractors. Some item difficulties were also caused by format limitations or subtle textual cues not clearly stated. These issues could be considered in future test revisions to reduce CIV and improve test fairness.
A person-level impact analysis was conducted to investigate the practical significance of the detected DIF items. The results showed negligible mean differences across the nodes, and only a small number of students exceeded the cut-point. This suggests that although the item-level analyses revealed differences in item functioning across the subgroups, these changes resulted in only small differences in students’ ability estimates. Therefore, we can conclude that the localized DIF effects did not meaningfully threaten the validity of the total test scores.
As the results have demonstrated, a main methodological advantage of the Rasch tree is that it does not require the prior specification of groups for detecting DIF. Instead, subgroups caused by DIF are identified automatically through recursive, data-driven splits based on covariates (e.g., gender, SES, immigration status), including continuous ones. Compared to traditional regression models that only consider pre-specified main effects and interactions, the model-based recursive partitioning approach flexibly detects subgroup heterogeneity within subgroups (Strobl et al., 2015). More importantly, the algorithm selects splits in explanatory variables that best separate items based on differences in their difficulty.
Despite their advantages, Rasch trees can have some practical limitations. As Kiefer and Sengewald (2025) have underscored, their main goal is to generate internally homogeneous subgroups rather than identify exceptional subgroups. When partitions are sufficiently homogeneous, the recursive algorithm stops, potentially disregarding smaller but meaningful exceptions within these partitions. Subgroups with similar DIF patterns may also be merged even if the underlying causes are different. Additionally, Rasch trees impose a deterministic and hierarchical structure on the data. Unlike mixture models using probabilistic class membership, Rasch trees assign each student to a subgroup based on the selected split. There may be more than one equally reasonable alternative for each split, making the resulting tree structure uncertain. Although Philipp et al. (2016) introduced the stable learner approach to assess this instability through resampling techniques, this method focuses on variable selection rather than flexible group assignment. To address these issues, Kiefer and Sengewald (2025) proposed exceptional model mining in Rasch models (RaschEMM) to explore exceptional subgroups rather than identifying a global model of the data.
Furthermore, as Effatpanah et al. (2025) have argued, similar to many unsupervised learning models, tree-based IRT models are vulnerable to model overfitting. Rasch trees, in particular, may overfit because they iteratively partition the data into smaller subgroups to improve model fit. However, several strategies can reduce this risk in the Rasch tree framework such as multiplicity adjustments (e.g., Bonferroni correction or FDR control) for controlling the family-wise error rate, tree pruning techniques, regularization, cross-validation, and assessing whether detected splits are theoretically and practically sensible (Effatpanah et al.,2025, 2026b).
An important consideration for researchers while applying tree-based models such as the Rasch tree is that the sample size should be large enough to provide adequate statistical power for detecting DIF (Effatpanah et al., 2025). Each time a split is made, the sample size within a node becomes smaller and estimation of the item parameters can become more difficult. Therefore, each subgroup needs a sufficient number of examinees to yield stable estimates and valid conclusions about DIF. Otherwise, parameter estimates are likely to be unstable, increasing the risk of Type I and Type II errors.
Finally, in practical applications, there may be inconsistent results between the analysis of the Rasch model and Rasch trees. Although the principal component analysis of linearized Rasch residuals (PCAR) and mean square (MNSQ) statistics can suggest unidimensionality and the absence of DIF, Rasch trees can still detect item-level non-invariance. One possible explanation is that PCAR and MNSQ are not very sensitive to parameter invariance across subgroups and to multidimensionality induced by DIF (Smith & Plackner, 2009). PCAR depends on residual correlations and is likely to fail to detect DIF when group differences appear in response probabilities rather than in the residual structure. This suggests that global fit statistics are limited in capturing differences in item functioning across subgroups. Another explanation is the methodological differences between the two approaches. The Rasch model assumes unidimensionality and invariant item parameters for all examinees, whereas Rasch trees detect DIF by recursively partitioning the sample based on covariates to identify subgroups with different item difficulties. Simulation studies could be conducted to clarify the conditions under which conventional Rasch statistics cannot detect DIF.
Supplemental Material
sj-pdf-1-ltj-10.1177_02655322261451765 – Supplemental material for Beyond Traditional Differential Item Functioning Detection: A Rasch Tree Approach to Evaluating Item Fairness in a Large-Scale German Reading Comprehension Test
Supplemental material, sj-pdf-1-ltj-10.1177_02655322261451765 for Beyond Traditional Differential Item Functioning Detection: A Rasch Tree Approach to Evaluating Item Fairness in a Large-Scale German Reading Comprehension Test by Farshad Effatpanah, Olga Kunina-Habenicht, Katharina Antonia Michiko Tremmel and Philipp Sonnleitner in Language Testing
Footnotes
Acknowledgements
The first author gratefully acknowledges the Luxembourg Centre for Educational Testing (LUCET) for supporting short research visits in November 2025 and February 2026.
Author Contributions
Funding
The authors received no financial support for the research, authorship, and/or publication of this article.
Declaration of Conflicting Interests
The authors declared no potential conflicts of interest with respect to the research, authorship, and/or publication of this article.
Data Availability Statement
The datasets generated during and/or analyzed during the current study are available from the last author upon reasonable request.
Declaration of Generative AI in Scientific Writing
During the preparation of this work, the authors used ChatGPT (OpenAI) in order to shorten and improve the quality of the written text (language checking and formatting). After using this tool/service, the authors reviewed and edited the content as needed and take full responsibility for the content of the published article.
Supplemental Material
Supplemental material for this article is available online.
References
Supplementary Material
Please find the following supplemental material available below.
For Open Access articles published under a Creative Commons License, all supplemental material carries the same license as the article it is associated with.
For non-Open Access articles published, all supplemental material carries a non-exclusive license, and permission requests for re-use of supplemental material or any part of supplemental material shall be sent directly to the copyright owner as specified in the copyright notice associated with the article.