
Abstract
For children and youth, the journey to and from school represents a significant opportunity to increase daily levels of physical activity by using non-motorized modes of travel, such as walking and biking. Studies of active school travel have demonstrated that the likelihood a child will walk or bike is significantly influenced by the distance they must travel between home and school, which in turn, is influenced by built environment characteristics such as the configuration of the local road network. This study examines how shortcuts can facilitate active school travel by decreasing the distance children must travel to get to and from school. A geographic information system was used to compare shortest route distances along road networks with and without shortcuts in 32 elementary school zones in London, Ontario, Canada and provide evidence on the effectiveness of shortcuts to facilitate active school travel. This study contributes two key findings: (1) shortcuts have a greater impact in areas with low street connectivity and low population density and (2) children living farther from school are more likely to benefit from shortcuts. The findings suggest that planners should consider the location and maintenance of shortcuts in school neighbourhoods in order to promote increased physical activity, health and well-being among students.
Introduction
Many children in developed countries live sedentary lifestyles and their lack of physical activity contributes to the growing obesity epidemic (Giles-Corti et al., 2011). In Canada, for example, 31.5% of children between the ages of 5 and 17 are classified as overweight or obese (Roberts et al., 2012). To help maintain a healthy weight and reduce risk of associated health conditions, it is recommended that children participate in at least 60 minutes of moderate to vigorous physical activity each day (Tremblay et al., 2011). One way for children to achieve this recommended daily amount of physical activity is by using active modes of travel to and from school, such as walking or bicycling (Panter et al., 2010).
Despite the importance of active school travel (AST) to children’s health, in recent decades there has been a steady decline in participation. Buliung et al. (2009) found a significant decline of AST in the Greater Toronto Area between 1986 and 2006. Participation fell from 53.0% to 42.5% for students 11–13 years old and from 38.6% to 30.7% for students 14–15 years of age. Similar declines are also found in other developed countries, such as the United States (Ham et al., 2008; Mcdonald, 2007), Australia (van der Ploeg et al., 2008) and the UK (Pooley et al., 2005). While current rates of AST has been linked to many different individual and neighbourhood characteristics (Boone-Heinonen et al., 2010; Cerin et al., 2009; Chircop, 2011; Evans, 2009; Giles-Corti et al., 2011; Lipnowski and Leblanc, 2012; McMillan, 2007; van Loon and Frank, 2011; Wen et al., 2008), an increase of distance between school and home makes AST very difficult for many children (Giles-Corti et al., 2011; Larsen et al., 2012; van Loon and Frank, 2011).
Longer distances needed to travel between home and school can be directly linked to the built environment of the school neighbourhood. The built environment is the human-made part of our physical surroundings, including the buildings, parks, road systems and other infrastructure that we encounter in our daily lives (Health Canada, 2002). Many features of the built environment are related to AST, such as: population density, land use mix, aesthetic appearance, street scale and provision of sidewalks (Frank et al., 2007; Giles-Corti et al., 2009, 2011; Larsen et al., 2009, 2012; Mitra and Buliung, 2012; Panter et al., 2008, 2010; Schlossberg et al., 2005; Timperio et al., 2006), but street connectivity can have one of the biggest impacts because it can be directly linked to the distance between home and school.
Connectivity is defined as the way in which streets are arranged within a transportation network (e.g. grid network, cul-de-sacs) and highly connected road networks provide vehicular and pedestrians traffic to travel within a neighbourhood in a direct manner (Handy et al., 2002). Connectivity is heavily influenced by average block length and straight-line distance between two locations (Handy et al., 2002). The traditional grid network, found in the core of many North American cities, can maximize connectivity by maintaining city blocks of similar size and providing access to nearby streets while minimizing distance and creating a more walkable neighbourhood (Giles-Corti et al., 2011); although, with this added connectivity pedestrians are exposed to higher traffic volume and safety concerns. Children whose homes border those well-connected areas may be subject to high volumes of traffic (Giles-Corti et al., 2011), which can lead to lower rates of AST (Panter et al., 2010).
Many newer neighbourhoods have moved away from the traditional grid-like design, creating developments using traffic calming measures that offer a safe street environment where children can play, most notably the cul-de-sac (Nelson and Woods, 2007). This neighbourhood design feature limits through traffic, decreases connectivity and generally increases distances between origins and destinations, making all forms of active travel less appealing to residents (Wei and Lovegrove, 2012). Lower traffic flow will increase safety and provide parents comfort to allow their children to utilize AST, but the limited connectivity of the cul-de-sac design often drastically increases the distance children must travel to reach their school. While the traditional grid and cul-de-sac designs are not the only forms of neighbourhood road networks they are the predominant forms used in many London neighbourhoods.
In neighbourhoods where there is low connectivity, planners and developers can shorten the travel distance between home and school by including shortcuts in their development plans. Shortcuts are defined in this study as paths, either formal or informal, that increase connectivity and shorten the travel distance between two locations. These shortcuts can be formal, which are constructed design features, or informal, which are created by pedestrians cutting through public or private open space. Past studies have investigated how children’s AST patterns are related to the connectivity of the road network or distance travelled (Frank et al., 2007; Mitra and Buliung, 2012; Panter et al., 2008, 2010; Schlossberg et al., 2005, 2006; Timperio et al., 2004, 2006); however, few, if any, examine how shortcuts affect a child’s ability to maneuver through their school neighbourhood.
Chin et al. (2008) acknowledged the importance of considering shortcuts along with the road network in order to evaluate how distance and connectivity influence AST. Considering both shortcuts and road network in analysis can significantly increase the connectivity of a neighbourhood and lead to shorter travel distances between home and school, especially in neighbourhoods with low street connectivity (Giles-Corti et al., 2011; Larsen et al., 2009, 2012).
This study builds upon the current evidence by examining the role that formal and informal shortcuts play in facilitating AST in the region of Middlesex–London. Two objectives are addressed to better understand the relationship between shortcuts and AST: (1) to examine the effect shortcuts have on the distance children travel to school and (2) to examine how the characteristics of a neighbourhood can change the prevalence of shortcuts and shorten the distance travelled to school. These objectives will be addressed by conducting a series of shortest path analyses to compare the road network to the circulation network to determine the influence shortcuts have on the travel distances between home and school.
The Methods section of this study describes the methods used to collect and analyze the data. This is followed by results addressing the research objectives. Finally, the discussion and conclusions examine the relationship between shortcuts and children walking to school to make recommendations on how to better facilitate AST.
Methods
Data collection
Primary data for this study are a pedestrian circulation network, which is a Geographical Information System (GIS) layer that is developed by adding shortcuts to the existing municipal road network. The circulation network is created through a process that combines Global Positioning System (GPS) tracking, walkabouts and digitizing to determine accurate locations of formal and informal shortcuts throughout the region.
GPS tracking data, which was collected as part of the Spatial Temporal Environment and Activity Monitoring (STEAM) project (steamproject.ca; Loebach and Gilliland, 2010), provided a detailed understanding of the routes that 113 children ages 10 to 13 used to travel actively to and from school. These children attended one of the six schools across the region of Middlesex–London in Ontario, Canada between 2010 and 2013. Layering the GPS tracks on recent orthorectified aerial photographs, or orthophotos, of the region (City of London Geomatics, 2011, 2012, 2013) within a GIS (Environmental Systems Research Institute, Inc. (ESRI), 2011) we were also able to identify the physical characteristics of the route, such as which segments were on formal and informal shortcuts.
The initial analysis of GPS tracking data provided potential shortcut locations to visit on the walkabout for each of the six sample schools. The walkabout was developed based on shortcut locations that were within a 1.6 km ‘walk zone’ around each school. This distance is the cutoff used locally to determine eligibility for school bus service (Larsen et al., 2012) and is considered by parents and children to be a reasonable distance for using AST (Giles-Corti et al., 2011; Hill, 2012; Larsen et al., 2009, 2012). Each walkabout began at the school, with the researchers recording observations on a paper map. The walkabout would gradually move outwards to investigate other areas of interest identified from the GPS data. When shortcuts were identified, photographs were taken and observations recorded regarding its location (e.g. proximity and directionality relative to the school), built environment characteristics (e.g. length, width, sinuosity) and appearance (e.g. well-maintained, cleanliness, visibility from connecting roads).
The six walkabouts provided examples of various types of shortcuts, and these examples were used to support the creation of a school neighbourhood circulation network. Using orthophotos as a base layer in GIS, a ‘shortcut’ file (polyline) was created by digitizing visible shortcuts, in addition to the shortcuts discovered from the GPS and walkabouts. The walkabouts provided deeper contextual understanding of shortcuts, and how to identify them using only orthophotos. Once a shortcut was identified on the ground, it was then possible to locate them on a map from only an aerial view by identifying features with similar characteristics (e.g. the line of a dirt pathway worn into an otherwise grassed area). This provided the evidence necessary to accurately digitize the shortcuts for all 32 schools. The map in Figure 1 shows the distribution of shortcuts that have been added to the network.
Comparison of Road and Circulation Networks in London, Canada.
Measures
There are several key measures that are used in this study to better understand how shortcuts can alter the distance children travel on their way to and from school: (1) shortest network distance; (2) built environment measures and (3) neighbourhood level measures.
Shortest network distance
Hypothetical home locations were created by placing points on residential addresses at 500-m and 1000-m distance (Euclidean) from each of the 32 schools. The 32 schools were selected to complement other work being done in these school neighbourhoods by the research team and are stratified by median household income of the neighbourhood they reside and urbanicity. The length of the shortest network path was then calculated between the home locations and associated school using (1) road network and (2) circulation network. The inset map in Figure 1 provides an example of how the shortest path for the road and circulation networks can differ by distance travelled and route taken.
Built environment
Four built environment measures are created for the school ‘walk zones’, including: (1) urbanicity, a binary measure indicating whether the school neighbourhood has urban or suburban built environment characteristics; (2) intersection density (City of London Geomatics, 2011, 2012, 2013), the number of four-way (grid-like) intersections per square kilometre (City of London Geomatics, 2011, 2012, 2013); (3) land-use mix, the percentage of the school ‘walk zone’ that is zoned as residential, parks and recreation or commercial land use (City of London Geomatics, 2011, 2012, 2013) and (4) dwelling density (Statistics Canada, 2006), the number of dwellings in the ‘walk zone’ as estimated by the census dissemination areas (DA) inside the zone per square kilometre.
School neighbourhood
Two school neighbourhood measures are created for the school ‘walk zones’, including: (1) median household income (Statistics Canada, 2006), the income level of the census tracts (CT) in which the school resides and (2) average era of homes (Statistics Canada, 2006), the average era of homes by year for all DA’s in the ‘walk zone’.
Data analysis
A description of the type of shortcuts that children use for AST is provided. The GPS data, field notes from the walkabouts and photographs were combined to describe the characteristics found in formal and informal shortcuts. This analysis helps to create a list of generalizable shortcuts that were used to identify similar shortcuts on orthophotos from other school zones.
A series of quantitative analysis using Statistical Package for the Social Sciences (SPSS) 21 (IBM Corp, 2012) was used to determine if there was a significant difference between the length of the shortest path calculated using the road network and the circulation network. A Shapiro–Wilk test of normality (Rogerson, 2010) was run to determine which type of significance test would be appropriate based on its distribution, either a paired sample t-test (normally distributed) or a related sample test (non-parametric data). These tests were completed for three different groupings of data: (1) entire data set; (2) 500 m and 1000 m and (3) each of the 32 schools.
A quantitative analysis was conducted in SPSS to examine how the characteristics of a neighbourhood can change the prevalence of shortcuts and shorten the distance travelled to school. Analysis of variance (ANOVA) was used to compare the mean difference in length of the shortest path between difference in median household incomes, dwelling densities, intersection densities, % of residential land use, % of parks and recreation land use, % of commercial land use and average era of home. T-Tests were used to compare the mean difference for urbanicity.
Results
Description of shortcuts
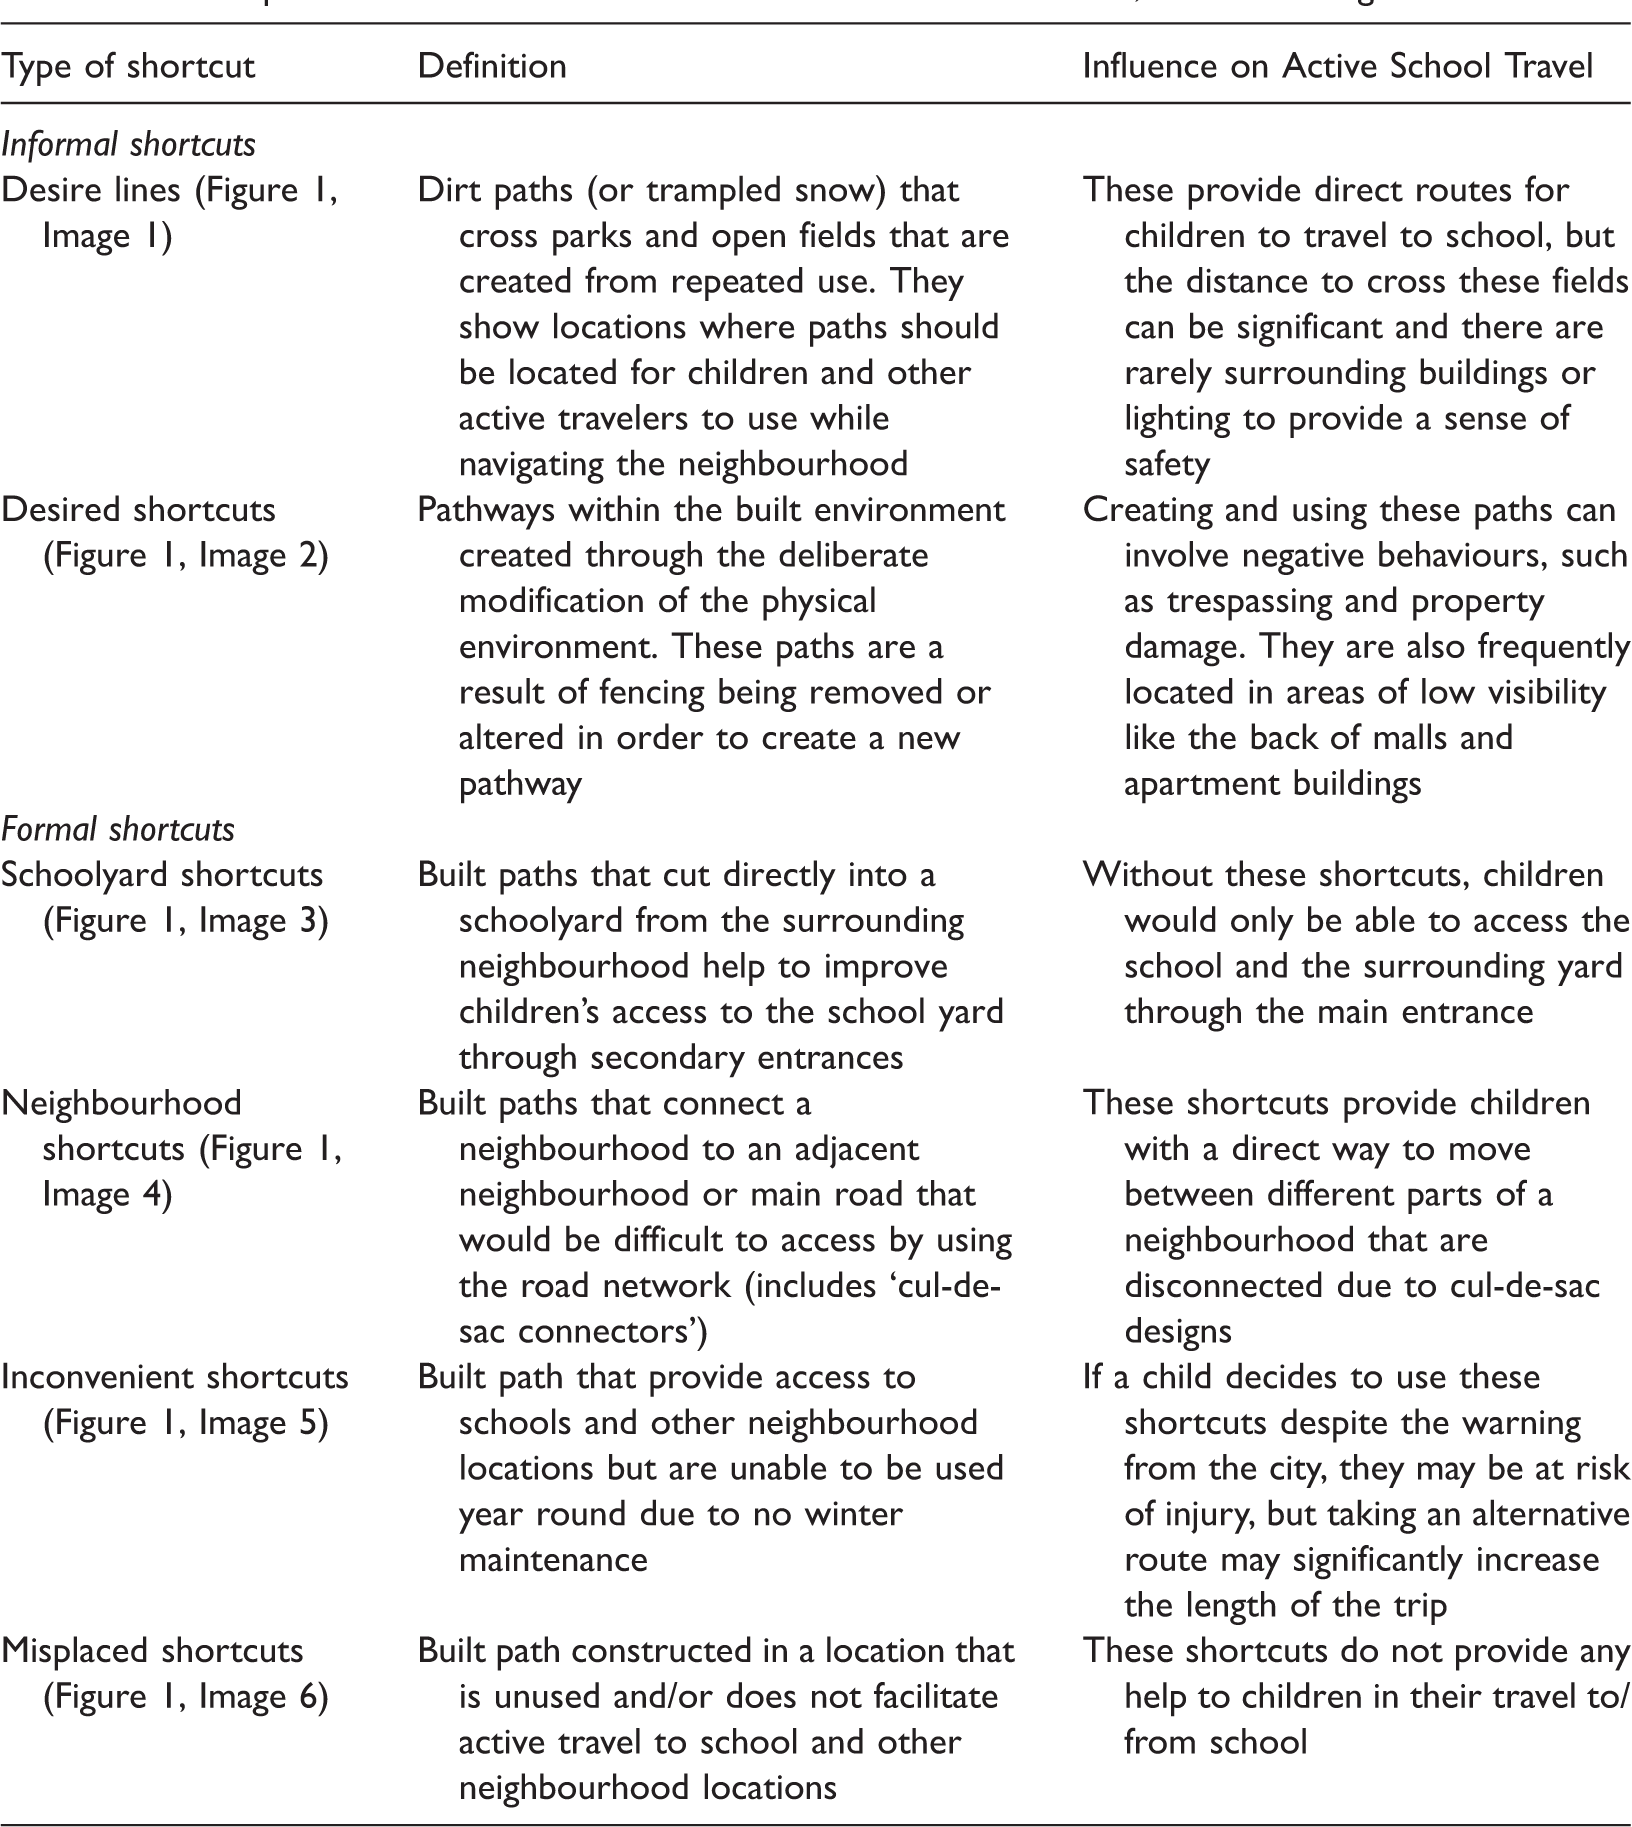
Descriptions of formal and informal shortcuts found in London, Canada during walkabouts.

Examples of shortcuts found during walkabouts in London, Canada.
Formal shortcuts are defined as built paths that have been created (with the approval of the municipality) by private developers, institutions or the municipality with the intention of increasing connectivity for pedestrians and supporting active travel. There were four types of formal shortcuts identified during the walkabouts: school shortcuts, neighbourhood shortcuts, inconvenient shortcuts and misplaced shortcuts (see Table 1). While the design of both formal and informal shortcuts may not always be the safest way to travel to school, children (and other pedestrians) apparently strive to always take the shortest route to school, and methods used to measure the shortest path needs to consider shortcuts.
Shortcuts influence the distance to school
The difference between the shortest path distances calculated for the road network (without shortcut) and circulation network (with shortcuts) was compared using a series of paired statistical tests (parametric or non-parametric as applicable), and the findings show that all of the comparisons are significant. On average, students residing in the homes located 500 m from the school would be required to travel 766 m to school when only the road network is used, or 71 m farther than if they used the shortest path along the circulation network of 695 m (t value = 10.6; df = 748; p < 0.001). Similarly, the children whose homes are located 1000 m from school would be required to travel an average of 1481 m, or 74 m farther than if they took the circulation network shortest path of 1408 metres (t value = 13.224; df = 1243; p < 0.001). The findings show that there is a higher significant difference when evaluating the homes located 1000 m from the school.
School by school comparison
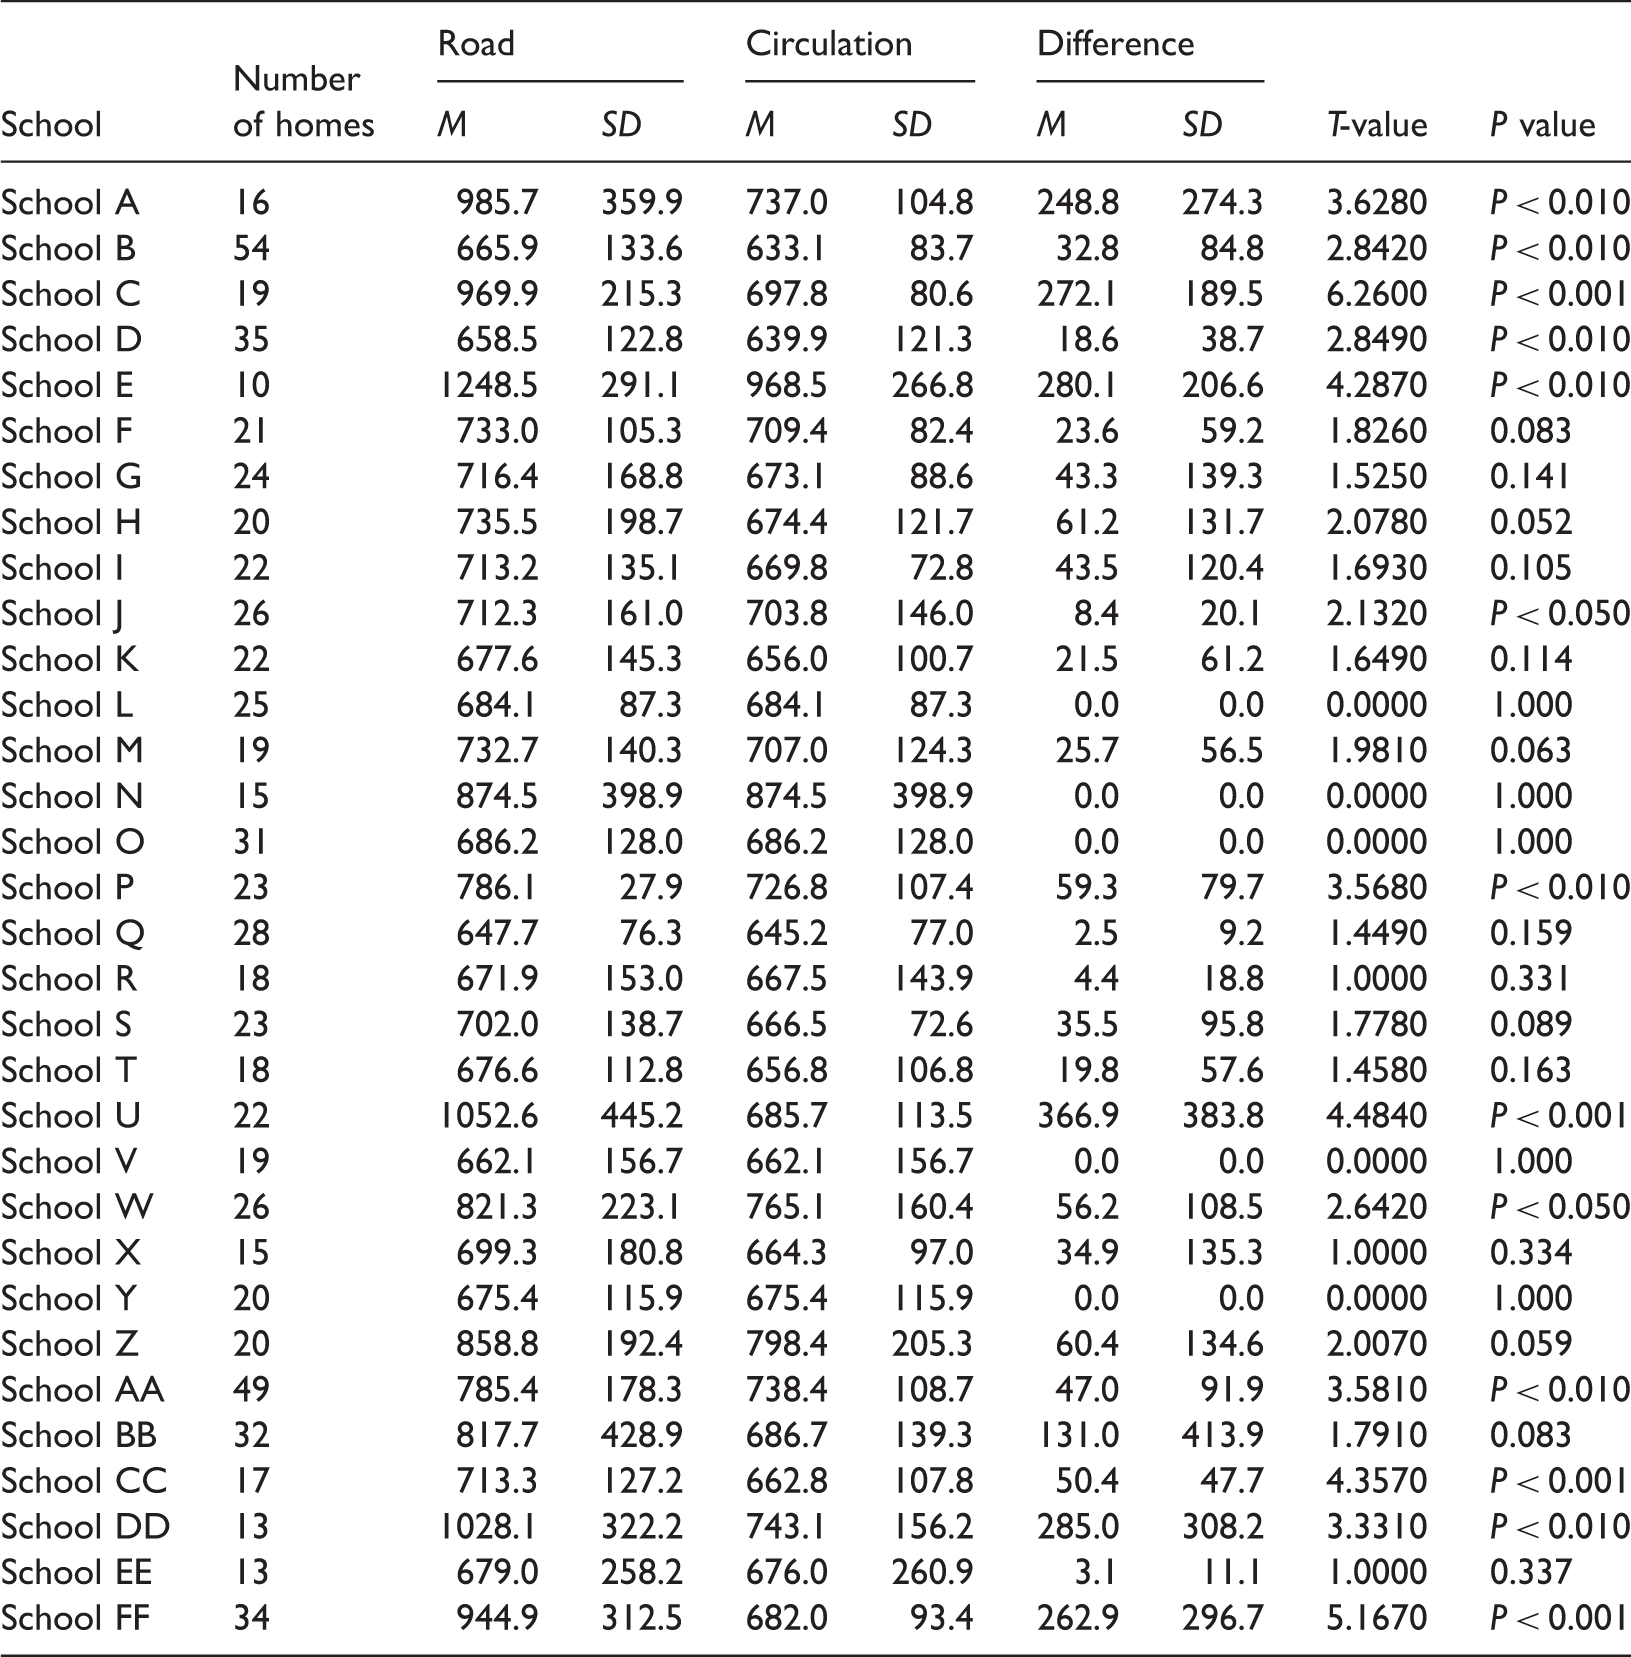
Difference in means t-test of homes 500 m from school.
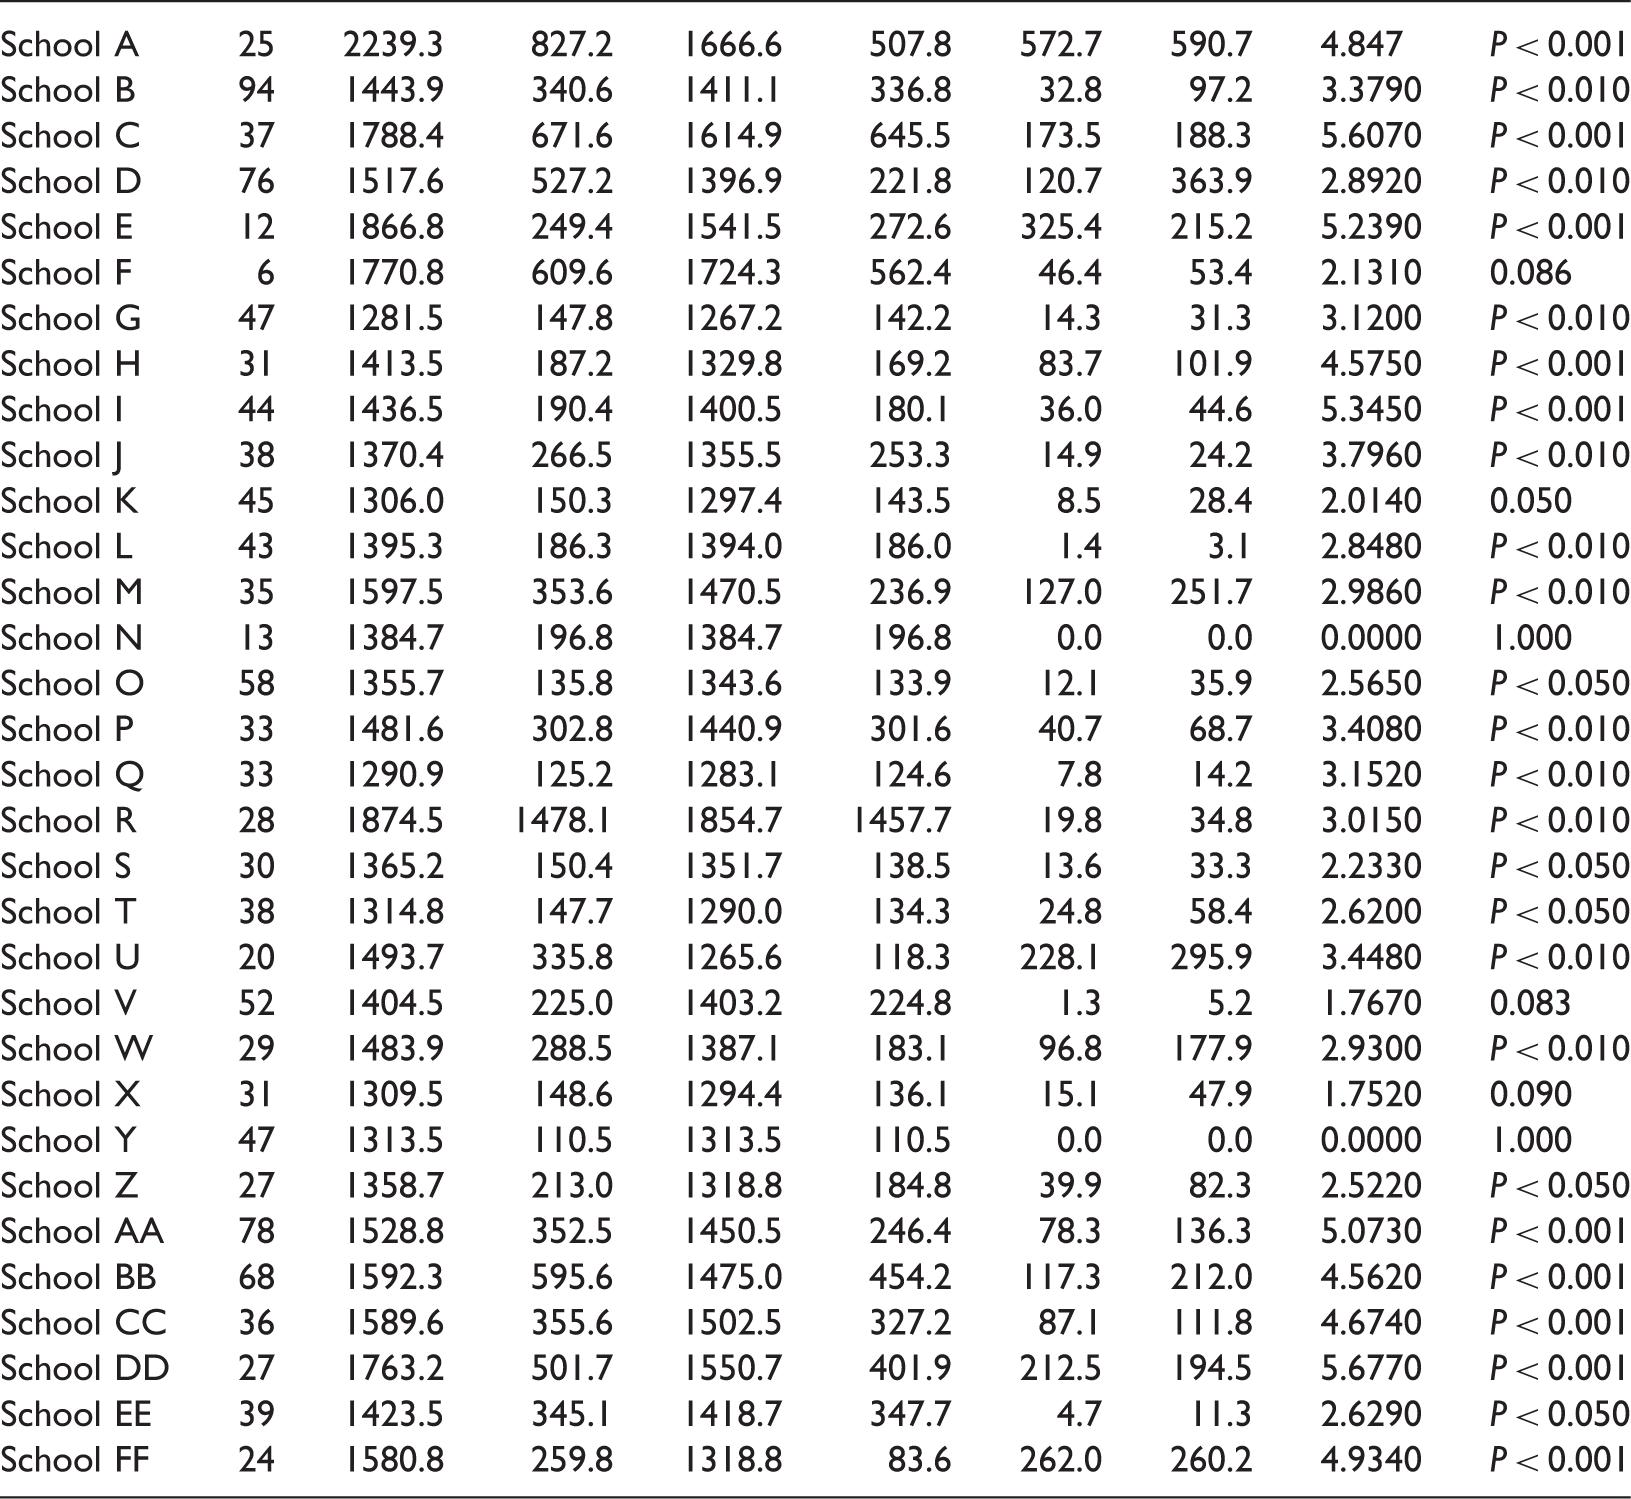
Difference in means T-Test of homes 1000 m from school.
The results in Table 2 show that the influence of shortcuts on children whose homes are located 500 m from their school can vary greatly between schools. In four schools, the shortcuts did not change the distance between home and school. Another 15 schools showed insignificant change between the road and circulation network and despite many of these school neighbourhoods having many shortcuts, they are not located within 500 m of the schools. The remaining 13 schools were found to have a significant difference in the distance travelled between home and school when accounting for shortcuts.
The results in Table 3 show all but six schools exhibit significant changes in travel distances when examining the difference between the shortest path of the road and circulation networks. These findings show that the farther a home is away from a school, the more impact shortcuts can have on a child’s AST.
While the majority of schools do have shortcuts to help facilitate AST, there are two schools (schools N and Y) where the shortcuts do not change the distance between home and school. Both schools have unique characteristics that make shortcuts irrelevant for AST. School N, is located in a new neighbourhood that is still under construction. While there may eventually be shortcuts for children to use, there are high safety fences separating the school yard from the surrounding construction. School Y, is a catholic school with a special arts program, which draws the majority of their students from far outside the 1.6-km walking zone, making shortcuts unnecessary.
Socio-demographics, built environment and shortcuts
Results of T-Test and ANOVA comparing built environment and Socio-Economic Status with change in distance between circulation and road network for homes located 500 m from school.
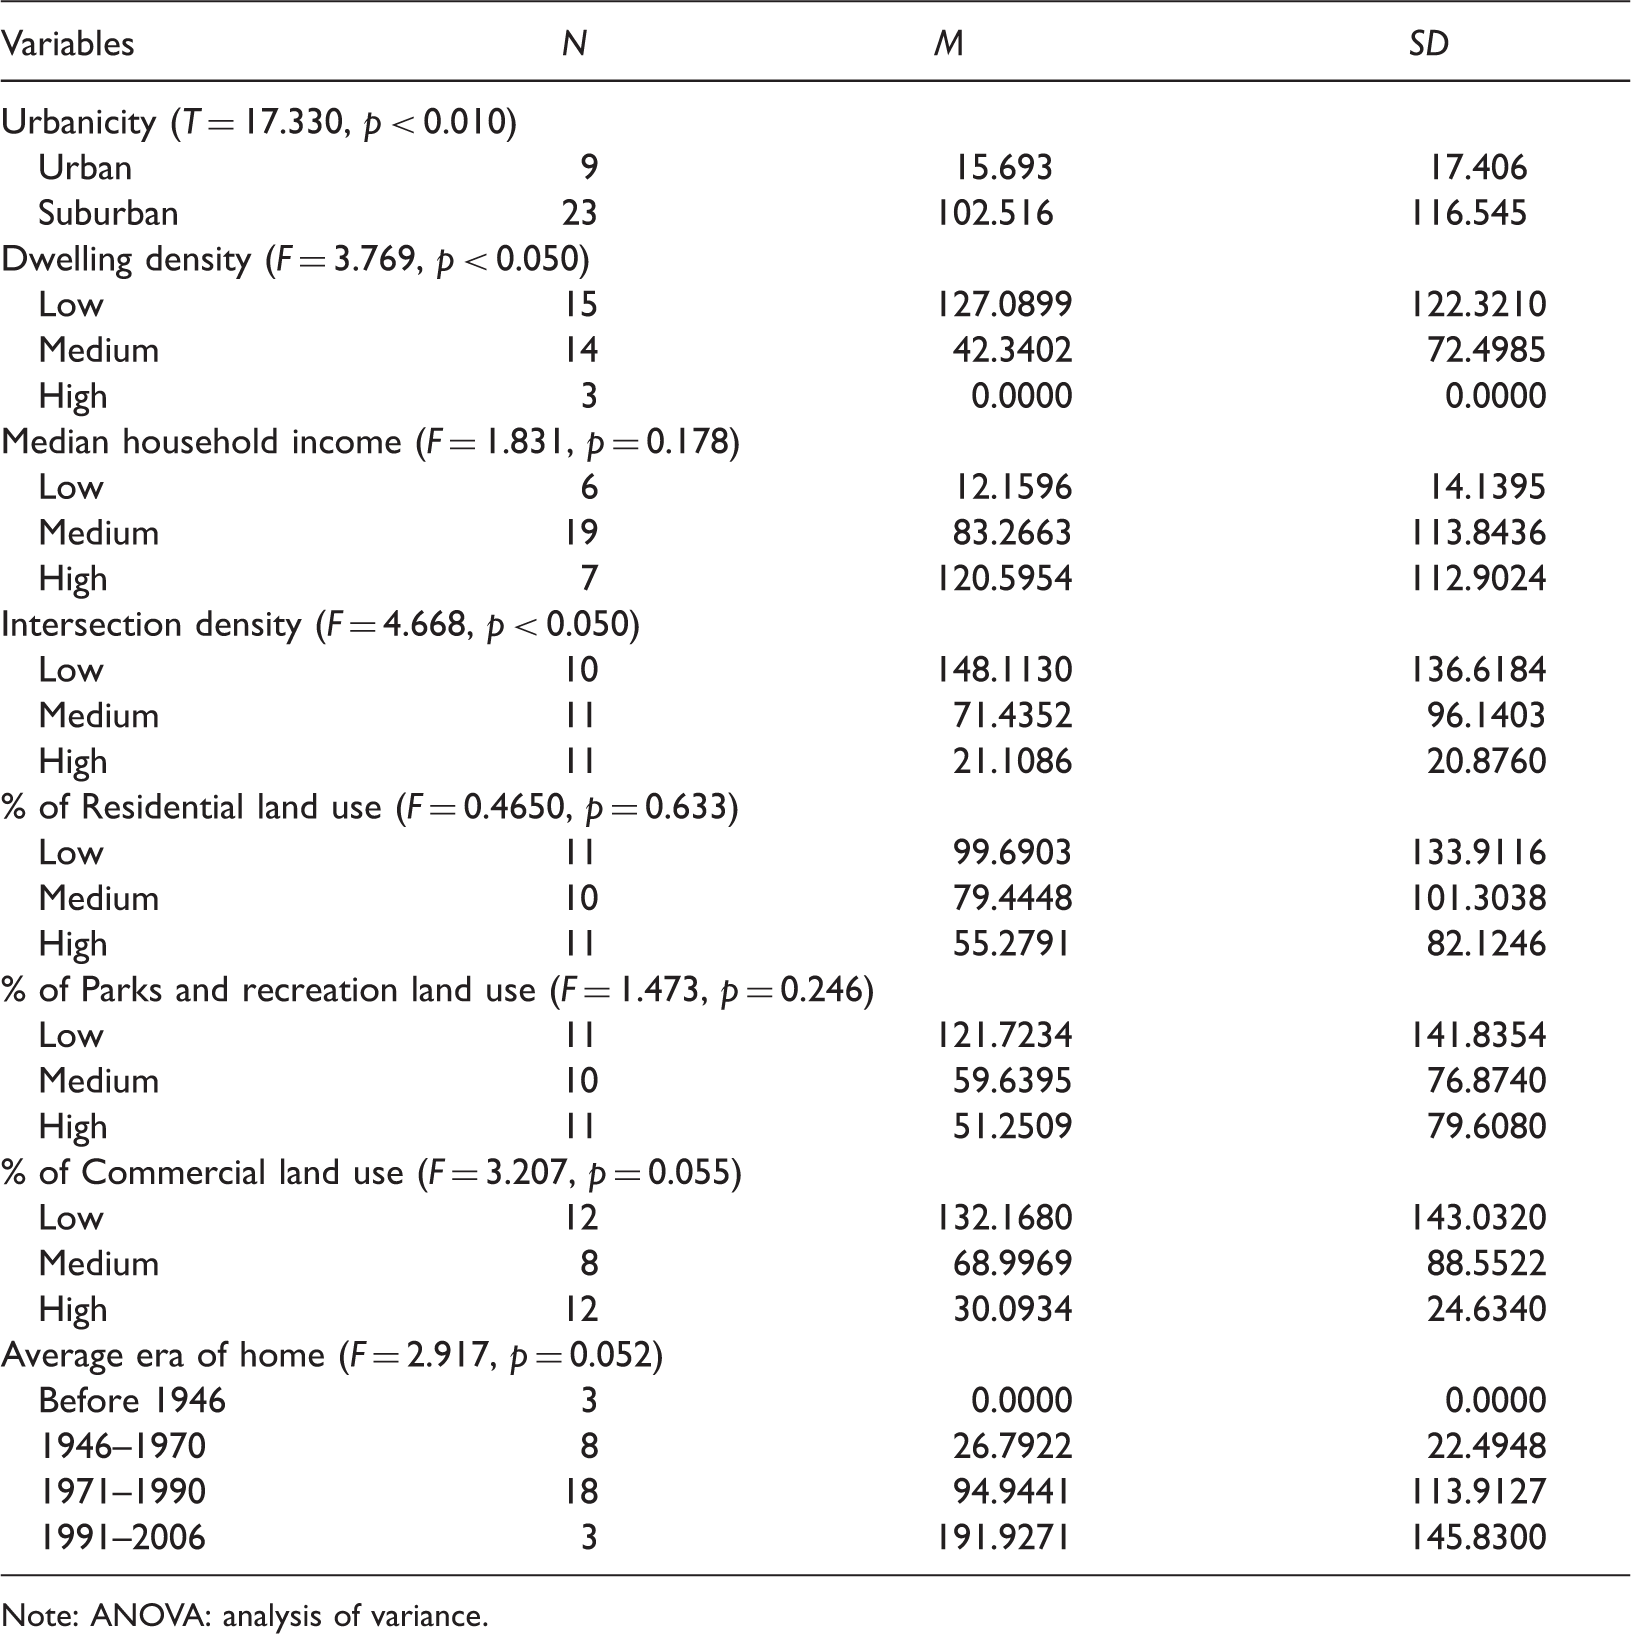
Note: ANOVA: analysis of variance.
The significance of dwelling density and intersection density is directly linked to the fact that urbanicity is significant, as an urban neighbourhood is defined as a neighbourhood with high dwelling and intersection densities. The results complement each other, with children in suburban neighbourhoods with low dwelling density and low intersection density benefitting the most from the presence of shortcuts. Urban neighbourhoods already have high connectivity, with short blocks and grid-like street design, making shortcuts unnecessary and cost prohibitive to build. In contrast, the ‘loop and lollipop’ design of suburban neighbourhoods provides ample opportunities to increase connectivity in a neighbourhood by building shortcuts (Southworth and Owens, 1993).
Discussion and conclusions
This study has sought to better understand how formal and informal shortcuts can impact the distance a child needs to travel between home and school. Only a minority of AST researchers have incorporated sidewalks or formal shortcuts into a circulation network to predict routes and measure connectivity (Giles-Corti et al., 2011; Larsen et al., 2009, 2012). The results of this study provides three key contributions to the literature: (1) provides an example of how researchers and planners can use GPS data and walkabouts to identify shortcuts from orthophotos; (2) reveals how shortcuts can significantly shorten the distance between home and school and (3) suggests that shortcuts can be used in planning practice to help facilitate AST.
GPS data and walkabouts
The GPS data from the STEAM project and walkabouts in the six school neighbourhoods were essential to identifying the types of shortcuts that children use during AST. Using the GPS tracks identified many of the shortcuts that children use on their AST routes, while the walkabouts provided evidence as to where exact shortcuts exist in school neighbourhoods. This two-tiered approach provided the greatest benefit for unusual shortcuts, such as some that were discovered behind plazas and across parking lots, which may not have been easily identified from orthophotos. We were then able to see what these ground trothed locations looked like on an orthophoto and find similar locations in other areas of the region. Additionally, the walkabouts and GPS data were helpful in determining potential routes to school for the 26 schools for which walkabouts were not conducted.
Without the GPS data and the data collected from walkabouts, the circulation network would have been limited to only the most highly visible shortcuts and pedestrian pathways. These two data sets allowed for a higher degree of accuracy in identifying shortcuts that children take to school than would have been possible otherwise. Other researchers who wish to create a circulation network should conduct ground-truthing exercises to ensure the most accurate network possible.
Shortcuts and Active School Travel
The comparison between the circulation network and road network has shown that the distance children need to travel to and from school decreases significantly when shortcuts are taken into consideration. The inclusion of shortcuts increases connectivity that would be overlooked if only the road network was used in analysis. This finding is most important for communities that are more dispersed and suburban in design. Older neighbourhoods tend to have traditional grid pattern road networks that offer more direct routes through higher connectivity (Giles-Corti et al., 2011; Southworth and Owens, 1993). Density in the downtown core is much higher and in turn attracts more shops and services (Saelens and Handy, 2008), which are easily accessible because of high connectivity levels. Suburban neighbourhoods have much lower densities and typically feature winding roads and often cul-de-sacs. These design features can reduce vehicular traffic by reducing through roads, but this also decreases street access to pedestrians (Wei and Lovegrove, 2012).
Although suburban neighbourhoods might not appear to be well connected or have a variety of land use mixes in one area, these communities often have the greatest amount of shortcuts, especially at distances of 1000 m from the school. For example, schools with the greatest significance differences in distance travelled are schools A, C and H, all of which are in the suburban fringe of the region where there is very low connectivity. Without the presence of shortcuts, these neighbourhoods would be disconnected and discourage active travel; however, these areas offer many options for shortcuts that encourage children’s AST by decreasing distance and increasing connectivity. Shortcuts can also increase perceptions of safety by changing the shortest route between home and school, which has the ability to avoid a dangerous area in a neighbourhood caused by traffic congestion, crime and other safety concerns. These neighbourhoods could serve as examples for planners as future policies around neighbourhood development are created.
The results of this study illustrate the importance of including shortcuts (both formal and informal) when evaluating AST and other types of active travel. This is especially important to consider when evaluating suburban school neighbourhoods and students who live farther away from the school. By not considering shortcuts, researchers may actually be overestimating distance and misrepresenting the relationship between the built environment (BE) and AST.
Policy implications
Since shortcuts have been proven to significantly affect a child’s route to school, it would be prudent of planners and policy makers to consider implementing formal shortcuts into new development projects. This would help alleviate traffic congestion around the schools as parents would feel more comfortable allowing their children to walk. Although this type of infrastructure is not always found in sprawling, suburban communities, these areas could be possible candidates for shortcuts. Typically, suburbs encourage travel by vehicle since amenities are not located near homes, but implementing shortcuts in these neighbourhoods would decrease the need to drive as often.
Another way to decrease the distance between home and school would be to use the school as a ‘community anchor’ (Committee on Environmental Health, 2009). In the past, schools were built in central areas and were used to facilitate after school programs and community events along with providing education (Committee on Environmental Health, 2009). This would create a school facility as a place that the community can congregate and find it worthy of having as a central location.
Identifying areas where shortcuts are most needed is a challenge for policy makers. Often, this can be done by identifying desire lines (as was done in this study) and creating a formal shortcut in their place; however, as future communities are planned, predictions can be made about where shortcuts are to be located. Planners need to consult research to more accurately predict where a shortcut would be helpful and use the design of successful neighbourhoods as a model. It could be to the benefit of planners to take note of areas that have had misplaced shortcuts and to consider the consequences of implementing formal shortcuts before knowing how that community will develop in the future.
Future research
While this study is an important methodological step in understanding how shortcuts influence the relationship between AST and the BE, much research remains to be done. Researchers need to integrate the idea of a circulation network into the other BE characteristics, including intersection density and street connectivity, to better understand the true infrastructure available to active travelers. Furthermore, researchers need to examine if including shortcuts into a network increases the ability to predict routes children take to and from school, especially since we know distance plays a key role. If we can better predict routes children take without having to directly observe and measure them, it will become easier to develop population-based simulation models to estimate child exposure to traffic and safety hazards while travelling to school.
Footnotes
Declaration of conflicting interests
The author(s) declared no potential conflicts of interest with respect to the research, authorship and/or publication of this article.
Funding
The author(s) received no financial support for the research, authorship and/or publication of this article.