
Abstract
The UK has had a commitment to loan guarantee schemes since 1981 when it introduced the Small Firms Loan Guarantee (SFLG) scheme to address access to debt finance issues for smaller firms. Over the last 40 years, its support has been unwavering, and in the Covid-19 crisis, it once again turned to loan guarantees as a means of supporting smaller firms through the crisis-induced slump in trading activities. Of its three core Covid-19 guarantee schemes, the Bounce Back Loan (BBL) scheme was the most numerous with 1,531,095 loans issued amounting to a total of £46.5bn in lending. The BBL scheme provided a 100% capital guarantee on loans between £2,000 and £50,000, and firms were allowed to borrow up to 25% of their trading income, with a fixed interest rate of 2.5% of which the first years interest was paid by the government to the lending bank. Our findings suggest that the government losses may range between £7bn and £12bn depending on the underlying assumptions; however, we estimate Covid-19 guarantee schemes may have protected 118,639 businesses and 1,117,849 jobs. Looking to the future, we suggest that a new loan guarantee is justified that more resembles the former SFLG than the restrictive Enterprise Finance Guarantee (EFG) as more than one million small businesses will be heavily indebted and unable to borrow to invest in future growth opportunities. This would support the ‘levelling-up’ agenda and help prevent a post-Covid-19 low investment–low growth scenario.
Introduction
Loan guarantee schemes have been the favoured public policy response to address credit rationing which has been identified as a persistent problem for smaller and younger firms (Blinder, 1985; Jaffee and Modigliani, 1969). Their relevance has been particularly obvious in crises when credit rationing increases generally, and more firms are constrained in their ability to access external finance (Cowling, 2010). It is likely that the Covid-19 crisis would have ultimately led to a significant increase in firm bankruptcy and liquidation amongst the UK SME population with an estimate of 120,000 smaller firms being at risk of running out of cash within six months of the outbreak of Covid-19 and a further 850,000 in a prolonged economic lockdown (Cowling et al., 2020). One of the most important of the special Covid-19 measures was the UK Bounce Back Loan scheme (BBL) which accounts for £46.5bn of the total of £70bn under guarantee across the three Covid-19 loan guarantee schemes and is specifically focused on the youngest and smallest businesses who can borrow up to £50,000. It follows that understanding what the fiscal and economic consequences of one of the key special Covid-19 measures might be is important as the legacy will influence government spending and taxation policy for many years to come. Future loan guarantee default is central to understanding the long-term consequences of this massive expansion in guaranteed lending during Covid-19; this is the focus of our article.
In this article we use a comprehensive data set containing the whole population of UK Enterprise Finance Guarantee loans over the period 2009 to 2020 pre-Covid-19. In total, we have 32,747 individual loans under guarantee. We use this data to estimate default patterns for loans that ‘match’ those issued under the BBL scheme in terms of loan size and loan to sales restrictions in non-crisis and crisis periods using the period of the Global Financial Crisis (GFC) as our crisis parameter. The matching is based on the Covid-19 guarantee data set which contains the full portfolio of 1,048,575 guaranteed loans including 971,302 BBL guaranteed loans. We then roll our default estimates forward to the Covid-19 BBL scheme period and use these parameter estimates to predict the future outcomes of the BBL portfolio. This is particularly important for the UK government as to date 971,302 BBL loans under guarantee have been issued to the small business population with a contingent liability to the Treasury (and ultimately the UK taxpayer) of £46.5bn. For reference, this cash figure is the same amount as the UK government spent on defence in 2016–17 and £12bn more than it spent on housing and the environment. For context, the other two UK Covid-19 guarantee schemes, the Coronavirus Business Interruption Scheme (CBILS) provides an 80% guarantee on loans up to £5m and supported around 77,000 firms, and the large firm counterpart, the Coronavirus Large Business Interruption Scheme (CLBILS) provides loan facilities up to £200m and an 80% guarantee and supported 569 businesses. Other relevant business measures include the ‘furlough’ job protection scheme which supported workers who were unable to work through a large wage subsidy starting at 80% and recently scaled down to 60%. This scheme was estimated to cost the UK government around £70m and supported 1.9 million workers through Covid-19. Additional support was available through a Value Added Tax (VAT) deferral scheme and £30bn in VAT has been deferred to date.
The importance of loan guarantees
Loan guarantee, sometimes referred to as partial credit guarantee, schemes are a direct public policy response to perceived credit rationing of good type borrowers (Beck et al., 2010). They are the primary financial instrument to resolve credit rationing and typically, have a clear focus on small firms, although in severe crises such as GFC and Covid-19 schemes have often extended their reach (Corredera-Catalan et al., 2021). The authors also present a clear justification for why guarantee schemes are useful and relevant public policy instruments and their benefits over and above those achieved by direct lending programmes. This is argued on the following basis: ‘(i) Credit guarantee systems resemble market-friendly instruments, as the lending decision mostly stays with the private sector. This may confer elements of legitimacy to these schemes that (given the failures of the past) are no longer shared by directed credit and other intervention mechanisms; (ii) the cost of the credit guarantee scheme is usually low, with potential liabilities incurred only in the case of a large institution failure or a systemic crisis; and (iii) relatively small cash outlays can leverage large numbers of loans and volumes of lending. They concluded that improved access to finance for smaller business supported by the existence of a guarantee scheme, and particularly in a severe crises, improves overall economic welfare through an employment maintenance effect and by improving the survival chances of such firms.
The key parameters of the loan guarantee scheme are the loan amount (typically a floor and a ceiling), the loan term (maturity), the guarantee coverage (the share of the outstanding debt that is underwritten by the government guarantee) and an interest rate premium over and above that charged by a lending institution. The loan amounts typically reflect equivalence with observed small business lending patterns, but loan maturities allow for access to longer-term finance, as well as short-term crisis related working capital needs. On a global basis, the typical loan guarantee coverage is between 70% and 80% of the total loan. Below a 70% rate, the willingness of private sector lenders to participate diminishes substantially (Cowling, 1995). The government interest rate premium is typically in the range of 1%–2% and borrowers are particularly sensitive to this rate as it is above the bank interest rate. The general principle is that by providing a guarantee the government de-risks the loan for a lending bank that would normally reject loans without collateral at that end of the risk distribution. This effectively straightens the backward bending loan supply curve; this is a key feature of the Stiglitz and Weiss (1981) model as rather than make high interest rate offers on risky loans, the bank reduces its supply as the expected marginal profit from making these loans is negative. This has been empirically supported by Shen (2002) using a large sample of lending contracts.
The enterprise finance guarantee
The UK Enterprise Finance Guarantee scheme replaced the long-standing Small Firms Loan Guarantee scheme in 2009, in the immediate GFC period which was the deepest crisis the country faced since the 1930s. It had a much wider remit in terms of its scale and the breadth of coverage with a significant increase in the maximum loan amount available from £250,000 to £1.2 m. This significant change was introduced to support lending to much larger SMEs who were capital constrained during the GFC induced credit crunch. An additional and highly significant change to the EFG scheme compared to the SFLG scheme was that banks were allowed to secure lending against EFG loans for all types of collateral other than an individuals’s personal primary domestic residence. In return for a government guarantee of 75% on unrecovered outstanding balances, there was an additional interest premium of 2.0% paid to government above the loan interest rate charged by the lending bank. This general interest rate – collateral trade-off-is particularly interesting as borrowers of different types are more likely to choose different, incentive compatible, contract features which in turn, signal to the lending bank important information about the quality of the borrower in respect of observable risk and private information (Han et al., 2009). There was also an expansion in the number of institutions permitted to offer loans under the scheme. In total, 60 institutions are eligible including some of the new UK challenger banks and regional economic development agencies. In addition, there were some key structural changes that may have fundamentally changed the lending behaviours of big banks in particular. While the exposure guarantee for the borrower was the same between both schemes (75%), in the EFG the lenders faced a clawback in coverage if the rolling portfolio default rate exceeded a pre-set level, at times for some lenders, it was 9%, and for other lenders, it was 20%. It follows that this key change might have incentivised lenders to target EFG lending at a narrower and ‘safer’ gap in the loan market as borrowers had to meet all the normal lending criteria and were probably close to being offered a commercial loan.
The BBL
Introduced in May 2020, the BBL scheme was the smallest of the UK governments guaranteed lending schemes in terms of its maximum loan ceiling of £50,000. It was explicitly designed to support lending to the cash constrained small businesses at the lower end of the size spectrum. The scheme was formally closed for new loans and top-up funds on 31 March 2021. Formally, the BBL scheme was aimed at providing financial support to businesses that had suffered revenue losses and were experiencing cash-flow problems as a direct result of the Covid-19 outbreak. It also recognised that the needs of the smallest businesses were more pressing and immediate, in a literal sense, than those of larger sized businesses; the administrative process was streamlined and so, much quicker from application to approval than other Covid-19 special schemes. This aspect was supported by a relaxation of the need to comply with the terms and conditions of the Consumer Credit Act. Importantly, there is no portfolio cap associated with BBL lending as the need to get as many loans to struggling businesses was paramount.
Comparing EFG (BBL match) and BBL Scheme parameters.
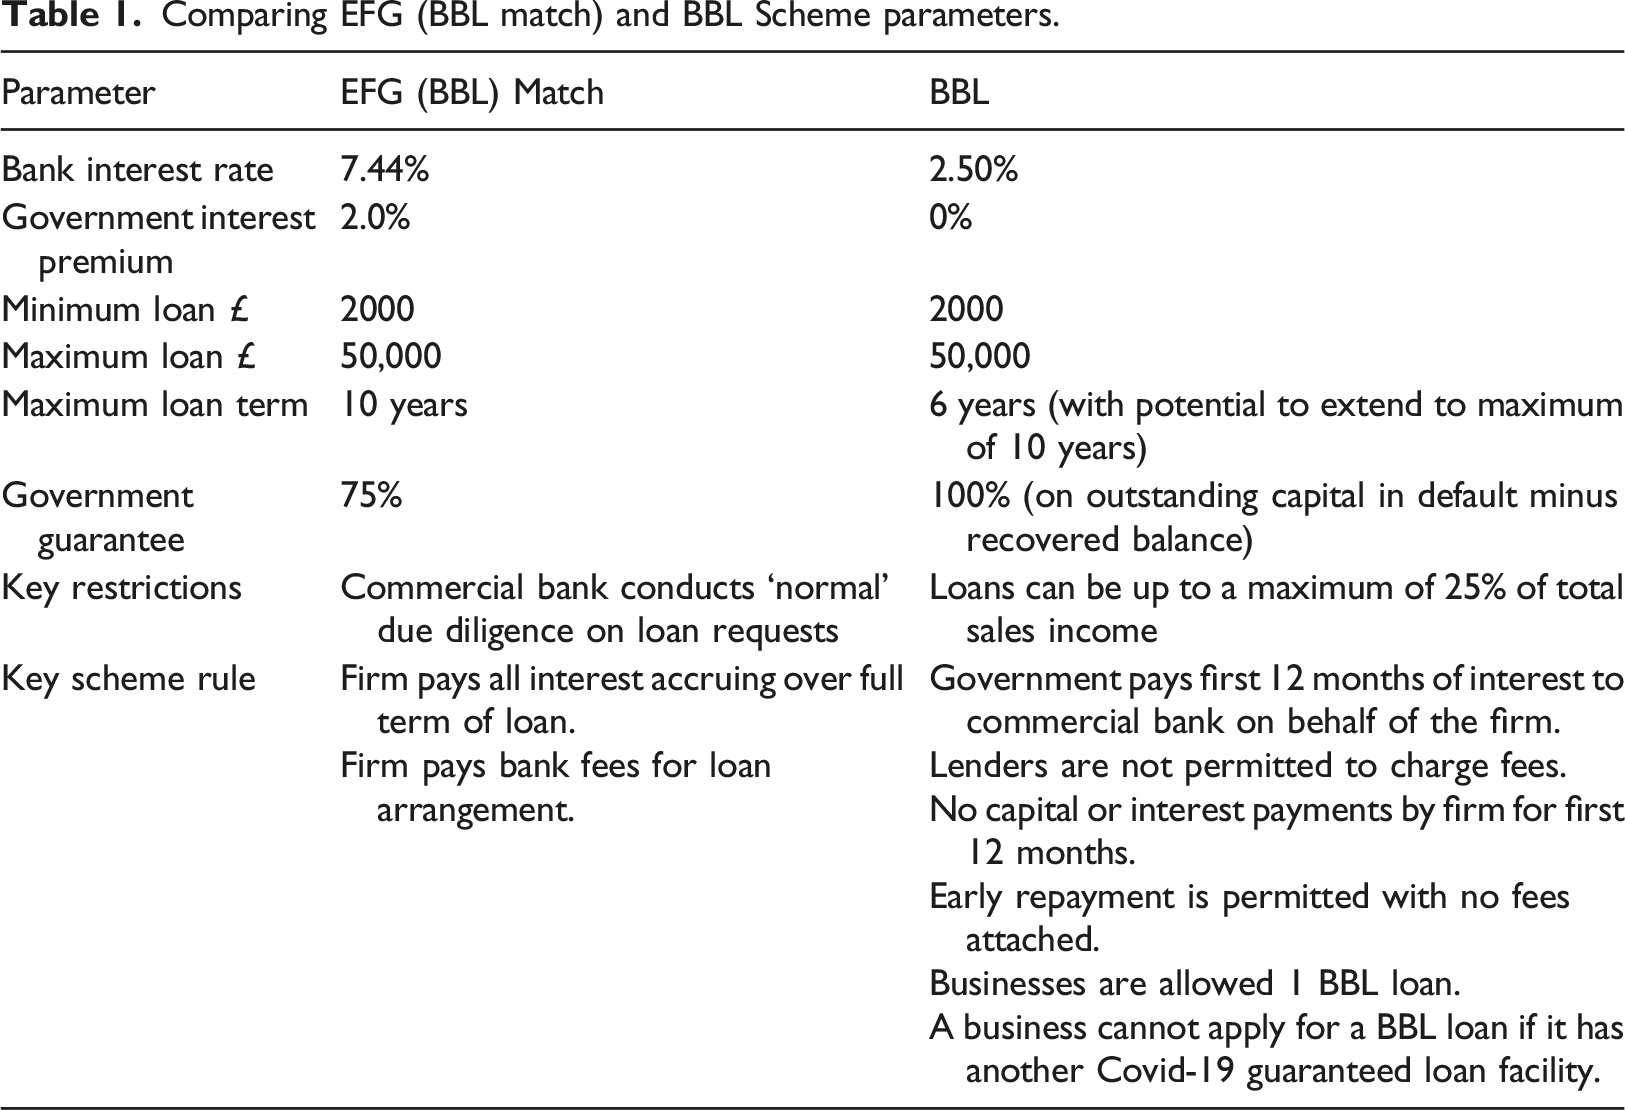
From Table 1, we note that the interest rate of 2.5% set for BBL scheme lending is one third of that set for comparable EFG loans. This is important as the cost of servicing BBL loans is considerably less onerous for small firms. However, the withdrawal of the government premium interest rate of 2.0% on EFG means that the total interest rate (bank rate plus government premium) is dramatically lower at 2.5% compared to a total lending interest rate of 9.44% on average. Again this is designed to reduce the burden of repayment on smaller firms as they emerge from the Covid-19 crisis. It does, however, have consequences for banks and government. However, the lower interest rate is also consistent with the risk reducing effect of the 100% guarantee on unrecoverable outstanding loan balances in default and with the findings for the UK SFLG identified by Ughetto et al. (2017: 319) who stated that ‘the higher the incidence of the publicly guaranteed debt over the total amount of outstanding loans, the lower, on average, the interest rate margin spread’.
Both banks and government lose a significant share of their loan income stream to offset default costs. For banks, they also lose their fee income which Cowling (2021a) estimated to be between £1000 and £6000 for each £100,000 lent under the EFG scheme. The other key parameter change was the reduction in the maximum loan term from 10 years under EFG to six years under BBL, although later adjustments allowed borrowers to extend their loan term back up to 10 years. There are also a number of key BBL scheme features that add flexibility to repayment terms but also restrict firms to a one-hit approach, aside from the BBL top-up allowance. Taken as a whole, this scheme, although on the surface it looks like a standard UK loan guarantee scheme, is a hugely generous and flexible financial policy instrument with a clear rationale and focus on supporting the most at risk smaller businesses to manage their way through the Covid-19 crisis.
The EFG data
We have the complete population of EFG guaranteed loans from its inception in 2009 right up until the Covid-19 outbreak in early 2020. In total, this records the loan details for 32,747 individual loan contracts. The management information system at the British Business Bank records data relating to 27 individual aspects of the guaranteed lending facility that can be broadly grouped into two categories: • Business characteristics at loan origination – age, sales turnover, industry sector and geographic region • Loan characteristics – bank interest rate, government interest premium, loan amount, loan term, fixed or variable rate loan, type of security, loan purpose, lending institution, type of loan facility, draw date, date lender considers loan is in default claim, date lender makes a guarantee claim to government, date government settles guarantee claim by bank and total outstanding balance
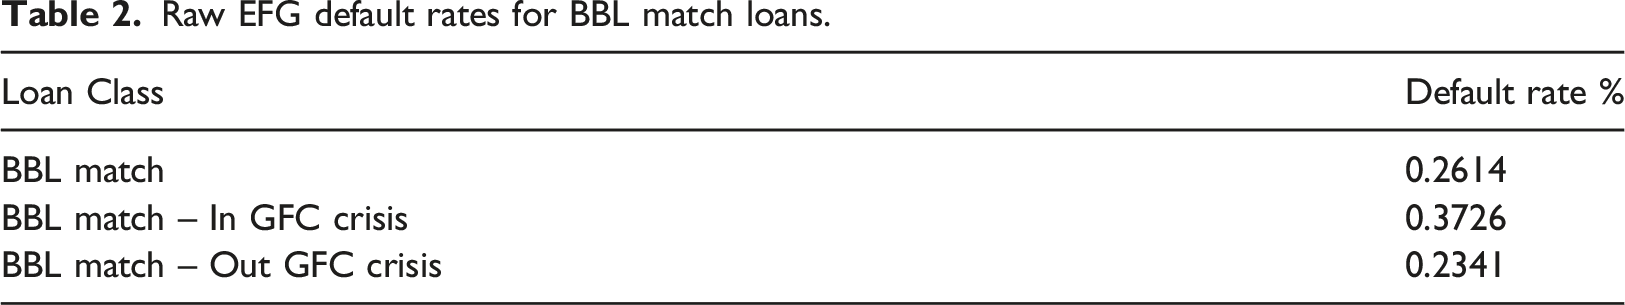
From this data, we construct a BBL dummy variable coded one if the EFG loan amount was between £2000 and £50,000 and the loan to sales ratio was between 0.01 and 0.25% and zero otherwise. We were not able to augment this BBL dummy with an interest rate restriction as less than 5% of the total EFG portfolio loans attracted interest rates at or below the current BBL interest rate. This BBL dummy variable is one of the two key parameters that will inform our subsequent future default prediction on the actual BBL scheme. The second key parameter is a GFC dummy variable which is coded one in the GFC year of 2009 and zero for years from 2010–2020. This is our empirical proxy for a crisis at the point of loan origination. In total, 29.41% of our total EFG loan portfolio were classified as a BBL match and 18.83% as a crisis match. We did not have access to individual level credit reference agency data and we recognise this as a potential limitation.
Raw EFG default rates for BBL match loans.
Default modelling
In this section we estimate the probability of default based on observable firm and loan characteristics at the point of loan origin. In this first set of default models, we use a simple binary classification which is coded 1 if a loan was classified by a lender as being in default and zero otherwise. The base model is a probit model to reflect the binary outcome for the dependent variable which is loan default.
Default modelling.
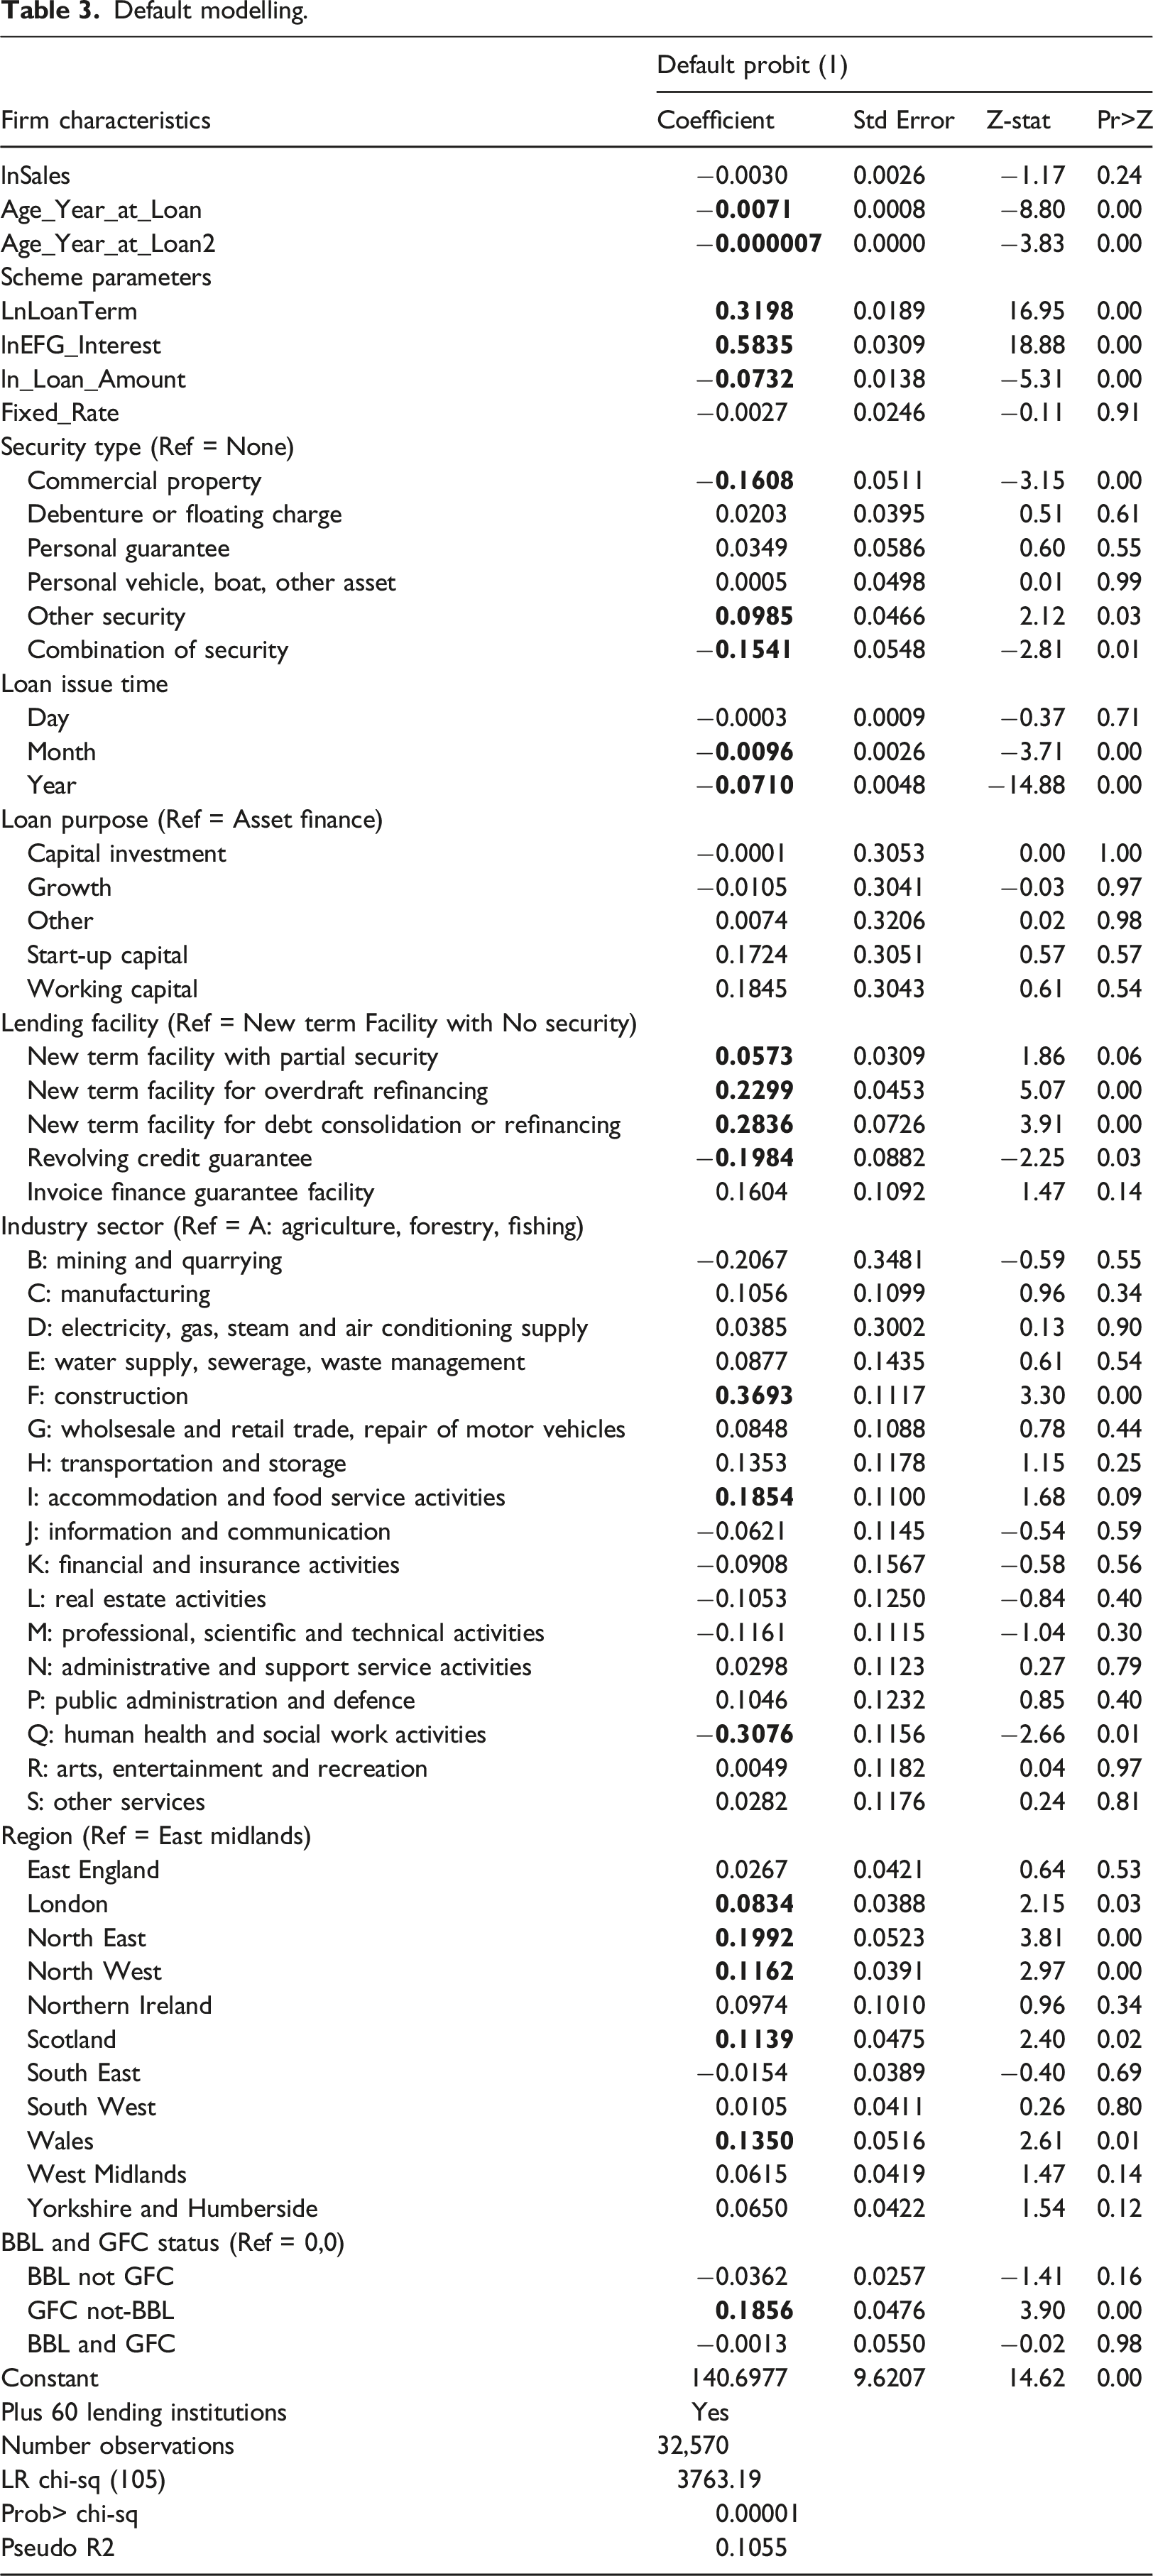
In relation to loan contract and scheme parameters, we find that the longer the term structure of the loan the higher the probability of default. This suggests that the option of extending BBL loans upwards from the six years maximum to a ceiling of 10 years would potentially lead to an increase in default rates across the portfolio of loans. The lending bank interest rate is positively associated with default. The fact that BBL loans have a fixed rate of 2.5% suggests that default will be lower than would be the case where the lending bank sets the rate as per conventional loans. Higher loan rates increase the serviceability requirements on firms via an increase in per period payments and entail generating more free cash. There is also the issue of moral hazard and the potential for firms borrowing at high interest rates switching from safe to risky projects. We note that EFG interest rates, on average, were more than double the comparable bank interest rate on the SFLG (predecessor) scheme (Ughetto et al., 2017).
We also find that loans made under a fixed or variable rate of interest were no more or less likely to default. This is interesting as the nature of the banks interest rate offer has been identified as a key loan contract parameter in the context of risk and credit rationing (see Berger and Udell, 1992; Cowling, 2010; Cowling et al., 2017; Melnik and Plaut, 1986; Thakor, 2005) and gives the lender an opportunity to insure favoured customers against adverse economic conditions. We also find that loan size is negatively associated with default probability which suggests that the BBL scheme may have higher default than its larger counterpart, the CBILS. Within the parameters of the BBL scheme, the weighted average loan size for BBL match loans is £31,579.32 which is above the mid-point of the BBL scheme loan size range. This suggests that default may not be as high as anticipated if there were a large concentration of very small loans in the BBL portfolio.
The EFG scheme was different from its predecessor in that it allowed non-family home collateral. Using no security was attached to an EFG loan as our reference category, maximum government and bank exposure in default, we find that the inclusion of commercial property and firms who provided a combination of various types of security had a significantly lower probability of default. Both may reflect a borrower’s commitment to repayment in the sense that the former has placed their business premises at stake and the latter has made the effort to build a bundle of security and guarantees to offer against their loan. Perhaps surprisingly, borrowers who offered more personal assets and guarantees were no less likely to default than borrowers who offered no security at all.
On the precise nature of the EFG loan, we find that borrowers using their loans to refinance existing debts and debt consolidation had the highest default probabilities and those who borrowed to establish a revolving credit guarantee facility has the lowest default probability. In addition, new term loans under partial guarantees had higher predicted default than similar facilities without a guarantee. These initial findings suggest that firms who were seeking to refinance or consolidate their existing debts were high risk and were using EFG as a last resort. This latter aspect was a requirement for the original SFLG scheme. However, we also find that the precise purpose for which the loan provided funding for had no apparent effect on default. This is important in the context of the BBL scheme which largely focused on the Covid-19 induced demand and revenue effects which constrained a firms cash-flows and not on the specific use of the funds for growth enhancing activities.
There was a geographic aspect to EFG default and it was mainly concentrated amongst poorer and peripheral areas of the UK such as the North East, Wales, North West and Scotland. The one notable exception to this was that loans originating in London in the wealthiest region of the UK also had higher default rates. In general, outside of London, our results suggest that demand-side issues may be affecting a firm’s ability to generate enough surplus cash to repay the capital and interest on new borrowing. In London, this is unlikely to be the case and it may be that high levels of competition are driving down prices and profit. This latter effect was also identified in respect of default on the SFLG by Cowling et al. (2018) who found that default rates were higher in economically buoyant regions. In respect of what the potential implications are for firms in peripheral regions, there is the obvious and direct consequence of default and failure to regional economies. For those that survive, many will have a significant debt burden for the next six or seven years and this may reduce their ability to finance future growth opportunities and invest in productivity enhancing capacity. As noted in Brown and Cowling (2021) study of the potential spatial Covid-19 impact on the 100 largest UK cities and towns, firms in peripheral regions entered the crisis in a more precarious position and it may be the case that many exit the crisis in a position of relative inequality. Whilst the fate of firms in London should not be ignored, the dynamism and relative resource munificence of the environment may mean that these effects are less serious for the region.
The final results from our baseline default model are critical to developing our understanding of potential default under the BBL scheme and for estimating future default, LGD, and overall scheme costs to government. Using not-BBL compliant
From default to government losses
Predicted default.
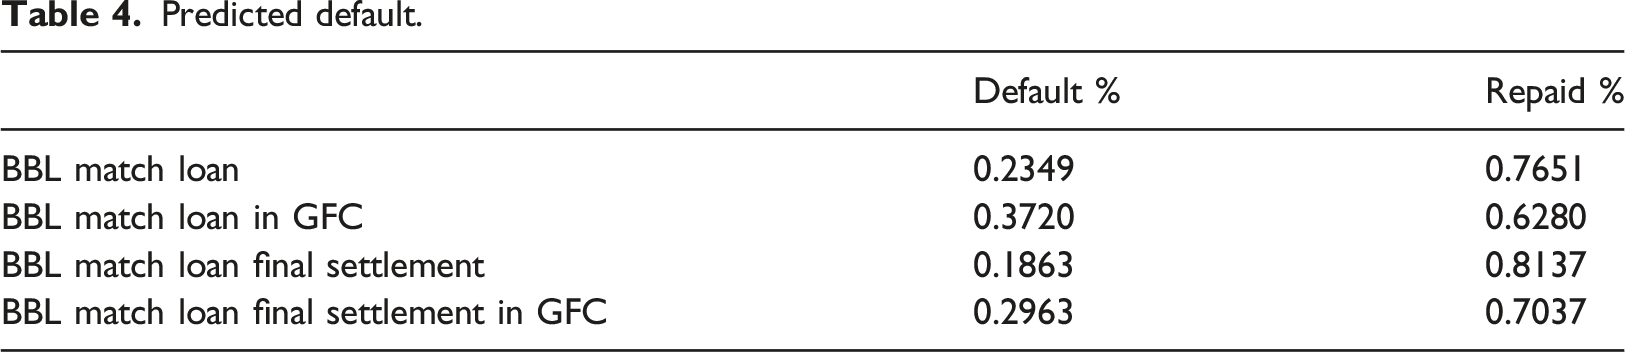
From Table 4, we observe that default rates are substantially higher for guaranteed loans originating in a crisis period at 37.20% which compares to an overall default rate of 23.49%. However, it is also the case that after additional asset recoveries after the loan is first deemed in default by the lending bank the rate and scale of recovery is such that final default is only 18.63% and 29.63 in the crisis period. This implies that the government should encourage banks to actively seek to recover BBL outstanding debts if minimising short-term scheme losses is the primary goal. However, for obvious reasons caution might be exercised as firms slowly emerge from the Covid-19 crisis and seek to rebuild their businesses. To some degree, the government has taken this into account through the ‘pay-as-you-grow’ option on the BBL scheme which was announced by the UK Chancellor on 6 February 2021. Under this suite of options businesses with a BBL scheme loan could: • Request an extension of their loan term to 10 from six years, at the same fixed interest rate of 2.5% • Reduce their monthly repayments for six months by paying interest only – this option is available up to three times during the term of their BBL • Take a repayment holiday for up to six months – this option is available once during the term of their BBL
Borrowers can use these options individually or in combination. However, they remain responsible for repaying their BBL and are fully liable for the debt. Borrowers taking up one of these options will pay more interest overall and the length of the loan will increase if they take a repayment holiday option. Our evidence suggests that extending the loan term will increase default, as will any increase in the interest rate paid. However, this must be balanced against increasing the ability of businesses to meet the loan, both capital and interest, servicing requirements.
Estimating the costs of default across the loan portfolio
Loan repayment schedule.
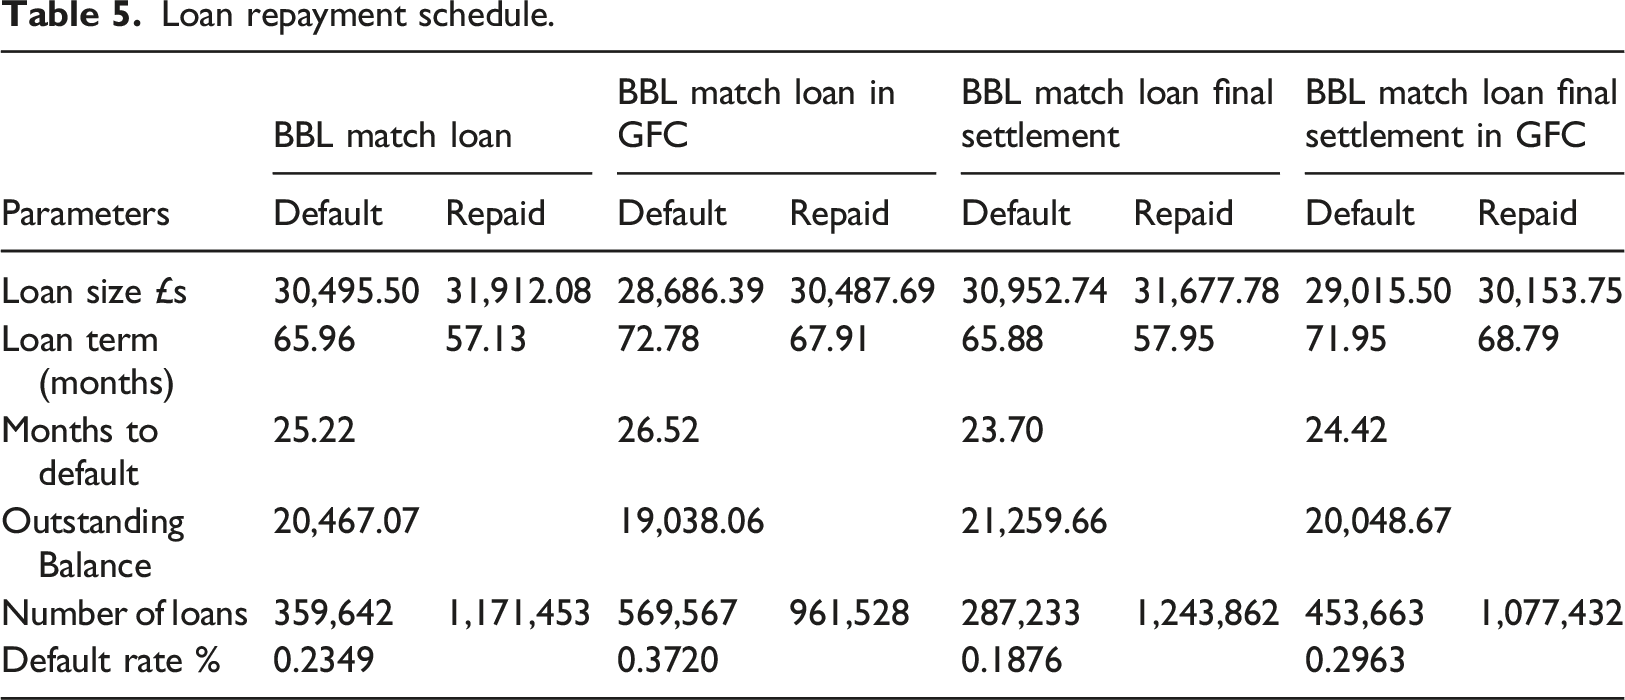
We observe that repaid loans are slightly larger on average than defaulting loans and generally have shorter term profiles. There is a degree of consistency in the average months to default for loans that are not fully repaid; a typical default occurs between two years and two years and four months after origination, approximately one third of the way through its full term. The outstanding balance reflects this default timing and ranges typically falls between £19,000 and £21,000 per defaulting loan on average. In the worst case scenario, around 570,000 loans end in default of the 1.5 m loans issued under guarantee on the BBL scheme, and in the best case scenario, 287,000 loans. The final settlement balances show that the initial lender default case is significantly worse than the final outcome as between 4.73% and 7.57% of loans originally classified as in default have additional asset recovery.
Government net costs and loan profiles
We have established the predicted default rates under various assumptions and now separate our hypothetical BBL loan portfolio into ‘good’ and ‘bad’ loans defined as loans under guarantee that are fully repaid and those that end in default with an outstanding balance. The next step is to use these parameters to calculate the loan repayment schedule including capital and interest rate repayments, including those paid by the government for the first 12 months of a newly issued BBL loan. We calculate these ‘good’ and ‘bad’ loan repayment schedules using a standard loan model repayment schedule for a fixed interest rate loan.
We have four parameters thus: • A = Payment amount per period (months) • P = Principal (loan amount) • r = interest rate per period (months) • n = total payment periods (months)
The formula to calculate the monthly payment is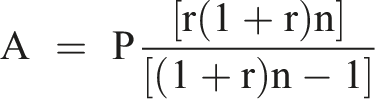
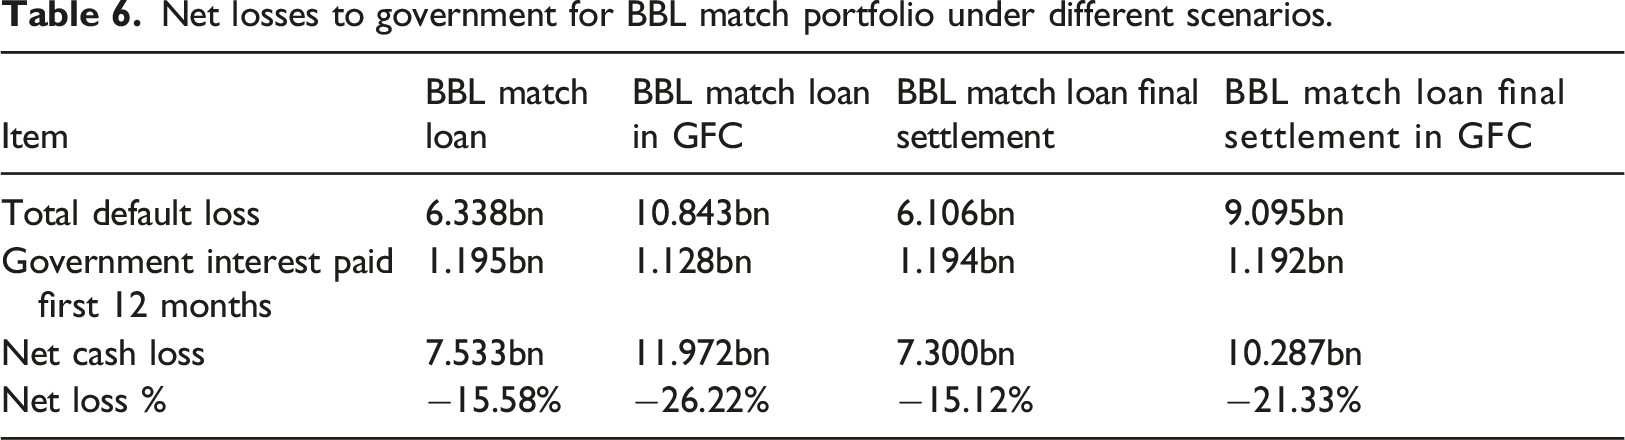
Net losses to government for BBL match portfolio under different scenarios.
This loan origination in crisis effect is large and important and even though at the time the GFC induced the biggest economic downturn since the 1930s in the UK at that time, it is evident that the Covid-19 crisis has led to an even larger deterioration in economic activity. In this respect, our crisis estimates may under-represent the potential scale of losses. However, the generosity and duration of the worker furlough scheme may allow businesses to re-establish their trading activities more quickly and at scale where historically workers were laid off into unemployment and had to be re-hired when business activity picked up.
One potentially distortionary factor that could significantly alter outcomes and losses is the ‘pay-as-you-grow’ option on BBL guaranteed loans. This gives borrowers the option to extend the loan term and also defer capital and/or interest payments. The implied change in default rates for a 17% increase in loan term (equivalent to extending a six years loan term to seven years) is 5.5%, which would imply an increase in underlying default from 23.49% to 24.78% under scenario one. In respect of deferments, there are clear short and medium-term implications. In the short-term deferment increases, the probability that a businesses will not end in default per se through their inability to service the relevant loan payments. However, deferment also has a negative side as it accrues interest and capital repayments into a short time frame thus, increasing the cash requirement that businesses must generate to service their loans. The key question that cannot be addressed at this moment in time is whether firms in the post-Covid-19 period can grow and generate cash at a rate that can service their outstanding debt.
Conclusion
We have used recent data from the pre-Covid-19 UK loan guarantee scheme to identify a group of loans and businesses that ‘match’ the parameters of the UK Covid-19 BBL scheme. Using know default and predictions from an econometric model of loan outcomes and outstanding balances at default, we then set up a portfolio of ‘good’ (repaid) and ‘bad’ (defaulting) loans with their average characteristics. These loan portfolios were then input into standard fixed rate loan repayment schedules and aggregated up to the whole BBL guaranteed loan portfolio to calculate predicted LGD and the governments guarantee claims plus the government share of the interest repayment to lenders.
Under different assumptions and scenarios, we estimate that the predicted net losses on the BBL scheme to be between £7bn and £12bn which equates to 15.1%–26.2% of the total loans under guarantee which is £46.5bn. For the most part, this relates to the 100% default guarantee and to a smaller degree the lack of government interest rate premium and the fact that the government paid the first 12 months interest on loans. What is clear is that the net loss arising from default is always much lower than the actual share of default in the total volume of loans issued under guarantee. This occurs as on average default occurs more than two years after the loan origination and some assets are recovered at a later date.
What we cannot really incorporate into our modelling at this point in time is the number of businesses with guaranteed loans that will choose one of the ‘pay as you grow’ options. This could significantly alter repayment and losses. Equally, predicting the rate of post-Covid-19 economic recovery is more problematic than is the case after a ‘normal’ crisis and this will impact directly on firms’ cash balances and ability to repay. It is the case, however, that guaranteed loan that originate in crises on average have higher default and net losses. In addition, there may be some recoveries on defaulting loans after the fact depending on the ability and willingness of the lending banks and government to pursue defaulters. We have allowed for this to some extent in the modelling by using scenarios where the final, post-recovery, settlement outstanding balances have been used in our calculations but for the Covid-19 BBL sample the potential for recovery is a relative unknown.
In respect of our predicted starting point, with a potential loss of £7bn - £12bn, what can we say about potential benefits? Here we draw upon recent evidence from Cowling et al. (2020) and Brown and Cowling (2021) who estimated that 8.6% of UK businesses were at immediate risk during the Covid-19 crisis as they had no cash savings. This represents some 118,639 firms who provide employment for 1,117,849 workers, which represents around 5.9% of the UK labour force. If we assume these types of businesses had a very high probability of requesting a Covid-19 guaranteed loan then we can infer that the schemes may have cost between £59,000 and £101,000 for each saved firm and between £6300 and £10,735 per saved job. In business facing public policy evaluations, this would be regarded as a very cost-effective job creation intervention. For example, between 2016 and 2020 the average costs of the very modest 1.2 gross jobs created per firm on the Start-Up Loan Scheme averaged £18,900 per gross job. Whilst not all these BBL supported jobs were in micro and small businesses, the fact that (a) they are the numerically dominant size classes and (b) they were the most likely to enter the Covid-19 crisis with no savings suggests that this is the most relevant point of focus for potential benefits of Covid-19 guarantee schemes such as BBL. However, this is likely to under-estimate the benefits as both studies identified a further 843,909 firms at medium-term risk as there were not boosting their cash balances heading into the crisis. Given the duration of the crisis to date it is likely that the BBL and other Covid-19 schemes have saved a lot more firms and employment. Overall, we conclude that the BBL scheme was an appropriate policy response to the Covid-19 crises and was justifiably targeted at the smallest and youngest firms who were at the highest risk of running out of cash during the exceptional economic lockdown and reduced trading conditions. Whilst the costs are significant, it is likely that the benefits outweigh the financial burden of default.
It is evident given the considerable take-up of BBL loans is that it has been a significant massive public policy experiment attempting to tackle a unique crisis. Arguably, it had a two very specific and related targets – to save hundreds of thousands of firms from failing due to lack of income and liquidity pressures – and to save potentially millions of jobs in those firms. In the post-Covid-19 era, we estimate that some will default on their loans and fail and ultimately those jobs will be lost at a cost to the UK treasury. But even more will survive intact but they will be burdened with significant debts and repaying those debts will require a substantial financial commitment for the next six or seven years. This may mean that their future income streams will be diverted into debt repayments instead of new investment in growth. And this also has a regional angle to it with peripheral region economies potentially being at a relative disadvantage through higher default rates and job losses and this may constrain their capacity take advantage of new opportunities going forward.
So would a return to an EFG type loan guarantee scheme be appropriate and relevant to smaller firms in the post-Covid-19 era? On this our response is an unequivocal no. Why? Because the parameters and lending processes were too restrictive and the frequent changes to the lending cap were confusing for banks as they had to adjust their guaranteed loan portfolios accordingly. This also affected firms through the bank lending channel as in extremis a borrower who could have accessed a guaranteed loan one day could be excluded the next. Our view is that the relative purity of a genuine loan guarantee such as the former SFLG, rather than a partial-partial guarantee scheme like EFG, is more appropriate for the post-Covid-19 era when firms have significant accumulated debts, asset prices are low, but growth opportunities exist. This broadening of the scope of a new era loan guarantee scheme would allow a significant uplift in guaranteed lending activity which, we argue, will be needed in the near future to avoid a low-investment and low-growth economic scenario. An expanded and broader scheme would also be supportive of a ‘levelling-up’ agenda.
One final point relates to the BBL effectively being a ‘free-hit’ for banks and borrowers with the 100% guarantee in the sense that the bank might have an incentive to foreclose on a loan it thinks might be in danger and call in the government guarantee to shore up its balance sheet. Equally, an entrepreneur can walk away in default with no repercussions. Our evidence suggests that this does not seem to be a significant feature of BBL lending. For banks, foreclosing on loans and potentially putting a firm into bankruptcy or liquidation is not conducive to long-term profit maximisation which is built through a multi-period relationship which effectively locks a business customer into a current account and repeated lending relationship where it can also sell other banking services. For the entrepreneur, it is established that any incidence of credit delinquency can have serious and negative consequences for future borrowing on a business and personal level. In this respect, we suggest that in the Covid-19 crisis most firms and banks have behaved in a supportive and honest manner.
Footnotes
Declaration of conflicting interests
The author(s) declared no potential conflicts of interest with respect to the research, authorship, and/or publication of this article.
Funding
The author(s) disclosed receipt of the following financial support for the research, authorship, and/or publication of this article: Funding for this research was provided by the Department for Business, Energy and Industrial Strategy, UK Government, MC 2021.