
Abstract
This article examines how the 2022 Russian invasion of Ukraine affected the investment and financing policies of small and medium-sized (SMEs) enterprises in Ukraine and neighbouring Russian border regions. Using a matched difference-in-differences framework with SMEs from Belgium and the United Kingdom as comparison firms, we document substantial within-firm changes during the war period. Ukrainian SMEs exhibit lower investment and higher cash holdings, a pattern consistent with precautionary liquidity motives. Short-term debt declined overall during the war period, while long-term debt increased modestly. This pattern is suggestive of a shift in debt maturity among firms that retained access to external finance. Trade credit relative to sales increased, whereas trade credit relative to assets declined, a pattern consistent with tighter supplier exposure despite ongoing obligations. Russian border-region SMEs show higher investment relative to the comparison group and experienced a contraction in trade credit relative to assets, pointing to heterogeneous adjustment patterns across institutional contexts. Older and medium-sized firms show stronger investment adjustment and maturity shifts. Younger and smaller firms rely more on short-term liquidity management and experience sharper contractions in trade credit.
Introduction
The 2022 Russian invasion of Ukraine created a humanitarian catastrophe and an acute macro-financial shock. Capital markets reacted swiftly, with negative stock-return effects particularly pronounced in Ukraine’s neighbouring countries (Boubaker, 2023; Boungou & Yatié, 2022). Western sanctions severely constrained Russia’s access to international markets and financial services, especially in finance and energy, triggering declines in foreign investment, capital flight, heightened uncertainty, and inflation (Astrov et al., 2022; European Commission, 2022). In Ukraine, the conflict has devastated productive capacity and infrastructure, while reconstruction remains hampered by ongoing hostilities, weak investment, and strained public services (World Bank, 2024). Globally, the war disrupted supply chains, contributing to shortages and price volatility, and further fuelling investor unease and currency pressures (Astrov et al., 2022; Bloomberg, 2022). While the macroeconomic fallout of the Russian invasion of Ukraine is well documented, we know far less about how firms, and especially small and medium-sized enterprises (SMEs), adjust their financing and investment behaviour. Existing wartime evidence largely concerns listed firms or aggregate outcomes, leaving SMEs under‑examined despite their central role in employment, local production and supply chains. SMEs are structurally more vulnerable to shocks for several reasons. Limited diversification makes downsizing difficult, reliance on bank finance increases exposure to credit tightening, and restricted access to external funds increases dependence on internal liquidity (Chodorow‑Reich, 2014; Iyer et al., 2014; Joseph et al., 2021). Physical damage to assets and infrastructure further disrupts operations and erodes collateral values.
Our study addresses this gap by theorising the mechanisms through which war shapes firm behaviour and testing them in the natural experiment created by Russia’s 2022 invasion of Ukraine. We use a matched difference-in-differences design with a control group of SMEs from countries not directly affected by the conflict. Our sample consists of an unbalanced panel of 43,587 firm-year observations from 17,455 firms over the period 2017–2022, including 5034 firms from Ukraine and 1959 from Russian regions bordering Ukraine. The empirical results are consistent with several of these proposed mechanisms. Ukrainian SMEs display a significant decline in investment during the war period and simultaneously increased cash holdings, consistent with liquidity preservation. Short-term debt declined overall during 2022, while long-term debt rose slightly, suggestive of refinancing toward longer maturities among firms with access to such finance. Trade credit relative to assets declined, whereas trade credit relative to sales increased, consistent with the combination of weaker sales and more cautious supplier exposure. Russian SMEs show an increase in investment but reduced trade credit relative to assets. These adjustments are heterogeneous: older firms and medium-sized SMEs are better able to extend debt maturities and preserve liquidity buffers, whereas younger firms rely more on short-term debt and expand trade credit sales, and smaller firms face a sharper contraction in trade credit assets.
This article provides new evidence on SME financial policies during wartime conditions, highlighting how liquidity management, investment, and debt structures changed during the war period. War differs from other crises, such as the Global Financial Crisis or the COVID-19 pandemic (Miklian & Hoelscher, 2021). It involves physical destruction, loss of life, and the diversion of resources to military activity. These disruptions may increase debt, reduce output, disrupt trade, and contribute to inflation. A growing literature has investigated the economic impact of the Russia-Ukraine war. The war has negatively affected equity, currency, commodity, and energy markets, as well as firm valuations and growth (Ahmed et al., 2023; Bougias et al., 2022; Federle et al., 2022).The conflict has disrupted inter-group trade inside Ukraine and imposed sizeable macroeconomic and welfare losses (Bluszcz & Valente, 2022; Hoffmann & Neuenkirch, 2017; Korovkin & Makarin, 2023). Comprehensive assessments estimate deep humanitarian, fiscal and financial damage to both countries (Astrov et al., 2022) and a 20% fall in Ukrainian entrepreneurship alongside sharp SME attrition in Russia (Audretsch et al., 2023), illustrating that the invasion’s economic costs extend well beyond immediate market turmoil. We contribute to this literature by investigating the economic effects of the war in Ukraine on SMEs that are at or nearby the epicentre of the war. This study also contributes to the literature on how geopolitical risks influence business strategies and firm performance (Caldara & Iacoviello, 2022; Deloof et al., 2025; Salisu et al., 2022). Finally, we contribute to the literature on SME vulnerability and adaptation during large-scale crises. We provide evidence on how SMEs adjust their financial policies in highly disruptive environments. SMEs often face heightened vulnerabilities during crises due to their limited resources, lower resilience to economic shocks, and constrained access to external financing (Beck et al., 2005b). Understanding how these local firms adapt their strategies in response to the Russia-Ukraine war, sheds light on their resilience mechanisms and survival tactics (Cowling et al., 2015). By examining the vulnerabilities of SMEs this study enriches the understanding of how these businesses manage to sustain operations amidst severe adversity.
The remainder of the article is structured as follows. Section “Expected impact of war on investment and financing among local SMEs” reviews the relevant literature and develops the testable hypotheses. Section “Research design and sample” outlines the research design and describes the sample. Section “Results” presents the empirical results, followed by a discussion of the findings in section “Discussion.” Section “Limitations and future research” highlights the study’s limitations, and section “Conclusion” concludes.
Expected impact of war on investment and financing among local SMEs
Periods of high uncertainty and deteriorating economic prospects have a well-documented negative effect on corporate investment behaviour. Firms often delay investment during uncertain times due to the option value of waiting (Bloom et al., 2007). Real options theory suggests that uncertainty increases the value of waiting for new information before committing to irreversible investments (Bernanke, 1983; McDonald & Siegel, 1986; Wang et al., 2024). Firms prefer to wait for uncertainty to resolve before making substantial financial commitments. During war, this uncertainty is amplified, leading firms to adopt an even more cautious approach. Bernanke (1983), Cortés and Strahan (2020), and Dessaint and Matray (2017) find that increased uncertainty, whether from economic downturns or wartime conditions, leads firms to become more risk-averse and focus on maintaining liquidity and financial stability. This cautious approach results in firms delaying or scaling back long-term investments and expansion plans to manage heightened risks. Such behaviour aligns with real options theory, which suggests that firms postpone investments to mitigate uncertainties about future outcomes (Gulen & Ion, 2016). Additionally, both recessions and wars create challenges in forecasting returns and securing capital, compounded by tighter credit conditions (Flannery & Oztekin, 2013), which further lead to a reduction in investment activities. In other words:
War is also expected to lead firms to significantly increase their cash holdings as a precaution. According to Keynes’s (1936) precautionary motive, companies firms will accumulate cash to guard against the uncertainties and liquidity shortfalls caused by war. This cash reserve acts as a buffer, enabling firms to manage disruptions, cover costs, meet debt obligations, and seize opportunities without relying on scarce or expensive external financing. Empirical studies confirm that firms increase cash reserves during uncertainty for financial flexibility (Bates et al., 2009; Cowling et al., 2020; Julio & Yook, 2012). Real options theory explains that holding cash allows firms to quickly respond to opportunities or shocks, avoiding the costs and delays of external funding (Acharya et al., 2013). This flexibility is vital in war regions where financing conditions deteriorate rapidly. Cash holdings also buffer against declining cash flows and restricted access to finance (Riddick & Whited, 2009). With reduced revenue, adequate cash reserves ensure firms can meet financial obligations without additional debt (Opler et al., 1999), aiding survival and continuity (Pastor & Veronesi, 2012). Based on the foregoing analysis, we propose the following hypothesis:
Conversely, declining cash flows and reduced access to finance can also lead to a decrease in cash holdings. When a firm’s revenues fall, its ability to generate cash internally diminishes, forcing it to dip into its reserves to cover operating expenses and financial commitments. Simultaneously, if the firm cannot secure additional financing due to tighter lending conditions or higher borrowing costs, it may deplete its cash holdings more rapidly. This highlights the delicate balance firms must maintain between holding cash to manage uncertainty and the risk of exhausting those reserves when external financing is limited (Almeida et al., 2004). Considering these factors, we hypothesise as follows:
The detrimental effects of war and poor economic prospects negatively affect the firm’s ability to secure debt. Bernanke and Gertler (1989) discussed how increased uncertainty raises borrowing costs and reduces lender’s willingness to extend credit. Lenders perceive higher uncertainty as increased risk, leading to more stringent lending criteria to protect against potential defaults (Gilchrist et al., 2014). This increased caution can result in higher interest rates, reduced loan amounts, and stricter collateral requirements (Chi & Li, 2017). Based on these arguments, we formulate the following hypothesis:
Similarly, deteriorating economic conditions and wartime scenarios can lead to tighter credit conditions as banks become more risk-averse (Ivashina & Scharfstein, 2010). In both downturns and wars, banks and financial institutions face increased defaults and reduced asset values, prompting them to scale back lending. During wartime, additional uncertainties and risks, such as geopolitical instability and infrastructure damage, intensify this tightening of credit conditions, making it even more difficult for firms to secure loans, especially those with weaker credit profiles or insufficient collateral. Hart and Moore (1994) highlight the crucial role of collateral in debt contracts; in wartime, the threat of asset destruction and declining collateral values further limits borrowing capacity and access to debt. As firms experience declining cash flows, they often need to borrow more to cover operational expenses and fund essential projects. According to Myers and Majluf’s (1984) pecking order theory, firms prefer internal financing but will turn to debt when internal funds are inadequate. This need intensifies during wars, where cash flows may drop sharply, compelling firms to seek external debt to maintain liquidity and continuity. Diamond (1991) also notes that firms with lower cash flows become more reliant on debt financing to manage liquidity and sustain operations. Based on this, we hypothesise the following:
Trade credit serves as a versatile financial tool, providing alternative financing during credit constraints, enhancing competitive positioning, and acting as a short-term investment for suppliers (Cunat, 2007; Love et al., 2007; Van Horen, 2005). When traditional debt financing is restricted, firms often turn to trade credit (Chen et al., 2019; Petersen & Rajan, 1997). This trend is particularly pronounced in disaster-stricken or conflict areas where formal financing is scarce (Brown et al., 2021; Koetter et al., 2020). Research on natural disasters shows that these events disrupt collateral values, reduce creditworthiness, and exacerbate credit rationing (Ge & Qiu, 2007). Similar effects are expected for firms in war zones. The flexibility of trade credit helps mitigate information asymmetries and agency conflicts, improving capital allocation efficiency (Fisman & Love, 2003). SMEs, in particular, rely on trade credit when bank loans are limited, allowing them to manage cash flow without immediate dependence on external debt. From this, we propose the following hypothesis:
However, increased reliance on trade credit during wartime presents its own challenges. Uncertainty drives firms to adjust liquidity positions, with managers in disaster zones increasing cash holdings, while others boost trade credit for liquidity (Dessaint & Matray, 2017). For SMEs, shrinking finances and stricter supplier credit terms make this especially difficult (Petersen & Rajan, 1997). Suppliers, cautious of defaults, impose stricter terms or demand quicker payments, constraining trade credit availability and disrupting supply chains (Smith, 1987). Suppliers may strategically use trade credit for market advantage, especially in war zones where they hold bargaining power (Jacobson & von Schedvin, 2015). Despite default risks, they may prefer trade credit as a short-term investment (Cunat, 2007; Love et al., 2007). However, economic downturns heighten supplier risk perceptions, prompting cautious credit policies and limiting trade credit availability (Smith, 1987). As uncertainty and economic deterioration rise, suppliers become less willing to extend trade credit, reflecting heightened risk perceptions and stricter credit terms. Building upon these observations, the hypothesis is stated as follows:
Research design and sample
To test our hypotheses, we employ a difference-in-differences estimation model, applied to a sample in which the treated group consists of nonfinancial SMEs in Ukraine (UA). In addition, we also use SMEs located in the Russian (RU) regions connected to the Ukraine-Russia border (Belgorod, Bryansk, Kursk, Rostov, Voronezh, and Crimea 1 ). The control group consists of matched nonfinancial SMEs from Belgium and the United Kingdom, two advanced European economies that were not geographically exposed to the conflict, although they may have experienced indirect macroeconomic effects. These countries were selected because they meet four ex-ante criteria ensuring their suitability as counterfactuals. First, they have no geographic exposure to the conflict, as neither shares a border with Ukraine or Russia. Second, both exhibited limited pre-war trade and energy dependence on Russia and Ukraine relative to Central and Eastern European economies. For example, in 2021 Russia accounted for approximately 2.2% of total UK goods imports (Office for National Statistics, 2022), while Belgium’s principal trading partners were Germany, France, and the Netherlands, indicating minimal direct economic linkages. Finally, both countries exhibit comprehensive SME data coverage in Orbis, ensuring a robust and representative control sample. Collectively, these characteristics make Belgium and the United Kingdom suitable comparison countries, while recognising that no European economy was completely insulated from the wider effects of the war.
Following the European Commission’s definition, SMEs are firms that employ fewer than 250 persons but not less than 10 and either have an annual turnover not exceeding 50 million euro and at least two million euro, or an annual balance sheet total not exceeding 43 million euro and not lower than or equal to two million euro. 2 To avoid survivorship bias, we retained firms that ceased operations during 2017–2022. We use the NACE classification (Statistical classification of economic activities in the European Community) to exclude firms in financial industries (NACE codes 64, 65, 66, 68, 77) and others under NACE codes 84–89, 94, and 97–98. Observations with errors, such as non-positive total assets or zero operating revenue, were also removed.
To construct the matched control sample, we apply a propensity score model using our control variables based on the year before the invasion (2021). We employ nearest-neighbour (NN) matching without replacement, a widely used technique in policy evaluation, where each treated firm is matched to the control unit with the closest propensity score. After constructing the matched sample in 2021, we merge the matched firm pairs back into the full 2017–2022 panel. This allows us to track each treated firm and its matched control firms over time. This approach applies the same matched structure in the difference-in-differences framework. It compares within-firm changes before and after the invasion while maintaining balanced pre-treatment characteristics. This approach yields a final sample of 43,587 firm-year observations from 11,466 firms, including 5034 firms from Ukraine (UA), 1959 from Russia (RU), 1108 from Belgium (BE), and 3365 from the United Kingdom (UK). We focus on 2017–2022 to ensure at least three pre-war years for trend diagnostics and one invasion observation for the initial treatment effect. Table 1 reports the number of observations per country and year.
Breakdown of number of observations.
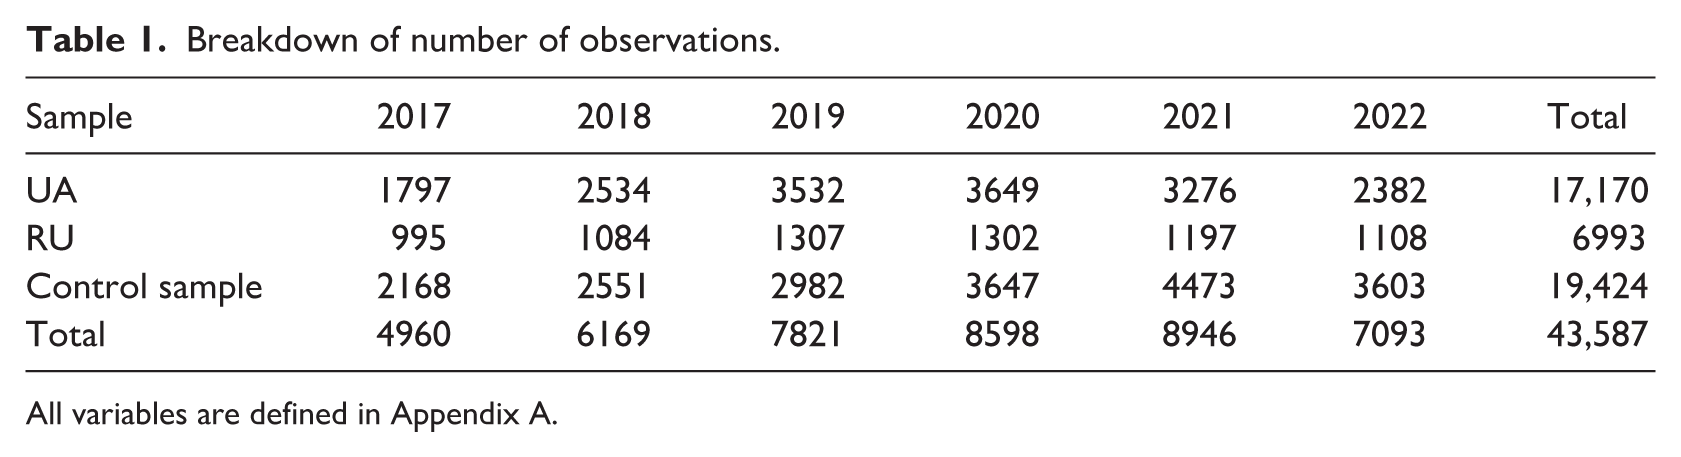
All variables are defined in Appendix A.
To assess the quality of the matching procedure, we perform a covariate balance test comparing pre-war characteristics of treated and control firms. Table 2 indicates that the matching procedure achieves close balance across most covariates. Differences in Age and Firmsize are small and only marginally significant at the 10% level, while the macro level control variable, regional GDP growth, remains significantly different (at the 1% level). Matching is performed within the region of common support by restricting matches to the overlapping range of estimated propensity scores. Treated observations outside this overlap are excluded, ensuring that each treated firm is compared to a comparable control firm and that the estimates are not driven by extrapolation beyond the support of the data.
Comparison of firms of treated and control.
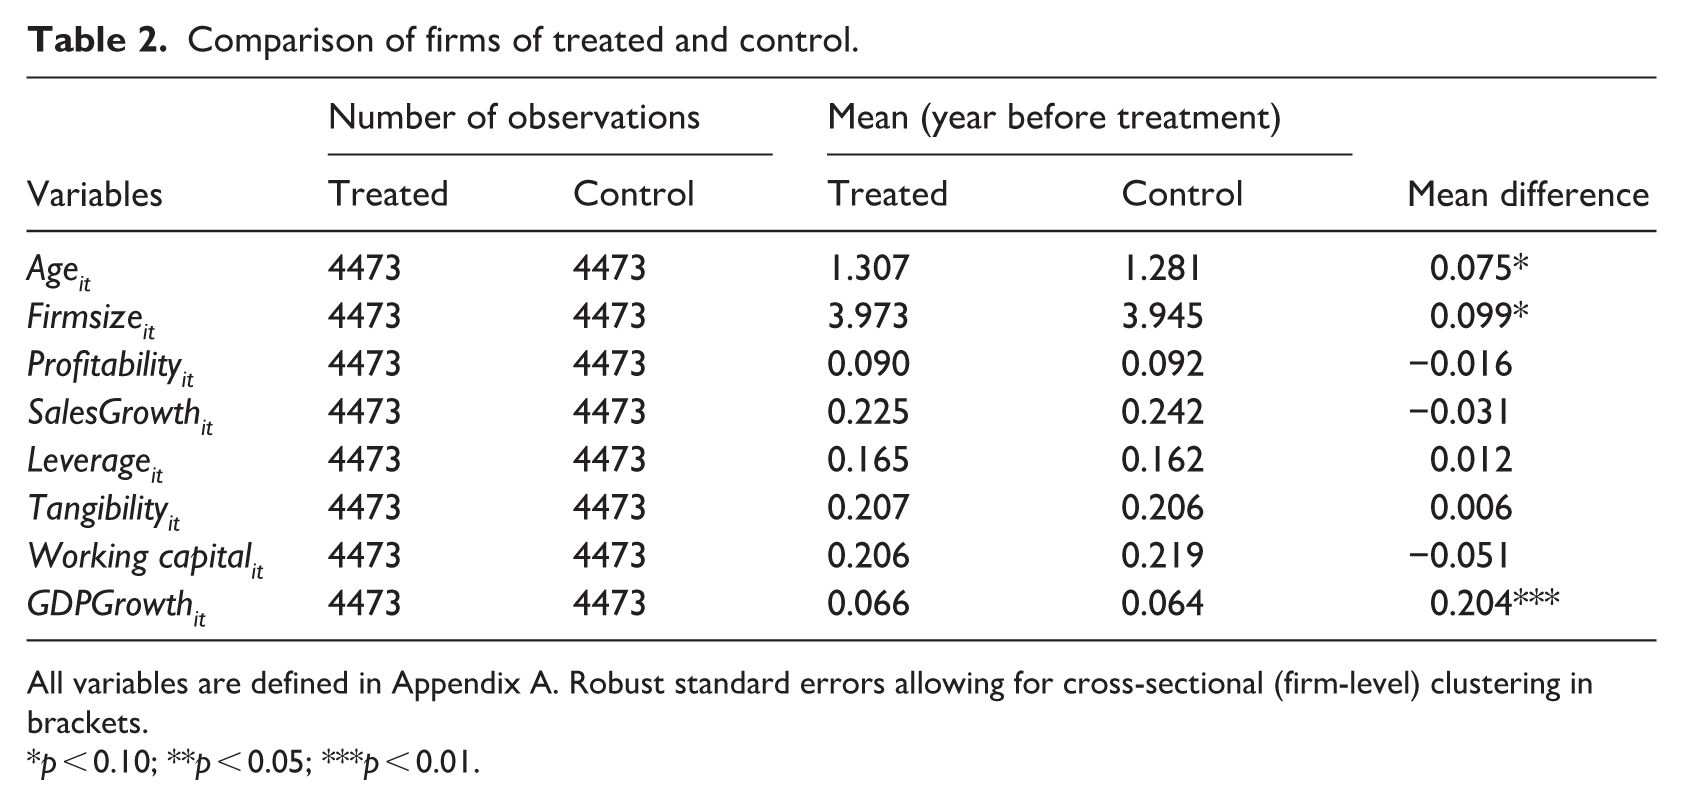
All variables are defined in Appendix A. Robust standard errors allowing for cross-sectional (firm-level) clustering in brackets.
p < 0.10; **p < 0.05; ***p < 0.01.
For robustness, we also tested NN matching with replacement. This led to repeated reuse of a small set of control firms and weaker overall covariate balance across the full set of matching variables. We therefore retain the without-replacement specification. In section “Robustness,” we report robustness exercises using alternative weighting-based estimators to verify the stability of our results. By combining firm-level matching with fixed effects, the design approximates a counterfactual evolution of non-treated SMEs, allowing us to estimate differential within-firm changes associated with exposure to the Russian invasion of Ukraine.
Our regression models are specified as follows:

In equation (1), i indexes firms, and t indexes time (year).
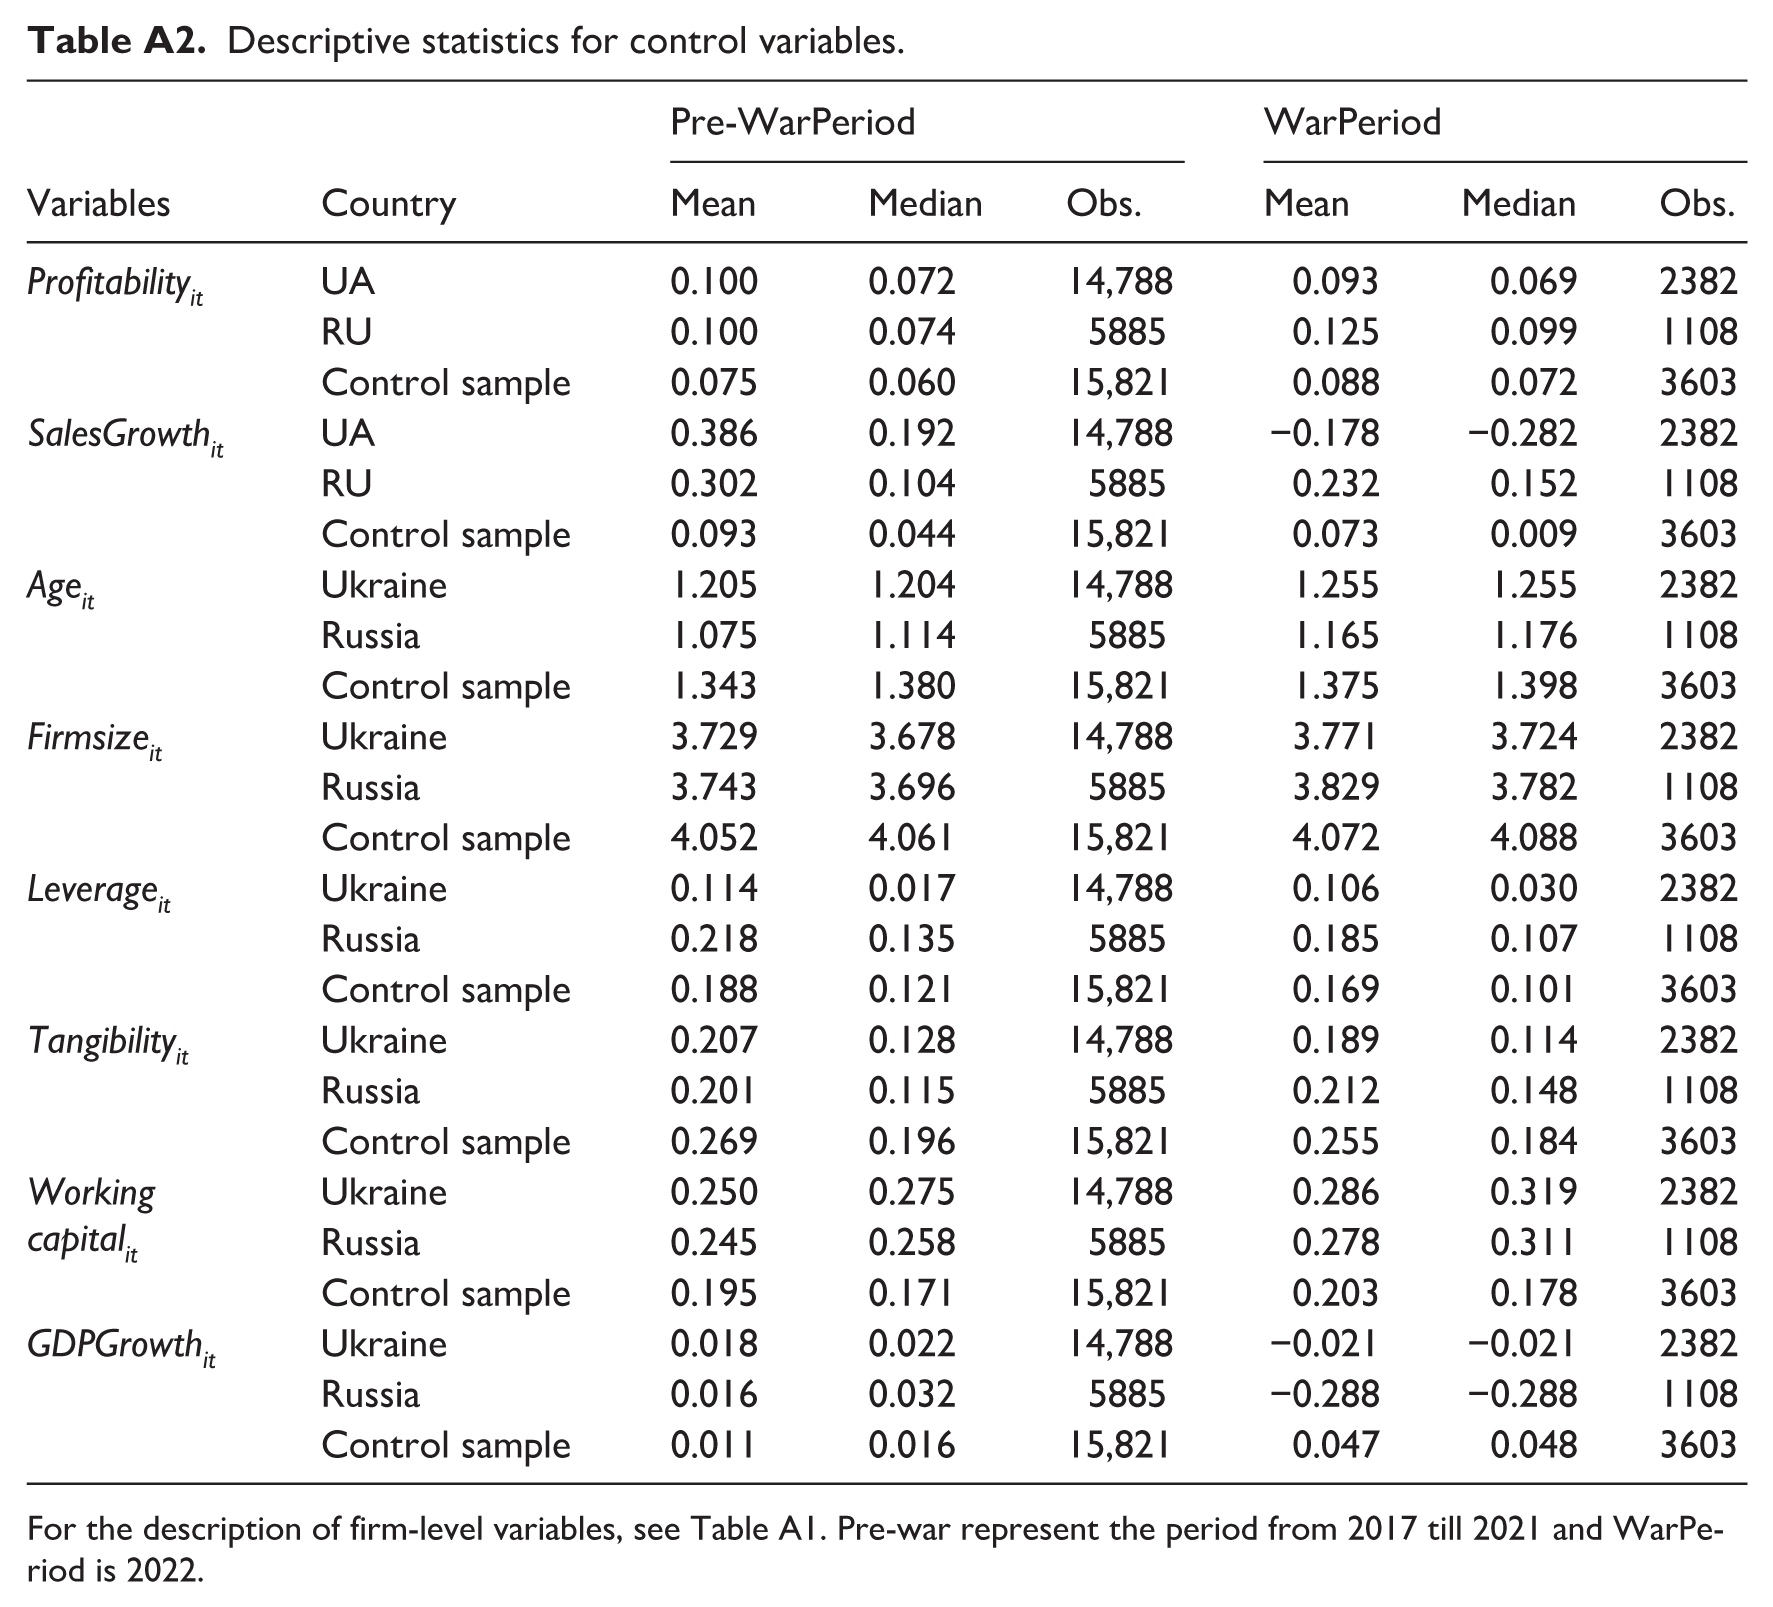
Table 3 reports descriptive statistics for the main variables capturing investment and financing policies of SMEs in Ukraine, Russia and the control sample (Belgium and the United Kingdom) before and during 2022. The table compares mean and median values between the pre-war period (2017–2021) and the first year of the full-scale invasion. Among Ukrainian SMEs, average investment values declined between the two periods, while those for Russian firms increased and those for the control group remained broadly similar. Cash holdings rose for Ukrainian SMEs from 6.5% to 8.3% of total assets, whereas changes in the control sample were limited. Interestingly, this increase in cash holdings, together with a small rise in the long-term debt ratio, may indicate that Ukrainian SMEs retained access to external finance and were not subject to acute financing constraints in 2022. The short-term debt ratio decreased slightly in Ukraine and Russia. In Appendix A (Table A2) we report the descriptive statistics of our control variables.
Descriptive statistics.
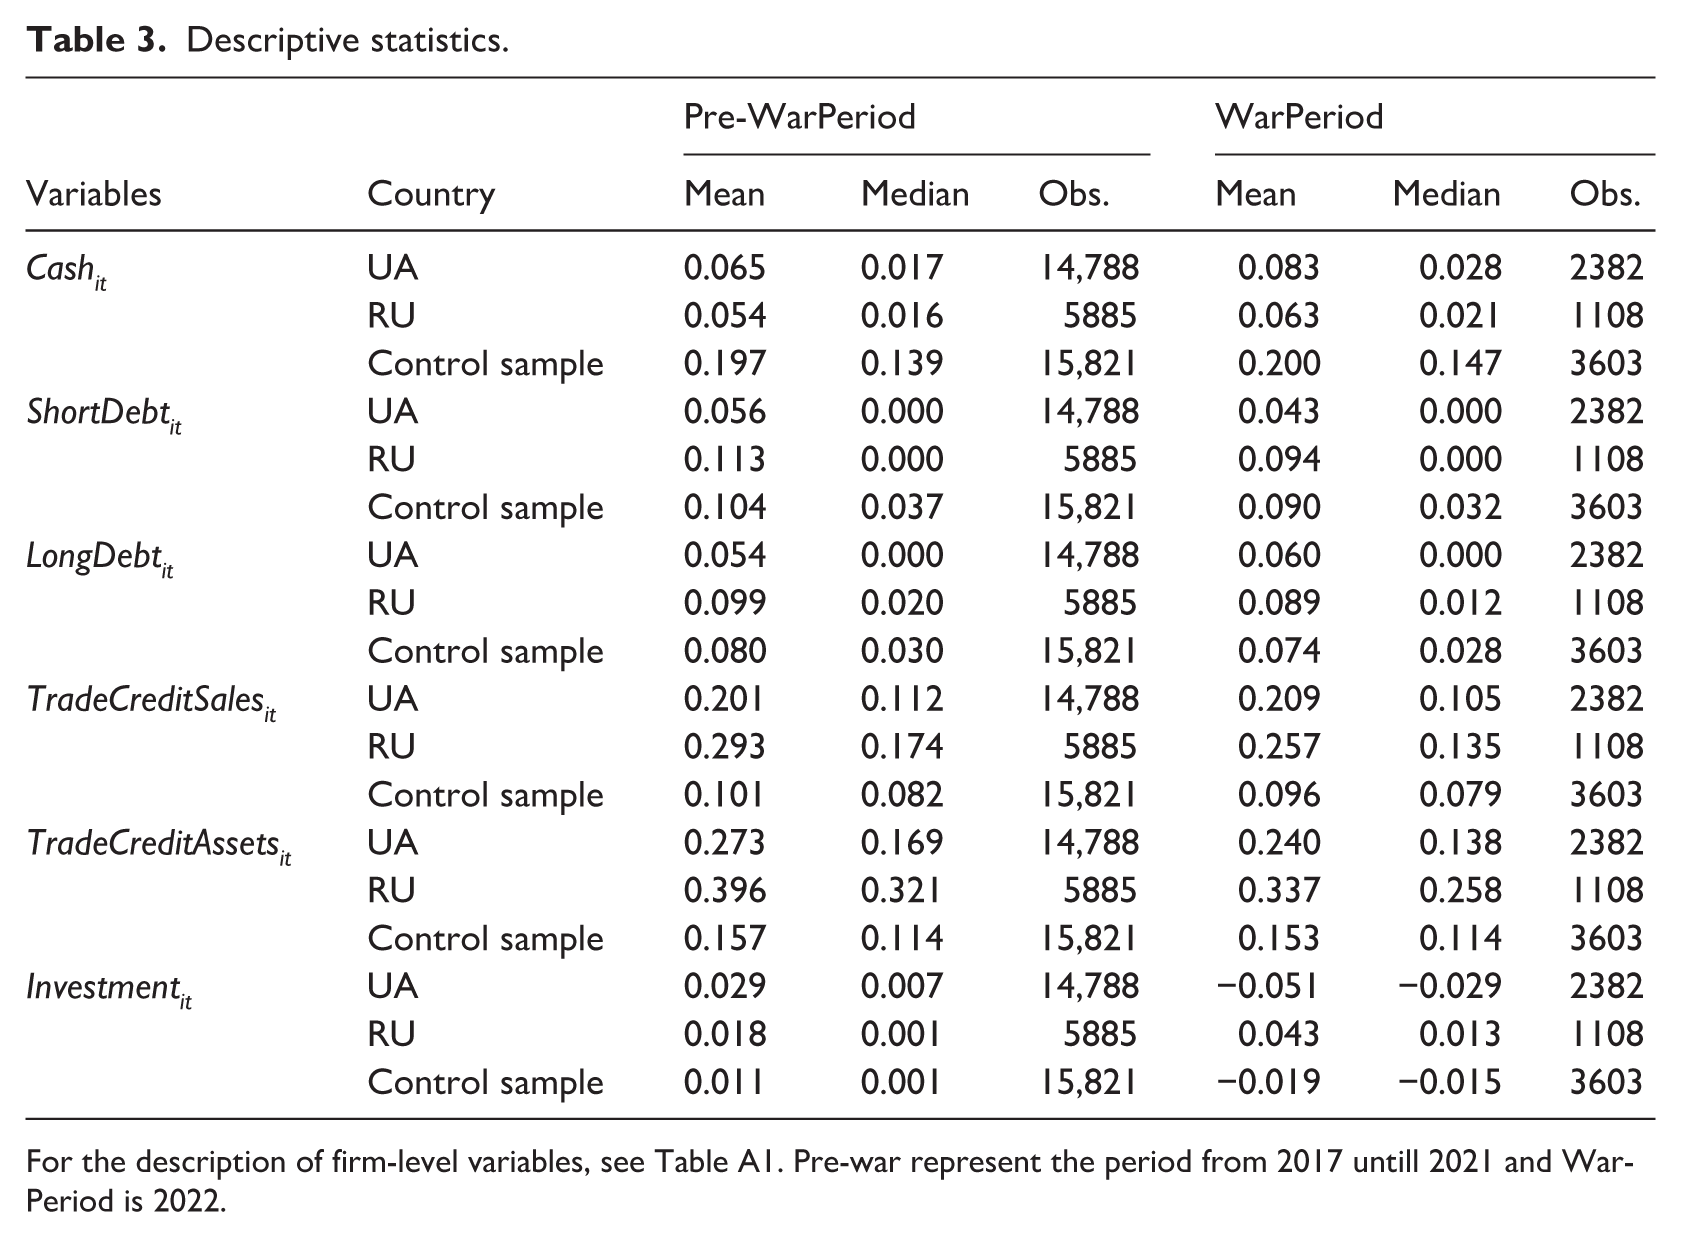
For the description of firm-level variables, see Table A1. Pre-war represent the period from 2017 untill 2021 and WarPeriod is 2022.
Results
Main results
We investigate the impact of the Russia–Ukraine war on SME financing policies and investment. Results are reported in Table 4. The interaction terms between the region dummies and the WarPeriod dummy capture differential changes for SMEs in Ukraine and Russian border regions relative to the comparison group.
The impact of the war on financing policies and investment.
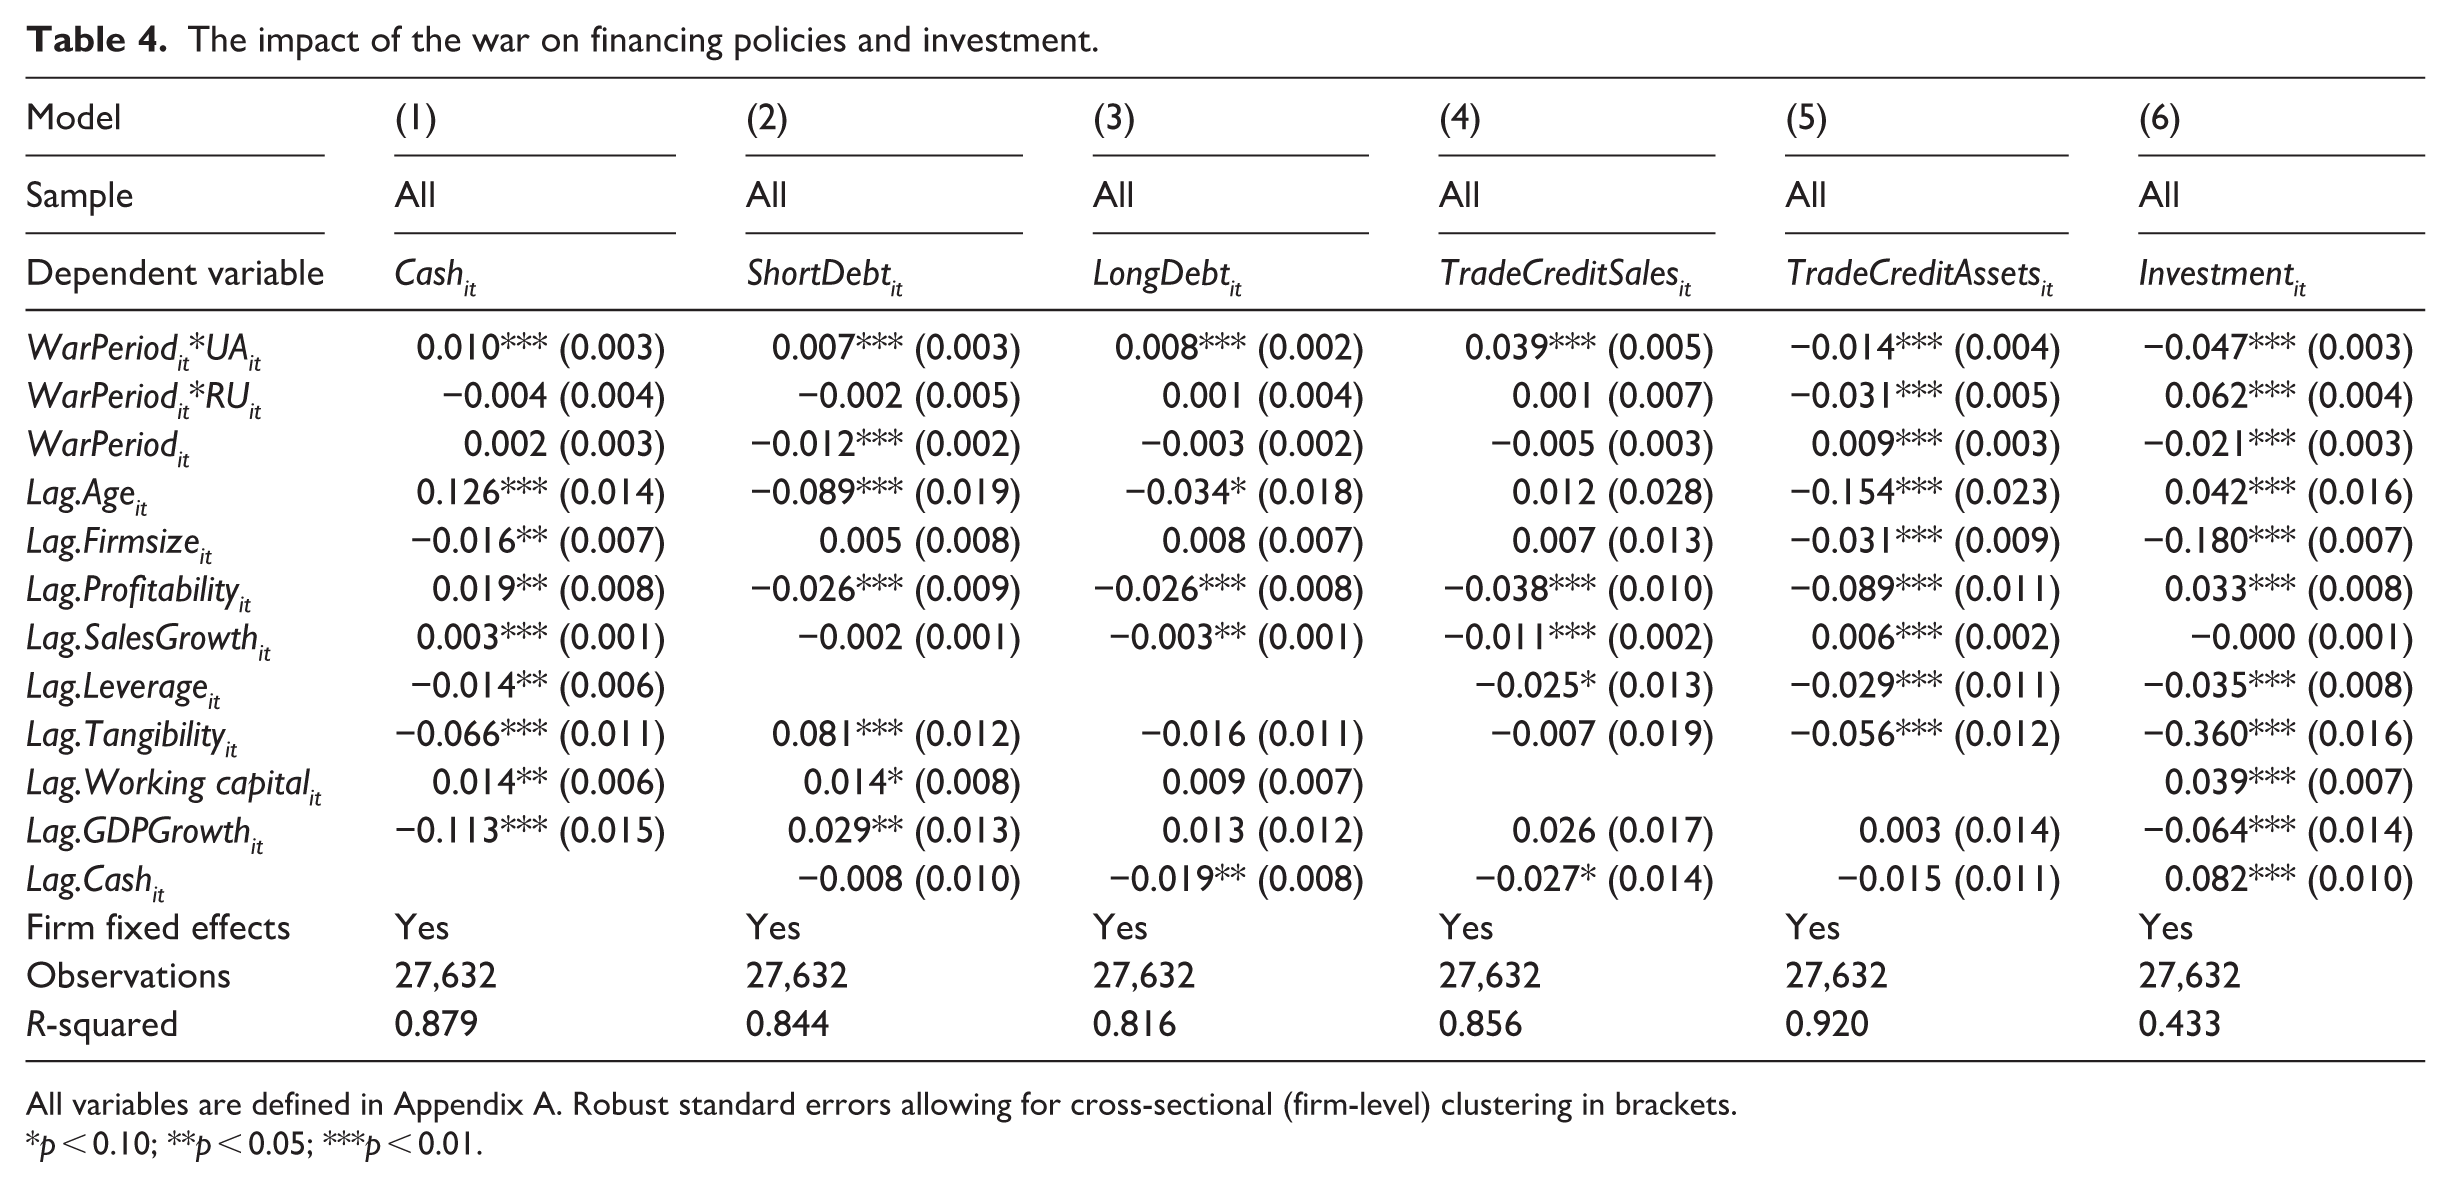
All variables are defined in Appendix A. Robust standard errors allowing for cross-sectional (firm-level) clustering in brackets.
p < 0.10; **p < 0.05; ***p < 0.01.
We examine six outcome variables. Cash is defined as the ratio of cash and cash equivalents to total assets (Model 1). ShortDebt measures short-term debt scaled by total assets (Model 2), while LongDebt captures long-term debt relative to total assets (Model 3). TradeCreditSales is defined as trade payables divided by sales (Model 4), and TradeCreditAssets as trade payables scaled by total assets (Model 5). Finally, Investment is measured as the change in fixed assets from year t−1 to t, scaled by total assets (Model 6).
For Ukraine, the estimates point to economically meaningful changes in financial policies during the war period. First, Cash increased markedly in model 1. The WarPeriod coefficient is 0.002 and the interaction term WarPeriod × UA is 0.010, implying a total wartime effect of 0.012. Relative to the pre-war mean cash ratio of 0.065, this corresponds to an increase of about 18.5% (0.012/0.065 = 18.5%) in cash holdings. This pattern is consistent with a precautionary motive whereby firms may build liquidity buffers. For ShortDebt, the WarPeriod coefficient is −0.012 and the WarPeriod × UA interaction is 0.007, implying a total effect of −0.005. This suggests that short-term debt declined overall for Ukrainian SMEs during 2022, although the contraction was smaller than in the baseline group. For LongDebt, the WarPeriod coefficient is −0.003 and the WarPeriod × UA interaction is 0.008, implying a modest increase in long-term debt of 0.005. Turning to trade credit, we observe an increase in the ratio of TradeCreditSales and a decline in TradeCreditAssets for Ukraine once the WarPeriod effect is combined with the interaction term. This combination is consistent with a contraction in sales alongside tighter supplier exposure. Finally, Investment is substantially lower during the war period. The WarPeriod coefficient is −0.021 and the WarPeriod × UA interaction is −0.047, implying a total estimated change of −0.068This is consistent with a sharp contraction in capital expenditure and a shift into negative net investment for many firms.
For Russian-border SMEs, the picture is more muted on financing policies but notably different for investment. Cash and both debt measures are not statistically different from the control group (Models 1–3), while TradeCreditSales is also unchanged (Model 4). However, trade payables as a proportion of assets fall significantly, with the WarPeriod × RU interaction of −0.031 implying a net decline once combined with the WarPeriod coefficient. In contrast to Ukraine, Investment for Russian-border SMEs increases significantly, with the WarPeriod × RU interaction of 0.062 implying a positive total wartime effect when combined with WarPeriod. Taken together, these estimates are suggestive of limited changes in liquidity and leverage policies, alongside higher capital spending relative to the comparison group relative to the control group during the war period.
To assess whether estimated changes during the invasion differ across Ukrainian regions, we classify SMEs according to their geographical exposure to active combat. The dummy variable UAwar equals 1 for firms located in Chernihivska, Donetska, Kharkivska, Khersonska, Kyiv, Kyivska, Luhanska, Mykolayivska, Odeska, Sevastopol, and Sumska – areas more directly exposed to warfare or missile attacks during 2022. The complementary dummy UAother equals 1 for firms in all other Ukrainian regions. This classification follows our own construction based on regions on the east side of the country.
For UAwar, the war period is associated with a significant rise in Cash, consistent with a precautionary build‑up of liquidity buffers. ShortDebt does not change in a statistically significant manner, while LongDebt edges up. Turning to trade credit, TradeCreditSales is not significantly affected, but TradeCreditAssets falls markedly, suggesting that supplier financing shrinks relative to the balance sheet. Investment declines sharply, in line with the argument that extreme uncertainty and operational disruption may have led firms to postpone capital expenditure.
For UAother, we find a very similar pattern. Cash increases even more strongly than in UAwar, and LongDebt also rises. As in UAwar, ShortDebt remains statistically unchanged and TradeCreditSales shows no significant movement. TradeCreditAssets falls by the same magnitude, pointing to a common compression of trade credit relative to assets across Ukrainian regions. Investment declines substantially, with a somewhat larger economic effect than in UAwar. Taken together, the Ukrainian subsample indicates that SMEs in both war‑affected and other regions respond by building cash, modestly extending long‑term borrowing, reducing payables relative to assets, and cutting investment; differences across the two groups are limited in scope and magnitude.
In Panel B of Table 5, we conduct a parallel within‑country analysis for Russia, distinguishing between other Russian regions bordering Ukraine (Russia) and Crimea. For the Russia group, Cash and LongDebt do not move in a statistically significant way, while ShortDebt declines. TradeCreditSales is unchanged, but TradeCreditAssets falls significantly, pointing to a contraction in supplier financing relative to firm size. Notably, Investment rises strongly, indicating an expansion in capital spending relative to the control group during the war period.
Within-country analysis.
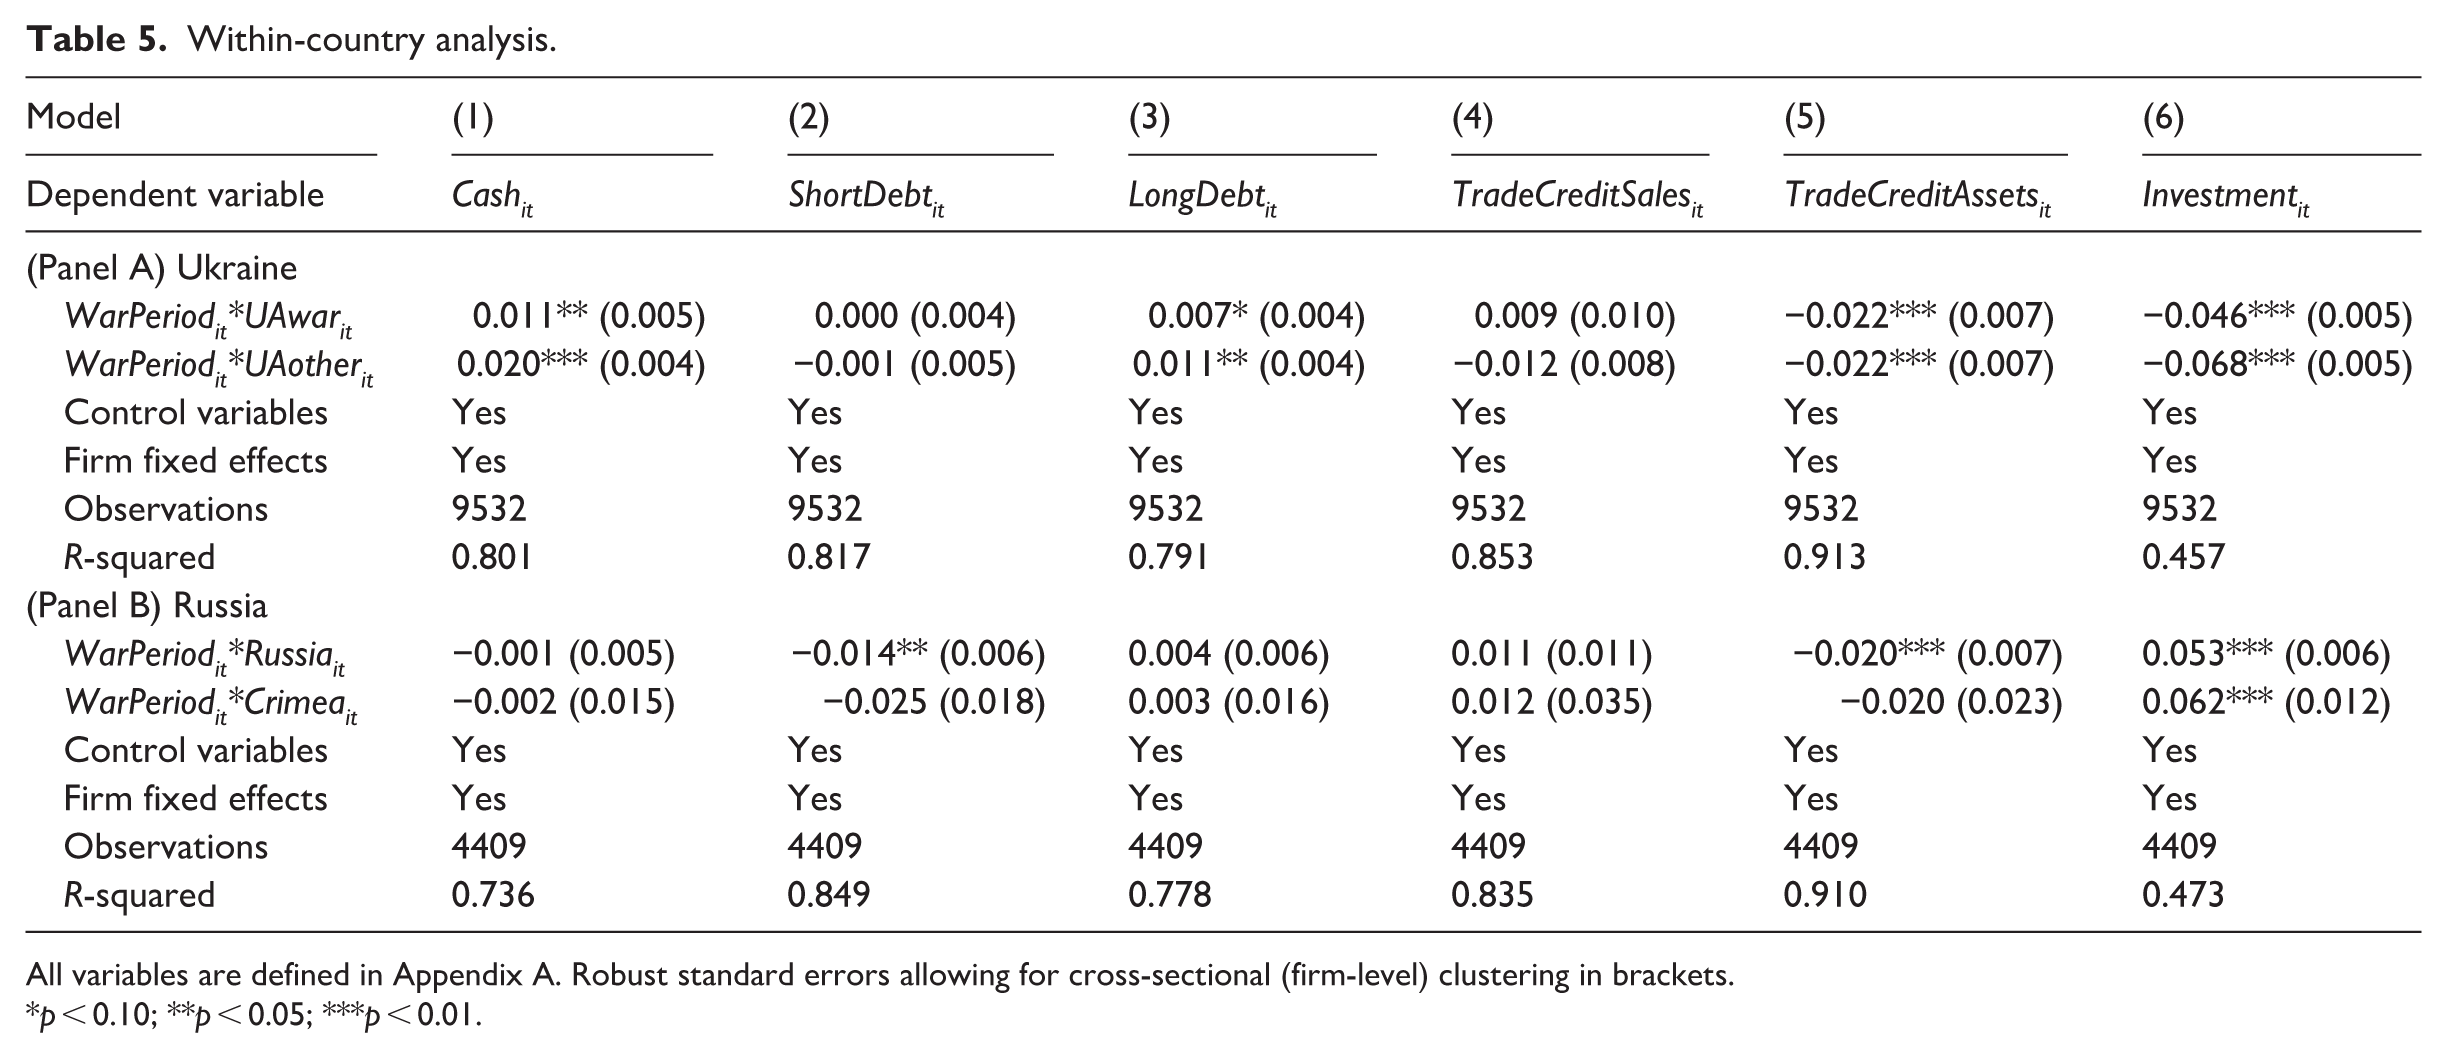
All variables are defined in Appendix A. Robust standard errors allowing for cross-sectional (firm-level) clustering in brackets.
p < 0.10; **p < 0.05; ***p < 0.01.
For Crimea, we observe a distinct pattern. Financing policy adjustments are generally not statistically significant: Cash, ShortDebt, LongDebt, and both trade credit ratios show no robust changes. However, Investment increases and does so by a slightly larger magnitude than in other Russian regions.
Robustness
We conduct a series of robustness and identification checks to evaluate whether the baseline findings are sensitive to attrition into 2022, potential pre-treatment differentials, and the choice of identifying variation around the invasion.
First, we address potential survivorship bias arising from non-random firm exit in 2022. Table 6 reports three complementary correction strategies: an alternative matching approach, entropy balancing weights (Hainmueller, 2012; Fackler et al., 2022; Brixy & Murmann, 2025), and inverse-probability-of-censoring weights. Across all specifications, the core patterns remain stable. Ukrainian firms exhibit significantly higher cash holdings, greater reliance on trade credit sales, lower trade credit assets, and reduced investment during the war period. Russian-border firms consistently show a contraction in trade credit assets and a comparatively stronger investment response. Importantly, in specifications without year fixed effects, the total wartime change for a treated group equals the sum of the WarPeriod coefficient and the corresponding interaction term. For example, ShortDebt declines for the baseline group as indicated by the negative WarPeriod coefficient, and the positive WarPeriod × UA coefficient implies a smaller decline for Ukraine relative to the baseline group rather than an unconditional increase. These corrections suggest that the baseline estimates are unlikely to be driven solely by differential attrition.
Attrition/survivorship corrections.
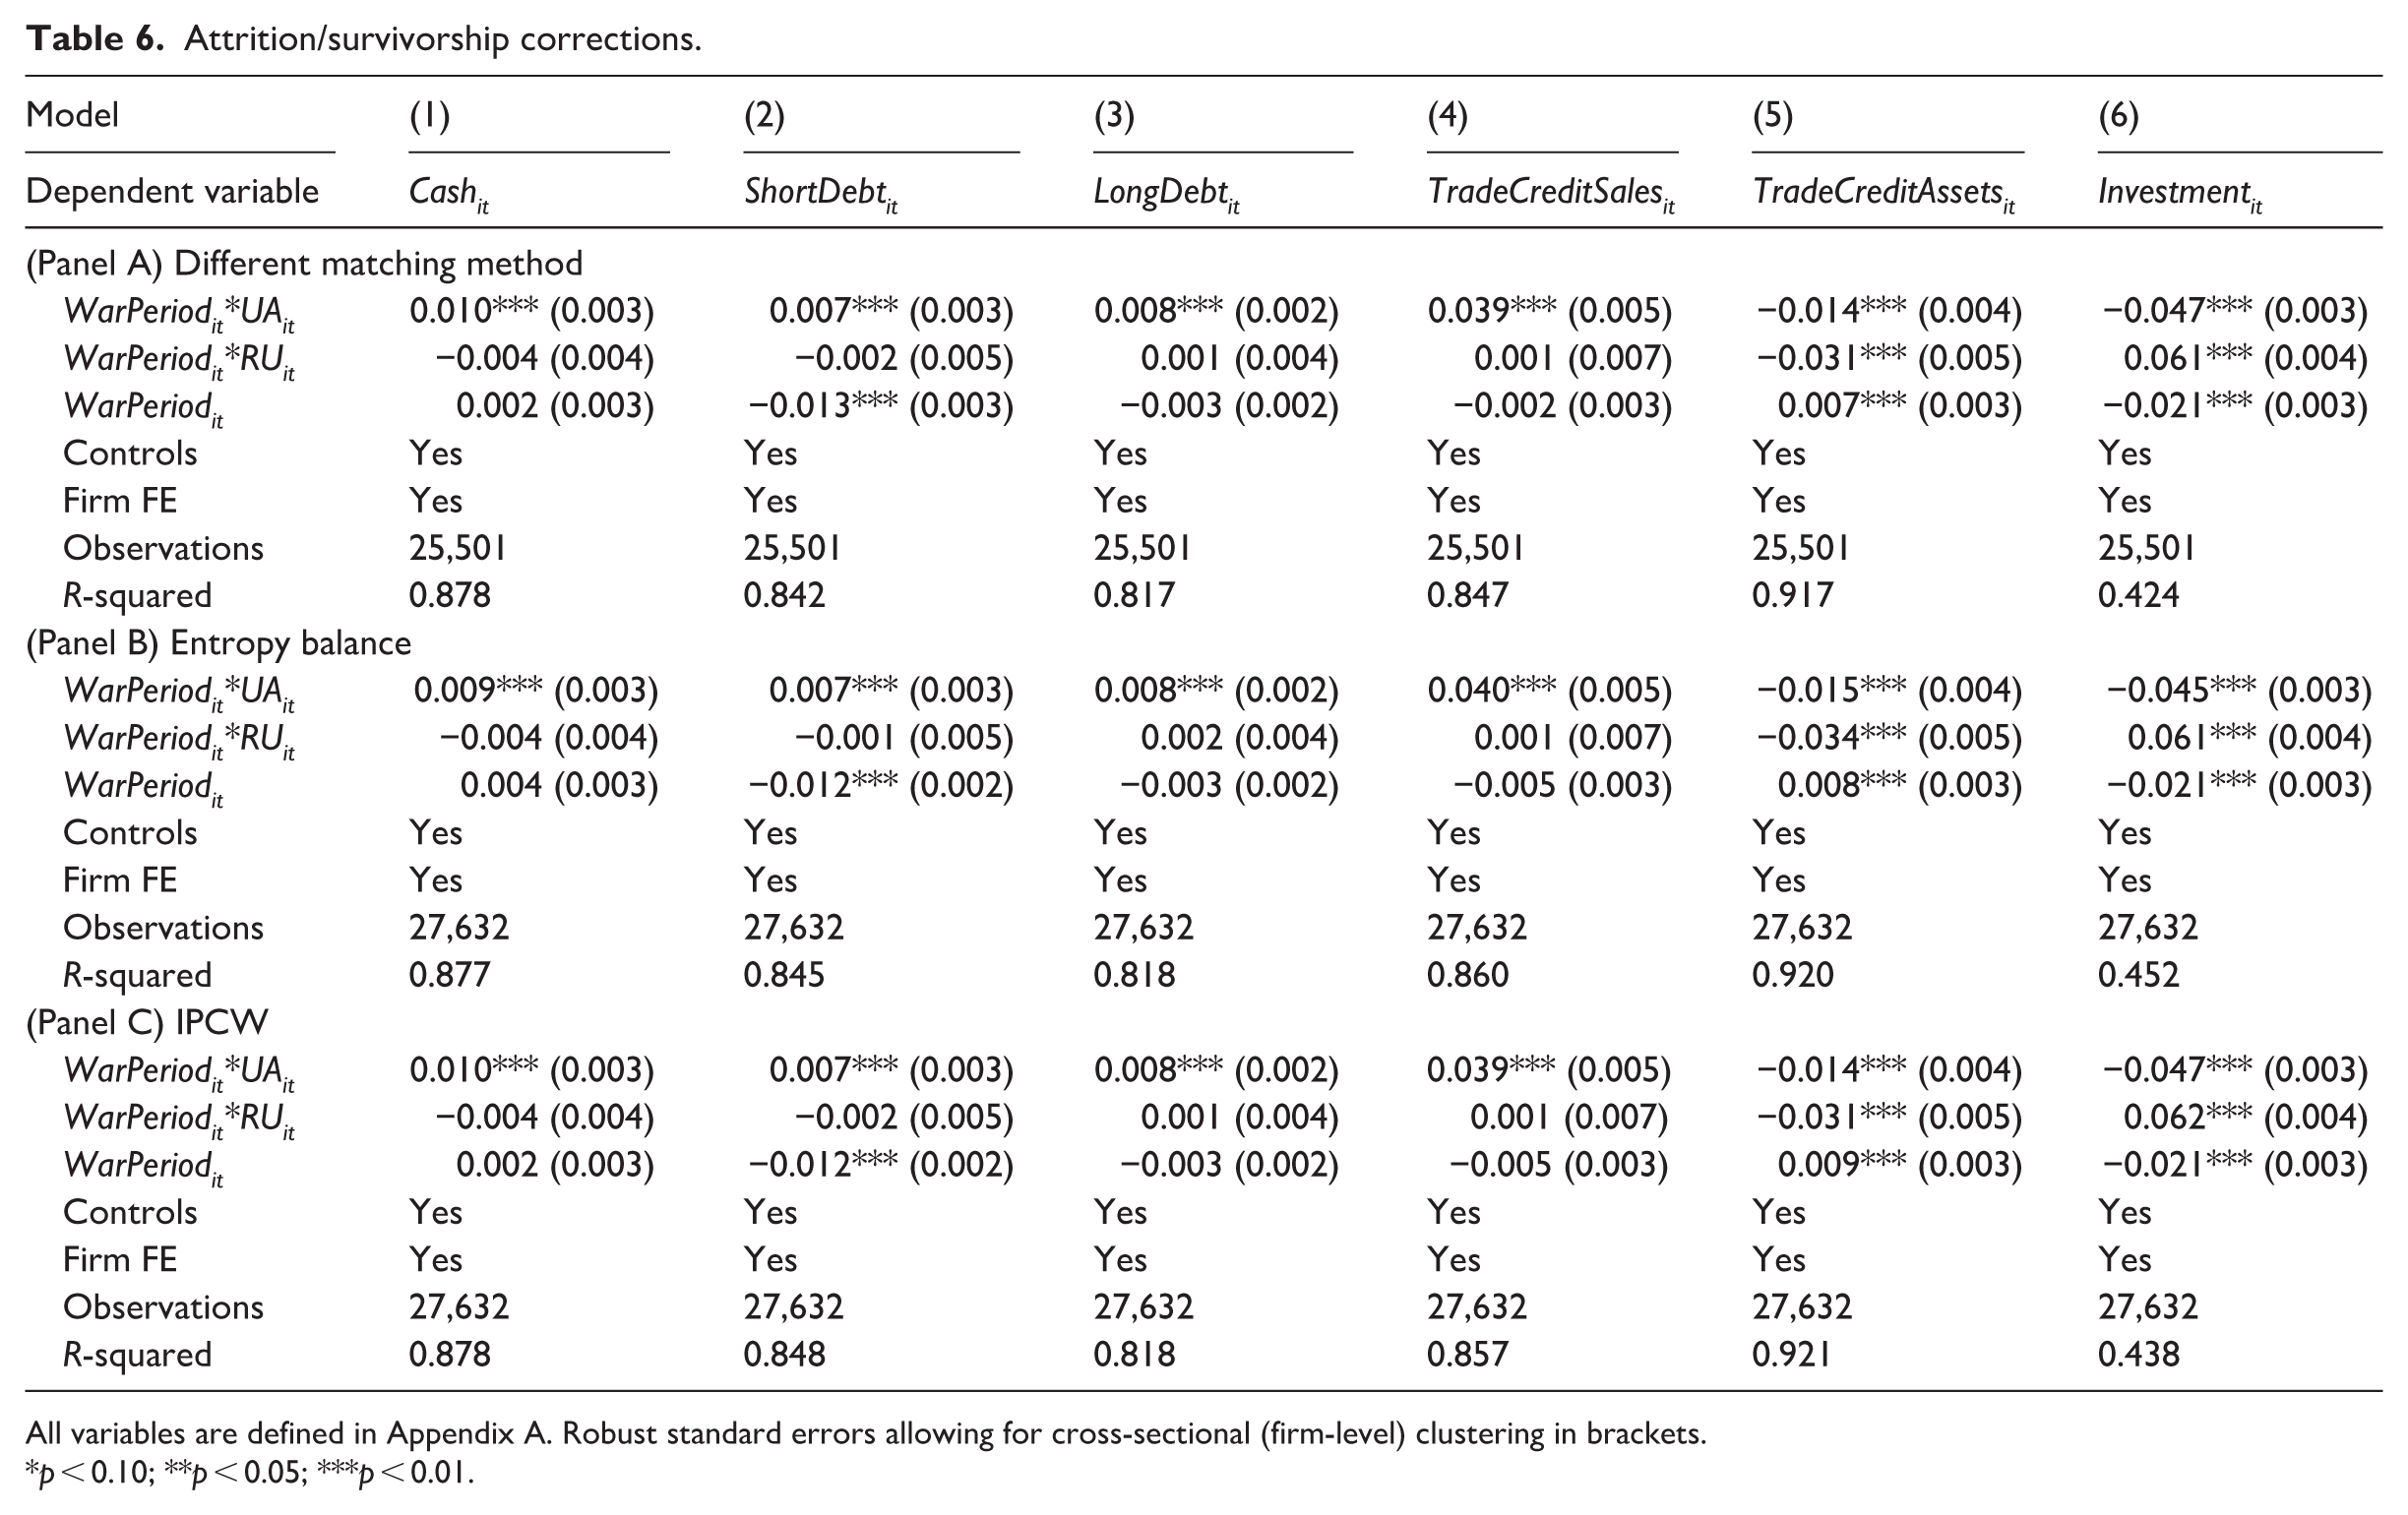
All variables are defined in Appendix A. Robust standard errors allowing for cross-sectional (firm-level) clustering in brackets.
p < 0.10; **p < 0.05; ***p < 0.01.
Second, we conduct a falsification test by assigning a pseudo-treatment to the year 2021 and re-estimating the model using only pre-war observations (2017–2021). This approach follows standard practice in the difference-in-differences and corporate finance literature, where a fake treatment timing is introduced to assess whether spurious effects arise prior to the actual shock (Bertrand et al., 2004; Duchin et al., 2010; Giroud & Mueller, 2017). Under the parallel trend’s assumption, the placebo interaction terms should be statistically indistinguishable from zero. Consistent with this expectation, Table 7 shows no systematic evidence of pre-treatment effects across the main financing outcomes.
Placebo falsification.
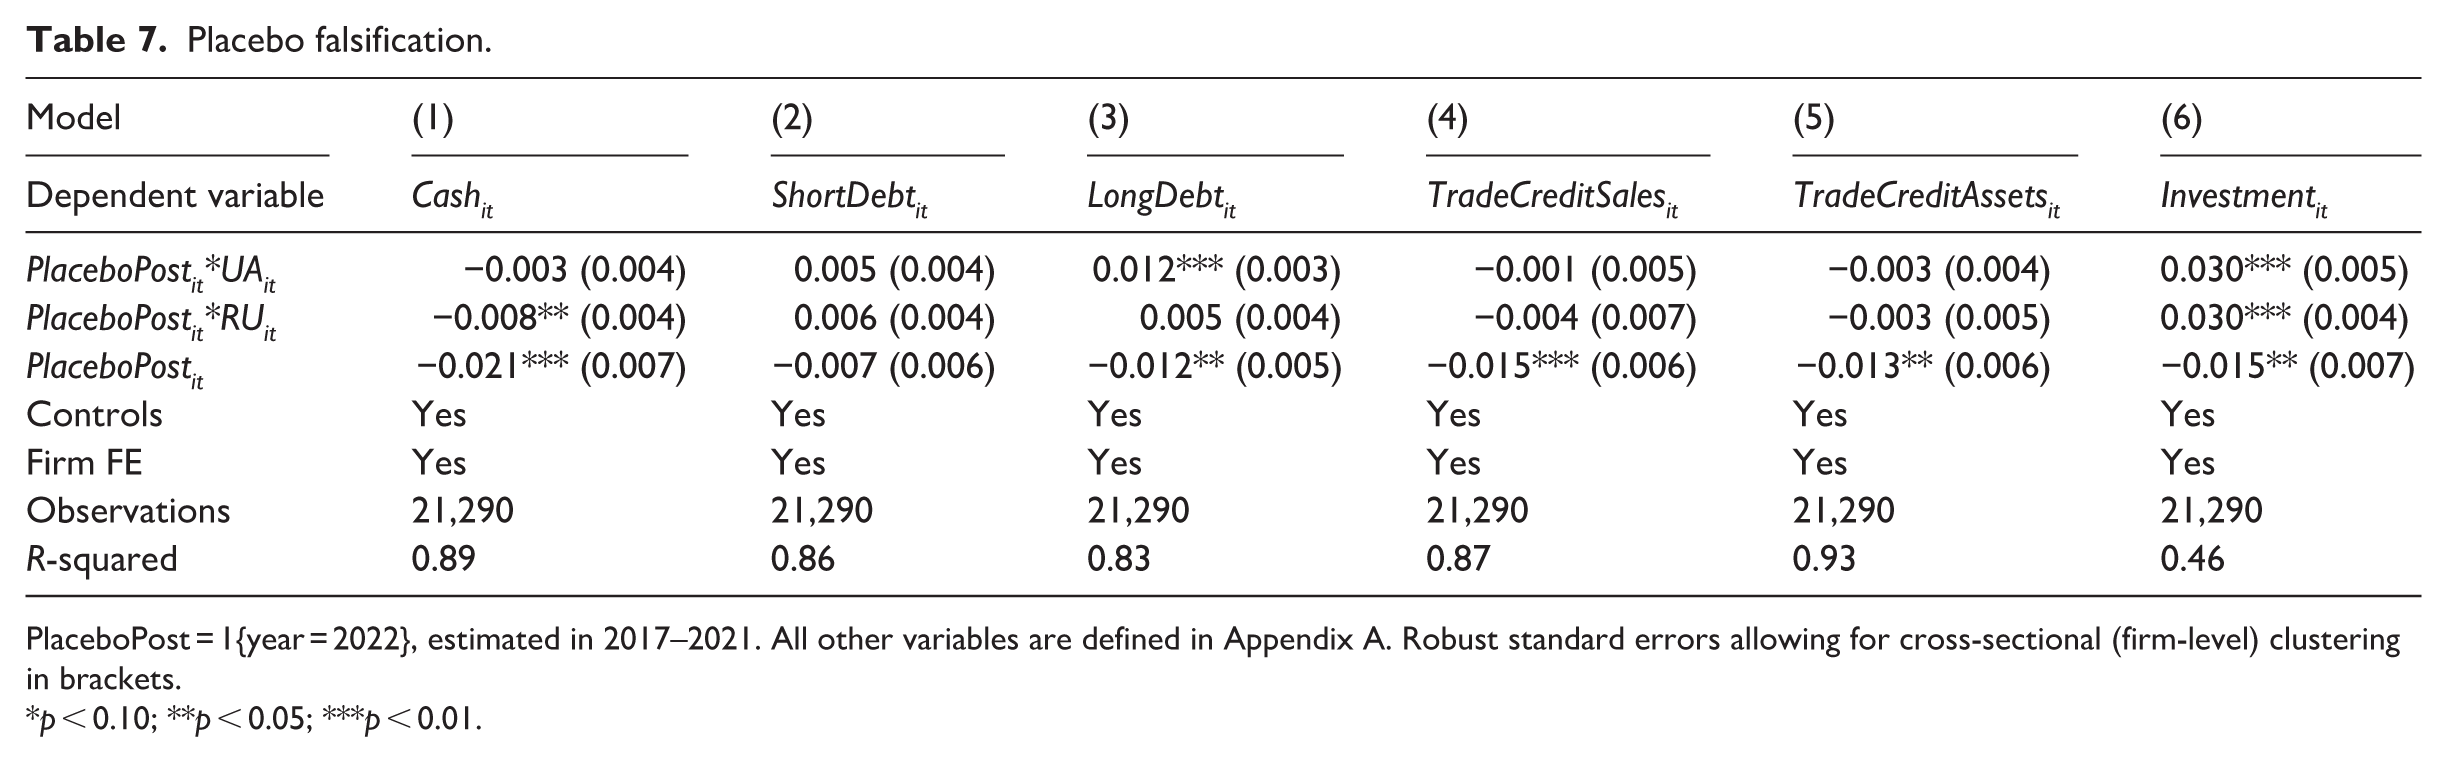
PlaceboPost = 1{year = 2022}, estimated in 2017–2021. All other variables are defined in Appendix A. Robust standard errors allowing for cross-sectional (firm-level) clustering in brackets.
p < 0.10; **p < 0.05; ***p < 0.01.
To further validate pre-treatment comparability, we implement an outcome-path balancing diagnostic inspired by the synthetic control logic that emphasises accurate pre-treatment fit. For each outcome, we reweight control firms using entropy balancing so that their pre-treatment outcome history matches that of the treated group. We then apply a leave-one-pre-year-out procedure over the period 2017–2021. For each holdout year, weights are estimated using the remaining pre-years and we examine the out-of-sample treated minus weighted-control gap in that year. Table 8 reports these diagnostics separately for Ukraine and Russian-border firms. For debt and trade credit margins, the pre-treatment gaps are generally small and often statistically insignificant, supporting the credibility of the counterfactual for these outcomes. In contrast, investment exhibits persistent and statistically significant pre-treatment gaps in multiple years for both groups. These results reinforce the view that investment dynamics were more volatile even prior to the invasion and should therefore, be interpreted with greater caution in the main analysis.
Outcome-path balancing pre-trend validation.
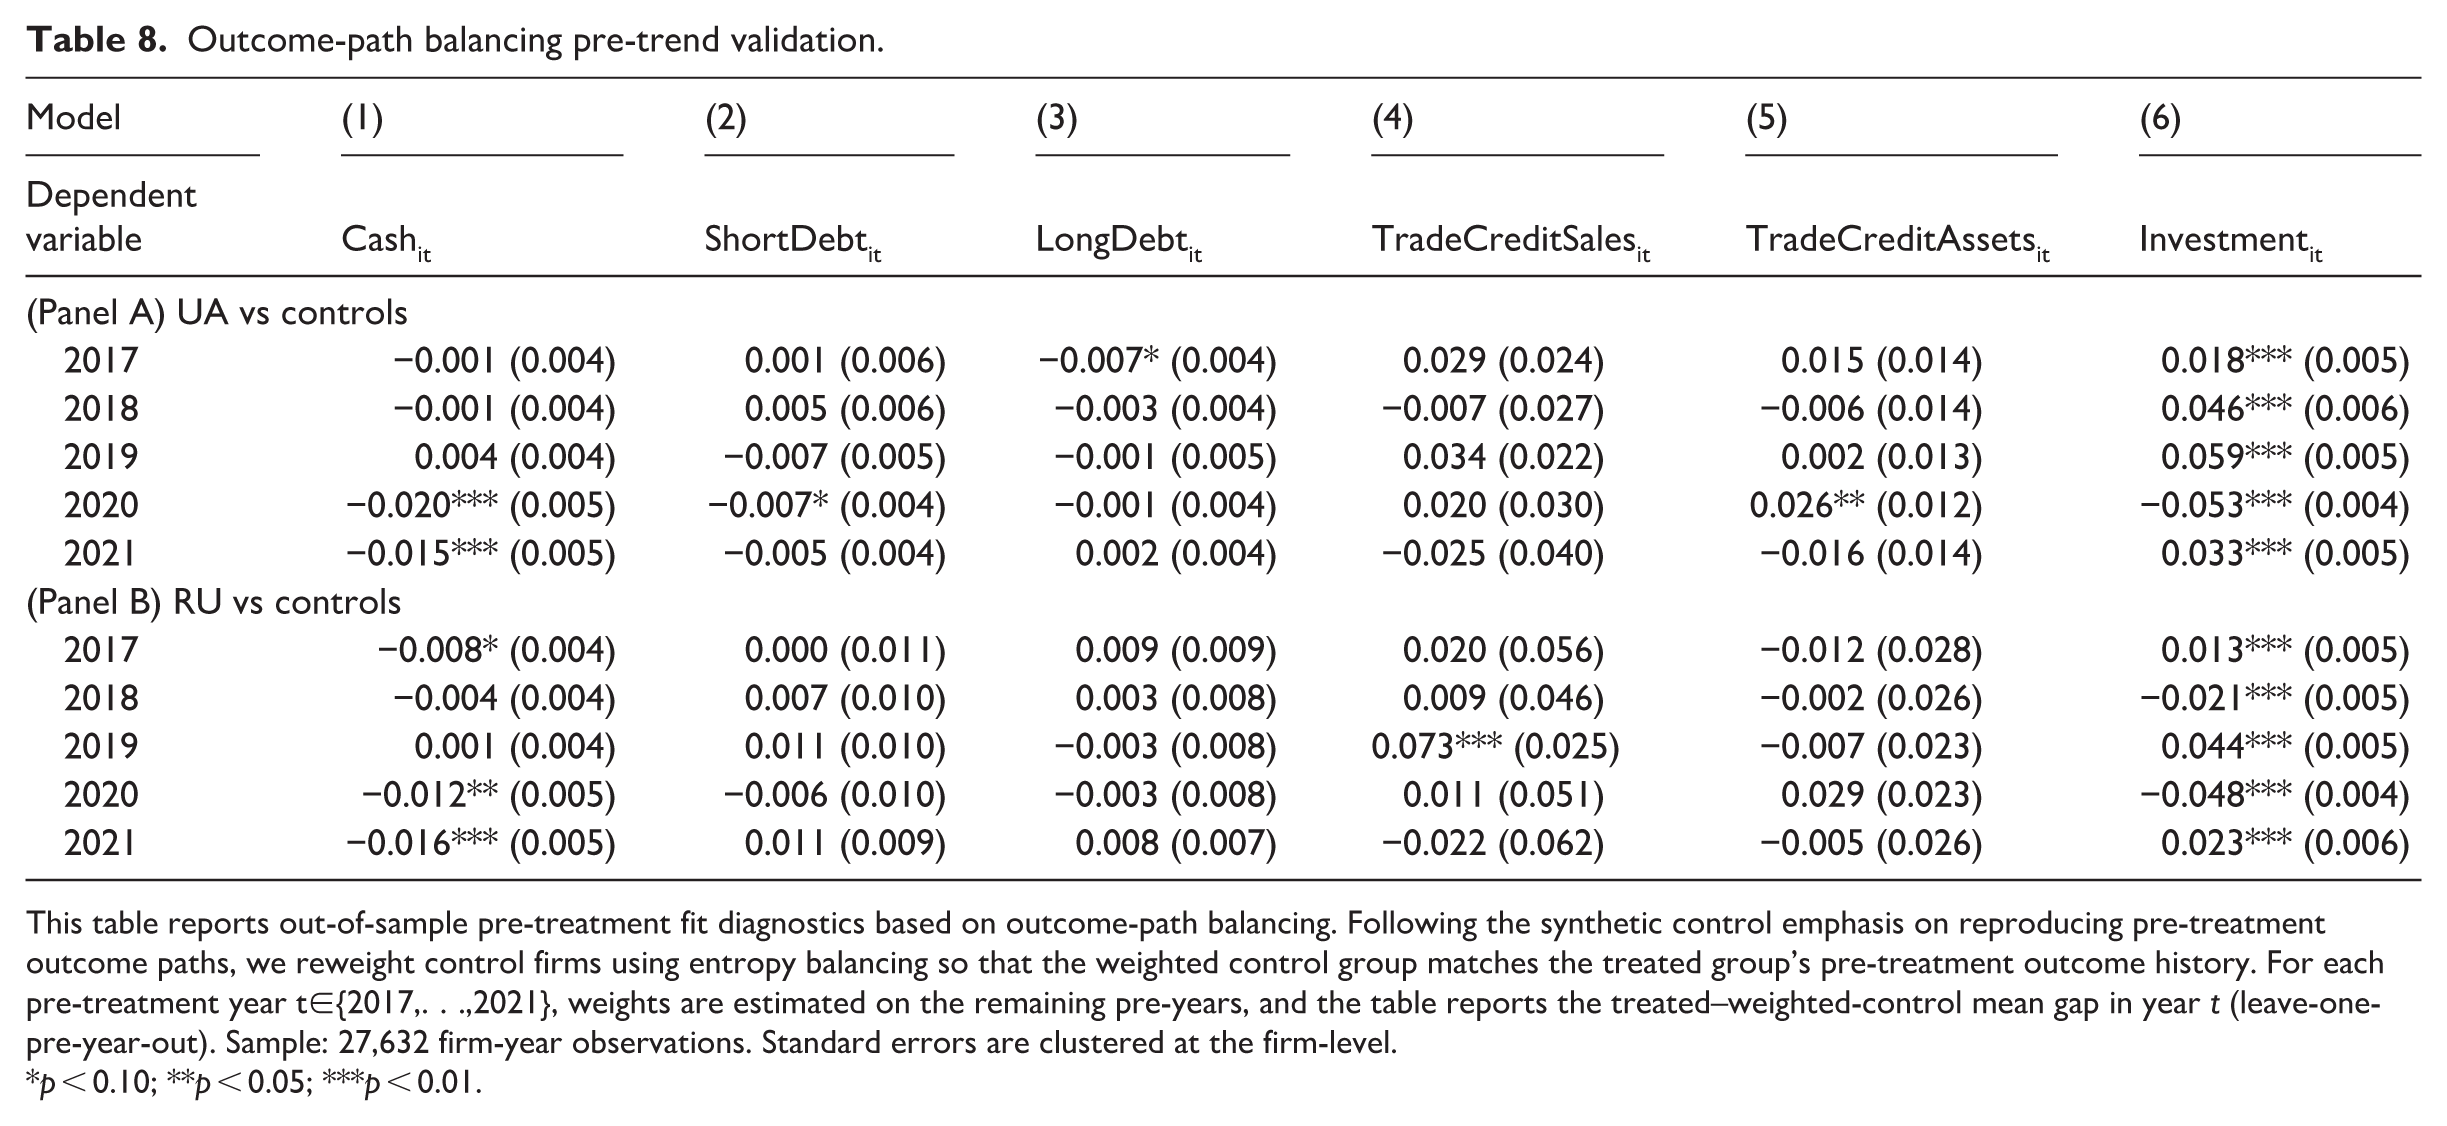
This table reports out-of-sample pre-treatment fit diagnostics based on outcome-path balancing. Following the synthetic control emphasis on reproducing pre-treatment outcome paths, we reweight control firms using entropy balancing so that the weighted control group matches the treated group’s pre-treatment outcome history. For each pre-treatment year t∈{2017,. . .,2021}, weights are estimated on the remaining pre-years, and the table reports the treated–weighted-control mean gap in year t (leave-one-pre-year-out). Sample: 27,632 firm-year observations. Standard errors are clustered at the firm-level.
p < 0.10; **p < 0.05; ***p < 0.01.
Third, we focus on the immediate pre- and post-invasion contrast. Panel A of Table 9 re-estimates the difference-in-differences specifications using only 2021 and 2022, retaining 2020 solely to construct lagged controls. This short-window design reduces reliance on longer pre-trend assumptions. The results preserve the core Ukrainian adjustment pattern: a significant increase in Cash and TradeCreditSales, a decline in TradeCreditAssets, and a substantial contraction in Investment relative to the baseline group. For Russian-border firms, the contraction in TradeCreditAssets remains statistically significant, while the Investment response is positive but more moderate. Panel B of Table 9 reports a first-difference specification based on firm-level changes between 2021 and 2022. The first-difference results corroborate the Ukrainian increase in liquidity and the sharp decline in Investment, as well as the contraction in TradeCreditAssets for Russian-border firms. However, the Russian-border Investment response is no longer statistically significant in this specification, suggesting that this margin is more sensitive to modelling choices than the trade credit effects.
Short-horizon identification.
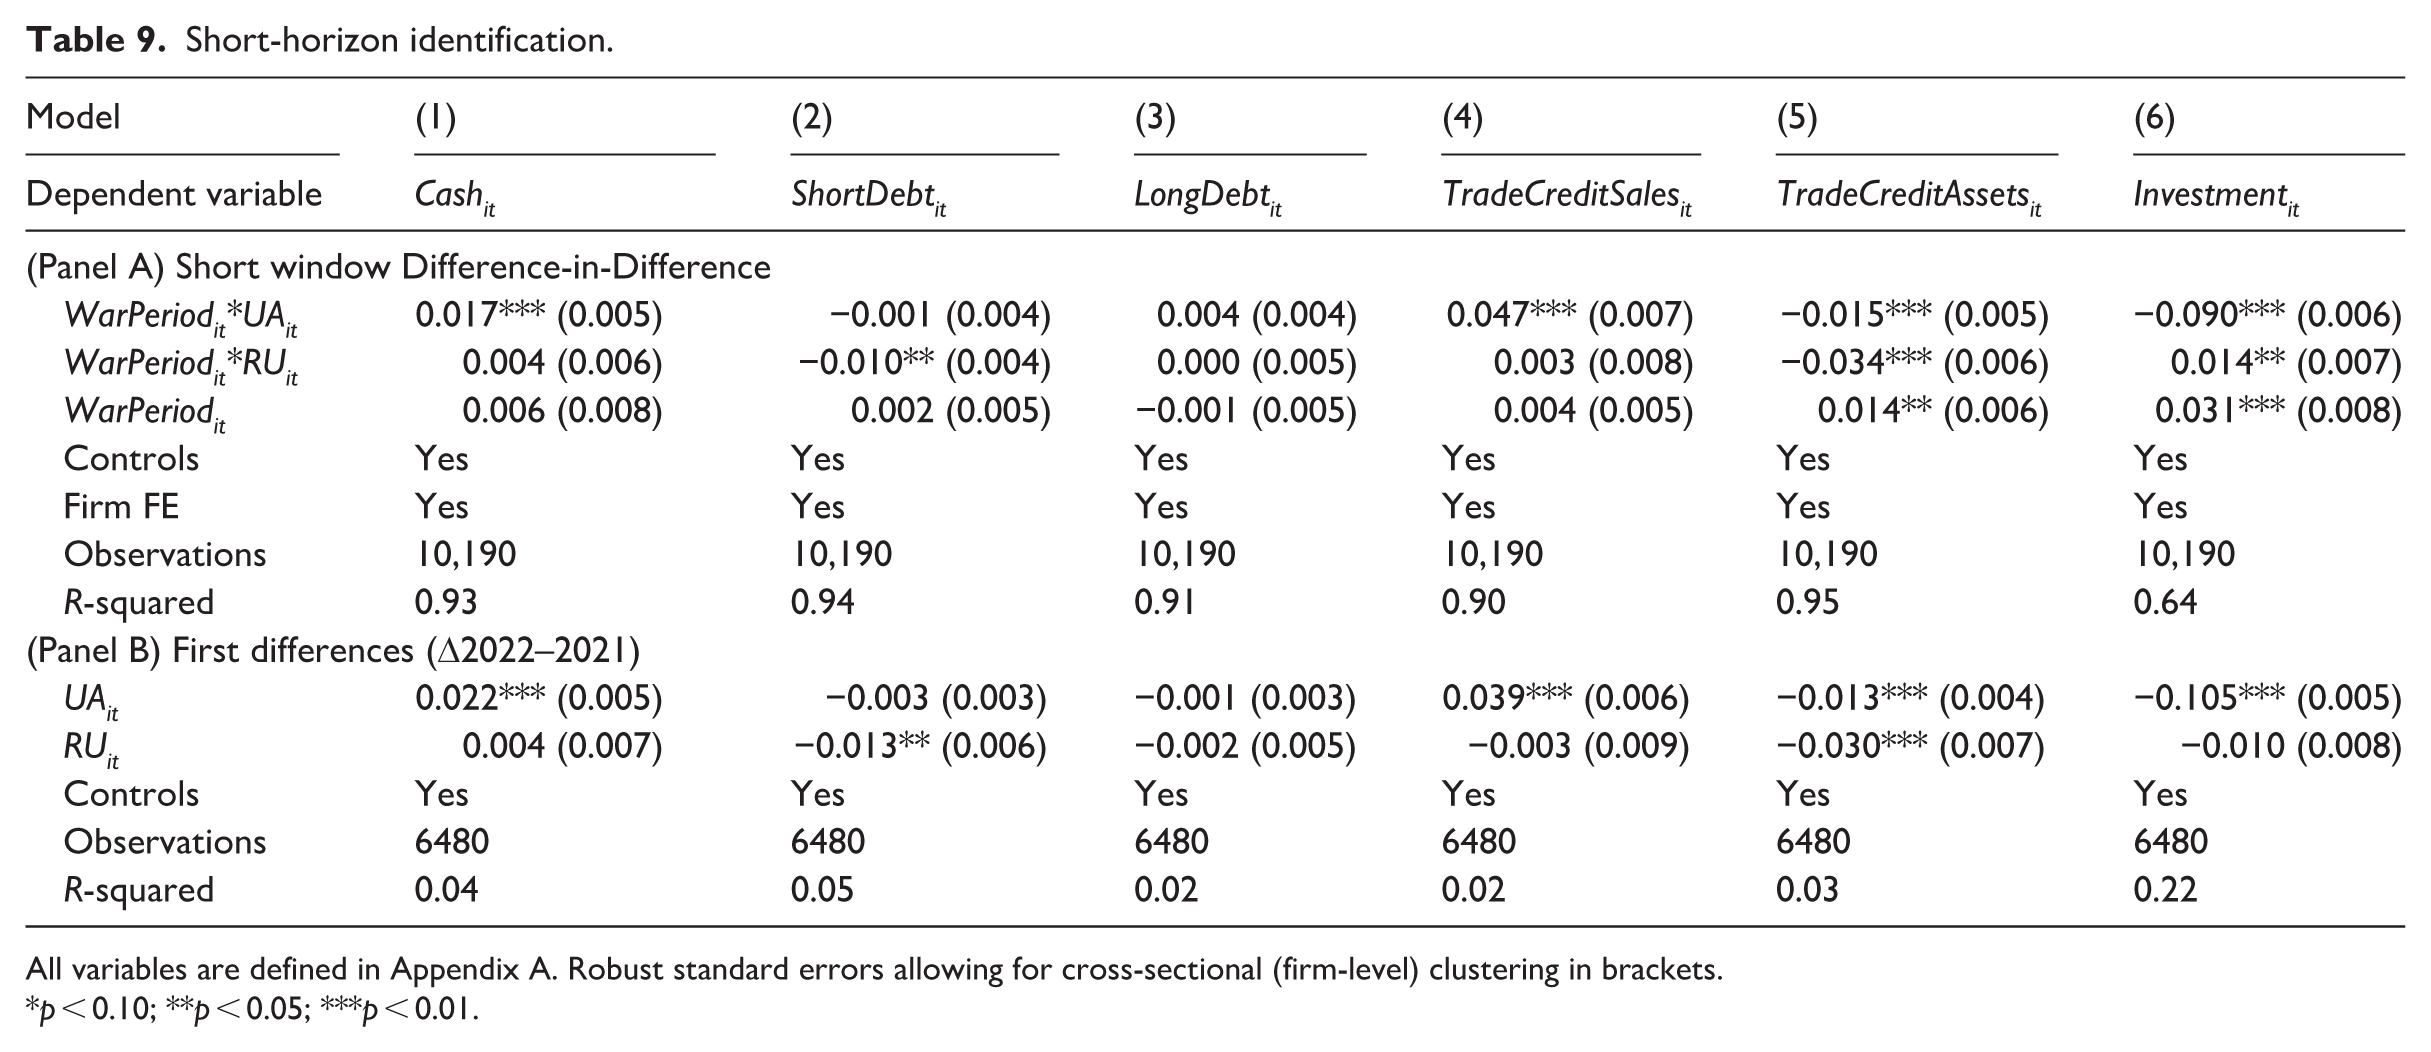
All variables are defined in Appendix A. Robust standard errors allowing for cross-sectional (firm-level) clustering in brackets.
p < 0.10; **p < 0.05; ***p < 0.01.
Taken together, the robustness exercises support the interpretation of the main associations documented in the paper. The Ukrainian pattern, characterised by higher liquidity buffers, greater reliance on TradeCreditSales, and reduced Investment is stable across attrition corrections, short-horizon estimators, and first-difference models. For Russian-border firms, the contraction in TradeCreditAssets is consistently recovered across specifications, whereas the Investment response is more sensitive to pre-treatment dynamics and estimator choice.
Cross sections
We further examine whether the impact of the Russia–Ukraine war varies by firm age and size. In Table 10, we divide the sample into medium and small firms, in accordance with the previously identified definition of the European Union. In Ukraine, Cash increased modestly, with the increase more evident among small firms, while ShortDebt changed only marginally in both size groups, consistent with precautionary liquidity management. Medium firms also expanded LongDebt significantly, while small firms did not, which may suggest that larger SMEs retained access to longer-maturity finance. On the trade credit margin, both groups increased TradeCreditSales, but the effect was larger for medium firms, consistent with more active use of customer financing. TradeCreditAssets fell significantly for small firms, consistent with difficulties in maintaining pre-war supplier credit obligations. Investment decreased in both groups, but the reduction was stronger among medium firms, reflecting their greater exposure to large-scale projects that are easier to delay or cancel under uncertainty.
Firm size analysis.
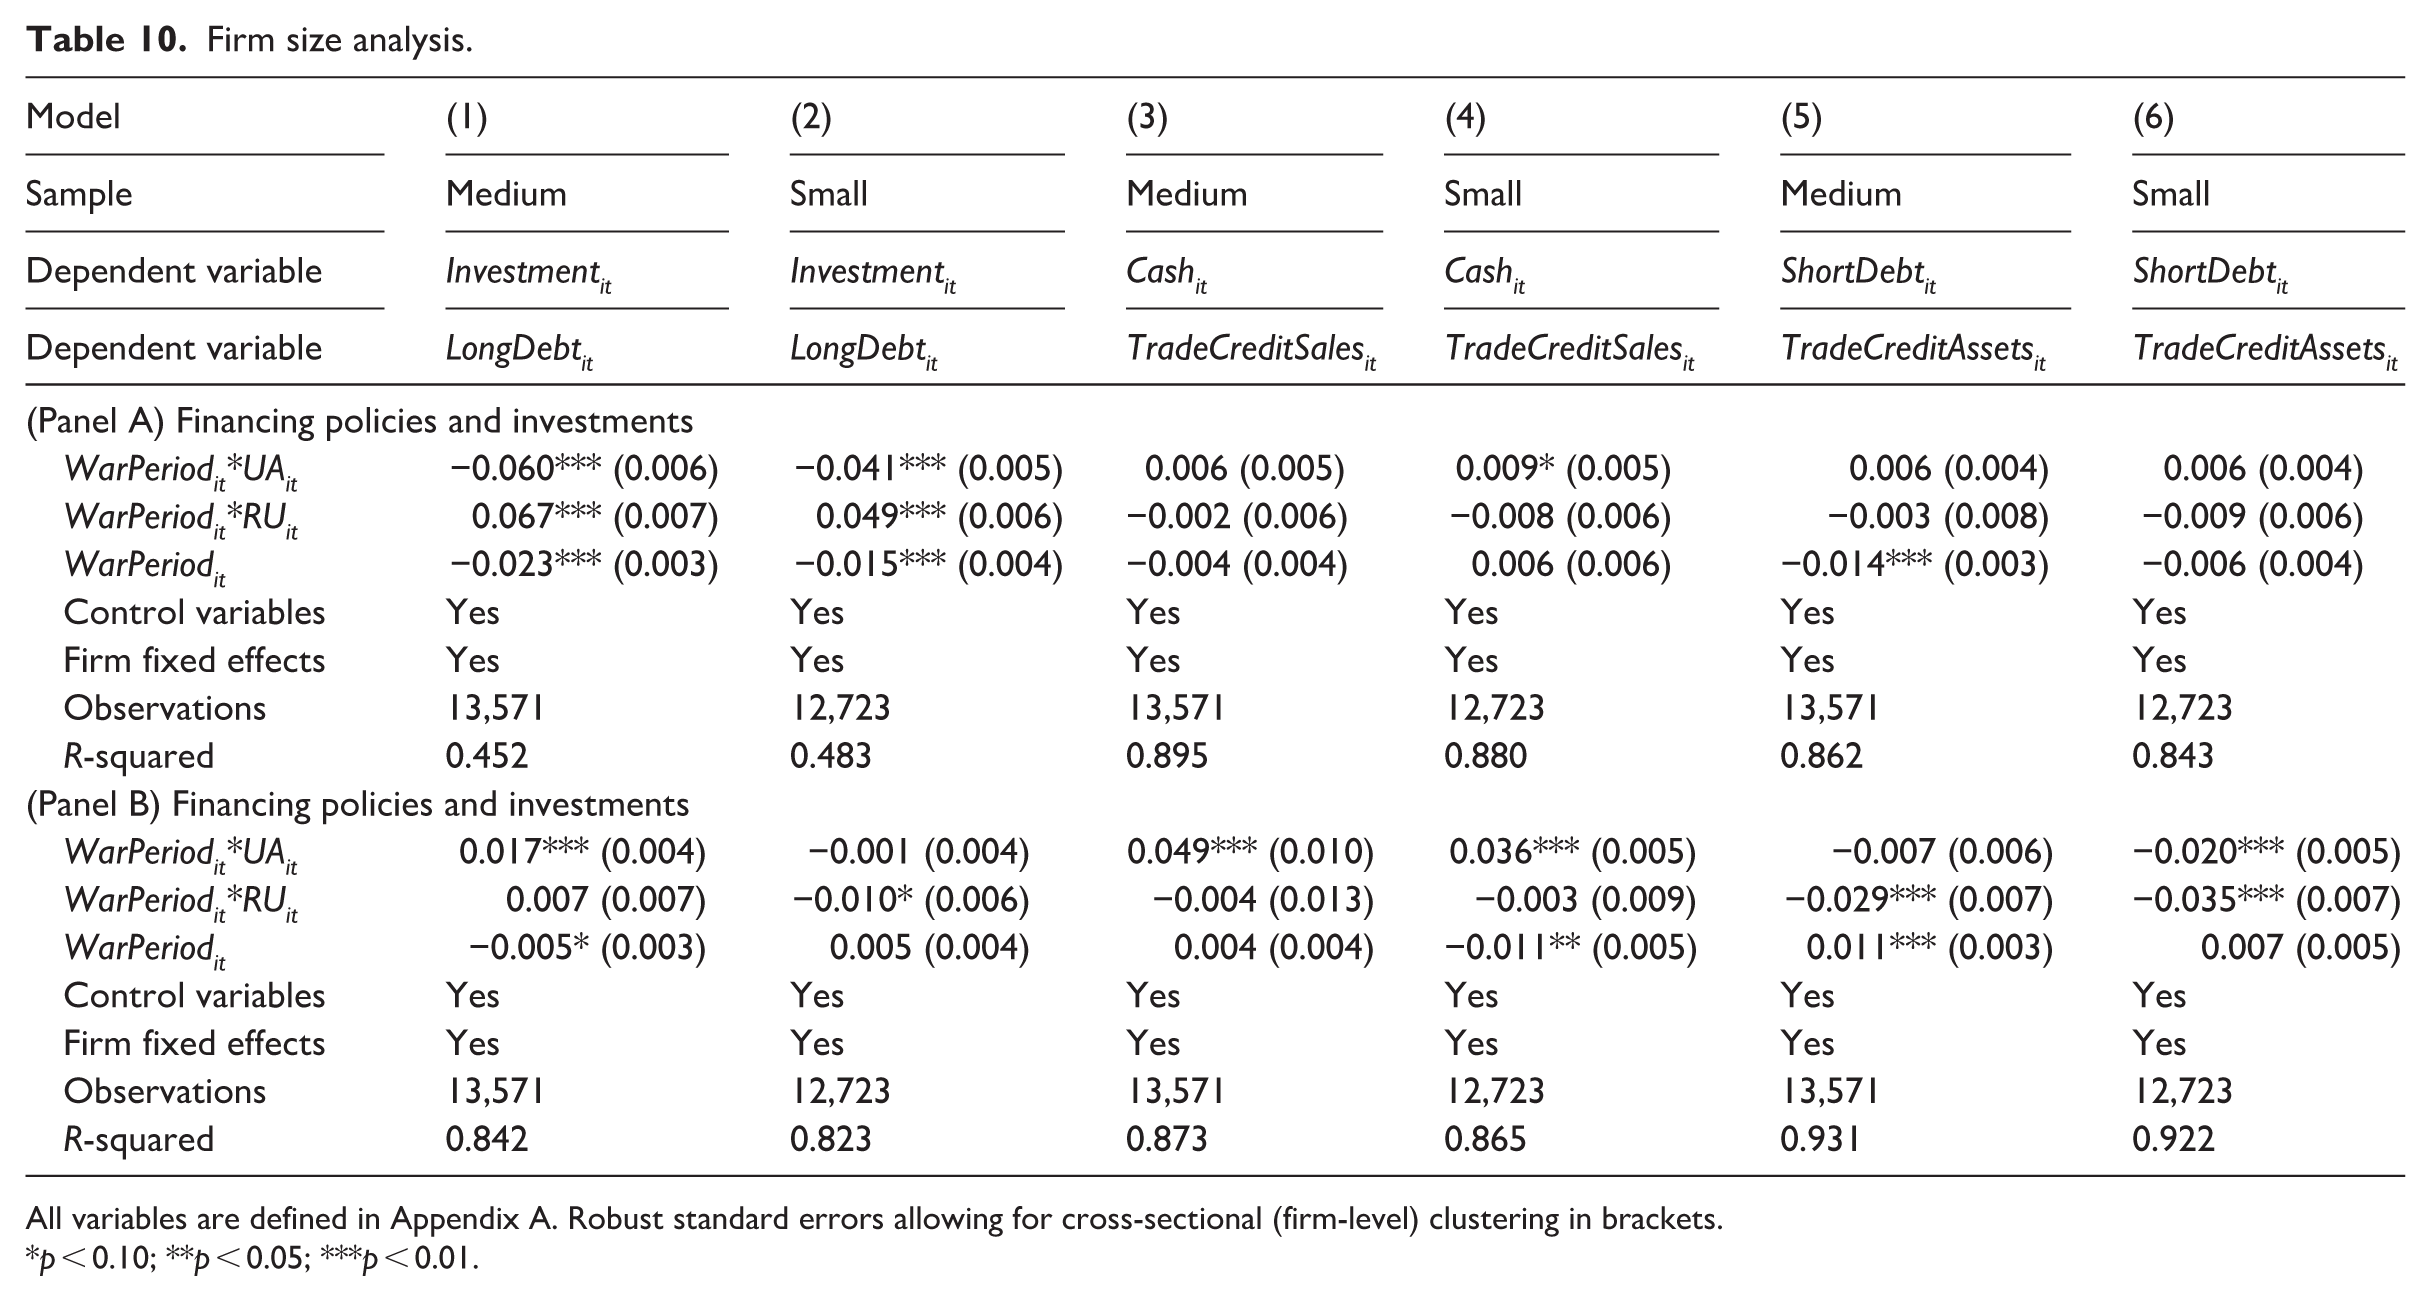
All variables are defined in Appendix A. Robust standard errors allowing for cross-sectional (firm-level) clustering in brackets.
p < 0.10; **p < 0.05; ***p < 0.01.
In Russia, cash and debt adjustments were limited for medium and small firms. The most consistent effect is a substantial decline in TradeCreditAssets across both groups, especially for small firms, consistent with suppliers tightening financing terms. Investment increased significantly for both medium and small firms, again larger for medium firms.
In Table 11, we split the sample into young and old firms based on the median age in 2021. For Ukrainian SMEs, Cash increased in both groups, consistent with precautionary motives. The effect is stronger for older firms, which appear to have had greater capacity to accumulate liquidity buffers. Younger firms significantly increased their reliance on ShortDebt, whereas older firms relied instead on long-term borrowing, highlighting the role of relationship capital and maturity access. TradeCreditAssets declined in both groups, with the larger reduction among older firms, consistent with tighter supplier credit conditions on existing obligations. At the same time, young firms expanded TradeCreditSales more strongly, reflecting a strategy to support revenues despite weaker liquidity positions. Both young and old firms significantly reduced Investment, with the decline more pronounced for older firms.
Firm age analysis.
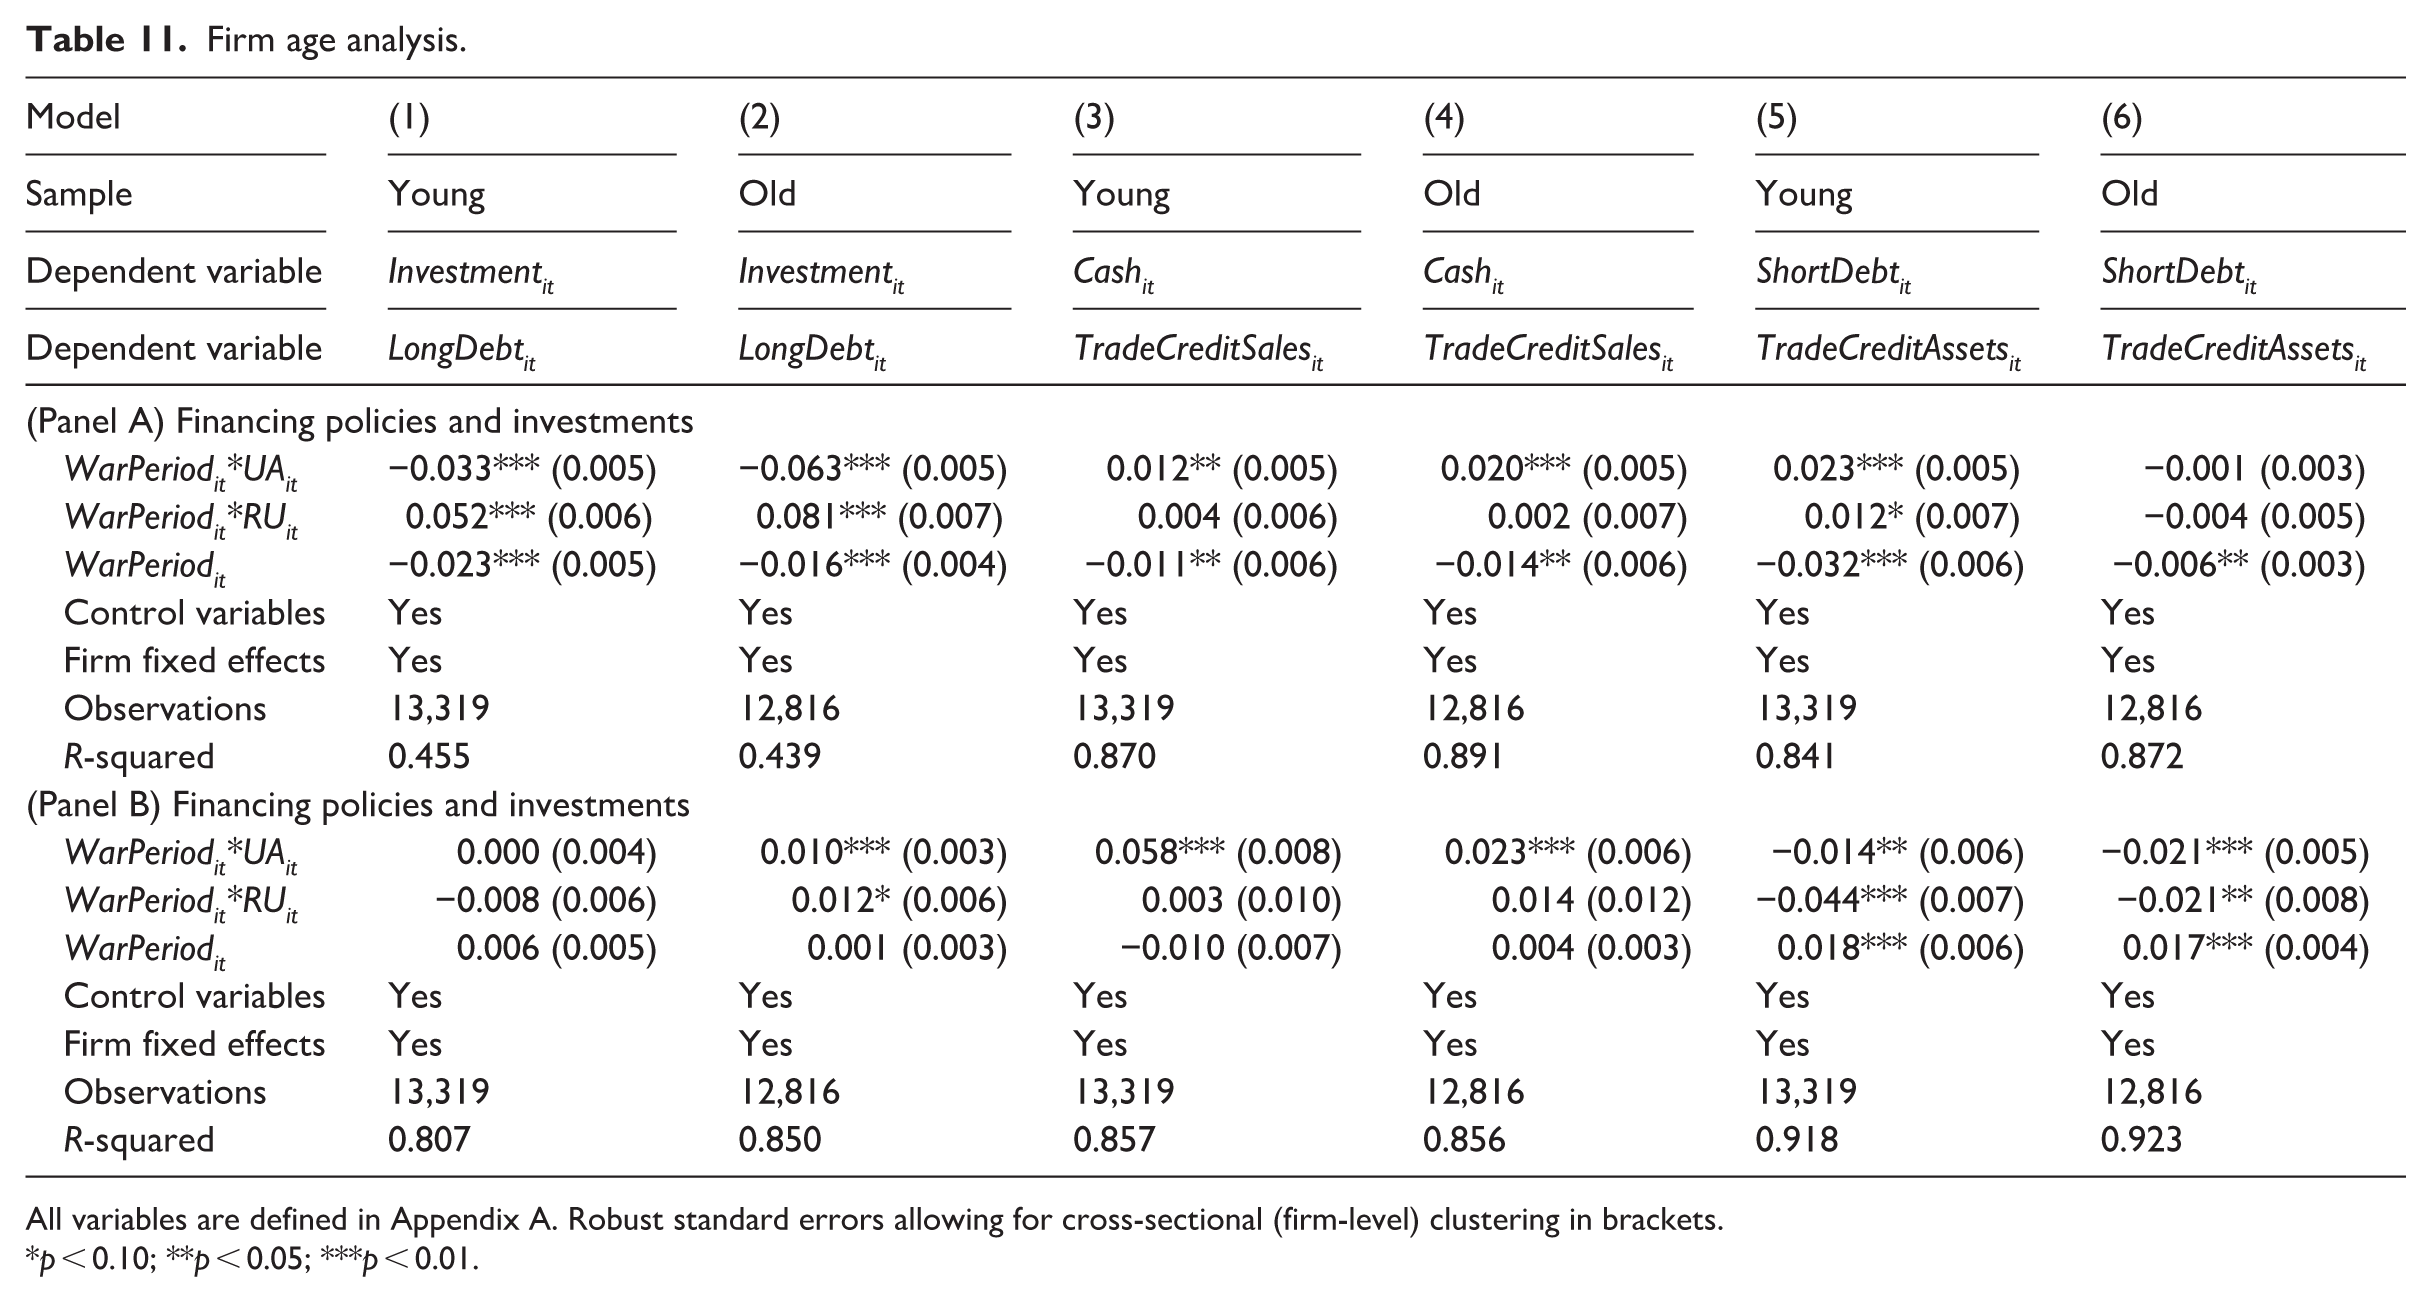
All variables are defined in Appendix A. Robust standard errors allowing for cross-sectional (firm-level) clustering in brackets.
p < 0.10; **p < 0.05; ***p < 0.01.
In Russia, younger firms relied more on short-term borrowing, while older firms increased LongDebt, suggesting that financing constraints may have manifested differently across age groups. Both young and old firms experienced a contraction in TradeCreditAssets, but the decline was sharper among younger firms, consistent with suppliers being less willing to extend credit to less established firms. Investment rose across both young and old firms, with the effect larger for older firms.
Discussion
Taken together, the evidence suggests that SME finance changed in two, sometimes conflicting, ways during the war period: precaution and substitution. In Ukraine, the sharp decline in investment is consistent with real options logic, heightened uncertainty may raise the value of waiting and slow irreversible commitments (Bloom et al., 2007; McDonald & Siegel, 1986). At the same time, firms strengthen liquidity buffers (Keynes, 1936), while shifting the composition of external finance: short-term debt declined overall, although the contraction was smaller than in the baseline group and long‑term debt marginally increased where lenders and collateral allowed. This pattern is consistent with pecking-order considerations, although the empirical design does not directly identify this mechanism (Almeida et al., 2004; Myers & Majluf, 1984). At the same time, the results are suggestive of bank intermediation remaining sufficiently functional in 2022 to allow some firms to refinance at longer maturities. The trade credit results are suggestive of an important asymmetry. Firms rely more heavily on trade credit scaled by sales, consistent with evidence that trade credit expands when access to bank finance tightens (Cunat, 2007; Petersen & Rajan, 1997). However, trade credit relative to total assets declines, indicating that suppliers reduce their overall exposure despite rising demand. This pattern suggests that, in wartime conditions, trade credit may not function as a uniformly elastic buffer. Cross-country differences are consistent with the importance of institutional and policy contexts. In Russia’s border regions, investment increases despite weaker revenues, deviating from real-options predictions, which may reflect policy support, directed credit, or other unobserved regional factors. At the same time, trade credit relative to assets declines, indicating continued risk aversion among suppliers.
Older and medium-sized firms show adjustment patterns characterised by stronger investment cutbacks, higher cash accumulation, and, in some cases, a shift toward longer-maturity debt. By contrast, younger and smaller firms rely more heavily on short-term borrowing and expand trade credit sales, while simultaneously experiencing the sharpest declines in supplier-provided trade credit. These differences are consistent with heterogeneous financial adjustments across firm types, with younger and smaller firms facing more constrained liquidity positions during the war period. The results suggest that financial adjustment during the war period was uneven across SMEs and varies systematically with firm age and size (Brown et al., 2021; Cowling et al., 2020).
These patterns have practical implications for managers and policymakers. For SME owner-managers in war-affected or high-risk neighbouring regions, the results point to the value of building precautionary liquidity before shocks materialise. They also highlight the importance of diversifying funding channels ex ante. Our heterogeneity results are consistent with firms with stronger banking relationships being better positioned to refinance and extend debt maturities. By contrast, SMEs that rely heavily on trade credit appear to have faced tighter supplier constraints when macro risk spiked, as shown by the rise in trade-credit-to-sales and fall in trade-credit-to-assets ratios. Concretely, managers should (i) formalise credit-line availability and covenants during calm periods, (ii) stagger debt maturities to reduce the accumulation of repayments in crisis years, and (iii) treat trade credit as a volatile complement rather than a core liquidity backstop in contingency planning. For policy makers, the asymmetry we document suggests targeted rather than uniform interventions. Younger and smaller SMEs face the tightest constraints; credit‑guarantee schemes and subsidised working‑capital facilities aimed at these firms can relieve the short‑term debt dependence that our results reveal. Finally, our estimates suggest that supplier finance may contract even when bank debt remains available, highlighting trade credit as a distinct constraint and suggesting that risk-sharing mechanisms for supplier credit may warrant consideration.
Limitations and future research
While this study provides novel evidence on SME investment and financing during war, some limitations also open avenues for future research. First, our analysis captures short-term effects of the 2022 Russia-Ukraine war, focusing on the first year of the full-scale invasion. Firm behaviour may evolve as the war persists, intensify, or change in nature. In the Russia-Ukraine conflict, hostilities and geopolitical tensions preceded the full-scale invasion and continued thereafter. Firms may therefore adjust differently across phases of escalation, prolonged uncertainty, and active warfare. As the conflict endures, reconstruction efforts unfold, and new policy interventions are introduced, SME financing and investment responses may change accordingly. Longitudinal studies that explicitly distinguish between pre-war conflict, escalation, and post-invasion periods could therefore shed light on the temporal dynamics of wartime finance, contributing to resilience theory by explaining how SMEs adapt, recover, or exit across different stages of crisis.
Second, although we employ a matched difference-in-differences design, unobserved heterogeneity cannot be fully ruled out, and the estimates should therefore be interpreted as conditional associations rather than definitive causal effects. War exposure is not randomly assigned, and firms closer to the conflict may differ systematically in unobservable ways, such as managerial risk preferences or access to informal networks. Future research might draw on behavioural finance or entrepreneurship perspectives to explore how risk perceptions and owner–manager decision-making shape financial strategies during war.
Third, our data cover only SMEs that continued reporting during the war. Firms that exited due to bankruptcy, destruction, or migration are under-represented, creating a risk of survivorship bias. Although our reweighting mitigates this concern, the most vulnerable firms may be missing. Future work should integrate exit data, surveys, or case studies to better capture the experiences of “invisible casualties” of war. Such approaches could extend institutional theory by examining how the breakdown or absence of formal institutions interacts with informal survival strategies.
Fourth, while the Russian invasion of Ukraine provides a powerful quasi-natural experiment, it has distinctive institutional and geopolitical features, such as international sanctions and targeted state support. Generalising the findings to other wars requires caution. Comparative studies across different conflict types (civil wars, insurgencies, post-conflict reconstructions) would deepen understanding of how institutional environments mediate wartime SME finance.
Finally, our analysis is limited to formal financial indicators such as cash, debt, and trade credit. We do not capture broader adaptive strategies such as reliance on family and diaspora networks, shadow banking, or government relief programmes. Future work should complement large-scale quantitative data with qualitative or survey evidence to uncover these hidden mechanisms. Doing so would contribute to more holistic crisis-finance frameworks that recognise both formal and informal financial practices in SME survival.
Conclusion
In this study, we examine the impact of the start of the Russia–Ukraine war on the investment and financing policies of SMEs in Ukraine and in Russian border regions. We use a matched difference-in-differences model and a comparison group of SMEs from Belgium and the United Kingdom. The sample covers firm-year observations from 2017 to 2022. Our findings indicate that Ukrainian SMEs experienced considerable disruptions during the war period, evident through significant decreases in sales growth, profitability, and investment. These firms accumulated higher cash reserves, a pattern consistent with precautionary liquidity management. Debt dynamics appear nuanced. Short-term debt declined overall during the war period, while long-term debt increased modestly, suggestive of partial maturity adjustment where access to credit remained intact. Regarding trade credit, we observe a significant increase in the ratio of trade payables to sales, consistent with the argument that despite declining revenues during the war period, SMEs had ongoing obligations from pre-war periods to fulfil. Concurrently, trade payables as a proportion of total assets declined, consistent with suppliers reducing overall exposure. Russian-border SMEs exhibited different patterns, with moderate declines in sales growth but no significant changes in profitability. Importantly, investment activities generally increased, which may indicate adaptive strategies, policy support, or other regional conditions that emerged within specific regional contexts. Crimea demonstrated a distinctive response, with SMEs significantly boosting their investment activities, likely reflecting unique market conditions influenced by geopolitical circumstances.
Footnotes
Appendix A
Descriptive statistics for control variables.
| Pre-WarPeriod | WarPeriod | ||||||
|---|---|---|---|---|---|---|---|
| Variables | Country | Mean | Median | Obs. | Mean | Median | Obs. |
| Profitabilityit | UA | 0.100 | 0.072 | 14,788 | 0.093 | 0.069 | 2382 |
| RU | 0.100 | 0.074 | 5885 | 0.125 | 0.099 | 1108 | |
| Control sample | 0.075 | 0.060 | 15,821 | 0.088 | 0.072 | 3603 | |
| SalesGrowthit | UA | 0.386 | 0.192 | 14,788 | −0.178 | −0.282 | 2382 |
| RU | 0.302 | 0.104 | 5885 | 0.232 | 0.152 | 1108 | |
| Control sample | 0.093 | 0.044 | 15,821 | 0.073 | 0.009 | 3603 | |
| Ageit | Ukraine | 1.205 | 1.204 | 14,788 | 1.255 | 1.255 | 2382 |
| Russia | 1.075 | 1.114 | 5885 | 1.165 | 1.176 | 1108 | |
| Control sample | 1.343 | 1.380 | 15,821 | 1.375 | 1.398 | 3603 | |
| Firmsizeit | Ukraine | 3.729 | 3.678 | 14,788 | 3.771 | 3.724 | 2382 |
| Russia | 3.743 | 3.696 | 5885 | 3.829 | 3.782 | 1108 | |
| Control sample | 4.052 | 4.061 | 15,821 | 4.072 | 4.088 | 3603 | |
| Leverageit | Ukraine | 0.114 | 0.017 | 14,788 | 0.106 | 0.030 | 2382 |
| Russia | 0.218 | 0.135 | 5885 | 0.185 | 0.107 | 1108 | |
| Control sample | 0.188 | 0.121 | 15,821 | 0.169 | 0.101 | 3603 | |
| Tangibilityit | Ukraine | 0.207 | 0.128 | 14,788 | 0.189 | 0.114 | 2382 |
| Russia | 0.201 | 0.115 | 5885 | 0.212 | 0.148 | 1108 | |
| Control sample | 0.269 | 0.196 | 15,821 | 0.255 | 0.184 | 3603 | |
| Working capitalit | Ukraine | 0.250 | 0.275 | 14,788 | 0.286 | 0.319 | 2382 |
| Russia | 0.245 | 0.258 | 5885 | 0.278 | 0.311 | 1108 | |
| Control sample | 0.195 | 0.171 | 15,821 | 0.203 | 0.178 | 3603 | |
| GDPGrowthit | Ukraine | 0.018 | 0.022 | 14,788 | −0.021 | −0.021 | 2382 |
| Russia | 0.016 | 0.032 | 5885 | −0.288 | −0.288 | 1108 | |
| Control sample | 0.011 | 0.016 | 15,821 | 0.047 | 0.048 | 3603 | |
For the description of firm-level variables, see Table A1. Pre-war represent the period from 2017 till 2021 and WarPeriod is 2022.
Acknowledgements
The authors confirm that no generative artificial intelligence tools (such as large language models or automated editing systems) were used in the preparation, writing, or editing of this manuscript. All text, analysis, and interpretations were produced solely by the authors.
Funding
The authors received no financial support for the research, authorship, and/or publication of this article.
Declaration of conflicting interests
The authors declared no potential conflicts of interest with respect to the research, authorship, and/or publication of this article.