
Abstract
This paper reports a bibliometric study of the development of computer science research in the People’s Republic of China in the 21st century, using data from the Web of Science, Journal Citation Reports and CORE databases. Focusing on the areas of data mining, operating systems and web design, it is shown that whilst the productivity of Chinese research has risen dramatically over the period under review, its impact is still low when compared with established scientific nations such as the USA, the UK and Japan. The publication and citation data for China are compared with corresponding data for the other three BRIC nations (Brazil, Russian and India). It is shown that China dominates the BRIC nations in terms of both publications and citations, but that Indian publications often have a greater individual impact.
Keywords
A marked disparity between the quantity and the quality of Chinese research needs to be addressed as a matter of urgency.
Introduction
Information and communications technology (ICT) is arguably the most important technology for supporting the economic development of a nation and thus for enhancing its population’s quality of life. It is hence hardly surprising that the People’s Republic of China (hereafter China), as the world’s largest developing country, has made very extensive efforts to develop its R&D capabilities in ICT. Most notably, the Ministry of Science and Technology identified this as one of six technologies for funding in the National High Technology Programme (the other areas were biotechnology and agriculture, materials, manufacturing and automation, energy, and resources and the environment (Ministry of Science and Technology of the People’s Republic of China, n.d.). The programme (which is also called the 863 programme) started in 1986 with the aim of upgrading national industrial competitiveness so that China could compete successfully with established players such as the USA, Japan and the European Union. ICT receives the largest fraction of the extensive government funding that has been made available to the programme (Springut et al. 2011), and a range of statistics attest to the success of this initiative: for example, China is now the world’s largest mobile communications market and the largest producer of ICT products (Simon 2011); and it has 75 of the world’s 500 most powerful supercomputers, including the second and the fourth fastest (Top500 Computer Sites 2011).
Computer science is one of the key basic sciences underlying ICT developments (other important areas include electronics, informatics and telecommunications), and Guan and Ma (2004) have noted that China has shown in this respect a “low level of beginning and high speed of developing” in computer science. The “beginning” has been described by Jiuchun and Baichun (2007), who state that computer science originated in the People's Republic of China with the founding of the Chinese Academy of Sciences' Institute of Computing Technology in 1956. Since then it has grown, first steadily (Maier 1988), and then much more rapidly since the liberalization of the economy. In this paper, we discuss the growth in academic computer science research in China using the methods of bibliometrics (Bar-Ilan 2008a; Borgman and Furner 2002; Nicolaisen 2007; Wilson 1999).
Previous bibliometric studies have demonstrated the contributions that China is making to research knowledge, not just in general (Royal Society 2011; Zhou and Leydesdorf 2006; Zhou et al. 2009) but also in particular scientific disciplines such as bioinformatics (Guan and Gao 2008), digital libraries (Zhao and Zhang 2011), chemistry (Li and Willett 2010), liquid crystals (Sangam et al. 2010), nanotechnology (Tang and Shapira 2010), oncology (Yu et al. 2011) and superconductivity (Zhu and Willett 2011) inter alia. However, we have been able to identify only five previous reports focusing specifically on the development of Chinese computer science. In a 2004 study, Guan and Ma (2004) demonstrated a marked growth in publications during the period 1993 to 2002, although they noted that these publications were principally in domestic journals and conference proceedings, with the result that many of their findings had only a low level of international visibility. In the following year, Kumar and Garg (2005) reported a more extended comparison of Indian and Chinese computer science publications, covering the period 1971 to 2000, and again noted the Chinese preference for publication in domestic journals. More recently, He and Guan (2008) analyzed Chinese papers published in the period 1997 to 2005 in the conference proceedings series Lecture Notes in Computer Science. They found that the proportion of Chinese contributions had increased rapidly over this period, but noted that these contributions were not heavily cited and that the increase in conference publication had not been mirrored by a corresponding increase in publications in top computer science journals. A similar focus on quantity was noted by Ma et al. (2008) when comparing the competitiveness of world universities in computer science (and also by Calvert and Zengzhi (2001) when reviewing Chinese journals in information and library science, and by Li et al. (2012) when comparing the competitiveness of universities in mainland China, Hong Kong and Taiwan across the full range of disciplines). Finally, Li and Ke (2009) discussed research on data mining published in 64 Chinese social science journals in the period 1998–2007.
China is one of the four nations – Brazil, Russia, India and China – that together comprise the BRIC group of large nations and that have rapidly developing economies and levels of research activity (Kumar and Asheulova 2011). Directories of ICT activity in the BRIC group have been carried out by Simon (2011) for the European Commission and by Sathya (2010) for the European Union, and there have also been several articles considering specific members of the group in more detail. Wainer et al. (2009) discussed Brazilian publications in computer science for the period 2001–2005, focusing principally on journal articles and on those conferences included in the Lecture Notes in Computer Science series, and compared their results with those for several other Latin countries and the other BRIC countries. In their comparison, Wainer et al. noted that Russia had a large fraction of its research in low-IF journals and that it had a very different subject profile (focusing strongly on cybernetics and theoretical computer science) when compared with the other BRIC countries during the period 2001–2005. A subsequent paper by this research group reported on the regional and gender characteristics of Brazilian computer scientists (Arruda et al. 2009). There have been several bibliometric studies of Indian computer science research. Kumar and Garg (2005) compared Indian and Chinese computer science research for the period 1971–2000. India was notably more productive during this period, although China was noted as catching up rapidly, but there was no significant difference in the impacts of the nations’ research. An analogous comparison of Indian and Chinese computer science research by Guan and Ma (2004) considered the period 1993–2002, i.e. principally the last part of the period studied by Kumar and Garg, and found that Indian research still had a greater international impact despite a much lower level of overall productivity. Gupta et al. (2010) provided extensive productivity data (using the SciVerse Scopus database) for Indian computer science research in a range of areas. In a subsequent paper Gupta et al. (2011) compared these results with those for China and Brazil (and also for South Korea and Taiwan), stating that India was far behind the others in terms of publications, but provided no corresponding comparison of the impact of the various nations’ research.
This paper reports an analysis of Chinese computer science publications in the first 10 years of the 21st century, hence providing a detailed update of the earlier studies of Guan and Ma (2004) and of Kumar and Garg (2005) described above. Moreover, we extend their work in two ways. First, rather than considering computer science at the disciplinary, macro level, we consider China’s contribution at the micro level by focusing on three specific aspects of the discipline, viz. data mining (as an example of a topic that has come very much to the fore over the last 10 years with the massive rise that has taken place in the scope and the scale of modern information systems); operating systems (as an example of a topic that has been at the core of computer science ever since it emerged as an academic discipline in the second half of the last century); and web design (as an example of an application that can be expected to grow still further in importance with the increasingly rapid digitization of many aspects of modern society). Second, we place our findings in context by comparing the Chinese research performance both with the other members of the BRIC group, and with three established, productive nations for computer science research, i.e. the USA, the UK and Japan.
Methods
There are now three major systems available for carrying out bibliometric analyses (Bar-Ilan 2008b; Jacso 2005, 2008): Web of Science, SciVerse Scopus and Google Scholar.
The Web of Science system from Thomson-Reuters is the longest established of these, and comprises a total of five citation databases: Science Citation Index Expanded, Social Science Citation Index, Arts and Humanities Citation Index, Conference Proceedings Citation Index – Science, and Conference Proceedings Citation Index–Social Science & Humanities. In addition to the extensive, carefully curated publication and citation data, this subscription-based service provides analysis tools that enable sophisticated data mining to be carried out on search outputs, thus permitting the detailed bibliometric analyses reported below. The SciVerse Scopus system from Elsevier Inc. is similar in scope to the Web of Science, and like it is available to users only on a subscription basis. Of these two, Web of Science (hereafter WoS) was used for the work reported here, principally because of its better coverage of the conference proceedings literature. Journal articles provide the principal communication medium for most scientific disciplines but this is not the case for computer science, where conference proceedings are of greater importance (Freyne et al. 2010; Rahm 2008; Sanderson 2008). The two conference proceedings databases in WoS mean that its coverage of conferences is superior to that of Scopus; indeed, the latter’s poor coverage has resulted in criticism of its use for the evaluation of computer science research (Bailes 2011).
The most widely used citation system now is probably Google Scholar, a free service that generates citation data automatically from publications available via the Google search system. Early versions of Google Scholar were notably error-rich and laborious to use (Meho and Yang 2007); although this is now much improved (Chen 2010), it still lacks the data mining tools available in WoS, thus precluding its use for detailed studies of the sort reported here. Similar comments apply to data that can be harvested from the CiteSeer website, as described very recently by Fiala (2012).
In addition to its data mining tools (the Analyze Results and Create Citation Report functions in the system), WoS provides a range of filters that can be applied to search outputs, these including the specification of a broad subject area and of both the year and the country of publication. Searches were hence carried out for the strings “data* mining”, “operating system*” and “web design” with the retrieved records satisfying all of the following three search criteria: the string had to occur in either the Title or the Topic fields of a record (the latter including the abstract and both author and database keywords); the record had been assigned one of the seven Computer Science subject categories in the WoS Categories field; and the record had at least one author with an address in the People’s Republic of China (for which the searches included both Hong Kong and mainland China). All of the searches reported here were carried out in late 2011 and early 2012. It should be noted that a search string such as “data* mining” cannot possibly provide full recall of all of the articles in the WoS database that pertain to this topic (since they may be indexed under a multitude of words or phrases), but it suffices for a longitudinal comparative study such as this.
The WoS database was used to obtain all of the publication and citation counts reported below, and it was also the source of the h-index scores (Hirsch 2005), with two other databases being used to provide external views of the quality of the journals and conference proceedings in which Chinese computer science research is published. The first database was Journal Citation Reports (hereafter JCR), which is also produced by Thomson-Reuters and which contains journal impact factor (IF) data for most of the journals covered by WoS. The IF measures how frequently an ‘average’ article from a specific journal has been cited, so that a journal’s IF is calculated by dividing the total number of citations to the journal in a specific year by the number of articles in that journal published in a previous timeframe. For example, if X is the number of citations in 2010 to the Y articles published in a journal 2008–2009, then the 2-year IF (which is that used here and which is available in the JCR database back to 2004) is X/Y. The application of IFs to the evaluation of research performance has been questioned, but they continue to be widely used for this purpose (Archambault and Larivière 2009; Cameron 2005; Garfield 2006; Pendlebury 2009). The second database was the CORE listing of computer science conferences, where CORE is the Computing Research and Education Association of Australasia, an association of university departments of computer science in Australia and New Zealand. Since 2006, CORE has graded the world’s major conferences in computer science in order of importance. The 2010 rankings (CORE 2010) used a three-point scale (A, B or C) to grade a total of 1501 conferences, of which 235 were graded A, 388 graded B and 878 graded C.
Results
The results of the study are presented in Tables 1–10.
Numbers of publications on computer science during 2000–2009
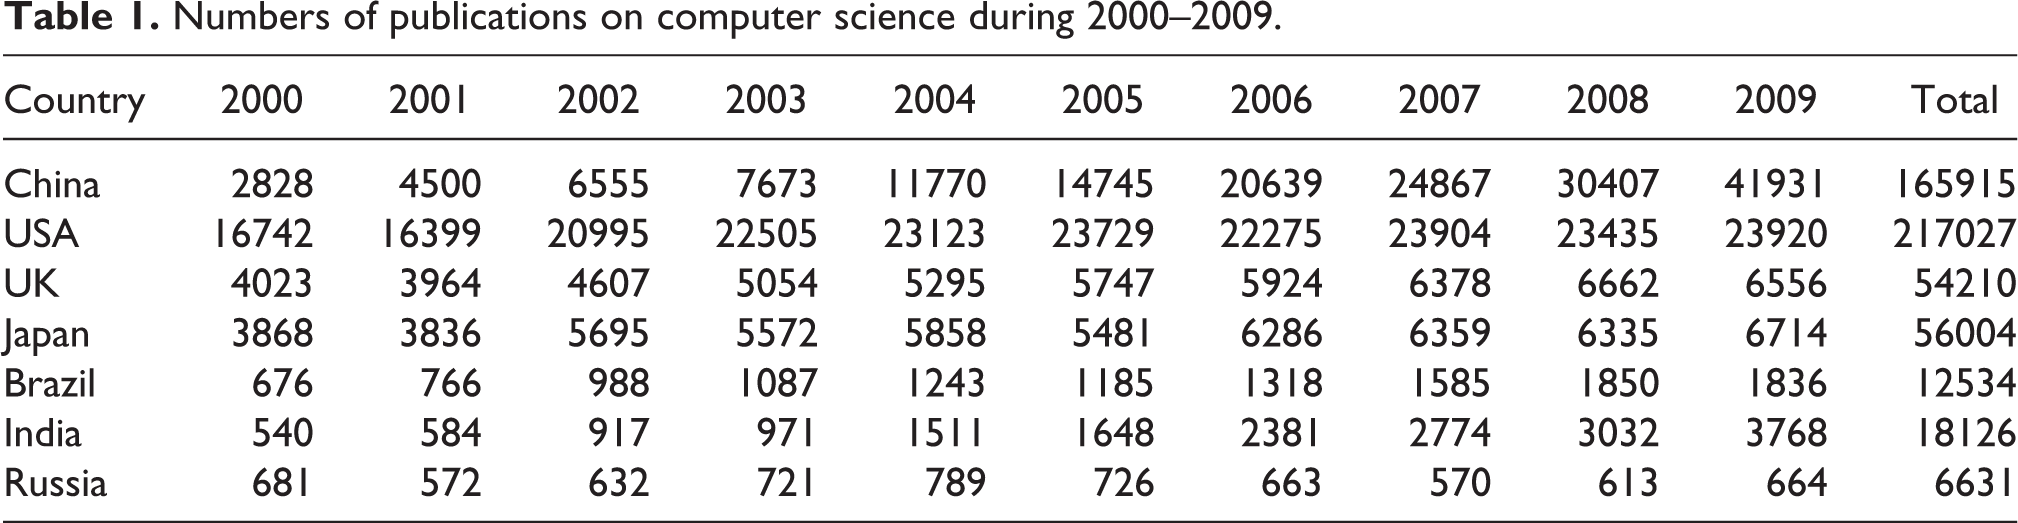
Table 1 lists the total numbers of publications in each of the 10 years for 2000–2009 for the seven countries (China, USA, UK, Japan, Brazil, India and Russia) where we include all types of publications, i.e. journal articles, conference papers, reviews, editorials etc. Table 2 provides the corresponding data for publications on data mining, with Table 3 listing the numbers of citations to the publications detailed in Table 2. Table 4 lists the mean number of citations per publication, not just for data mining but also for the operating system and web design searches. Table 5 lists the h-index values for publications on data mining, while Table 6 lists the percentages (rounded to the nearest integer) of journal articles (the columns headed A) and conference proceedings papers (the columns headed B) for the publications in all three subject areas.
Numbers of publications on data mining during 2000–2009
Numbers of citations to publications on data mining during 2000–2009
Mean number of citations per publication on data mining, operating systems and web design
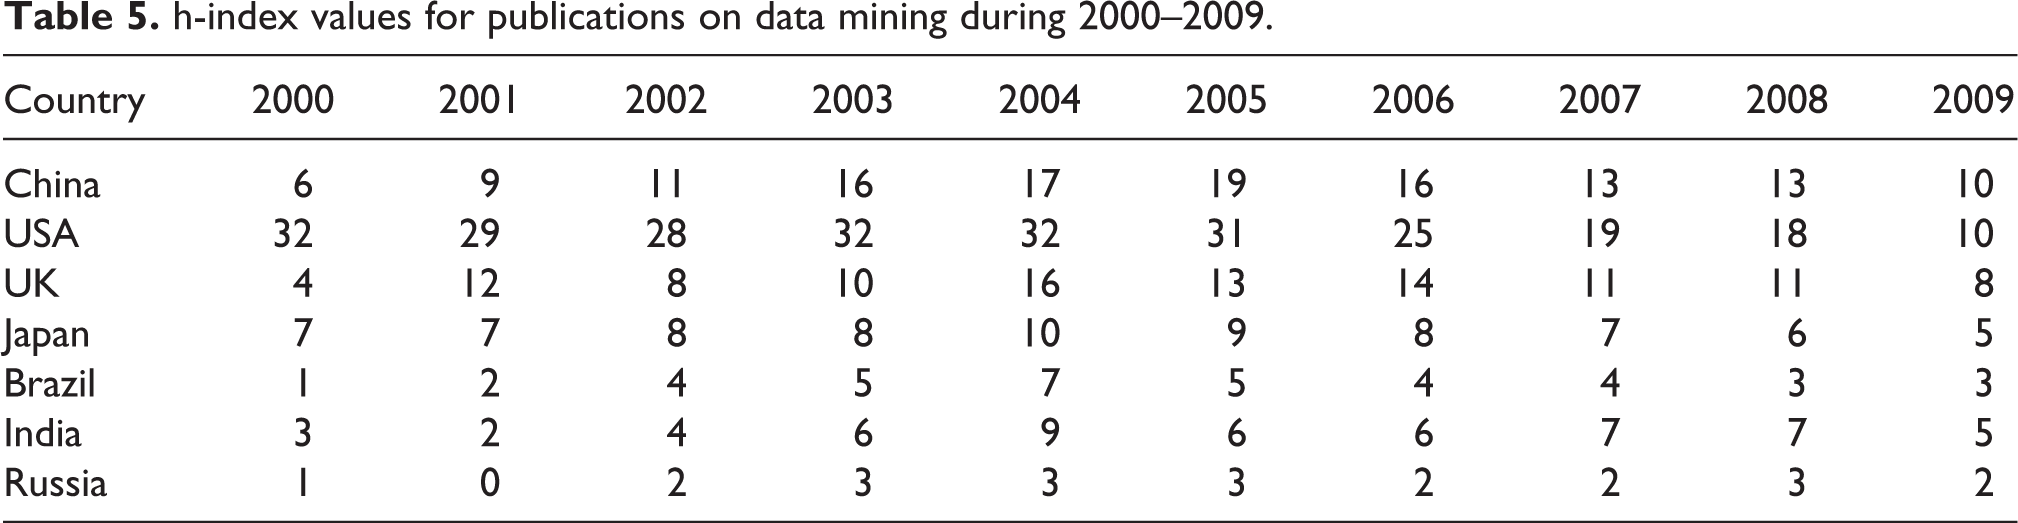
h-index values for publications on data mining during 2000–2009
Percentages (rounded to the nearest integer) of journal articles (A) and conference proceedings papers (B) for publications during 2000–2009. The very small remaining percentages in some cases include document types such as editorials, letters, corrections etc.
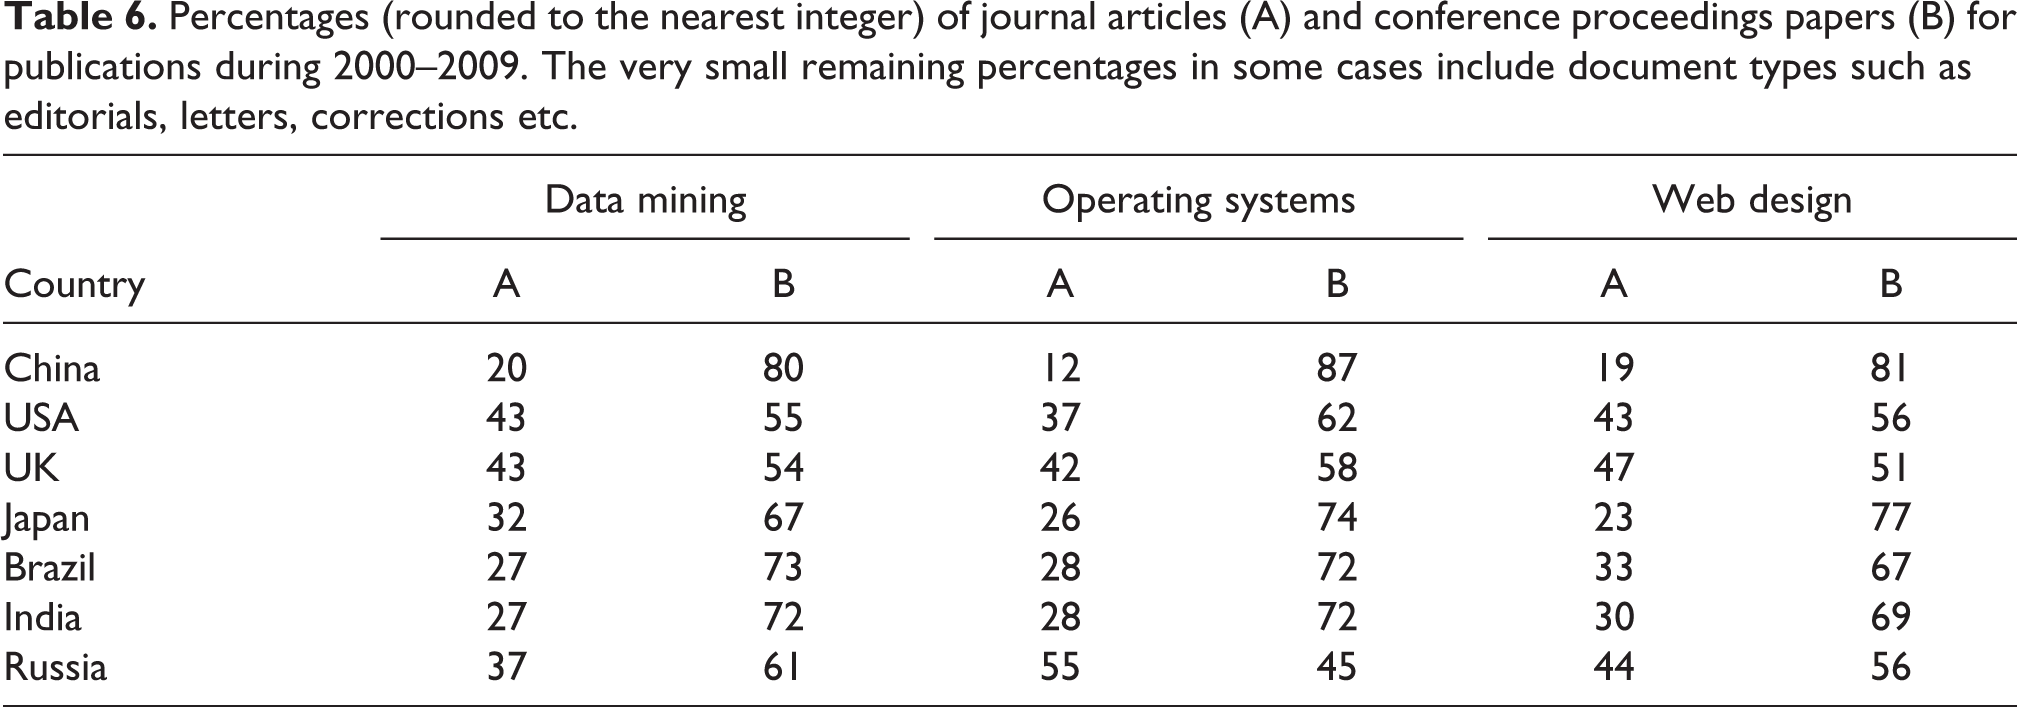
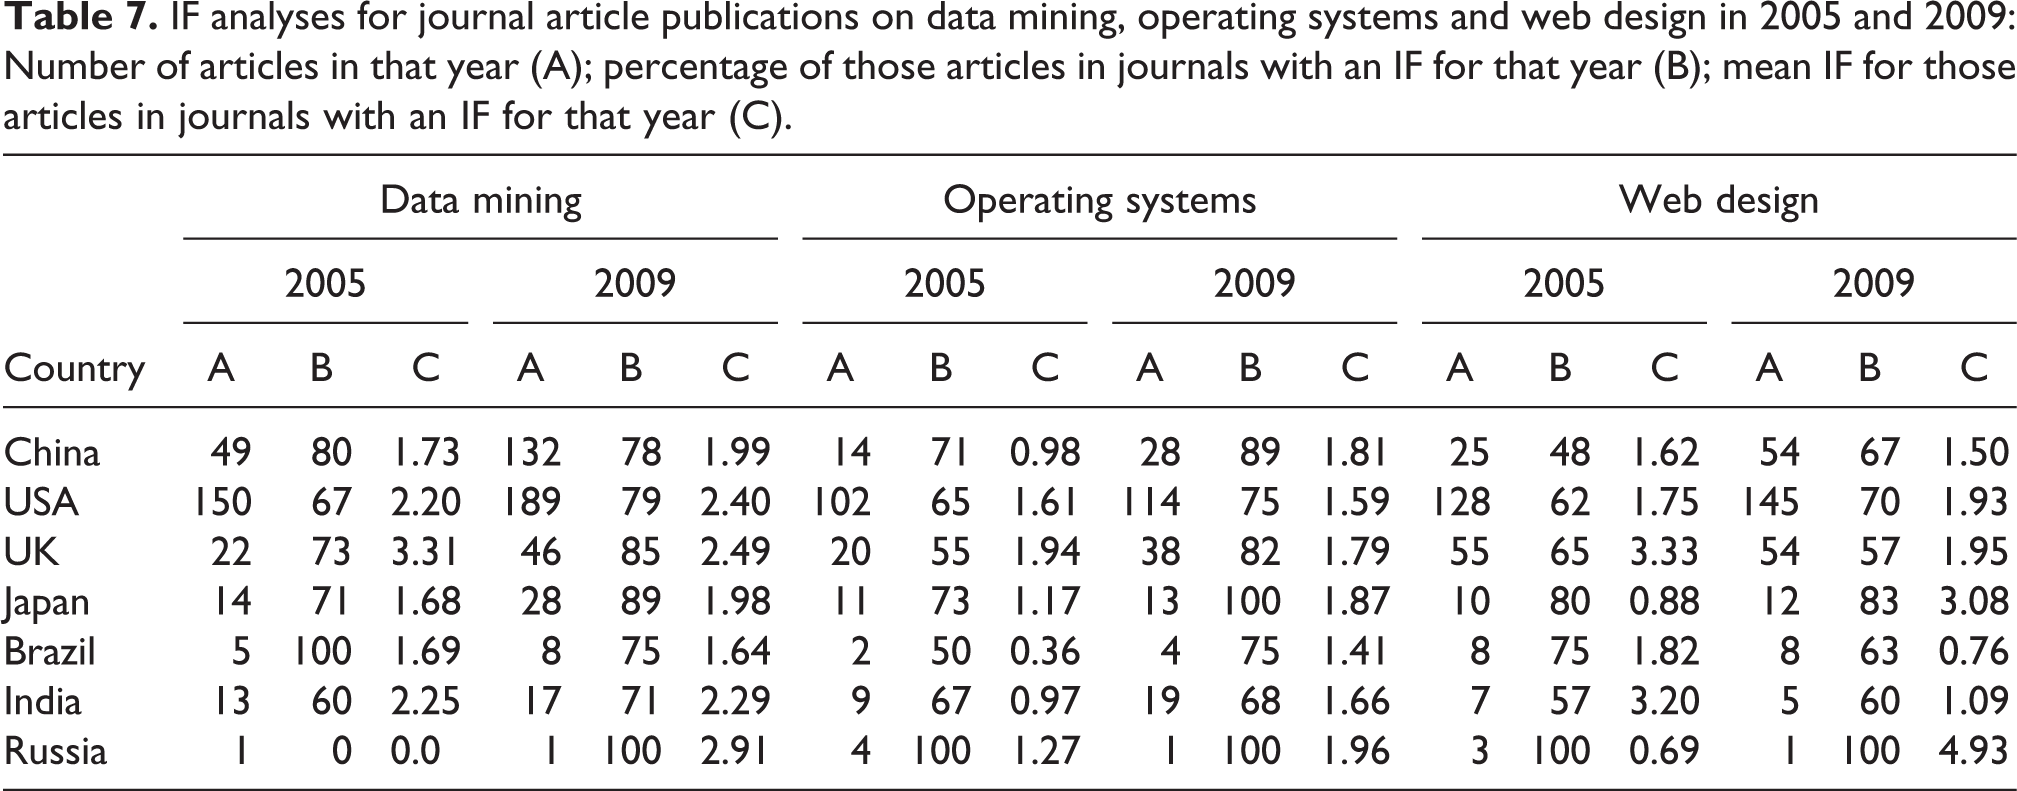
Table 7 summarizes the IF analyses. The JCR database provides IFs since 2004, and we have chosen to include here the results for publications in 2005 and 2009 to illustrate the changes, if any, that have taken place in publication practices during this time period. Each of the three subject areas has three columns in Table 7: the number of articles in that year (column A); the percentage of those articles in journals with an IF for that year (column B); and the mean IF for those articles in journals with an IF for that year (column C). The mean IF values here are calculated as:
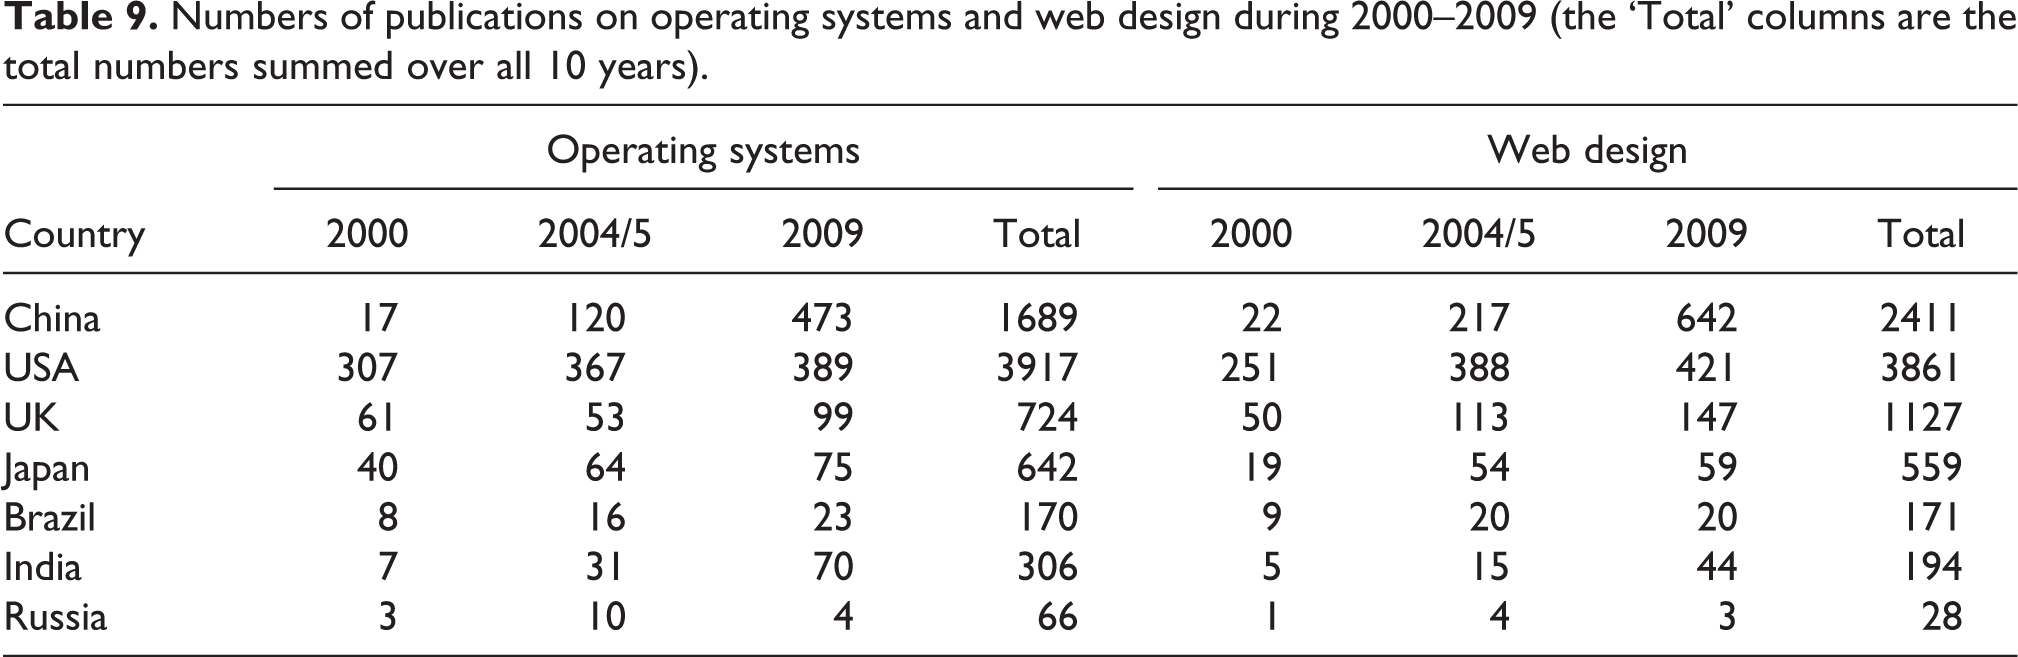
where ni is the number of articles in the current year in a journal i that has an impact factor IFi for that year, and where the summation is over all of the journals for which an IF is available. Table 8 then lists the CORE grades (A, B, C or U (for ungraded)) of the conference proceeding publications in the three subject areas. Finally, Tables 9 and 10 list the numbers of publications and citations, respectively, for operating systems and web design in 2000, 2004–2005 and 2009 (the ‘Total’ columns in each case are the total numbers summed over all of the ten years 2000–2009).
IF analyses for journal article publications on data mining, operating systems and web design in 2005 and 2009: Number of articles in that year (A); percentage of those articles in journals with an IF for that year (B); mean IF for those articles in journals with an IF for that year (C)
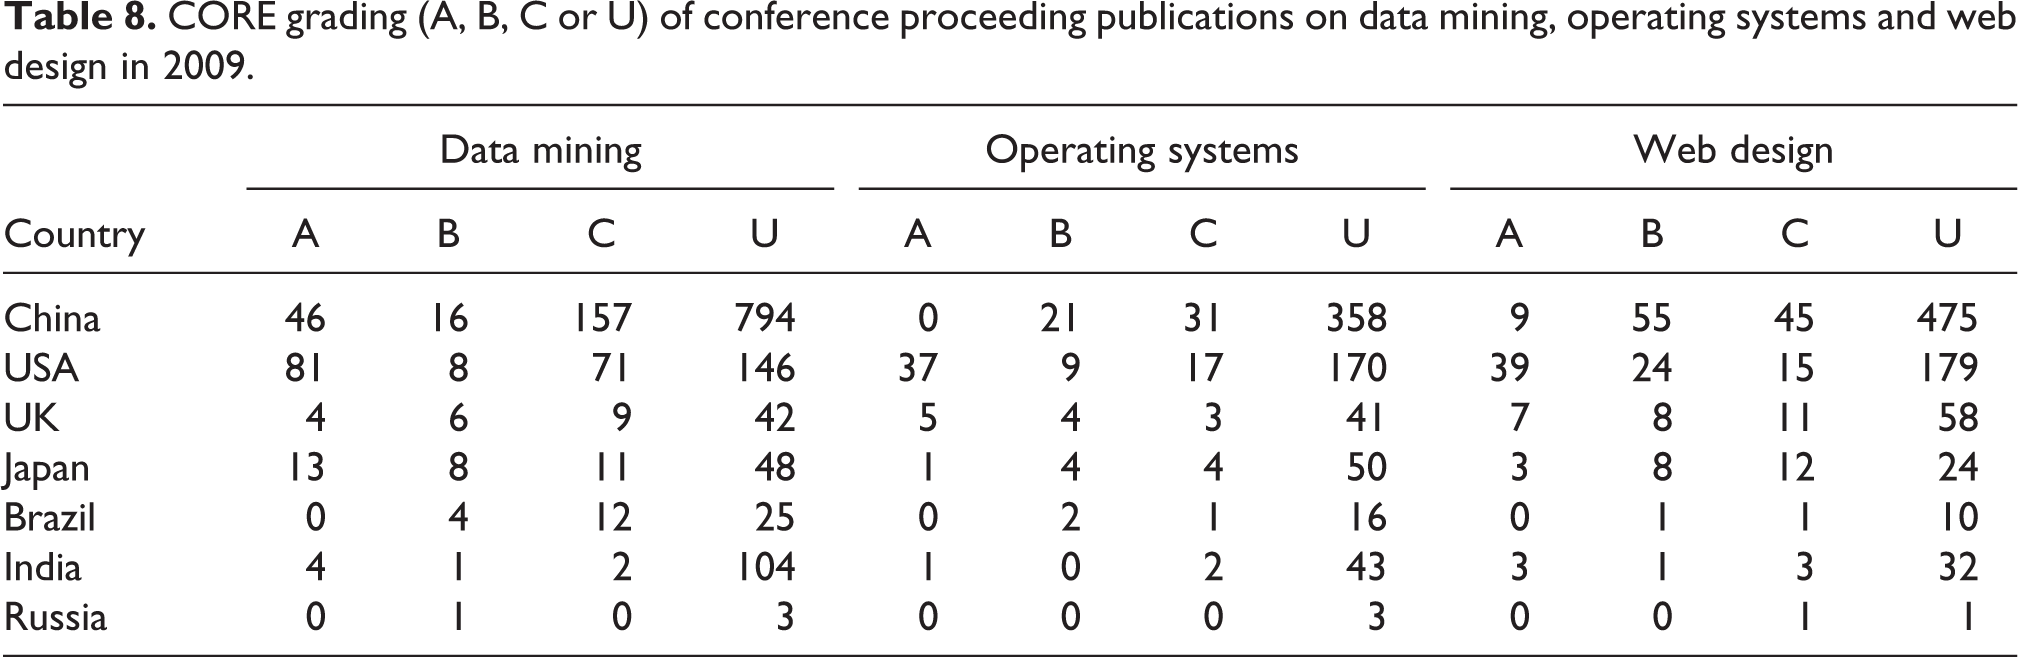
CORE grading (A, B, C or U) of conference proceeding publications on data mining, operating systems and web design in 2009
Numbers of publications on operating systems and web design during 2000–2009 (the ‘Total’ columns are the total numbers summed over all 10 years)
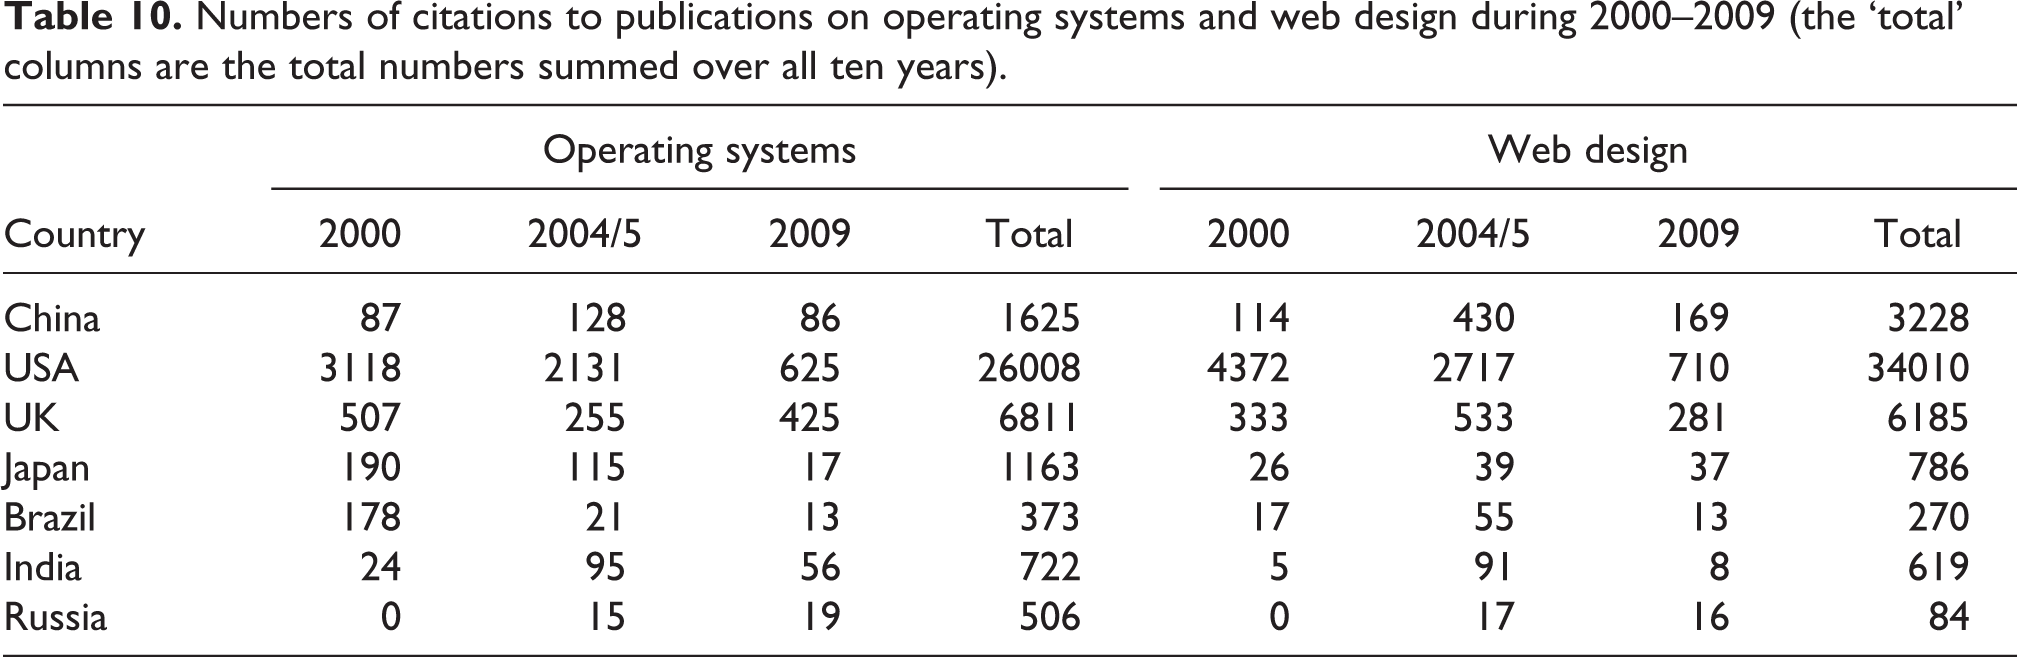
Numbers of citations to publications on operating systems and web design during 2000–2009 (the ‘total’ columns are the total numbers summed over all ten years)
Discussion
The publication data for 2000–2009 in Table 1 are summarized in Figure 1, which shows the publications in 2000, 2009, and the mean of 2004 and 2005, i.e. the mid-point for the period. From a very low starting point, it will be seen that Chinese productivity has increased dramatically, year on year, with over 14 times as many publications in 2009 as in 2000. This rate of growth is far larger than for any of the other countries in the table, with India’s almost seven-fold increase from 2000 to 2009 showing the second largest rate of growth.
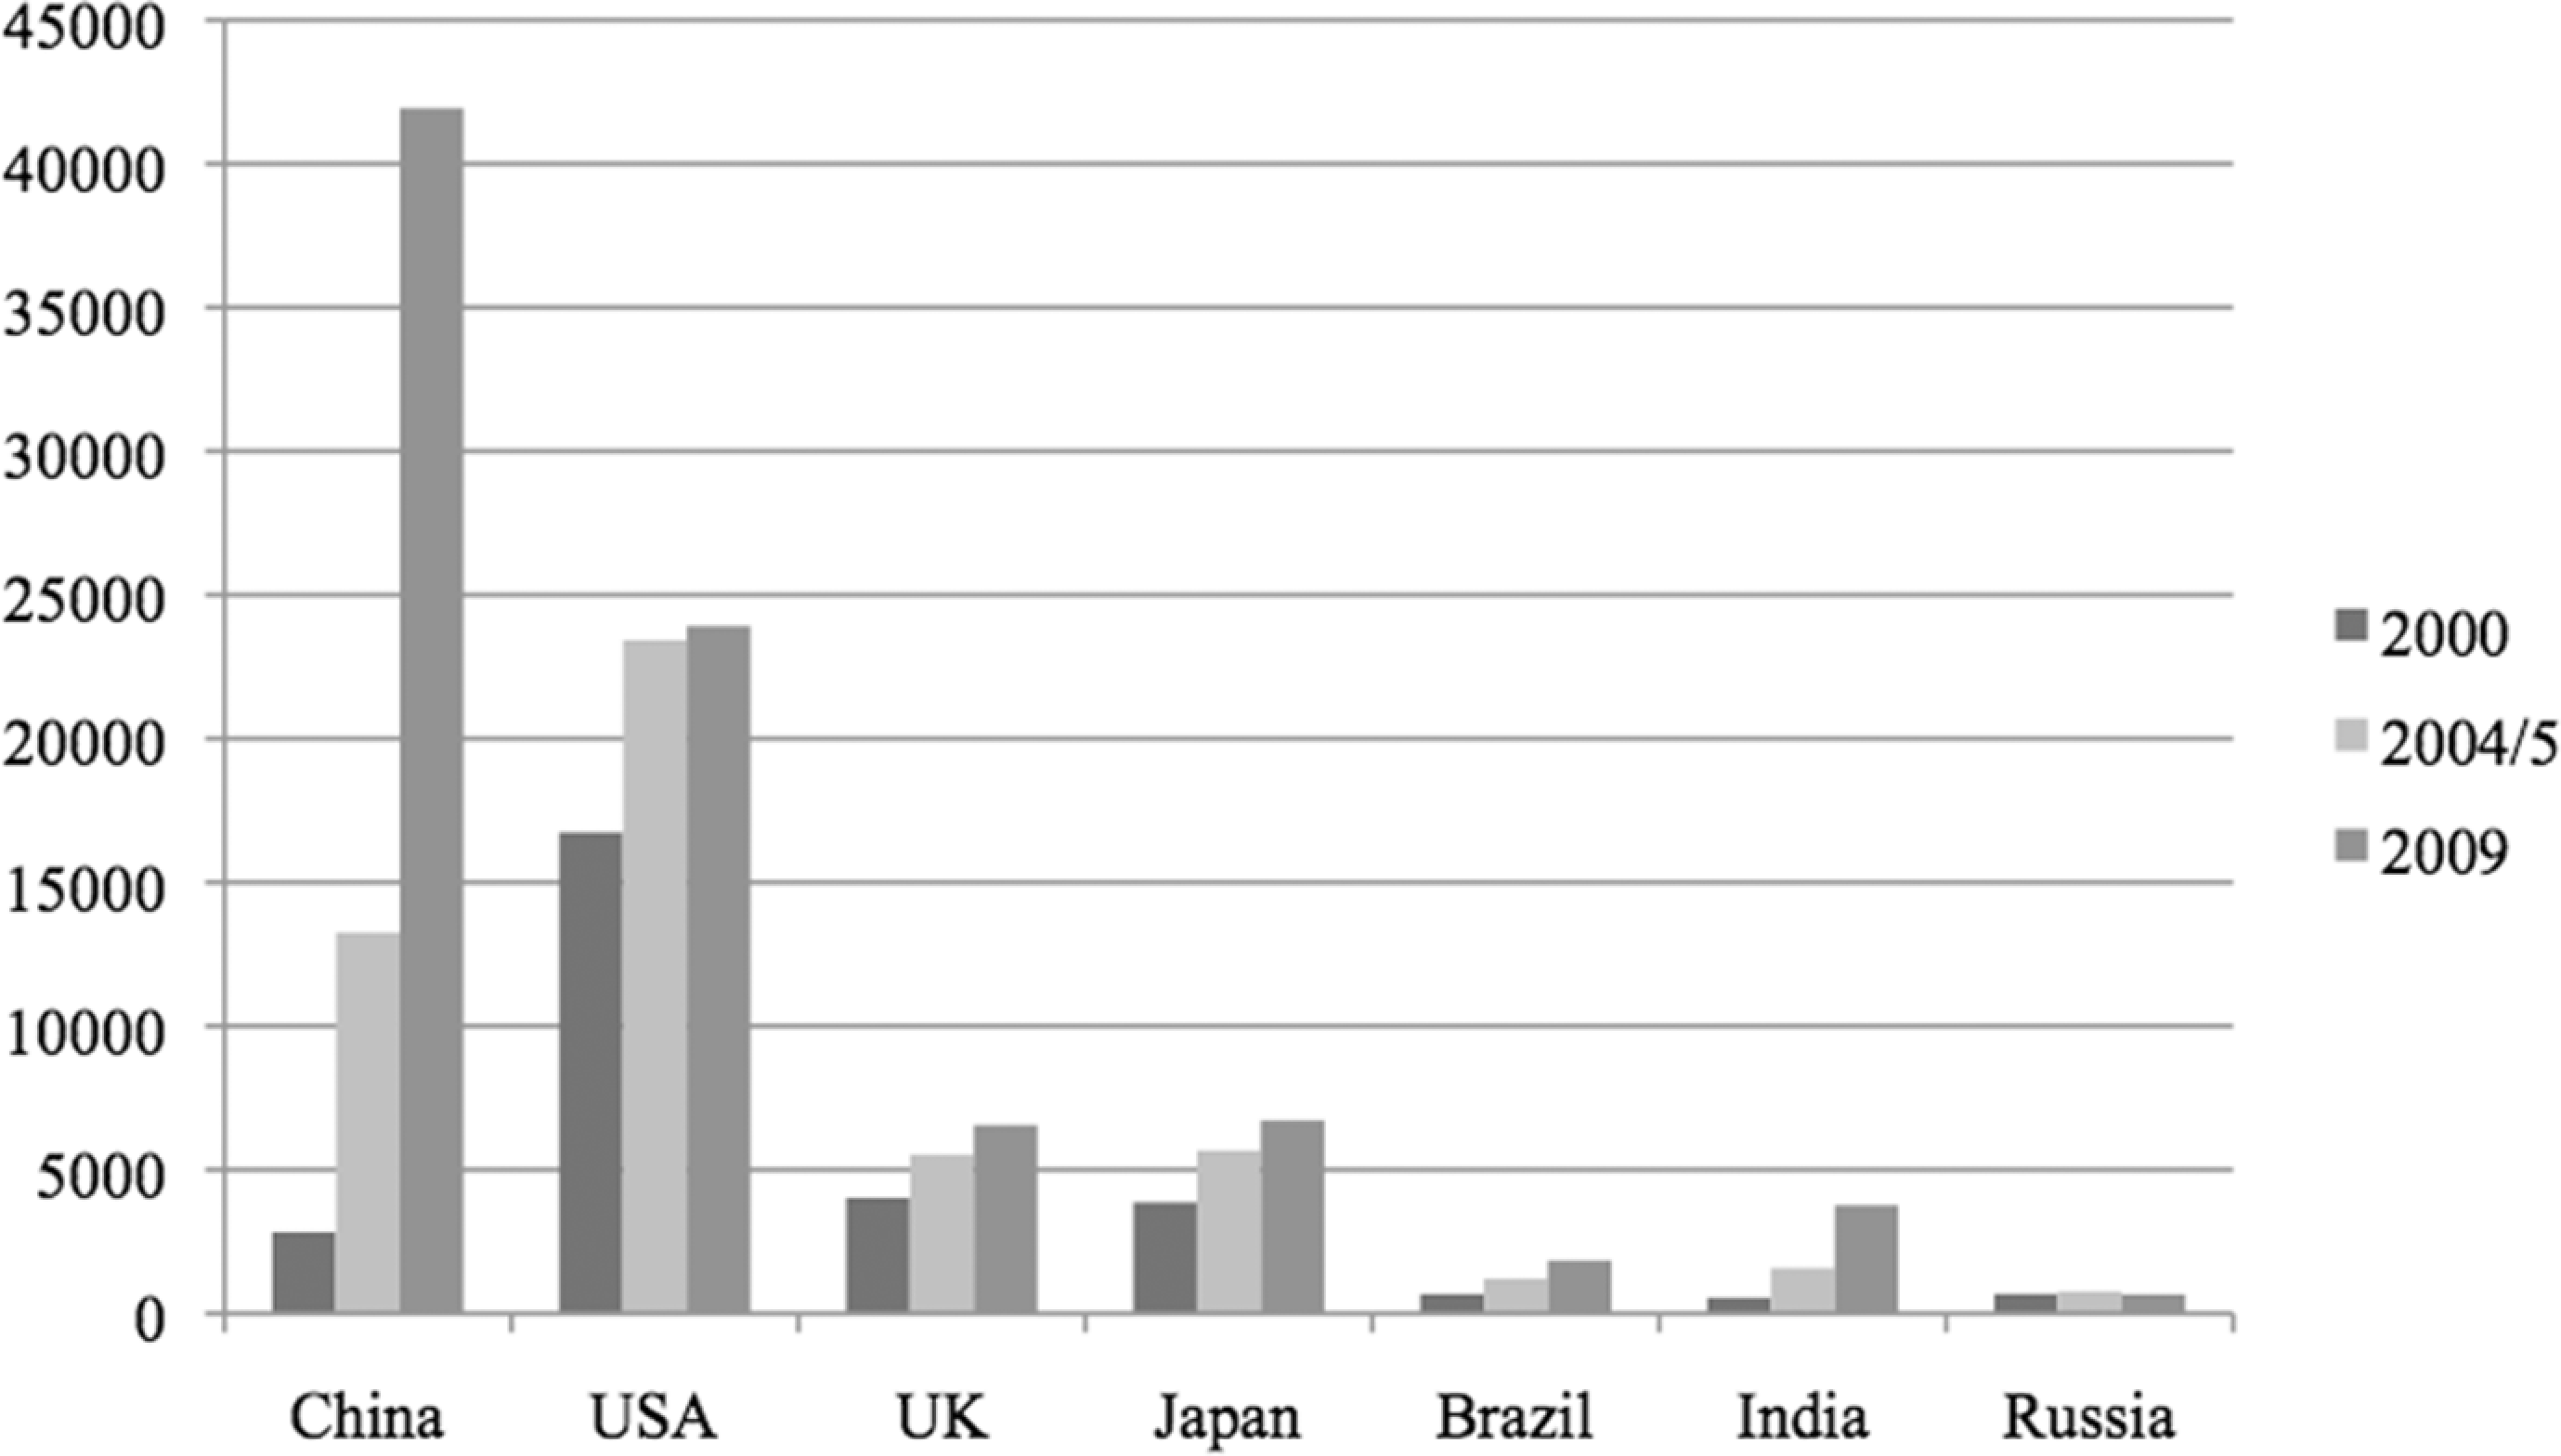
Computer science publications 2000–2009
The rapid growth of Chinese research evident from Figure 1 has been reported for a range of subject areas, as noted in the Introduction. However, while publication figures are a measure of the quantity of research carried out they say nothing about the quality of that research. A full evaluation of Chinese research performance hence also requires consideration of quality, which is normally measured in bibliometric terms by the identities of the outlets (typically journals or conferences in the case of scientific research) that are used to publish the research, and by the impact, as measured by the numbers of citations (or some function thereof) to the publications. Moreover, the gross figures in Table 1 and Figure 1 say nothing about the research performance in specific parts of the discipline, and we have hence chosen here to study three topics in detail, i.e. data mining, operating systems, and web design.
Table 2 lists the numbers of data mining publications, where it will be seen that all of the nations here have increased their outputs in this important applications area. China has displayed the most rapid growth, with a more than 22-fold increase in productivity over the period. It overtook the USA in terms of numbers of publications in 2006, and is now the source for the largest volume of research in the field, producing more than twice as many publications as USA and more than ten times as many as do Japan and the UK.
The increasing globalization of science means that individual articles can be attributed to two or more countries, e.g. where a collaboration exists between research groups in different countries or where a scientist is affiliated with groups in more than one country. Such occurrences are exemplified by the Chinese data mining publications for 2005 in Table 2. Of these 461 publications, all of which involved at least one Chinese researcher, 23 also involved researchers from the USA, with the other multi-national publications involving Canada (12 publications), Australia (9), Singapore (5), Japan (4), the Netherlands and the United Kingdom (both 2), and Belgium, Germany, Ireland and South Korea (all 1). Whilst it would be possible to introduce some sort of fractional publication weighting scheme, we have chosen on grounds of simplicity to allocate a unit weighting to each country associated with a publication so that, e.g. the 23 publications involving USA authors in the 461 Chinese publications also provide 23 of the 475 USA data mining publications in 2005. As this example shows, the numbers of such multiple occurrences are still small (but will undoubtedly increase in the future as Chinese researchers collaborate more with researchers in other nations).
As noted above, a nation’s bibliometric profile depends not only on its publications but also on the citations to those publications. These are listed in Table 3 which shows, for example, a total of 4159 citations to the American data mining publications that were published in 2000. The figures quoted are total citation counts, including self-citations: both Phelan (1999) and Aksnes (2003) have noted that inclusion of these is appropriate when bibliometric analyses are carried out at a national level, and the effect here is certainly small, e.g. the citations to the 461 Chinese publications in 2005 included only four self-citations.
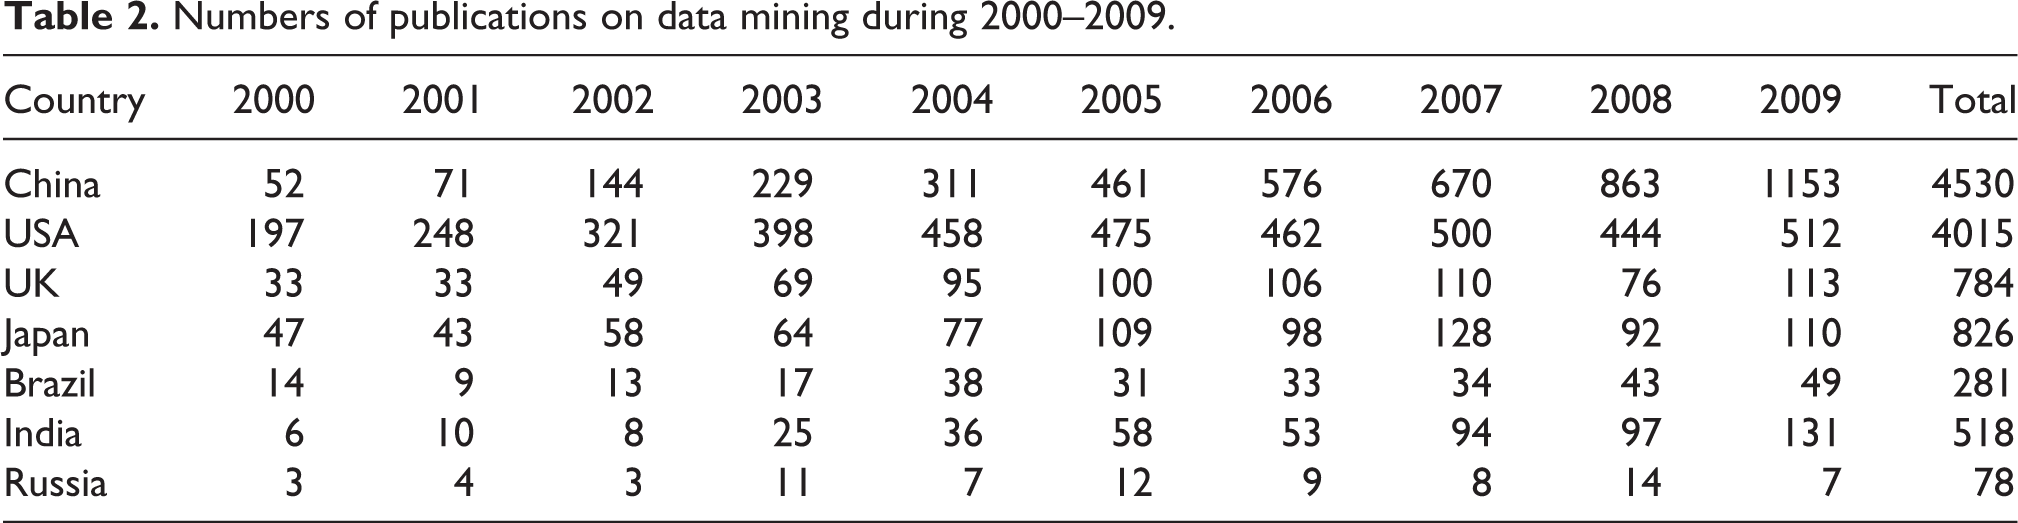
A comparison of Tables 2 and 3 shows that China and the USA have broadly comparable numbers of publications for 2000–2009 but that the USA has over four times as many citations. In part this is because the USA already had a strong publication record in 2000, and thus had many publications that could attract citations throughout the 10-year period, where as China was publishing only a limited amount of material in 2000; however, this is not the entire story, as is clear if one considers the mean number of citations per publication. Table 4 lists these mean numbers for the periods 2000–2004 and 2005–2009 (and also for the publications in operating systems and web design that are discussed later in the paper). It will be seen that the Chinese publications attract considerably fewer citations than do those from the three established research nations (the USA, UK and Japan) as shown in Figure 2 (and this is also true for some of the comparisons with the citation rates for the other BRIC countries). The very large numbers of recent Chinese publications are hence attracting very small numbers of citations. Other points of detail in Table 4 are: that the UK shows the smallest difference in mean citation rates between the two periods (possibly because the Research Assessment Exercise has long encouraged academics to focus on just the best journals when publishing their research); and that India has a very high mean citation rate for 2000–2004 (principally because four of the eight Indian publications in 2002 have extremely high citation counts).
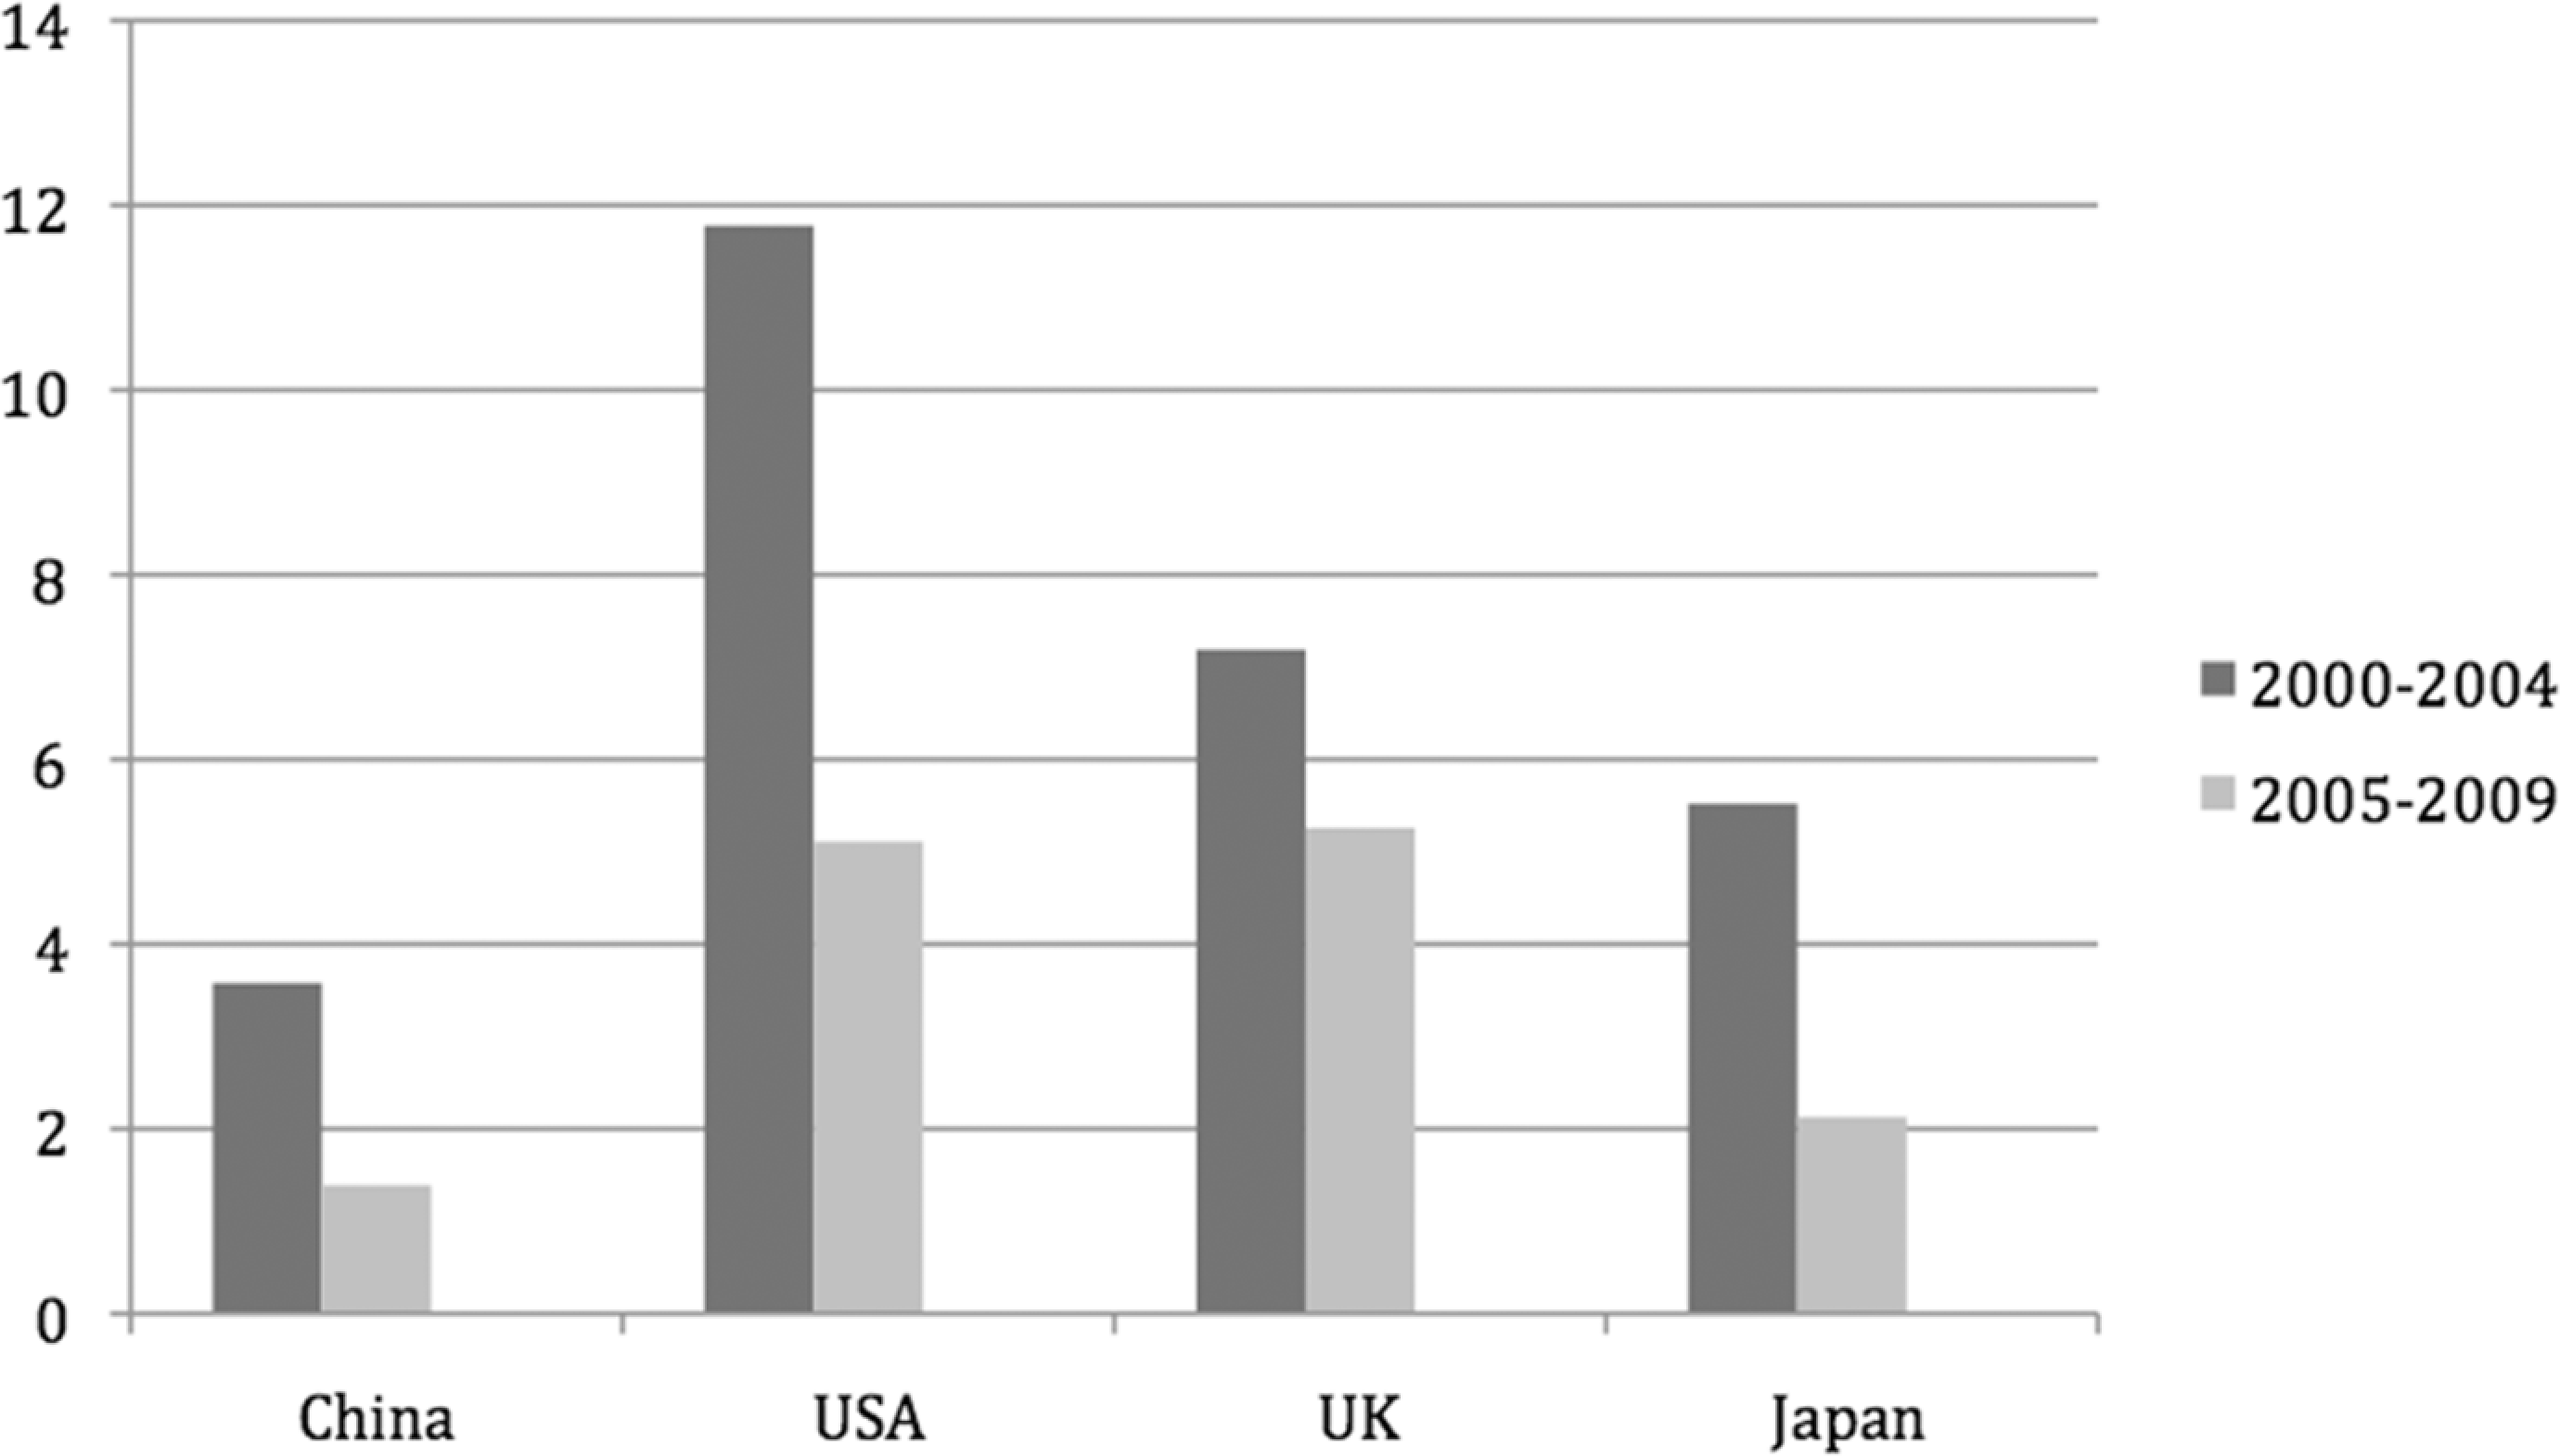
Mean citations per publication for research on data mining
A widely reported recent study by the Royal Society (2011) suggested that China would overtake the USA as the most productive scientific nation some time before 2020 (although this conclusion has since been disputed (Jacso 2011; Leydesdorff 2012)). A χ2 test using Yates correction on the Chinese and USA data mining data in Table 4 shows no significant difference (χ2 = 0.21, p > 0.64), i.e. there has been no change in the relative impact between 2000–2004 and 2005–2009. This is in marked contrast to the productivity data from Table 2 for the same two periods, where there is a highly significant difference (χ2 = 532.47, p < 0.00001), as would be expected from inspection of Figure 1.
The h-index (Hirsch 2005) has become widely used as a simple, single-number criterion of research impact. A researcher (or group of researchers) has index h if h of their N publications have each attracted at least h citations, and the other N-h have fewer than h citations. Table 5 lists the h values, where China would appear to be now competitive with, or superior to, all of the other countries. However, the h-index can be rather misleading if, as is the case here, the number of publications, N, varies considerably. If we consider the 2009 publications, then inspection of Tables 2 and 5 shows that ten of the 1153 Chinese publications (less than 1 percent of them) attracted at least 10 citations, whereas the USA achieved the same result from less than half the number of publications. The 2009 comparison with the UK is still more stark, since eight of the latter’s 113 publications (over 7 percent of them) attracted at least eight citations.
As a complement to simple numbers of citations, it has been suggested that research quality can be assessed by considering where the research is published. Table 6 details the document types for the publications in Table 2 (and also for publications in operating systems and web design that are discussed later in the paper), and shows that the overwhelming majority of them (in excess of 98 percent) are conference proceedings papers or journal articles. As expected for computer science topics (Freyne et al. 2010; Rahm 2008; Sanderson 2008), the former is the more popular type of outlet, with Chinese researchers having the strongest preference for conference papers of all the seven countries considered here (note that there is some degree of overlap in the figures since, for example, Lecture Notes in Computer Science is a serial publication that covers conferences). As noted in the Methods section, we have studied the quality of research in journals and conference proceedings using IF and CORE data, respectively; these analyses are described below.
Table 7 summarizes the IF results for data mining research (and also for operating systems and web design as discussed later in the paper) published in 2005 and 2009. Inspection of Table 7 shows that the percentage of Chinese articles in journals with IFs is competitive with all of the other nations, and that the mean IF is notably lower than for the USA and the UK but comparable to all of the other nations. Thus, from the IF perspective, China has managed to increase the quantity of its data mining research whilst at least maintaining the quality of same for that small fraction of its output that appears in the refereed journal literature. In 2009, for example, the three most popular journals for publishing Chinese data mining research were Expert Systems and Applications (IF = 2.91, 22 papers), Information Sciences (IF = 3.29, 8 papers) and IEEE Transactions on Knowledge and Data Engineering (IF = 2.29, 5 papers).
Table 8 summarizes the CORE results for the nations’ 2009 publications in conference proceedings. In this table, the columns labelled A, B and C are the numbers of publications in the proceedings for conferences with that CORE grading, and the column labelled U (for ungraded) is the number of publications in the proceedings for conferences that do not appear in the CORE rankings. Since the homepage for the rankings (at http://core.edu.au/index.php/categories/conference%20rankings/1) states that “CORE has been engaged in an exercise to rank fully refereed conferences in which its members publish”, it seems not unreasonable to assume that a U conference is likely to be of lower quality than one that has been graded. If this assumption is accepted then inspection of Table 8 suggests that only a small fraction of WoS Chinese conference papers on data mining (and a still smaller fraction of the corresponding Indian conference papers) are published in the best conference proceedings. The USA has the smallest fraction of publications in U conferences, with the other countries all having comparable fractions (though, as elsewhere in the tables, the numbers for Russia are very small (vide infra)).
The only study of which we are aware of Chinese research in data mining is that of Li and Ke (2009), who discussed publications on this topic in the Chinese Social Science Citation Index (CSSCI) database. CSSCI covers over 500 scholarly Chinese journals in the humanities and social science, and Li and Ke analyzed 342 CSSCI articles that contained “data mining” in the title or keyword fields and that had been published in a total of 64 Chinese journals (with two of these – the Journal of Information and Statistics and Decision – accounting for over one-third of all the articles). They reported the most productive authors and institutions, and it is of interest to compare these Chinese-language publications with the (overwhelmingly) English-language publications that form the basis for the data reported here. Rather surprisingly, none of the seven individuals listed as being the most productive in CSSCI are amongst the ten most productive in WoS, using either journal articles or proceedings papers as the basis for comparison. There is marginally more agreement when institutions are considered: Huazhong University of Science and Technology (ranked 4th in CSSCI) is ranked 8th in WoS for conference papers; Zhejiang University (7th) is ranked 10th in WoS for conference papers; and Tsinghua University (10th) is ranked 2nd and 6th in WoS for conference papers and journal articles, respectively. It would hence appear that there are two near-distinct groups of researchers, one focusing on publication in national outlets and the other in international outlets. It may be that there is a language factor at work since the WoS rankings are dominated by Hong Kong-based institutions, which are predominantly English-speaking, with four occurring in the top 10 places for conference papers and five occurring in the top 10 places for journal articles; however, these institutions are notably absent from the top of the CSSCI rankings.
We have discussed the data mining results in detail, and hence present more briefly the results that were obtained in analogous sets of searches for operating systems and for web design, with Tables 9 and 10 listing numbers of publications and citations, respectively, for 2000, for the mean of 2004 and 2005, for 2009, and the total number summed over the entire 10-year period. The trends evident in Tables 9 and 10 are very similar to those seen in Tables 2 and 3, respectively. Thus, the productivity of Chinese research in both operating systems and web design has increased very substantially over the decade, so that it now exceeds that of the USA. However, the impact of the two nations’ research is still very different. For example, in 2009, China and the USA generated 473 and 389 operating system publications, but these yielded 86 and 625 citations, respectively, and the comparison with the UK’s operating system research is even more striking (see also the central portion of Table 4). The reader should note that the UK total of 6811 citations to operating system research in Table 10 is dominated by the 3441 citations to a 2007 article by Larkin et al. (2007) describing a technique for aligning multiple biological sequences, a vital tool in molecular biology database systems; and the comparable Russian total is similarly dominated by citations to two individual articles published in 2006 and 2007. The h-index values (data not shown) for the nations’ research into operating systems and web design mirror closely the citation counts in Table 10, in the same way that Table 5 mirrored Table 2 for data mining research.
The central and right-hand portions of Table 6 demonstrate the marked Chinese preference for conference, as against journal, publication that we have already noted for data mining. The impact of the journal and conference publications is summarized in the central and right-hand portions of Tables 7 and 8. Similar comments apply to these two research areas as applied to data mining with the exception of the 2009 IF data for operating systems, which demonstrates a high level of impact for Chinese research in this area.
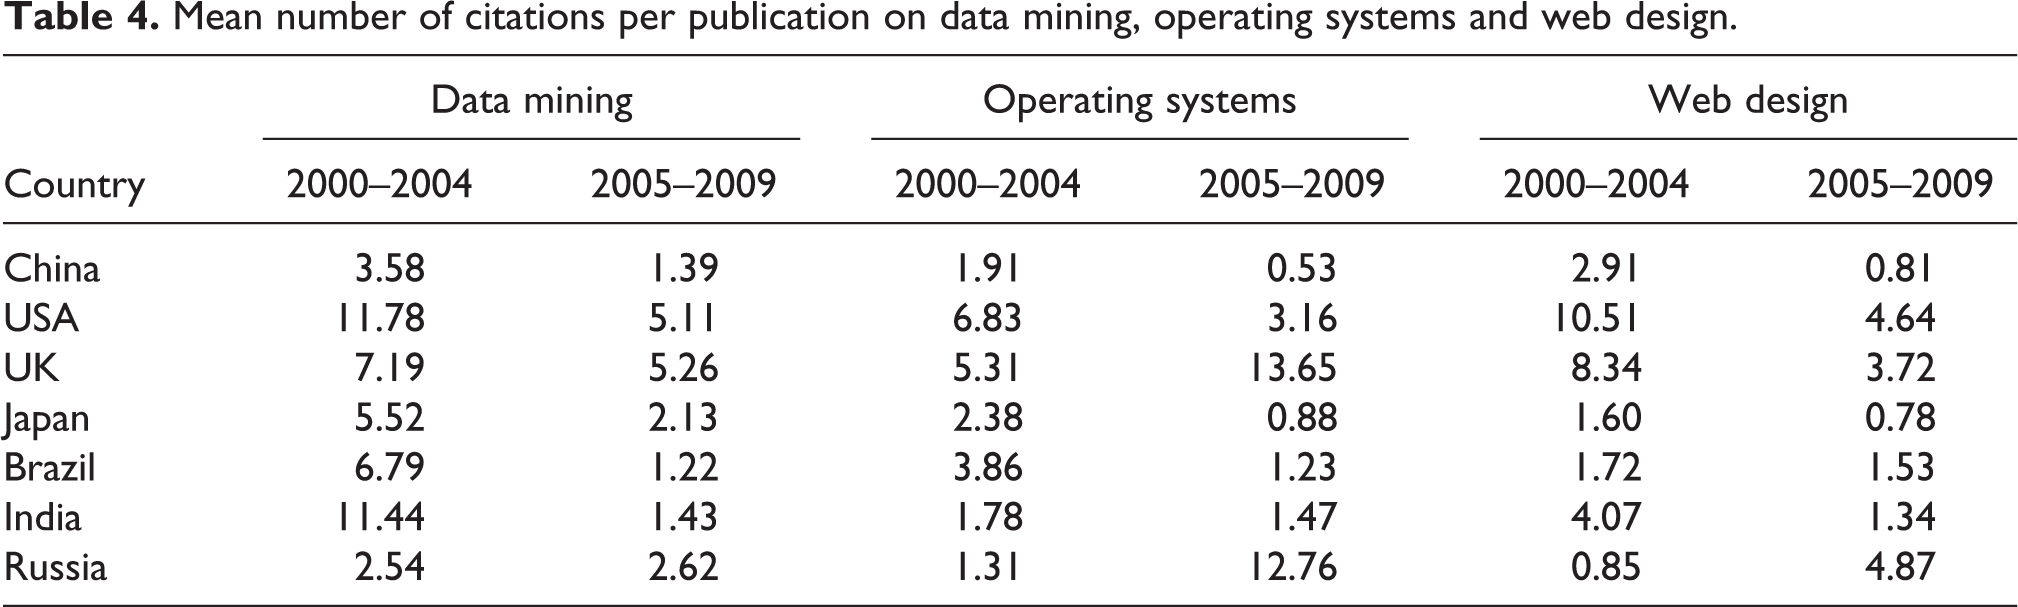
The discussion above has focused on the results for China alone. We now consider research across the BRIC nations, where China’s dominant position is clearly evident from the various tables of results. This dominance is exemplified diagrammatically by Figure 3, which shows the publication and citation counts from Tables 9 and 10 for research on web design. China is by far the most productive nation, and also attracts the most citations; however, the impact of individual papers (i.e. the mean number of citations per publication) is greater for Indian research (although this is not always the case as demonstrated by Table 4). A study by Wainer et al. (2009) of Brazilian publications in computer science for the period 2001–2005 found that it was most similar to Russia of the BRIC countries, and inspection of Table 1 shows that they produced comparable numbers of publications at the start of the decade. However, Russia has not subsequently increased its productivity, whereas Brazil, China and India have all increased their output volumes over the decade, China and India to a very considerable extent. Indeed, inspection of the various tables of results highlights the very low level of Russian research activity in both the three specific areas, and in computer science as a whole. This is rather surprising given the long history of computer science there (Klimenk 1999; Prokhorov 1999). One reason might be that Russian computer scientists do not publish in the predominantly English-language journals that form the bulk of the input to the WoS database; however, Wagner and Wong have demonstrated recently that high-quality science carried out in the BRIC countries is adequately represented in the Science Citation Index Expanded, the largest component of WoS (Wagner and Wong 2012), so it is not clear why Russia might be preferentially disadvantaged when compared to Brazil and China, the other non-English speaking BRICs nations.
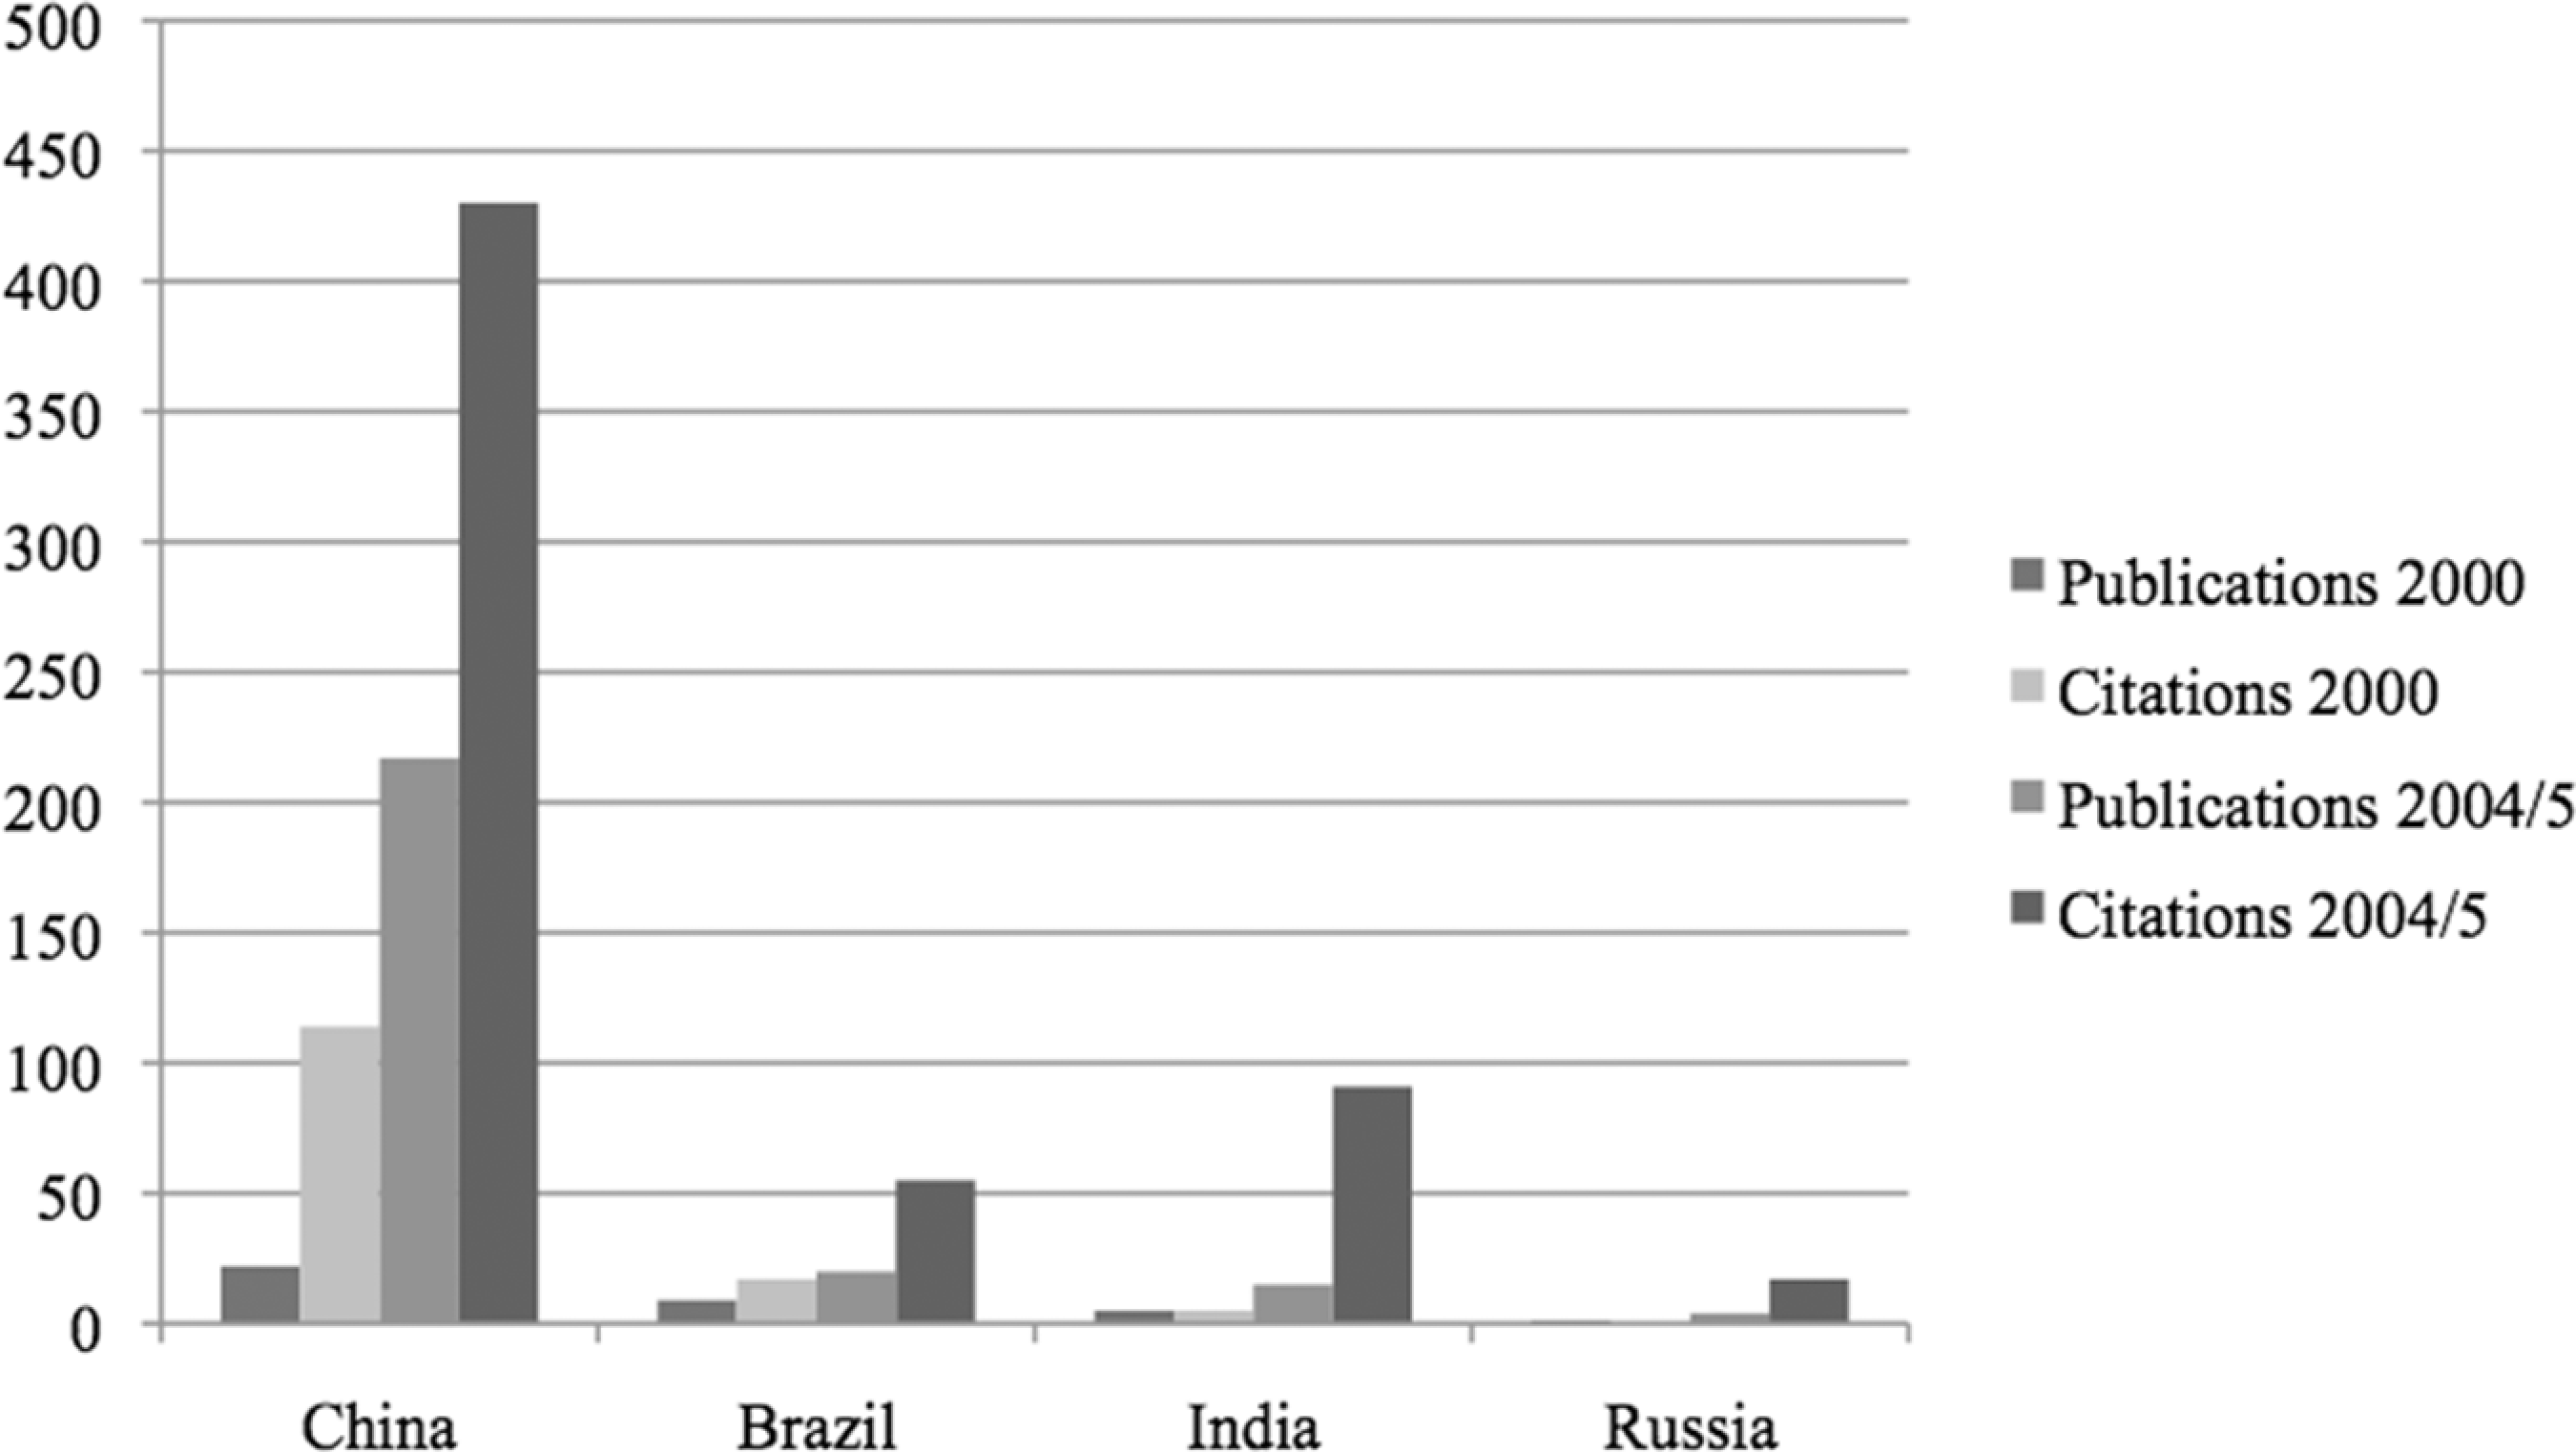
Web design publication and citation data in 2000 and 2004/5 for the four BRIC countries
Conclusions
In this paper, we have reported a bibliometric study of Chinese research in computer science for the first decade of the 21st century, focusing on the areas of data mining, operating systems and web design, and using data available in the WoS, JCR and CORE databases. The data presented here demonstrates clearly the very substantial increase in the productivity of Chinese research output in our three chosen areas of computer science. For example, by 2009, China had become the largest source of publications on data mining, producing more than the total outputs of the other six countries considered here (the USA, the UK, Japan and Brazil, India and Russia) (see Table 2). The predominance is not quite so strong for operating systems and web design research; even so, China has again become the largest producer nation for both of these subject areas. The impact, however, of many of these publications is quite low when compared with the impact of publications from established research nations such as the USA. For example, across all three subject areas, the mean number of citations per data mining publication in the period 2005–2009 was over three times larger for USA publications than it is for Chinese publications, and the differential was still greater for the other two subject areas (see Table 4) . If impact is quantified in terms of presentation at high-quality conferences, rather than mean numbers of citations per publication, then China again lags far behind the USA: for example, in data mining, only 21.6 percent of the 1013 Chinese conference presentations in 2009 were at conferences graded A-C in the CORE listings, where as the corresponding figure for the USA was as high as 52.3 percent, and the Chinese percentages for the other two subject areas were even lower (see Table 8). There is hence a marked disparity between the quantity and the quality of Chinese research: this disparity is a significant problem that needs to be addressed as a matter of some urgency if China is to contribute fully to the future development of computer science.
Footnotes
Acknowledgement
We thank the China Scholarship Council for funding Zhilong Xie’s visit to the University of Sheffield.