
Abstract
Information technology outsourcing (ITO) studies have been the focus of researchers for decades. One topic has been the factors and impact of ITO on organizations. Inconclusive findings about relationships between the levels of ITO and ITO success demands further exploration on this issue. In Thailand, the National Electronics and Computer Technology Center (NECTEC) reported that the financial and banking industry has the highest spending on computer services primarily by outsourcing the core banking and service management system. Nonetheless, research on ITO in Thailand’s financial industry has been limited. This study is among the first to empirically investigate the relationship between the levels of ITO, defined as the percentage of IT activities and components selected to be outsourced, and ITO success, defined by the benefits received from outsourcing in Thailand. A three-pronged approach is used in this study. It began with a comprehensive literature review. This was followed by in-depth expert interviews with representatives from financial institutions, academia, and outsource vendors, all of who offered opinions that shaped the development of the research model. A survey was then carried out with 428 IT personnel from the Thai financial sector. The results were analyzed using structural equation modeling (SEM). Contrary to previous researches, this study found that internal uncertainty and internal IT skills were two factors that do not affect the levels of ITO, while transaction costs and specific assets do. In addition, it was found that levels of ITO have impacts on ITO success. In a real world application, this study focuses on the different levels of ITO implementation among Thailand’s top five banks and their effects on ITO success. The findings increase researchers’ understanding regarding the factors that affect the levels of ITO and suggest that practitioners must consider the levels of ITO, in addition to other factors, when making ITO decisions. The framework can help practitioners optimize ITO practice for successful ITO outcomes.
Determining whether or not IT outsourcing adds value to the organization is an important management question.
Introduction
Information technology (IT) plays an increasingly significant role in organizational transactions and processes. Thus, IT has become an important resource of existing business strategy (Kaplan and Norton, 2004). However, the complexity of IT management, the rapid changing of IT tools and high IT investment have increased (Udo, 2000; Han et al., 2008; Shi, 2010). Organizations that have a mature IT process are more inclined to use IT outsourcing (ITO) strategies so they can focus on their core business competencies and explore the latest technologies from outside vendors (Gulla and Gupta, 2012). The scale and range of ITO has become a global phenomenon evidenced by the growth from US$184 billion in 2003 to US$246.6 billion by the end of 2011, as reported by Gartner inc. (Lin et al., 2007; Britz et al., 2012). Accordingly, ITO has become a common issue in the organizational management agenda (Aubert et al., 2004; Jiang et al., 2006; Karyda et al., 2006).
In this research, ITO is defined as the practice of transferring IT infrastructure, activities, people and management responsibility for delivery of services and products to an external vendor (Loh and Venkatraman, 1992; Hirschheim and Lacity, 2000). In a general sense, as outsourcing increases, investments in facilities, equipments and manpower are reduced, and costs will decline. Even though ITO practice has increased over the years, there are few organizations that have reported ITO success (Willcocks and Lacity, 1998; Wang and Yang, 2007; Han et al., 2008). Some organizations gained an advantage from ITO while others failed (Lacity and Hirschheim, 1993; Rochester and Douglas, 1993). Lacity et al. (1995) also indicated that nearly 70 percent of the organizations which have undergone ITO deals expressed dissatisfaction and others were not successful in terms of quality, productivity and cost efficiency (Pati and Desai, 2005; Rottman and Lacity, 2009).
ITO increase in Thailand is the same as in other countries. As reported by Thai public organizations, the growth of the ITO market is among the top three in computer services (19.3 percent), with a total market value of THB5,679 million (US$189 million) in 2010 (NECTEC, 2010). Additionally, the financial and banking industry held the highest share in computer services spending through outsourcing its core banking and service management systems (NECTEC, 2010).
The Central Bank of Thailand (2013) organizes 137 financial institutions into 12 types, including Thai commercial banks, retail banks, subsidiaries, foreign bank branches, finance companies, credit financiers, foreign bank representatives, assets management companies, specialized financial institutions, Thai asset management corporations, credit card companies and personal loan companies.
However, since 2008, nearly 60 percent of Thai financial institutions’ total assets, deposits and loans are dominated by the big four domestic Thai commercial banks, namely, Bangkok Bank, Krung Thai Bank, Kasikorn Bank, and Siam Commercial Bank (Sufian and Habibullah, 2010). In order to accurately represent the Thai financial sector, this study focuses on Thai commercial banks and, more specifically, the big four and other financial institutions that heavily use outsourcing strategy in their IT functions.
ITO is a fairly recent option for financial institutions in Thailand. The first of the big four banks that used an ITO strategy signed a 10-year contract with IBM in 2003 (Sufian and Habibullah, 2010). NECTEC reported that the reason for IT market growth in Thailand is based on financial institutions upgrading their IT systems to comply with the Bank of Thailand’s regulations such as Basel II, which focuses on maintaining IT contingency plans, and the implementation of a computer-related crime act (NECTEC, 2010). Additionally, due to intensified competition in the financial industry, financial institutions begun using marketing strategy and advanced IT services by external vendors to improve operational efficiency (Bátiz-Lazo and Wood, 2001).
Though ITO among financial institutions in Thailand is rising, empirical studies and research in this area are limited (Ang and Cummings, 1997; Marcolin and McLellan, 1998; Baldwin et al., 2001; Goolsby et al., 2002). The research on outsourcing in Thailand primarily focuses on material and service outsourcing in the manufacturing industry (Thangavelu and Chongvilaivan, 2011), logistic outsourcing (Kitcharoen, 2003), surgery outsourcing in medical tourism (Bies and Zacharia, 2007; Marlowe and Sullivan, 2007), and relationship outsourcing in the automobile industry (Chiasakul, 2004; Kess et al., 2008).
This research attempts to fill in the context of Thailand’s financial institutions by investigating the relationship between the levels of ITO and ITO success. To address the gap in research regarding ITO, the following questions were formulated:
RQ1: What is the relationship between the levels of ITO and ITO success in Thailand? RQ2: Are the drivers of the levels of ITO the same as those found in previous research?
Literature review
Theoretical background
Transaction cost theory (TCT) provides much of the theoretical background for ITO research (Lacity and Hirschheim, 1993; Aubert et al., 1996; Aubert et al., 2004; Whitten and Leidner, 2006). The theory explains that firms will consider all transaction costs and benefits, and choose to outsource when net potential gain is expected (Gottschalk and Solli-Sæther, 2005).
The TCT concept is applicable to firms that have the objective of finding ways to minimize costs associated with economic transactions (Williamson, 1981). Grover, et al. (1996) also apply the TCT in their research, stating that organizations will choose to outsource when outside vendors have greater efficiency than internal resources, thereby reducing an organization’s costs.
The TCT presents a set of principles for analyzing buyer-supplier transactions and determining what functions should be outsourced (Lacity and Hirschheim, 1993). The TCT is based on two assumptions: bounded rationality and opportunism (Williamson, 1985). Bounded rationality refers to a limitation in the way a person thinks or reasons, and leads to making an imperfect assessment. Opportunism occurs when a person is motivated to take advantage of someone else through some form of manipulation, such as by taking advantage of another person’s lack of information. When this happens, a transaction cost results from contractual opportunism.
Therefore, before making any decision to outsource, firms will analyze transaction costs that can occur (Ang and Straub, 1998; Grossman and Helpman, 2002). One reason for ITO failure occurs due to the complexity of the ITO decision, because most outsourcing decisions are based on limited information between organizations and outsource vendors (Loh and Venkatraman, 1992; Lacity and Hirschheim, 1993).
Levels of IT outsourcing
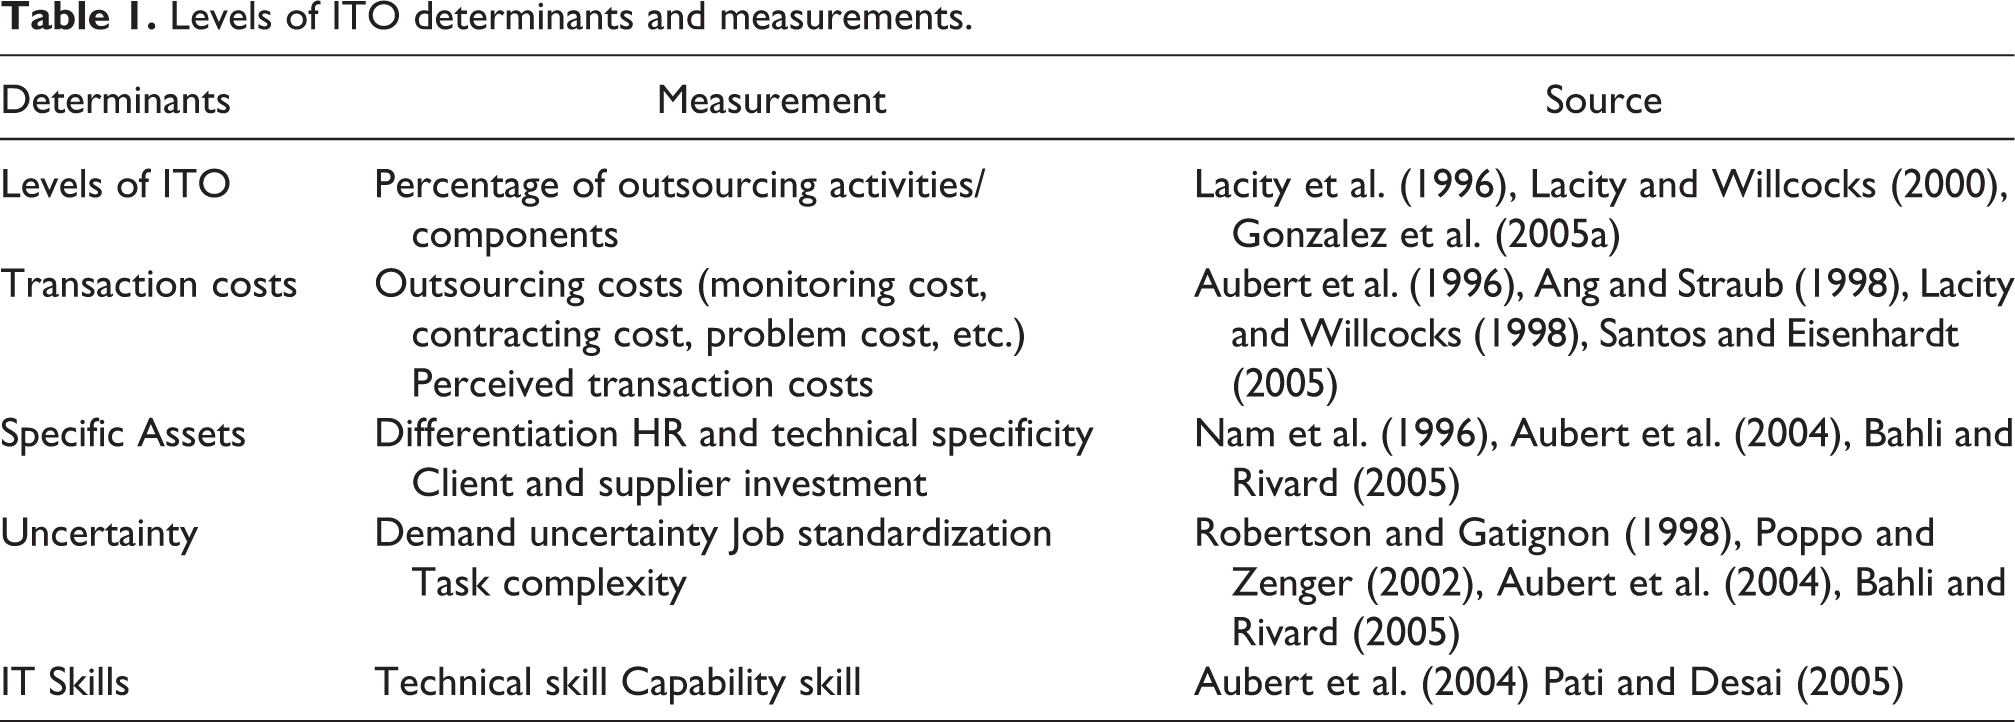
Level of ITO in this research is defined as the percentage of transferring IT-related activities and components that are not a part of an organization’s core competency to external vendors (Lacity and Willcocks, 2000; Gonzalez et al., 2005a; Pati and Desai, 2005; Tafti, 2005). Firms typically select IT activities and IT components to be outsourced based on their strategies (Earl, 1996). IT activities consist of the maintenance, operation, development and design of technology (Österle and Winter, 2003), while IT components include IT infrastructure, applications, tasks and processes (Zarnekow et al., 2004).
Additionally, to increase the understanding of the levels of ITO, the researchers reviewed factors in the literature that could affect the levels of ITO. Ang and Straub (1998) focused on the economic determinants of ITO that influenced outsourcing decisions. Their research looked at production cost, transaction costs, and financial slack. They argued that transaction cost plays the main role in the decision-making process. Financial slack and business skills are omitted from their research because prior findings argued that there was no statistically significant effect on the levels of ITO.
Aubert et al. (2004) discussed the characteristics of IT operation activities by developing a transaction cost model of ITO. They examined specific elements of transaction cost which influence the levels of outsourcing. They concluded that high IT asset specificity and high uncertainty act as deterrents in the ITO decision, while high levels of technical skills lead to increased levels of ITO.
Table 1 summarizes the determinants and measurements of levels of ITO that are used in this study from previous literature.
Levels of ITO determinants and measurements.
IT outsourcing success
ITO success is defined as satisfaction with the benefits from outsourcing gained by organizations (Grover et al., 1996). Lee et al. (2004) defined ITO success as the levels of appropriateness between the organization’s requirements and outsourcing outcomes delivered by the service provider.
However, since general outsourcing is motivated by strategic, economic and technological benefits, many researchers use these benefits to evaluate ITO success (Grover et al., 1996; Lee and Kim, 1999; Lee, 2001; Jiang et al., 2006; Gottschalk and Solli-Sæther, 2006; Dahlberg and Lahdelma, 2007).
Strategic benefits are defined as the ability of a firm to focus on its core business by outsourcing routine IT activities (Lacity and Willcocks, 1998). Technological benefits are defined as the ability of a firm to gain access to leading-edge IT and to avoid the risk of technological obsolescence that results from dynamic changes in IT (Lacity and Willcocks, 1998; Lee and Kim, 1999). And economic benefits are defined as the ability of a firm to use the expertise and economies of scale in human and technological resources of the service provider and to manage its cost structure through unambiguous contractual arrangements (Ngwenyama and Bryson, 1999).
Research framework
The main focus of this study is to investigate the relationship between the levels of ITO and ITO success. As focused by prior researchers based on the TCT (Lacity and Willcocks, 1998; Ang and Straub, 1998; Aubert et al., 2004; Dahlberg and Lahdelma, 2007), the levels of ITO are generally categorized as total outsourcing or selective outsourcing, based on the percentage of IT budget being outsourced.
The studies by Lacity and Willcocks (1998) in the US and UK and a study by Seddon et al. (2002) in Australia found that selective outsourcing presented more successful results. The studies by Dahlberg et al. (2006) in Finland, and Lee et al. (2004) in South Korea, however, found no statistically significant differences between selective and total outsourcing and ITO success. Inconclusive findings about the relationship between levels of ITO and ITO success suggest the need for further exploration on this issue.
To answer these research questions, the researchers developed the research framework shown in Figure 1.
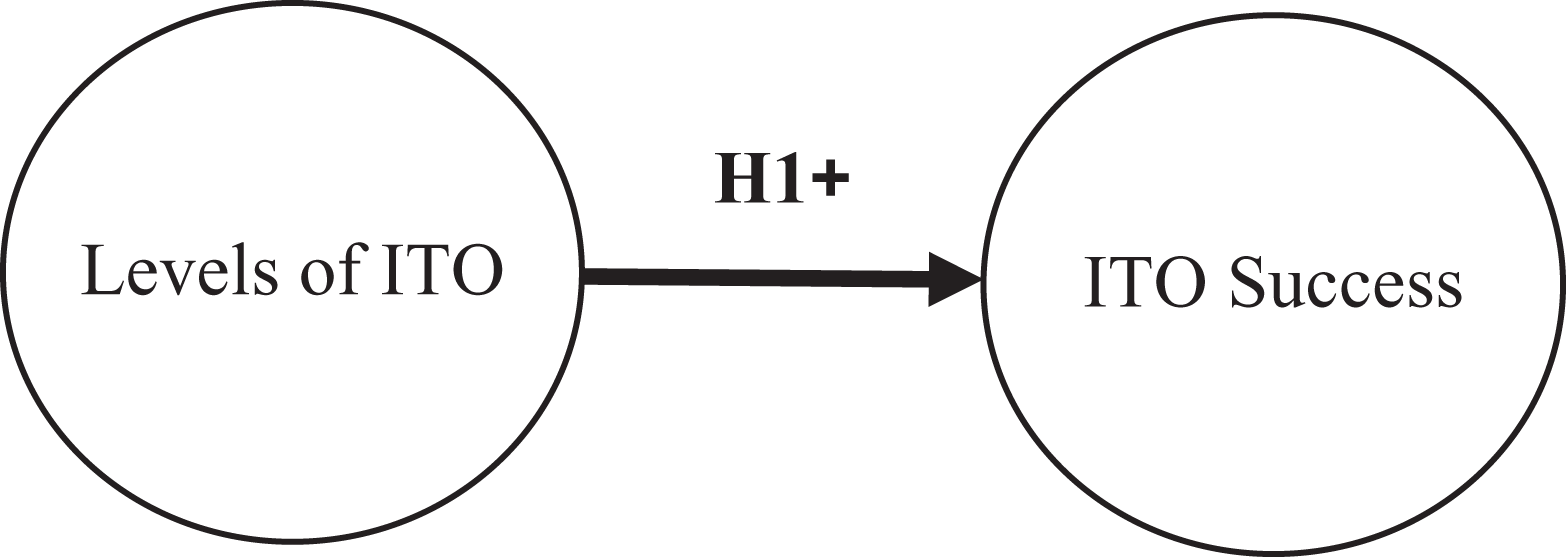
Main Research Framework.
The first hypothesis explores the relationship between the levels of ITO and its success. This hypothesis is based on the previous study of Grover et al. (1996). In their research, they used IT functionality (such as applications, telecom development, and system operations) as the determinants for the levels of outsourcing. They determined that if outsourcing is undertaken with conscious economic, strategic and technology considerations as conducted by TCT, the relationship between ITO and ITO success would be positive and significant. This research therefore hypothesizes that:
H1: The level of ITO has positive impacts on ITO success.

Complete Proposed Framework.
Transaction costs
The TCT extends the neoclassical economic perspective by recognizing the significance of transaction costs in any market change. Transaction costs refer to all costs that occur in the ITO process, i.e. costs of effort, time, management, coordinating, monitoring, negotiation, communication, and making contracts (Porter and Millar, 1985; Mahoney and Pandian, 1992; Williamson, 1985).
Many scholars have stated that transaction costs are an important factor in making outsourcing decisions (Ang and Straub, 1998; Grossman and Helpman, 2002). When a firm foresees substantial efforts and costs in supervising, coordinating, and monitoring the activities of the vendor, it may decide that external sourcing is too costly (Ang and Straub, 1998). This research therefore hypothesizes that:
H2: The levels of transaction costs have negative impacts on the levels of ITO.
Specific assets
Specific assets are defined as any specialized knowledge or skill developed from experience within an organization, or specialized hardware or software customized for a particular purpose in an organization (Williamson, 1985; Heide, 1994; Ang and Cummings, 1997). Aubert et al. (2004) argued that from the TCT perspective, investments in specific assets lead to additional transaction costs. As the organizations’ assets and processes become more complex, ITO becomes increasingly costly to implement and train. When these costs are too high, organizations will decide to conduct the transaction in-house (Aubert et al., 2004; Malik and Nilakant, 2011; Watjatrakul, 2005).
Specific assets are also found to be the most important dimension of a transaction wherein the vendor provides specific investments in physical (special software) or human (specialized technical skills of personnel) capital. The asset-specific transactions can lead to a tied-up relationship between the transacting parties since the supplier is “locked into” the transactions and the buyers cannot turn to alternate suppliers because of the high cost of supply. This research therefore hypothesizes that:
H3: The levels of specific assets have negative impacts on the levels of ITO.
Internal uncertainty
Uncertainty is defined as a lack of information (Aubert et al., 1996). There are a number of unexpected situations which may occur during the transaction process (Miozzo and Grimshaw, 2005). For example, uncertainty influences the levels of ITO because of bounded rationality and opportunism. Both partners seek to reduce uncertainty by negotiating complex contracts or by extensively renegotiating. Aubert et al. (1996) stated that organizations will try to predict all the possibilities associated with the governance of their particular transaction. The more complex the environment, the more partners will seek to negotiate comprehensive agreements.
Williamson (1985) found that it is difficult for buyers of goods and services to evaluate the suppliers’ actions because of imperfect information and uncertainty. Additionally, Nam et al. (1996) found that uncertainty played a significant role in the decision to outsource. Aubert et al. (2004) also confirmed that increased uncertainty can lead to increased use of internal governance rather external vendors. High levels of uncertainty could lead to decreases in organizations’ decisions to outsource. So this research hypothesizes that:
H4: The levels of internal uncertainty have negative impacts on the levels of ITO.
Internal IT skills
IT skills are defined as technical skills and capabilities that were obtained from training, education, and experiences related to the accomplishment of certain tasks (Medlin et al., 2007; Goo et al., 2000). Although in theory outsourcing provides access to technical skill and IT specialists’ expertise, what often happens in practice is that the outsourcing firm is supported by the organization’s own staff (Fowler and Jeffs, 1998).
Even though the vendor supplies innovative services to the customer, a large part of the new knowledge required remains in the hands of the providers and cannot be transferred to the customers (Gonzalez et al., 2005b; Gonzalez et al., 2005a). Therefore, the customers need to retain certain know-how and internal capacities in both technical and business areas if they want to handle the outsourcing relationship properly (Willcocks et al., 1999). If internal staff have the IT skills to perform the required tasks, it is not necessary to utilize ITO. Accordingly, the higher the skills of the internal staff, the lower the levels of ITO. Thus, the research hypothesizes that:
H5: The levels of internal IT skills have negative impacts on the levels of ITO.
Research methodology
Research methodology started with a review of the literature to identify measures for each construct. Experts were then interviewed to confirm the understanding of organizational ITO perceptions. Next, a pilot study was conducted with IT professionals from both private and public financial institutions. Last, a full scale survey was conducted to evaluate the hypothesis.
Expert interview
The expert interviews were conducted with both practitioners and academicians. As shown in Table 2, there were 25 persons involved from three sectors: 12 persons from the financial sector, 8 persons from academia, and 5 persons from outsource vendors. IT professionals and managers from the financial sector and the outsource vendors represent the practitioner’s perspectives. Their expertise was determined based on their positions and experience with firms.
Profile of experts interviewed.
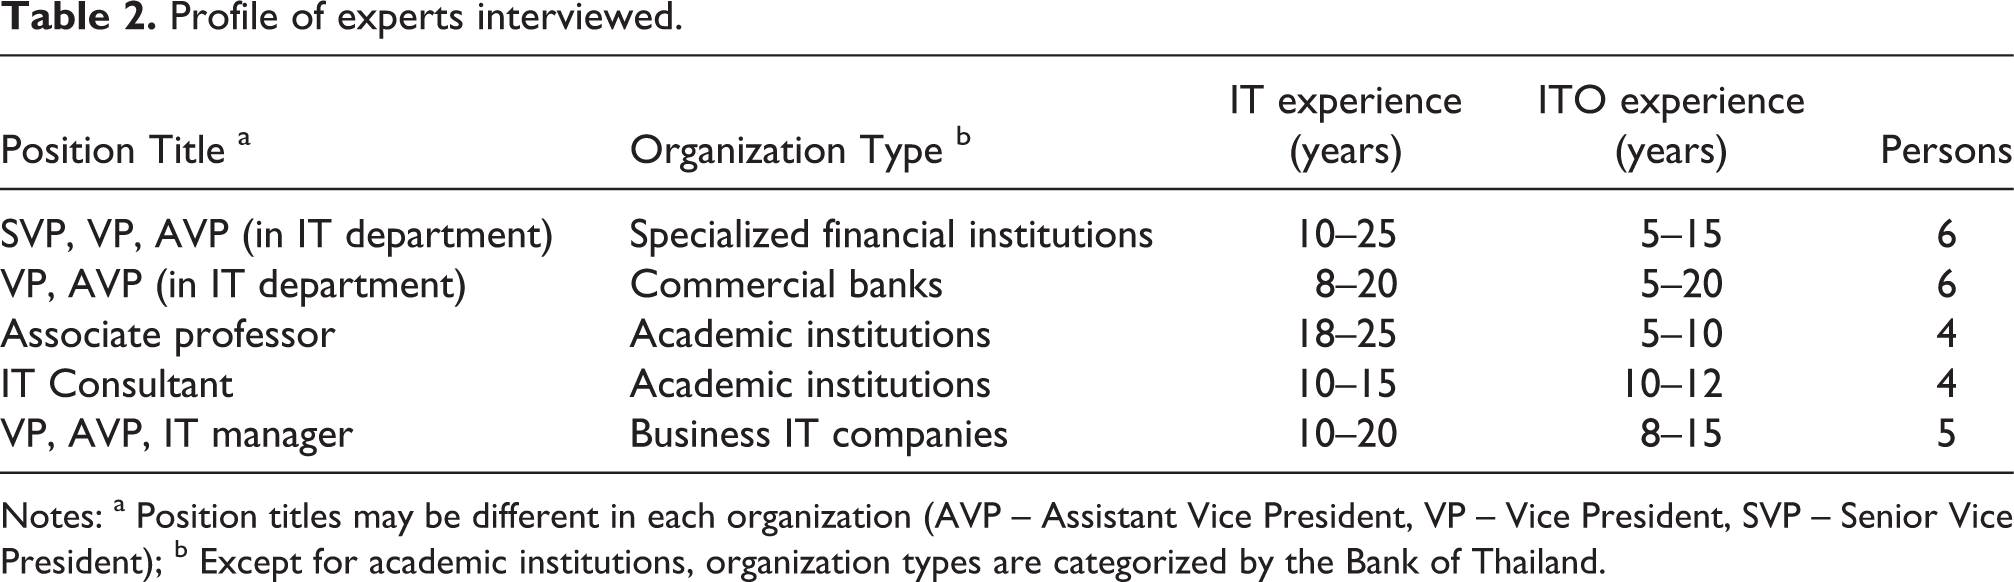
Notes: a Position titles may be different in each organization (AVP – Assistant Vice President, VP – Vice President, SVP – Senior Vice President); b Except for academic institutions, organization types are categorized by the Bank of Thailand.
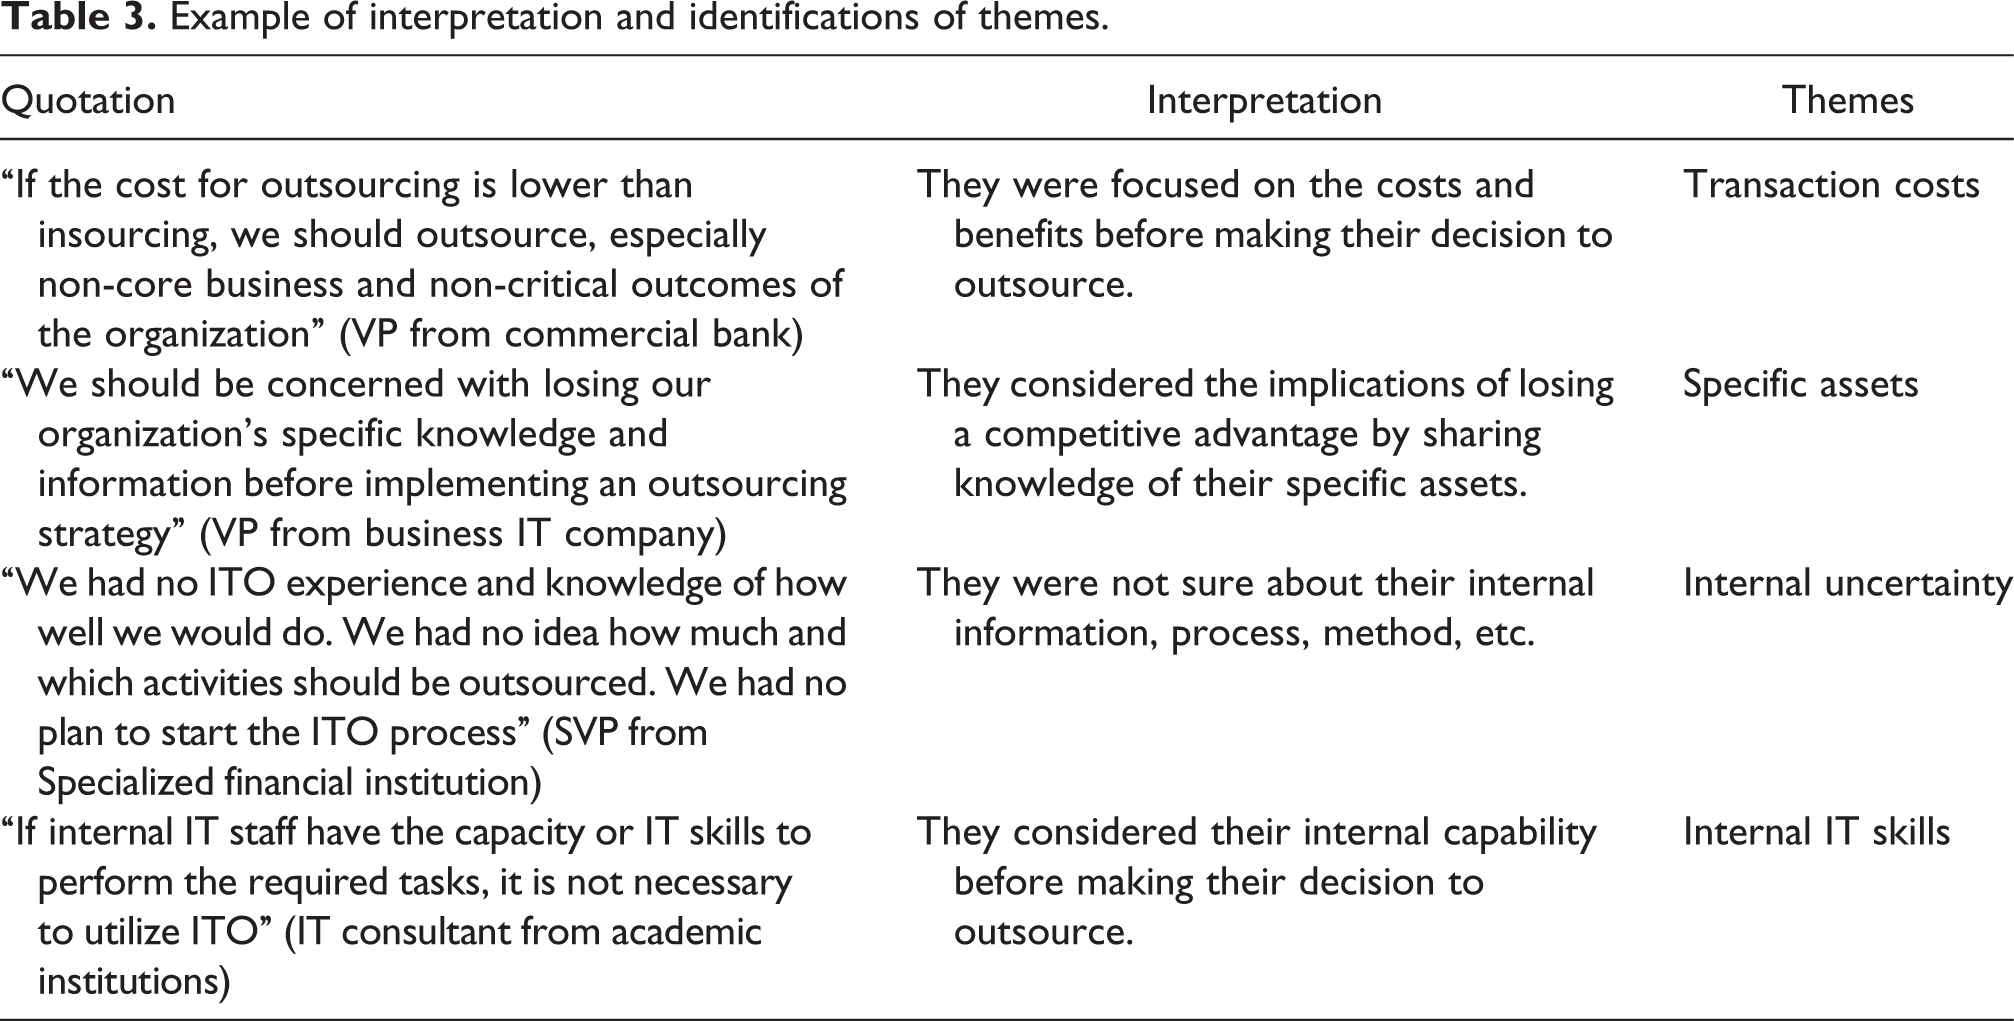
The interviews employed semi-structured and open-ended questions. They averaged about 90 minutes and usually involved a tour of the facility and, in some cases, opportunities to meet employees involved in the operations. Most interviews were conducted in Thai, while the remainder were conducted in English for non-native speakers. The purpose of the interviews was to gain an initial understanding of ITO practice in Thailand, confirm definitions, verify measurements, fine-tune the framework, and validate the ITO questionnaire. The interviews were transcribed and coded manually using the four categories based on the recommended theoretical framework to guide analysis in each decision process (Hamzah et al., 2010). After the transcription of interviews, an interpretation and identification of issues and themes was carried out through a process of multiple individual reading of the transcripts, followed by intensive periods of discussion between the researchers. Table 3 shows an example of the interpretation and identification of themes during data analysis.
Example of interpretation and identifications of themes.
When available, reports, contracts, and any other relevant materials were collected to obtain a complete picture. The discussions were supported by our literature review and the theoretical foundations. The information was classified into variables used in the study: transaction costs, specific assets, uncertainty and IT skills. All data obtained from expert interviews was consolidated to create a framework between the levels of ITO and ITO success, and subsequently integrated into the questionnaire. The final questionnaire was then piloted.
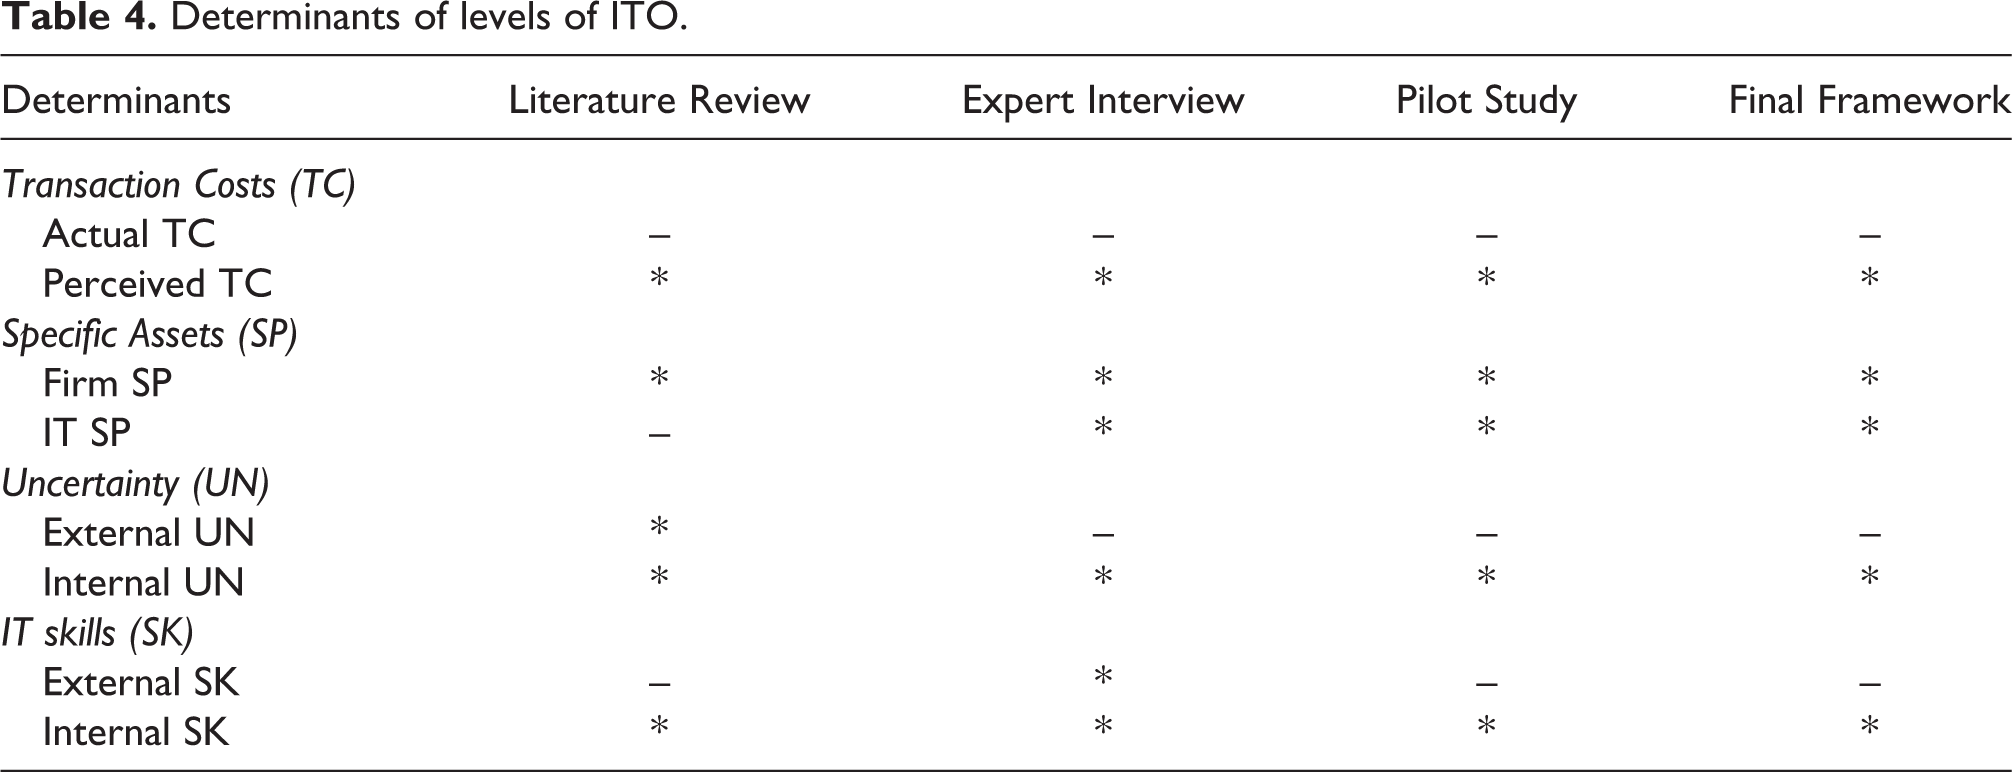
Table 4 presents the summary of determinants from the literature review, expert interviews and pilot study, which provide a guideline for the questionnaire and final framework development.
Determinants of levels of ITO.
Pilot study
The measurement instruments were validated by experts in the field, a pilot test, an internal reliability test, and statistical analysis. The initial questionnaire was evaluated for consistency by five IT experts. The pilot study questionnaire was pre-tested by 70 IT professionals from five financial institutions. The questionnaire’s wording, structure, sequence, and overall presentation were then adjusted accordingly.
Field survey
A full scale survey was conducted with IT professionals and executives in Thai commercial banks and specialized financial institutions registered at the Bank of Thailand (BOT), a regulatory body of Thai financial institutions. The questionnaire consists of both 5-point Likert-scale and open-ended questions. The survey was designed to obtain a comprehensive view of ITO practices.
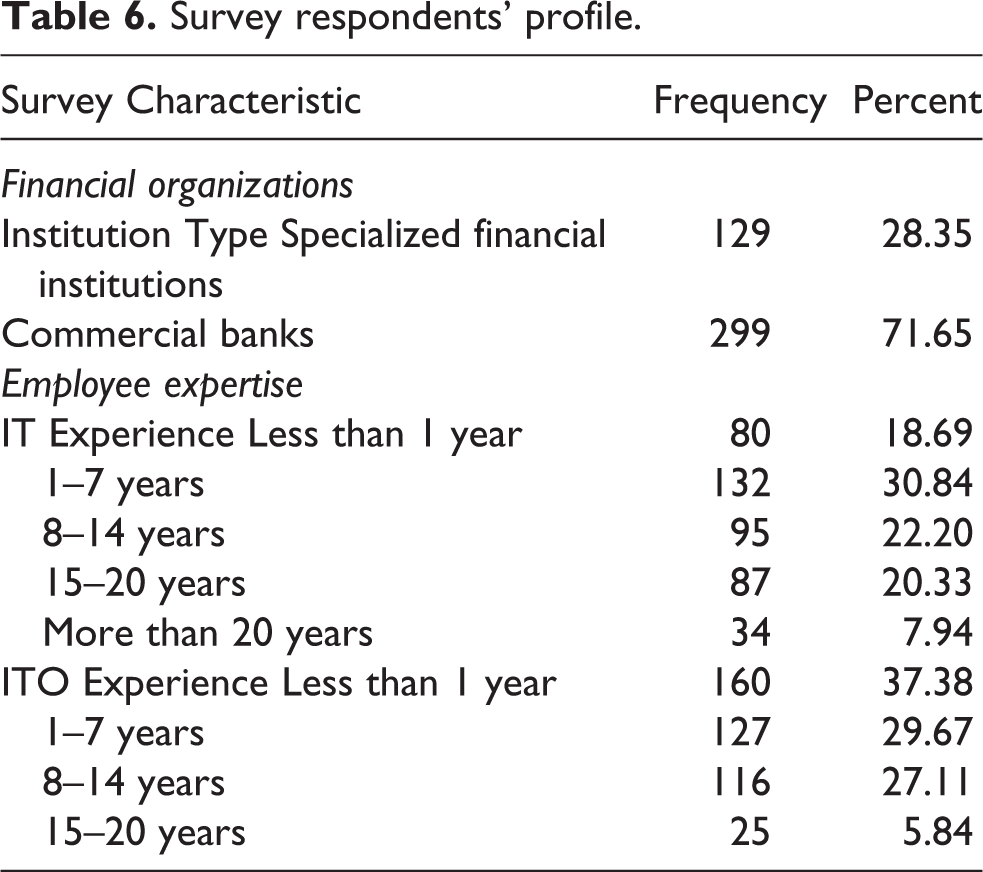
Each question item was developed from a revised framework. There were six parts in the questionnaire: participants and their organizational profiles, IT department profiles, ITO terminologies and issues, outsourcing decision process and factors, and general comments. The levels of ITO can be divided into IT activities and IT components as shown in Table 5. All firms were involved in either partial or full ITO. In total, 670 questionnaires were sent and 428 were completed and collected, yielding a response rate of 64 percent. Table 6 reports survey respondents’ profile.
Levels of ITOa (IT activities and IT components).
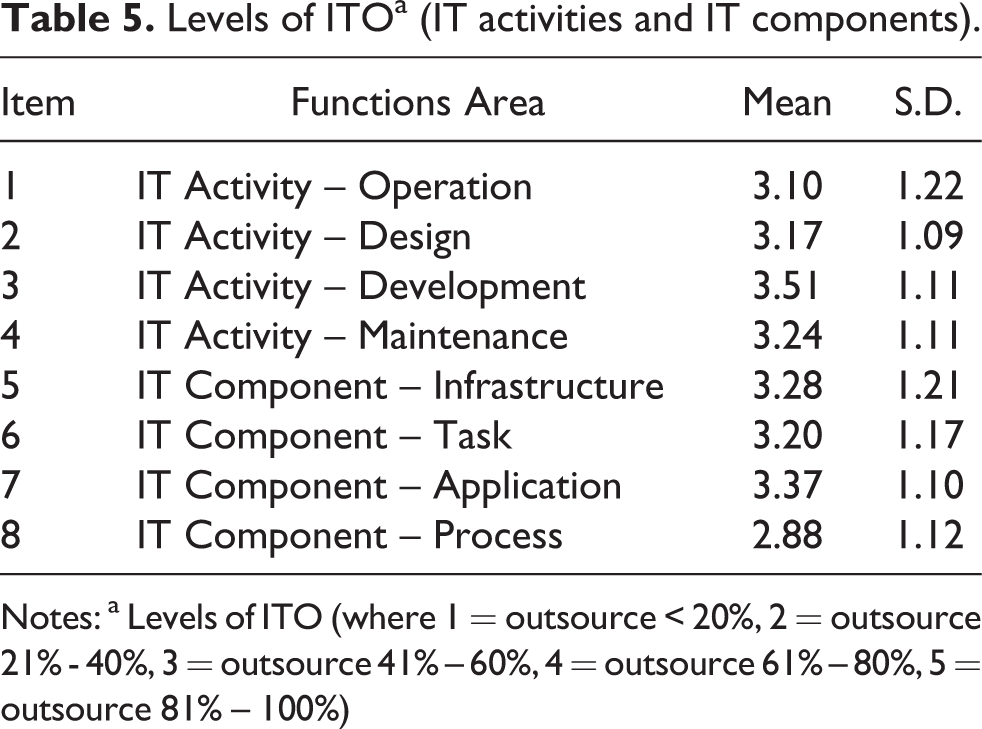
Notes: a Levels of ITO (where 1 = outsource < 20%, 2 = outsource 21% - 40%, 3 = outsource 41% – 60%, 4 = outsource 61% – 80%, 5 = outsource 81% – 100%)
Survey respondents’ profile.
Analysis and results
Exploratory factor analysis
Exploratory factor analysis (EFA) was conducted to examine common aspects and reveal certain determinants of ITO. EFA is data driven (Brown, 2006). EFA was used to identify the structure among the questionnaire items and reduce questionnaire items, by confirming items and structure suitability for each construct. Principle component analysis with varimax rotation method was used to examine the dimensionality.
According to the sample size, a cut-off factor loading of 0.5 was used to screen out items that were weak indicators of the constructs (Hair et al., 2006). The Kaiser-Meyer-Olkin (KMO) measure of sampling adequacy was 0.864, which was well above the acceptable 0.50 level. In addition, Bartlett’s Test of Sphericity indicated that there was a correlation among the variables (significant 0.000).
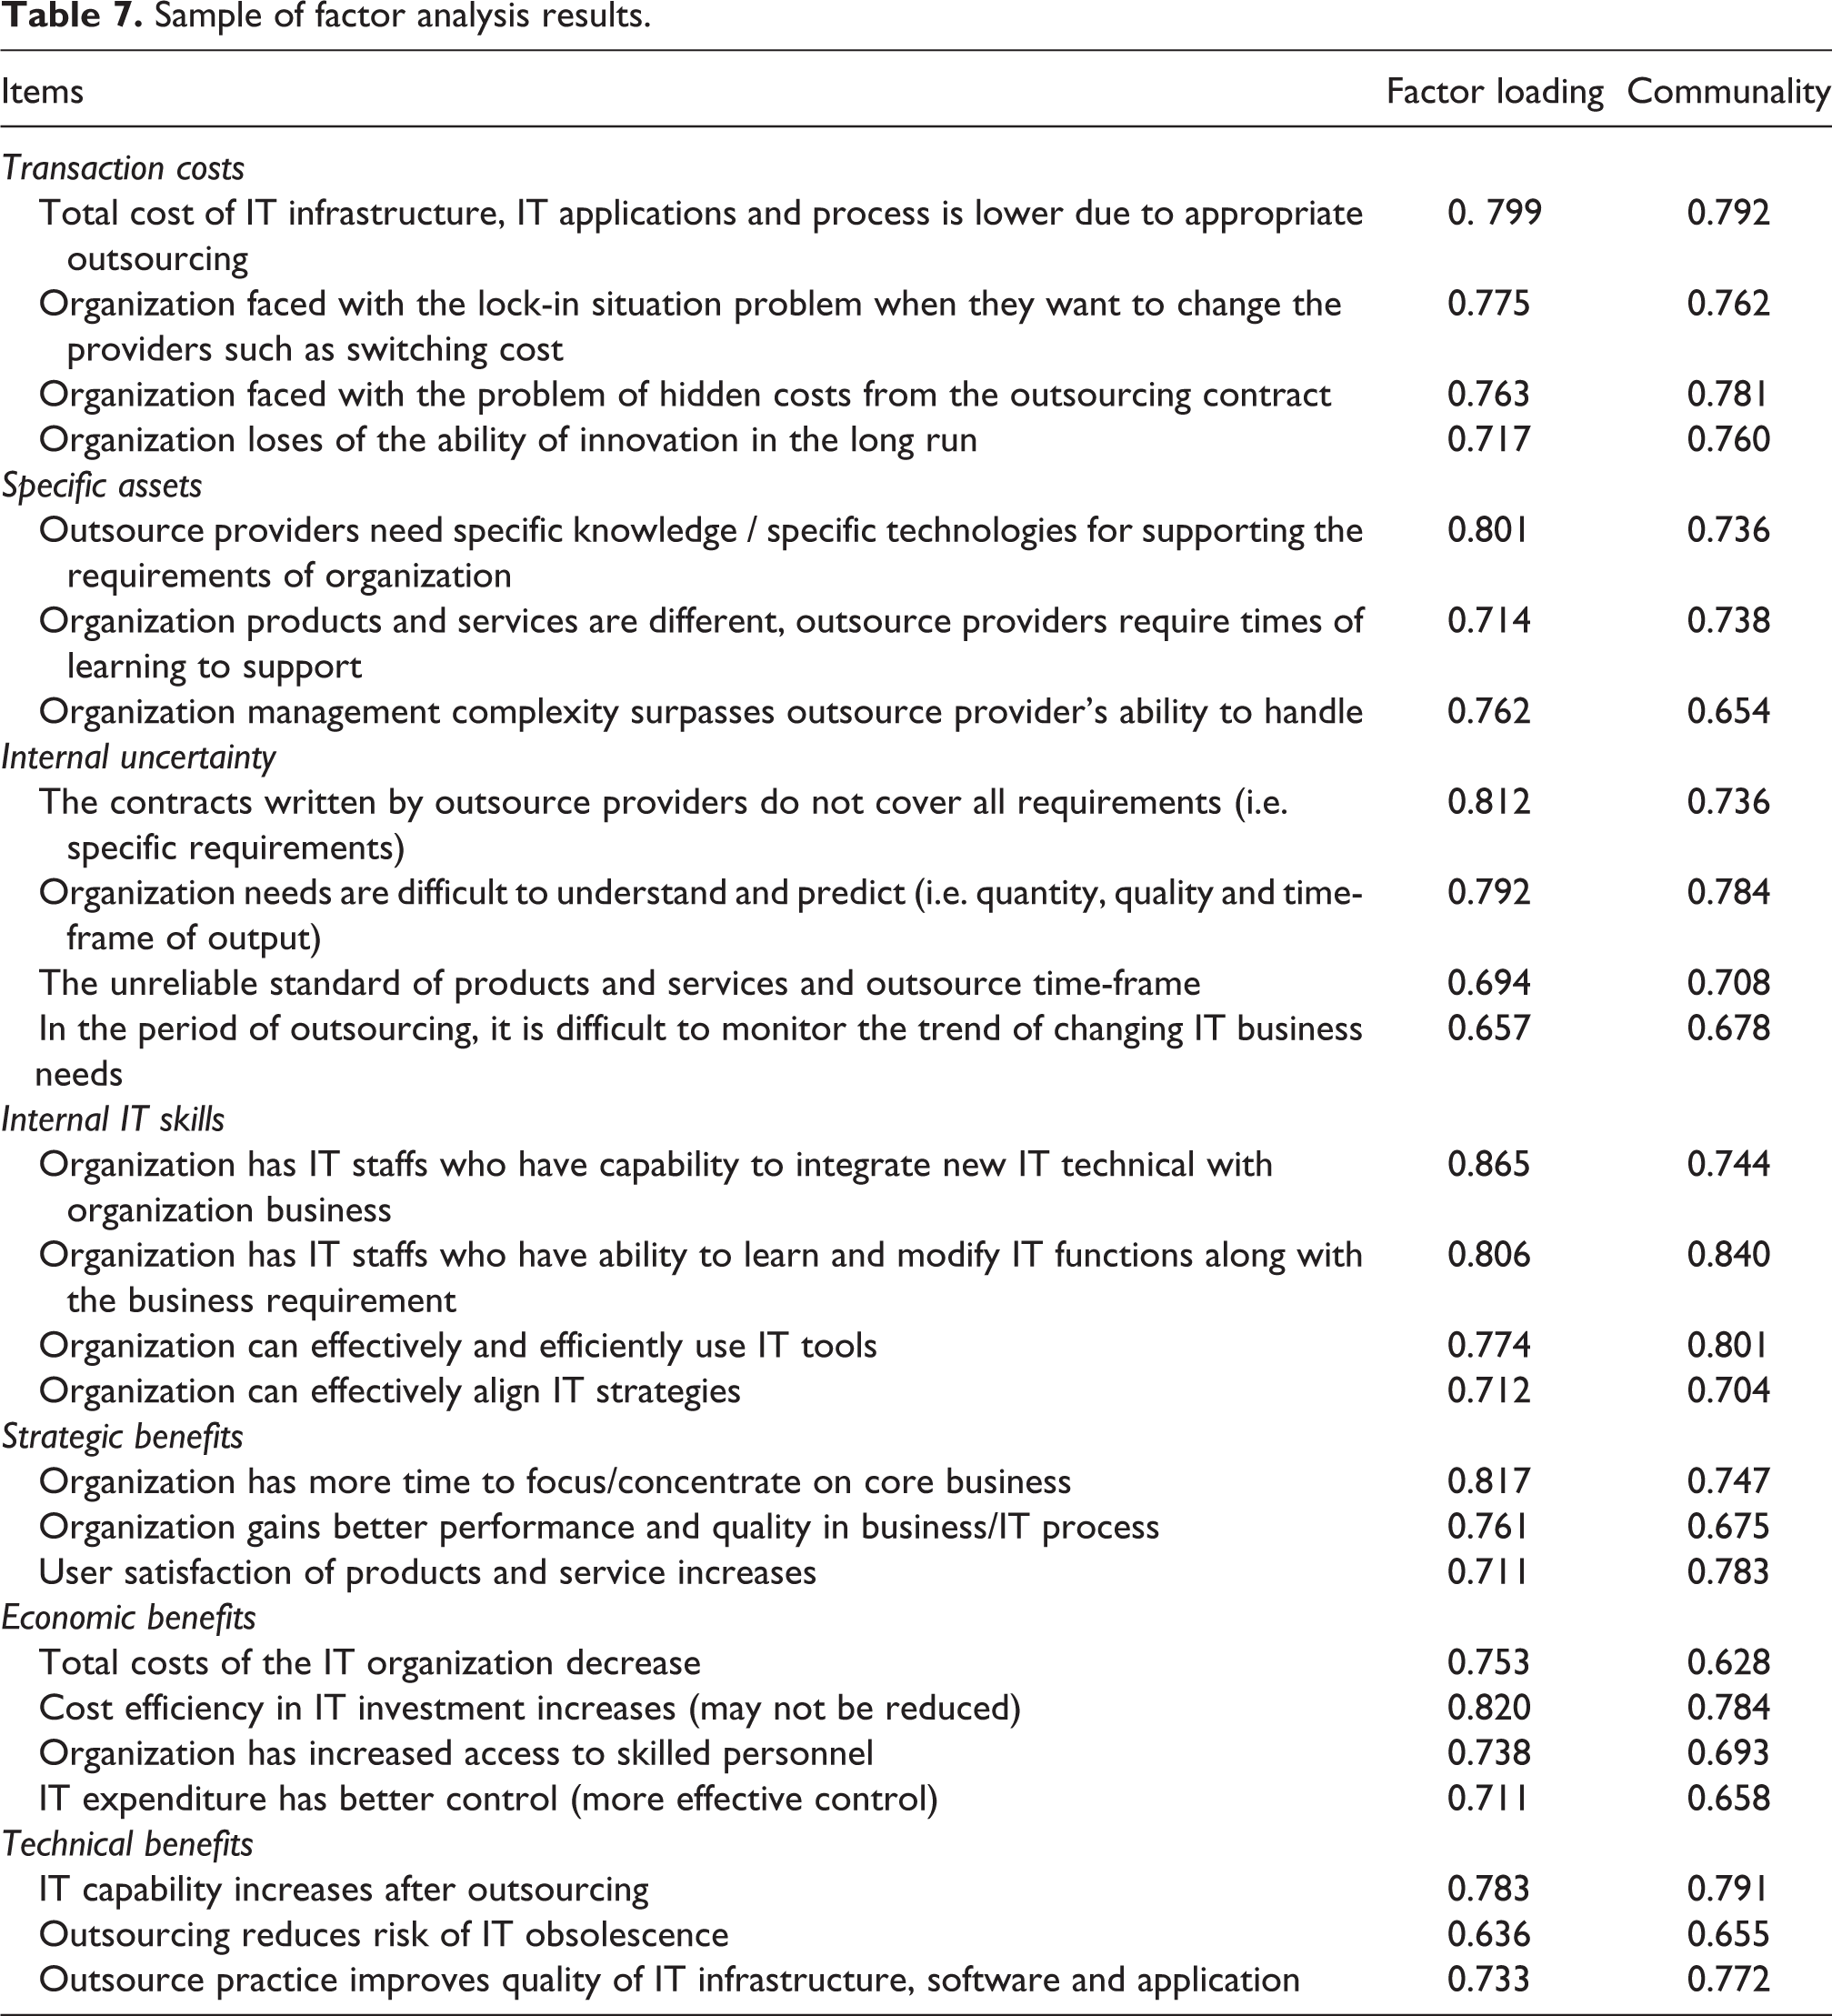
Hair, et al. (2006) suggested that as a minimum requirement the sample size should be at least five times the total number of variables. The sample size in this study met that requirement, as there was over eight times the number of samples (428) as the variables (53). Of the 55 items we started with, two items, one from transaction costs and one from specific assets, were omitted since the factor loading was less than 0.5 and Eigenvalue was greater than 1.0. Based on factor loading and communality results, the collected data was determined to be suitable to conduct factor analysis. In Table 7 sample results are reported.
Sample of factor analysis results.
The content validity of each construct was established by certifying that the measurement items were reliable, when compared with results from the literature, the three sectors represented by expert interviews, and the pilot-study testing. Cronbach’s alpha (
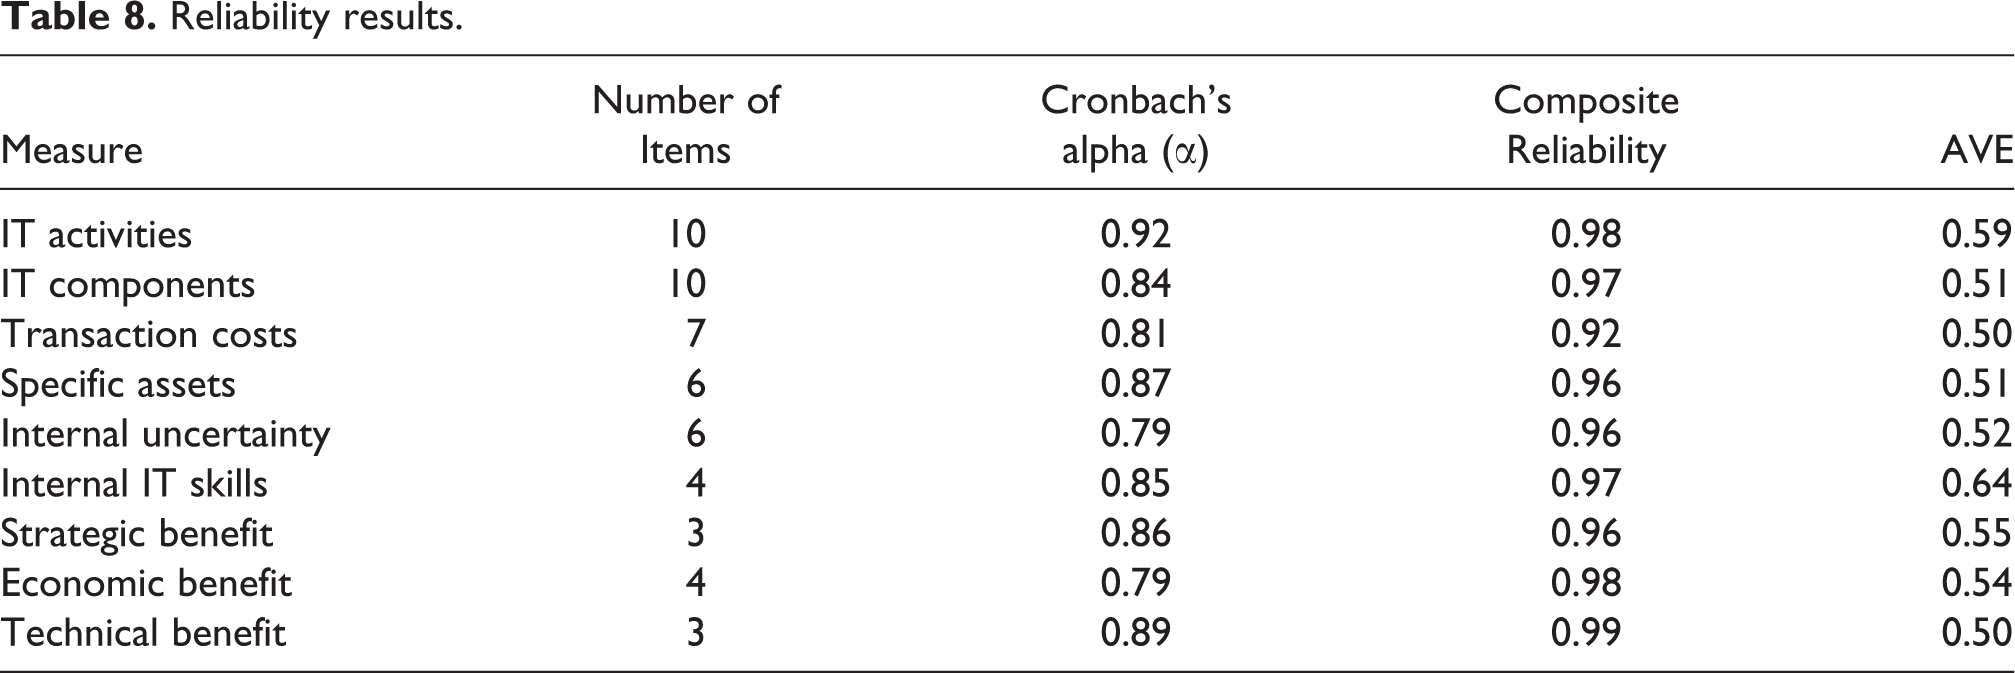
Then, convergent validity was assessed to test the construct reliability. Hair et al. (2006) defined convergent validity as “the extent to which indicators of a specific construct converge or share a high proportion of variance in common”. The composite reliability and the average variance extracted (AVE) were used. The composite reliability values ranged from 0.92 to 0.99. These are higher than the 0.7 threshold commonly used for acceptable reliability. The AVE values for the measurements ranged from 0.51 to 0.64, while the threshold is 0.5. The reliability results are reported in Table 8.
Reliability results.
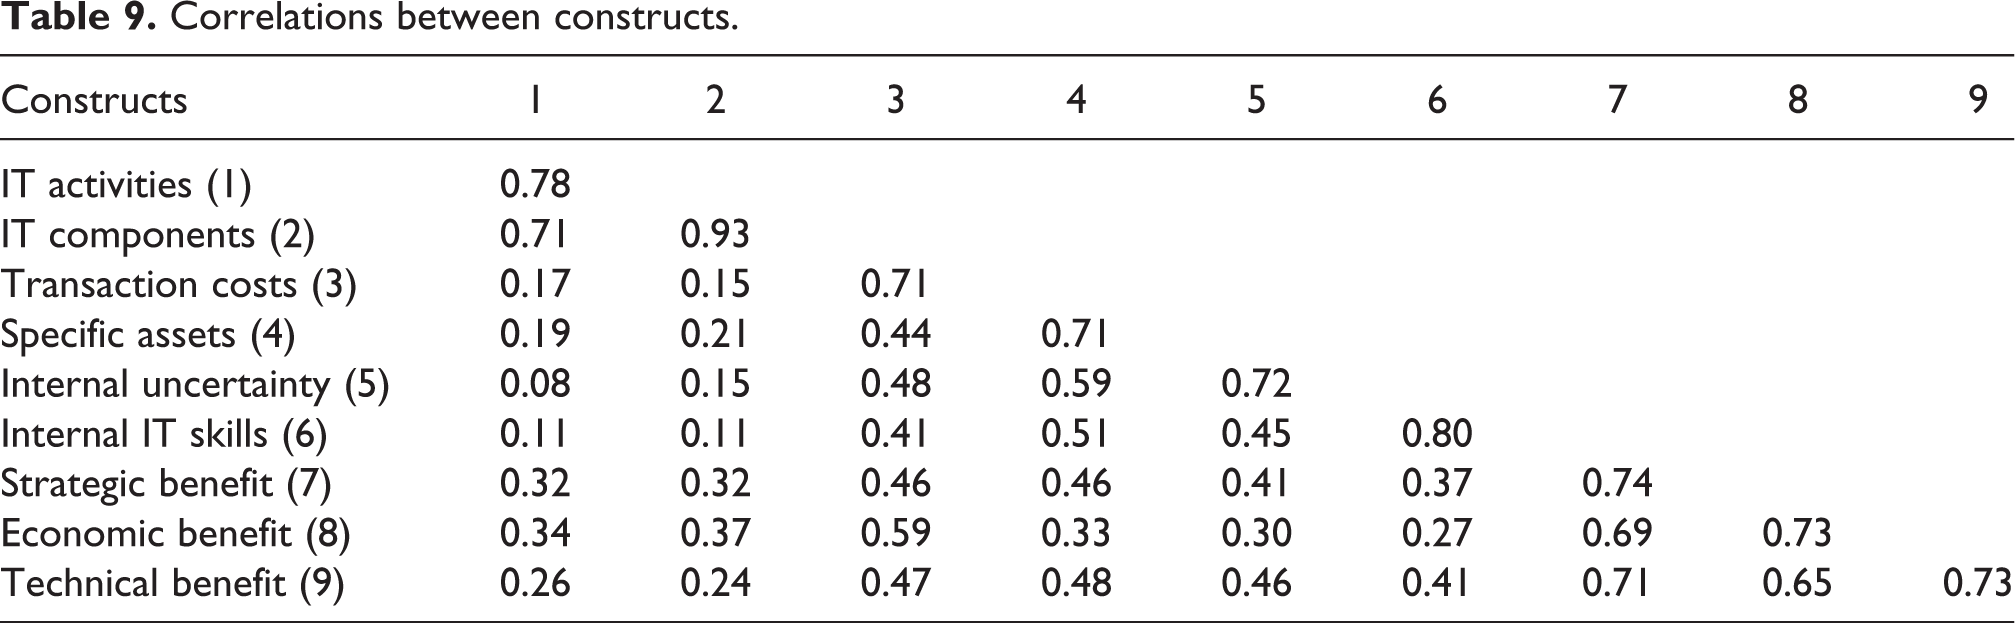
Finally, discriminant validity was analyzed via AVE by examining the square root of AVE. Hair, et al. (2006) define discriminant validity as “the extent to which a construct is truly distinct from another construct”. The rule is that variables should relate more strongly to their own factor than to another factor. The result of the square root of the AVE for each construct was greater than the correlations between all other constructs, which means that the constructs successfully passed the criteria. Table 9 presents the correlations between constructs; the values range from 0.71 to 0.93.
Correlations between constructs.
Confirmatory factor analysis
Confirmatory factor analysis (CFA) was conducted to determine the level to which alternative models explain the relationships between items in a scale. CFA is theory- or hypothesis driven (Albright and Park, 2009). CFA is most useful when the researchers test a priori models, because more effective decisions can then be made about the possibility of the target model (Thompson and Daniel, 1996). Moreover, CFA is used when the researchers have knowledge of the underlying latent variable structure (Byrne, 2001), allowing them to specify the number of factors or set the effect of one latent variable on observed variables to particular values (Albright and Park, 2009).
Since the main objective of this study is to confirm the proposed framework and hypothesized model, a measurement part and a path model will be verified separately. Based on the two-step rule, if both measurement part and structural parts of the model are identified, the overall fit of the model ensures that the data are valid enough to represent the entire model; this approach helps researcher to modify the unfitting model more easily (Kline, 2010). The structural equation modeling (SEM) technique is applied in this study because it has ability to handle both confirmative factor analysis and path model. Accordingly, AMOS 18 was employed for this purpose.
SEM is a statistical tool which takes a confirmatory approach to the analysis of a structural theory (Byrne, 2001). Therefore, SEM is a suitable method to test a theoretically derived model (Hair et al., 2006). Structural relations can be modeled pictorially to enable a more precise conceptualization of the theory under study by SEM (Byrne, 2001). The hypothesized model can be tested statistically in a real-time analysis to determine the level which is consistent with the data. If the goodness of fit is adequate, the model argues for the possibility of hypothesized relations among variables. If it is inadequate, the tenability of such relations is rejected (Byrne, 2001).
The observed variables used to predict the latent variables in SEM were obtained by processing the data in the instrument. Three types of goodness-of-fit measurements were examined: absolute fit indices, incremental fit indices, and parsimonious fit indices.
Absolute fit indices are the measurement that provides the most fundamental indication of how well the proposed theory fits the data. This measures the suitability of the previous model in terms of how it fits with the sample data (McDonald and Ho, 2002) and helps to determine if the proposed model has a better fit. To assess the absolute fit of the model, this study used the likelihood ratio Chi-square (χ2), goodness-of-fit index (GFI) and the root mean square error of approximation (RMSEA). Prior research states that RMSEA values less than 0.08 represent reasonable fit (Browne and Cudeck, 1993).
Incremental fit indices are also recommended (Hoyle, 1995; Hu and Bentler, 1998) to assess model fit. These indices compare the chi-square value of the proposed model with the baseline model (McDonald and Ho, 2002). The comparative fit index (CFI) developed by Bentler (Bentler, 1990) is one such index and assesses the improvement to fit of the hypothesized model to the null model.
Finally, parsimonious fit measures are used to diagnose the goodness-of-fit that has been achieved by analyzing the number of coefficients in the model (Mulaik et al., 1989). Table 10 presents the goodness-of-fit measures obtained for this model and illustrates how they compare to the recommended value.
Goodness-of-fit of the model.
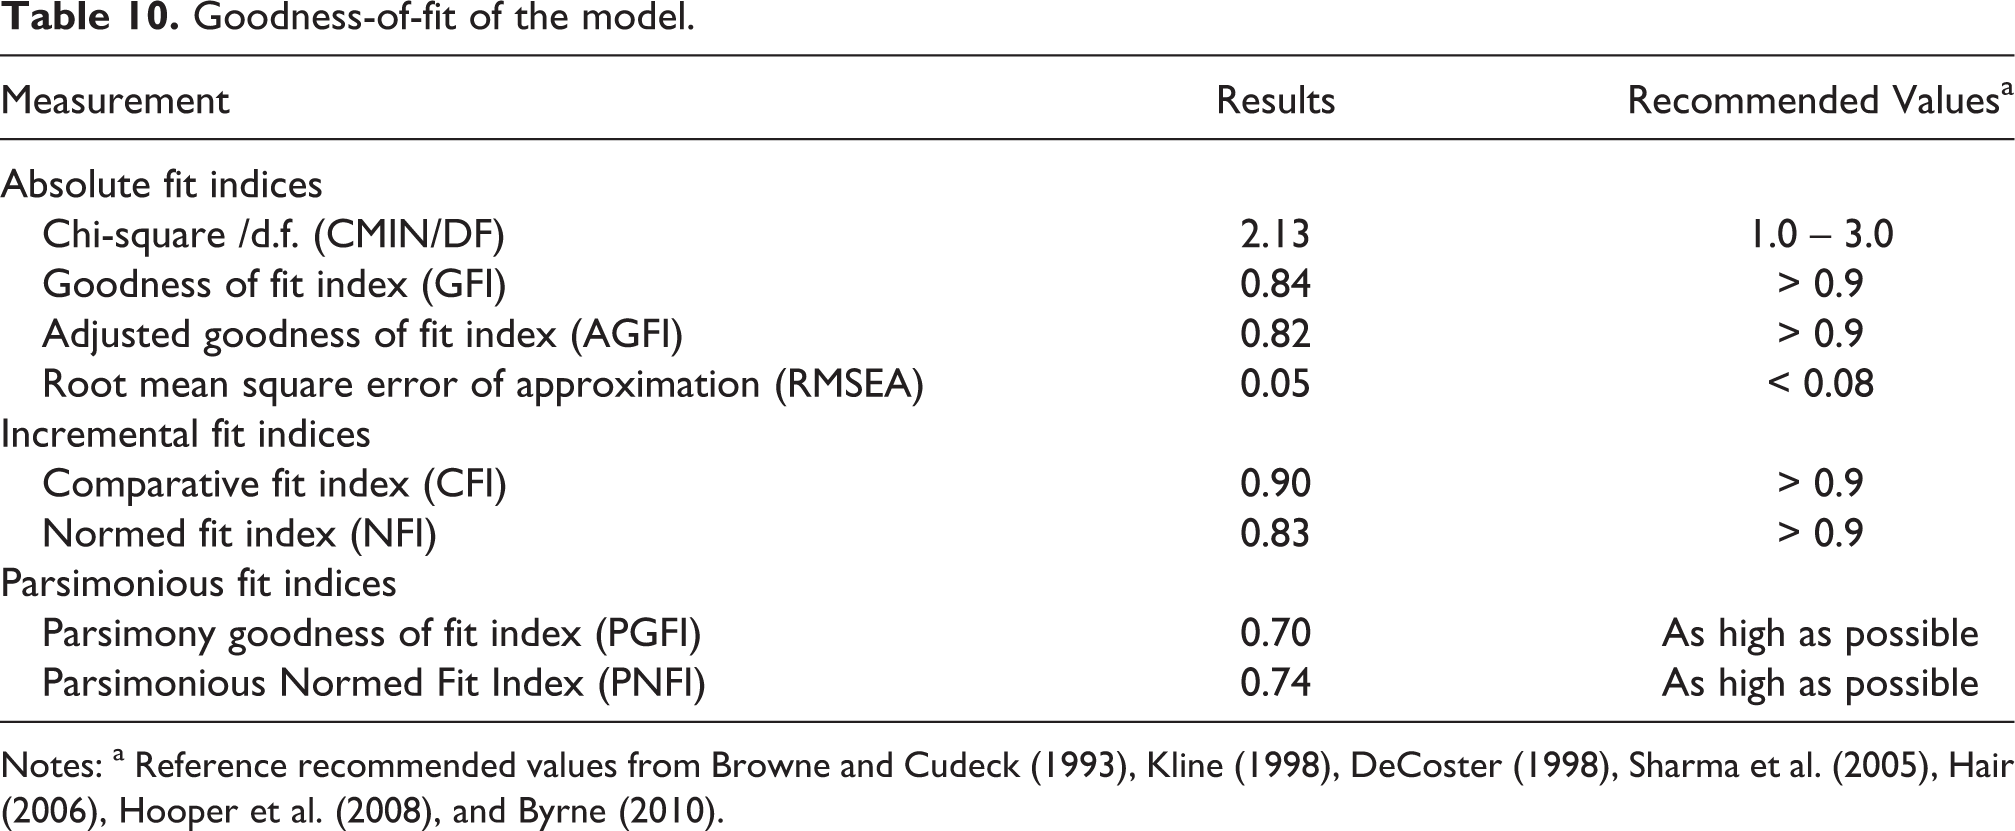
Notes: a Reference recommended values from Browne and Cudeck (1993), Kline (1998), DeCoster (1998), Sharma et al. (2005), Hair (2006), Hooper et al. (2008), and Byrne (2010).
The overall model fit appears to be quite good and acceptable. The absolute fit of the model was assessed by using the CMIN/DF, GFI, AGFI, and RMSEA. The CMIN/DF value of 2.13 was found to be within the recommended range of 1.0-3.0, indicating a reasonable model fit (Segars and Grover, 1993). The GFI, AGFI and RMSEA indices values were 0.84, 0.82 and 0.05 respectively. Among these, the GFI and AGFI values were below the commonly accepted threshold level. However, the values can fall outside recommended values with larger samples (Sharma et al., 2005; Hooper et al., 2008). The CFI was 0.90, which is within the recommended level. The PGFI was 0.70 and PNFI was 0.74. Though the results of the parsimony fit index values are considerably lower than other goodness of fit indices, a result over .50 is acceptable when the model achieves a values over 0.90 on other goodness of fit indices (Mulaik et al., 1989; Hooper et al., 2008). From the statistically derived results, it is shown that the proposed model is acceptable.
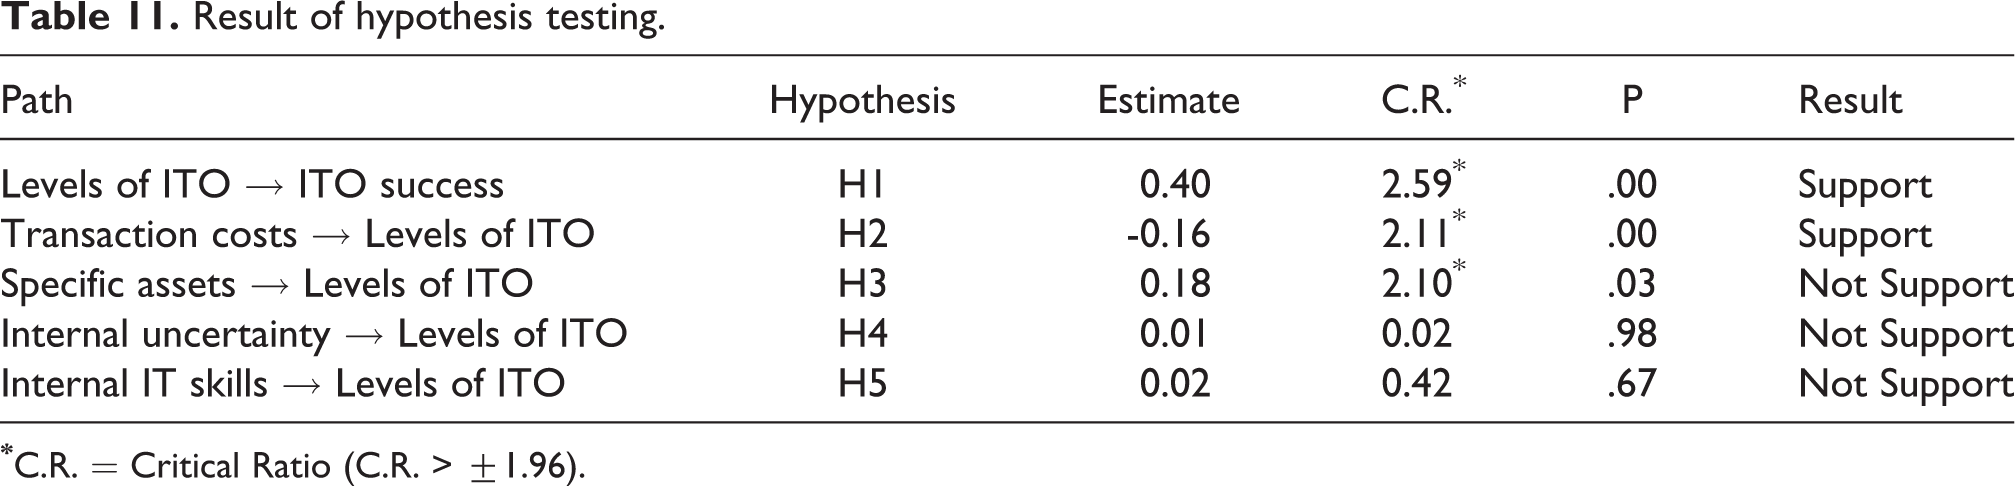
The hypotheses were estimated by using the critical ratio (C.R.) that represents the parameter estimate divided by its standard error. It operates as a z-statistic in testing that the estimate is statistically different from zero. Based on a level of confidence at 0.05, the critical ratio of the test must exceed ±1.96 in order for the relationship to be significant (Byrne, 2001; Ullman and Bentler, 2003). The statistically significant relationships among the study variables and hypothesis are shown in Figure 3 and Table 11 respectively.
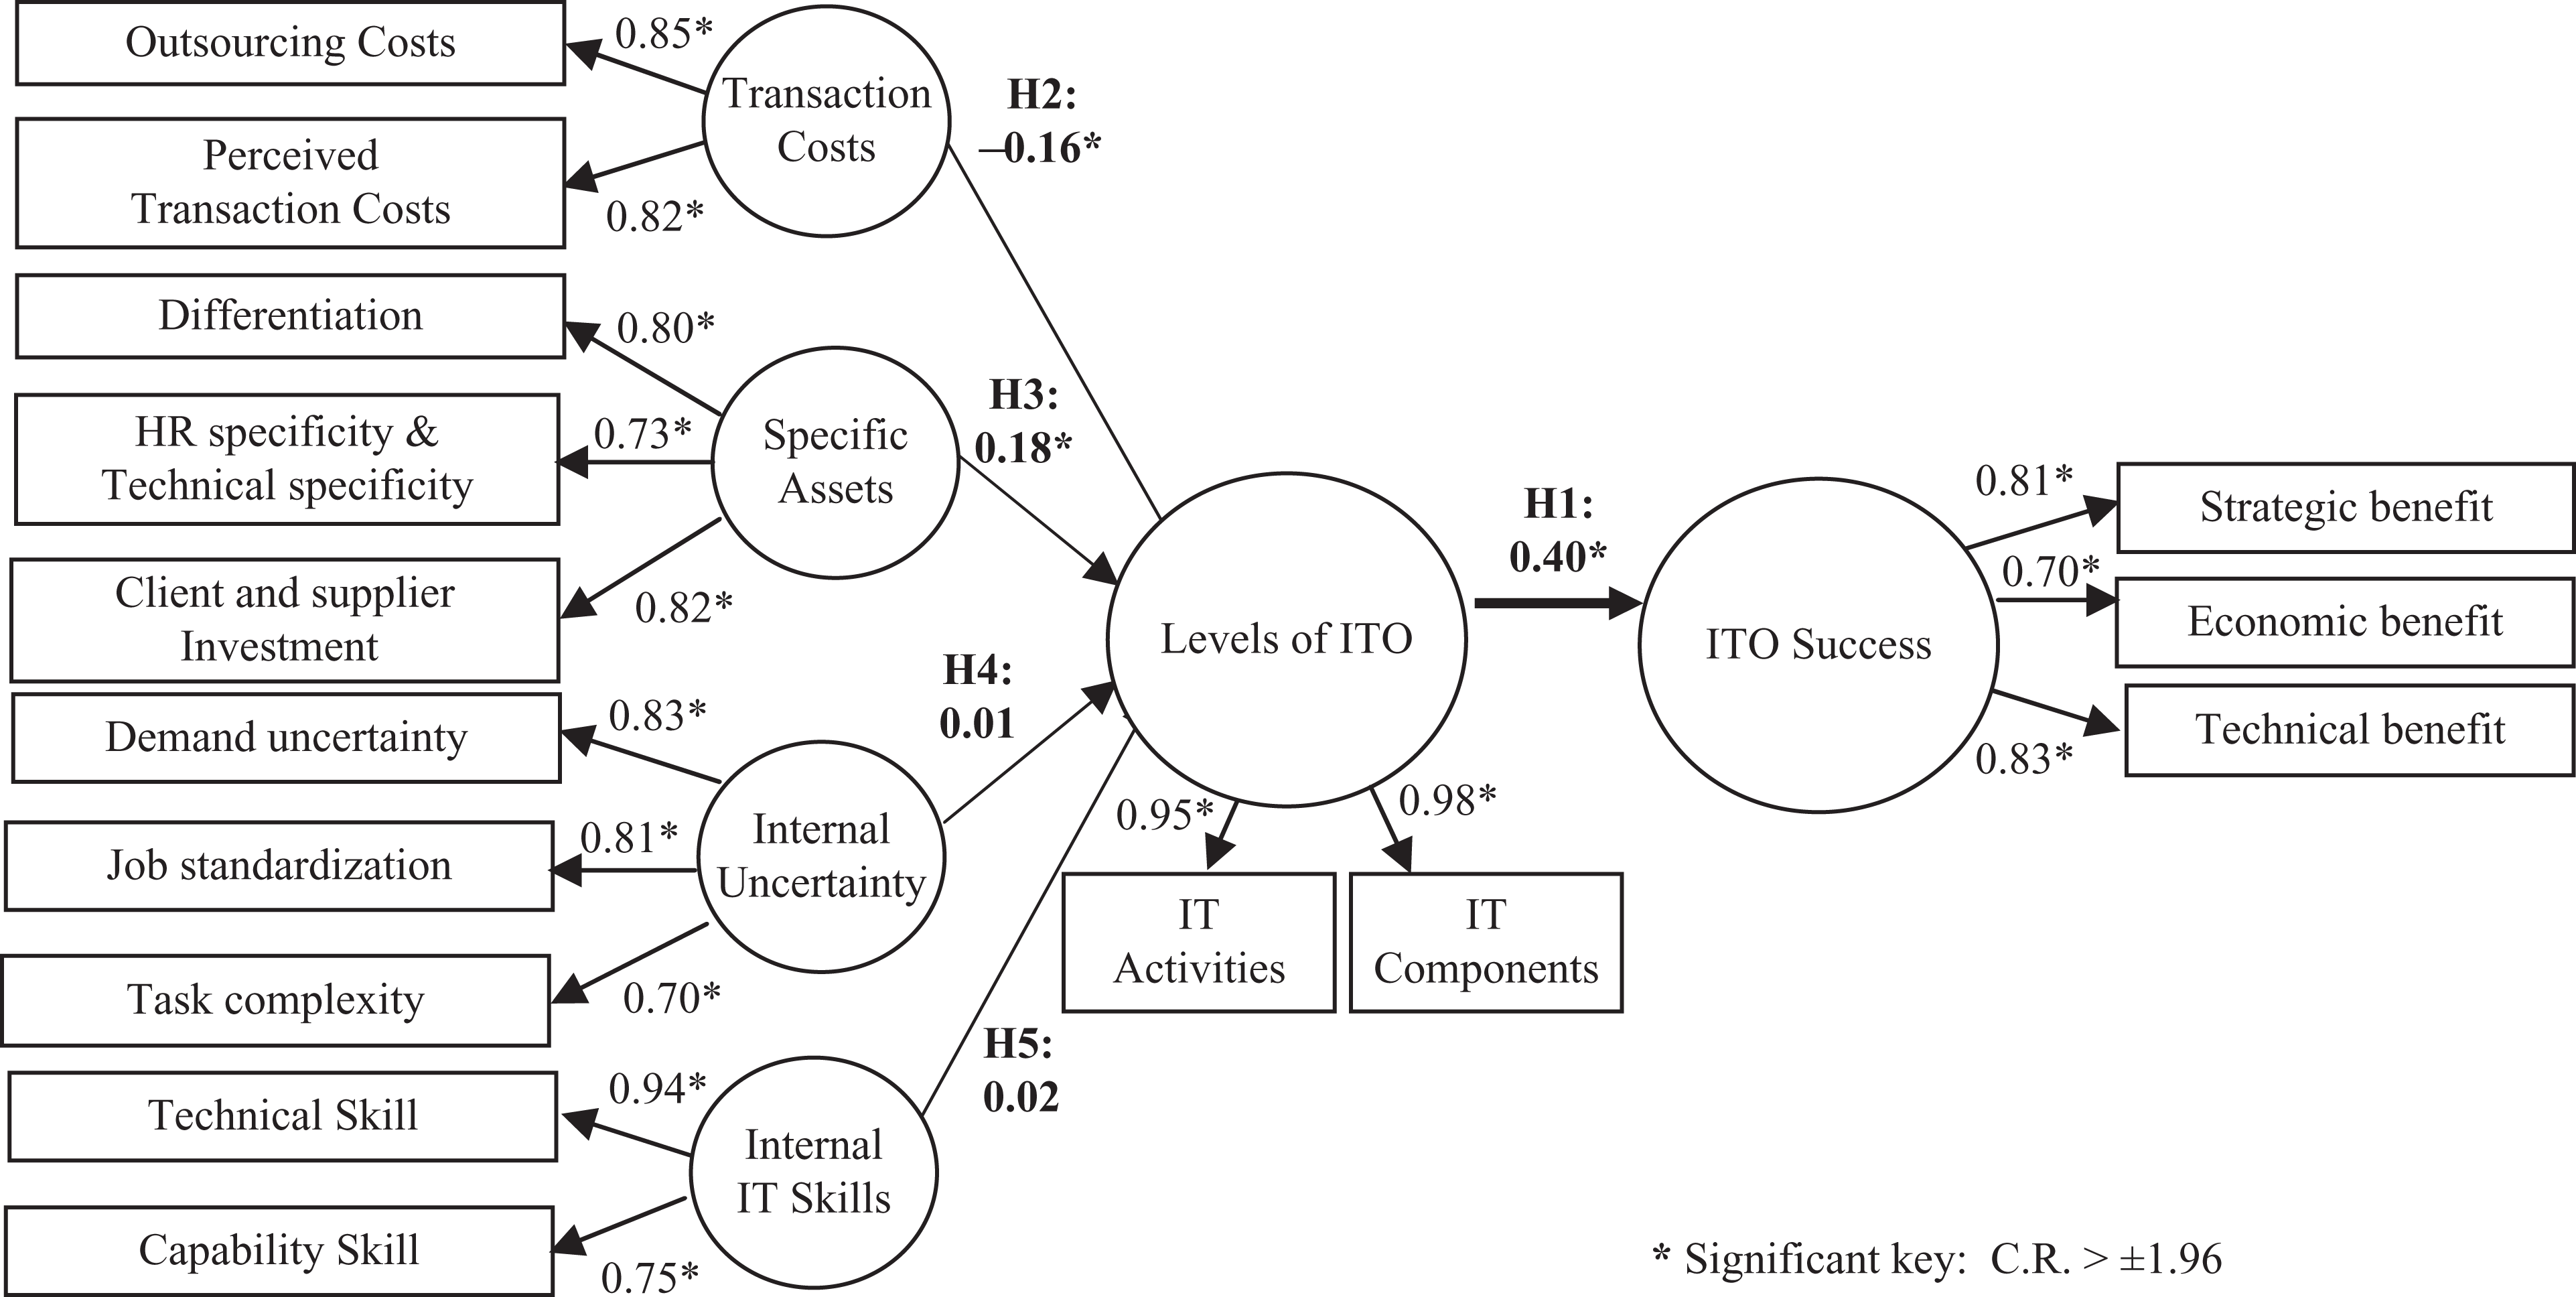
Results of the model analysis using AMOS.
Result of hypothesis testing.
Discussion
In summary, this article achieved its two main objectives. The finding confirms the positive relationship between the levels of ITO and ITO success, which is the primary objective of the study, and determined whether the drivers of the levels of ITO are the same as those in prior research, which is the secondary objective.
Figure 3 presents the research results from the SEM analysis. Three links were found to be statistically significant (C.R. > ±1.96). Firstly, the link between the levels of ITO and ITO success is statistically significant at p < 0.05 (with C.R. = 2.59). The result supports the hypothesis that the levels of ITO have a positive impact on ITO success (H1). Secondly, the link from levels of transaction costs to the levels of ITO is statistically significant at p < 0.05 (with C.R. = 2.11). The result supports the hypothesis that the levels of transaction costs have a negative impact on the levels of ITO (H2). Thirdly, the link from levels of specific assets to the levels of ITO is statistically significant at p < 0.05 (with C.R. = 2.10) but in the opposite direction from the hypothesis (H3). Lastly, two results in H4 and H5 revealed that levels of internal uncertainty and levels of internal IT skills do not have any statistically significant impacts on the levels of ITO.
As hypothesized in the main objective, the study confirmed a positive relationship between the levels of ITO and ITO success, which has not been confirmed before in previous literature. The levels of ITO are measured by percentage of IT activities and IT components to be outsourced (Gonzalez et al., 2005a; Pati and Desai, 2005).
Organizations must understand the levels of IT activities and components that should be outsourced. The appropriate levels of ITO could increase ITO success as it involves increased cost efficiency in IT investments and control and decreased total costs of IT and obsolescence risk. On the other hand, an excessive level of ITO could result in decreased ITO success as it leads to unnecessary coordination and costs.
IT activities consist of the maintenance, operation, development and design of technology (Österle and Winter, 2003). IT components include IT infrastructure, applications, tasks and processes (Zarnekow et al., 2004). It is also found that there are statistically significant positive links between IT activities and components, and levels of ITO, which indicate that organizations should consider the levels of their IT activities and components when deciding to outsource.
The most commonly used measurement of ITO success in the literature has three components: strategic benefits, economic benefits, and technical benefits (Grover et al., 1996; Lee and Kim, 1999; Lee, 2001; Jiang et al., 2006; Gottschalk and Solli-Sæther, 2006; Dahlberg and Lahdelma, 2007). Based on these three measurements, the survey results indicated strong and statistically significant ITO success shown in Figure 3.
For example, in the sense of strategic benefits, organizations could have more time to focus or concentrate on their core business and gain better performance and quality in business/IT process. Moreover, they can increase user satisfaction and productivity. Likewise, for economic benefits, total costs of the organizations’ IT could decrease and IT expenditures could be more effectively controlled in order to increase IT cost efficiency. With respect to technical benefits, organizations could increase technical know-how, IT capabilities, IT qualities (infrastructure/software/ application) while reducing the risk of IT obsolescence.
The findings based on the second objective found three results that differ from previous studies. Firstly, this study found that the link between the levels of specific assets and the levels of ITO is statistically significant but in the opposite direction from prior research. Prior research indicated that activities involving more specific assets were less likely to be outsourced (Anderson, 1988; Aubert et al., 2004). In contrast, the survey results indicate a significant positive linkage between levels of specific assets and levels of ITO. From the results, it can be implied that more differentiation on human resources and technical specificity, and greater investment from both the client and supplier will lead to greater levels of ITO. This result also suggests that firms generally choose to outsource non-core activities. Furthermore, it suggests that the activities associated with the technical skills may be carried out more effectively by outsourcing services (Aubert et al., 2004). Thus, more specific assets tend to increase the levels of ITO in the financial sector.
Secondly, the results indicate that the levels of internal uncertainty do not influence the levels of ITO. Contrary to prior research, the results suggest that firms are not much concerned about lack of information before outsourcing. These results are reinforced by the expert interviews, as their opinions showed that most decisions came from top management and were based on organizational policies, rather than actual research around IT processes, which is often performed at the department levels. Lacity and Hirschheim (1993) stated that political motivations play a significant role in the ITO decision. The interviews indicated that top management is largely driven by a number of political motives, wherein they react to the efficiency needs, and outsourcing media reports, and perceived industry trends, rather than their individual organizational IT process needs. Thus, in the case of Thailand, the uncertainty issues are found to be not statistically significant.
Thirdly, contrary to previous research, the results did not confirm a statistically significant relationship between the levels of internal IT skills and the levels of ITO. Our expert interview results indicate that most technology is constantly evolving and organizations tend to upgrade their IT platforms to keep up with the changing market. Most organizations rely on expertise from external suppliers because they do not want to invest in the education and training of new technologies (Aubert et al., 2004). Therefore, the levels of internal IT skills could have less impact on the levels of ITO.
However, our study is consistent with previous studies in that a decrease in transaction costs tends to support the increase in the levels of ITO. In a study of the US banking industry, Ang and Straub (1998) strongly support the effect of transaction costs on levels of ITO. The transaction costs analysis usually occurs before organizations decide to outsource. Transaction costs are costs incurred while gathering information during the planning stage, and continue to rise until the outsourcing process is complete. Most organizations are faced with the problems of hidden costs from the outsourcing contract (Ang and Straub, 1998; Tafti, 2005; Gewald and Dibbern, 2009). Based on the survey results and the interviews of IT experts, most organizations in Thailand are skeptical of the returns they would get from outsourcing. The overall results and implications of the study are summarized in Table 12.
Summary of findings.
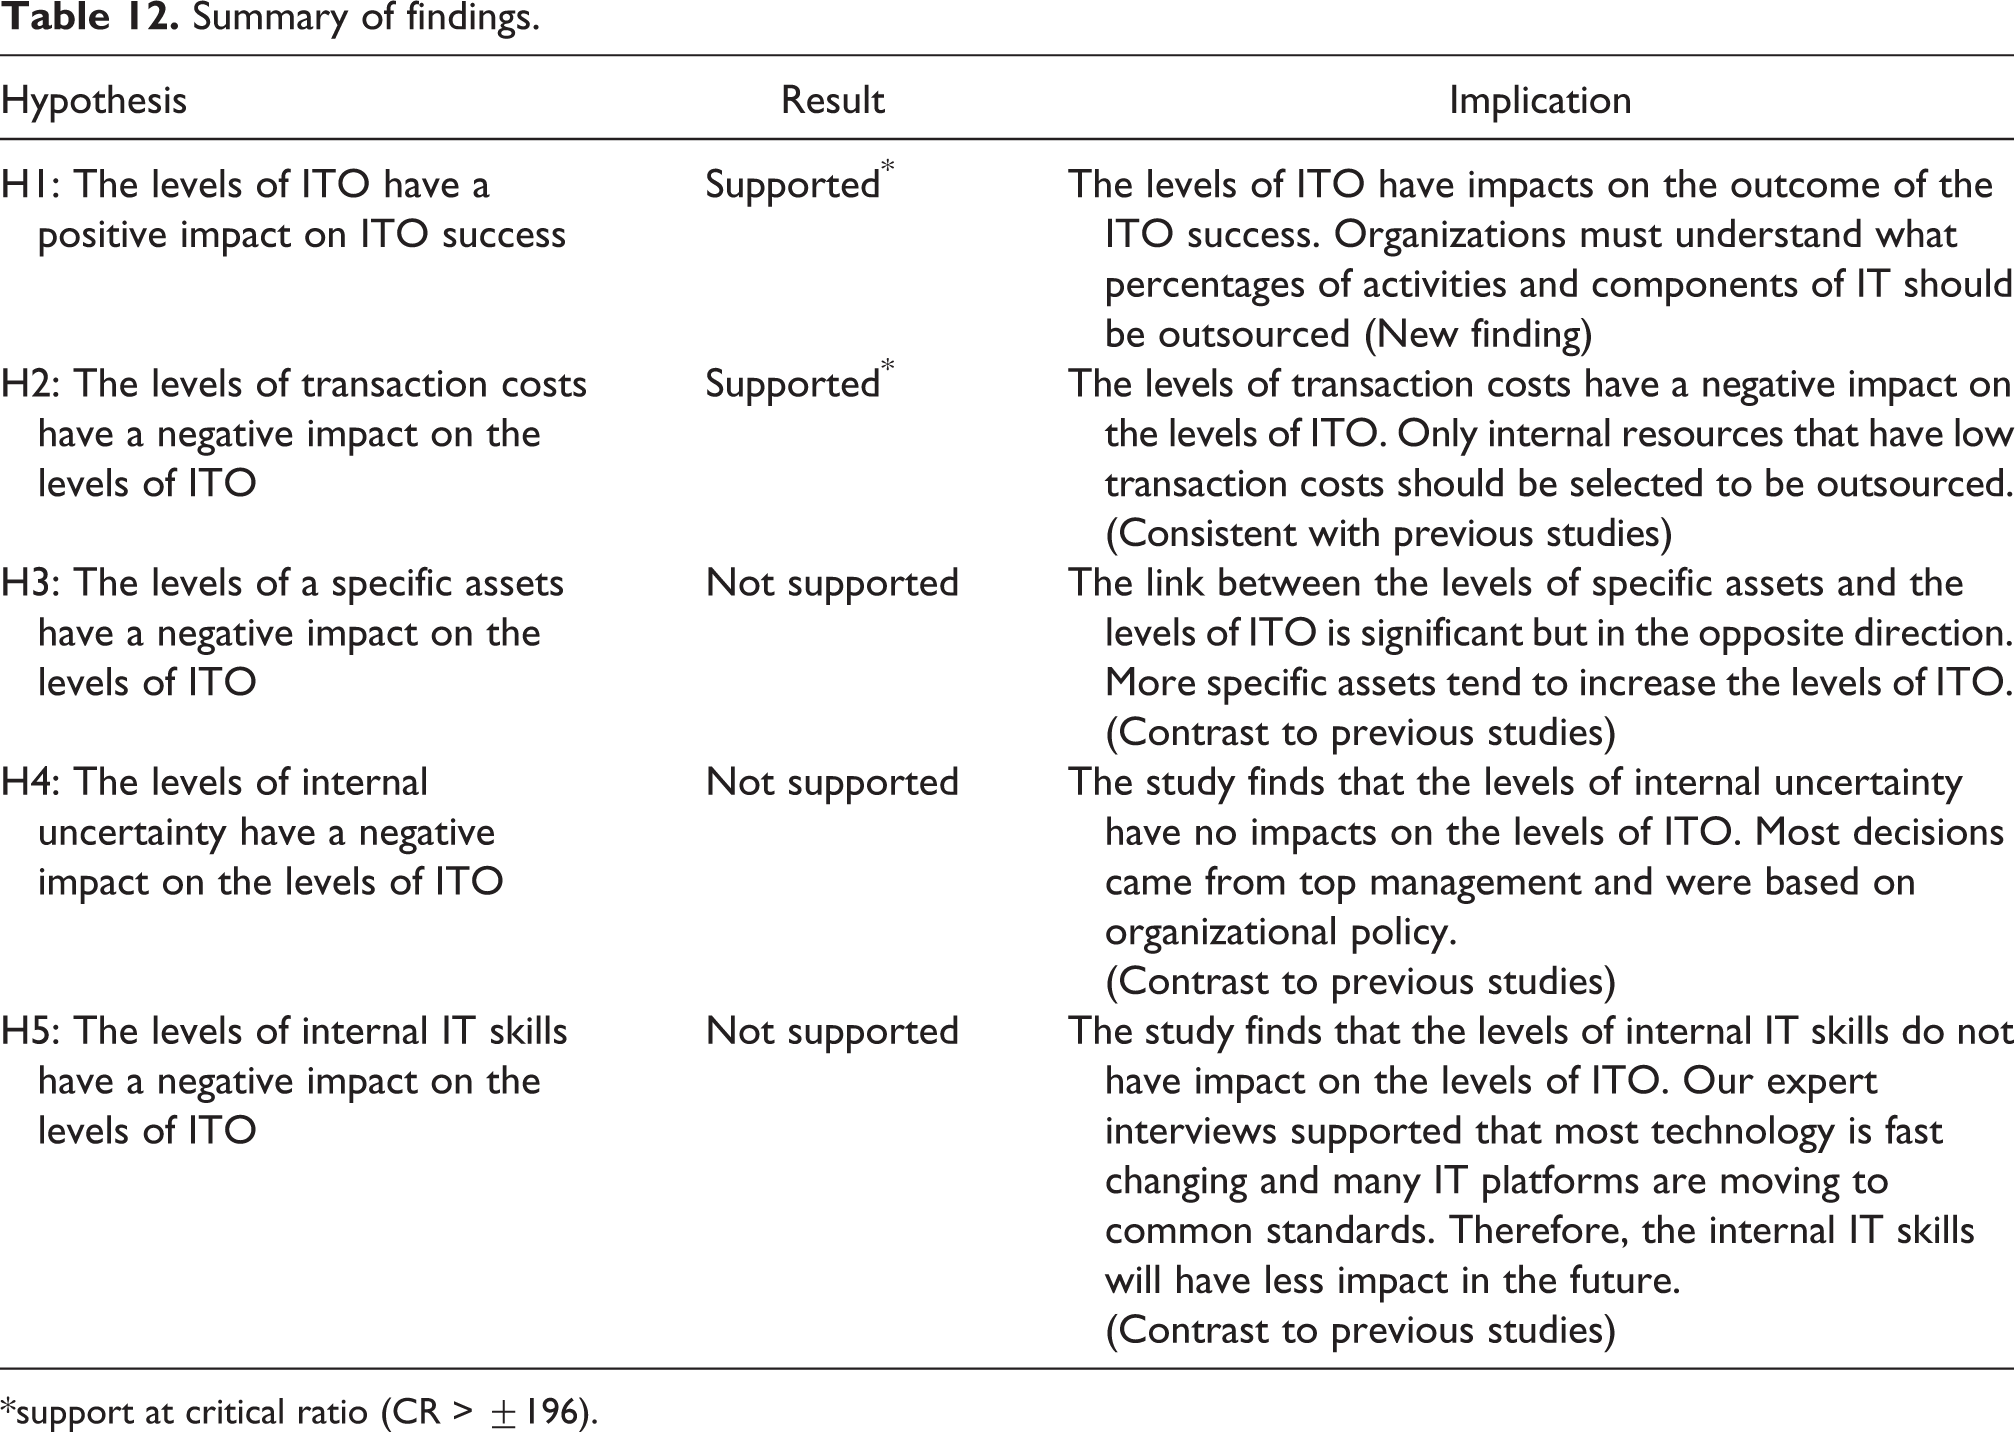
*support at critical ratio (CR > ±196).
Implications
ITO is an organizational strategy that can be applied to many business environments but it is difficult for top management to find a balance between outsourcing and insourcing. Determining the levels of ITO can be a challenge because it is difficult to predict the return. Thus, determining whether or not ITO adds value to the organization is an important management question. Researchers may use the measurements and results proposed in this study to conduct further investigation with other types of organizations or in other countries.
From a practical perspective, the findings contribute to a more thorough understanding of the ITO phenomenon for top management in an organization. ITO allows organizations to take advantage of knowledge and skills that can be obtained and transferred from the outsourcers. However, the appropriate levels of ITO have important implications for the organization (Gulla and Gupta, 2012). If organizations have high levels of ITO, it brings the risk of overdependence on outside vendors and IT security concerns. Conversely, if they decide to use low levels of ITO, it leads to poor utilization of IT resources. It is therefore necessary to understand the process of ITO before making a decision to outsource.
To illustrate this point, the top five commercial banks in Thailand have adopted different ITO procedural approaches. Bank A relied completely on internal resources. They tried to have their own staff taking care of all IT functions. Their priority was data security and did not consider any other IT issues. This approach leads to this bank’s IT functions becoming dated relative to its competitors. Bank B takes the opposite approach by outsourcing nearly all IT processes. They decided to adopt ITO, despite a lack of both ITO knowledge and ITO experience, and faced lock-in problems. This means the bank depends solely on the particular vendor’s competency to operate and is unable to find other vendors that have a similar competency. The bank has experienced limited success because of the risk of high costs associated with switching vendors.
The remaining three banks, Bank C, Bank D, and Bank E considered different levels of ITO. Each bank studied their internal IT activities and components, to see if IT activities and components are involved with their organizations’ strategies and how much should be outsourced. The activities and components that require business skills should be kept in-house. Moreover, they set specific goals and objectives for each outsourcing decision. They effectively indicated the levels of ITO that later influenced ITO success. Therefore, their success supported sustainable IT growth.
Limitations
This study provides empirical evidence from the context of a developing country, which fills a significant gap in the literature. The research found a significant relationship between the levels of ITO and ITO success. Furthermore, this study has supported the extension and further development of ITO research models.
Although the response rate among financial institutions was high and the sample distribution came close to representing Thai commercial banks and financial institutions, the samples did not represent all institution types. This is due to the fact that there are many financial institution types in Thailand, including foreign bank branches, foreign bank representatives and personal loan companies. This study focuses only on Thai-owned financial institutions, consisting of private and public financial institutions. The results may not be directly applicable to the remaining foreign financial institutions or representatives of other industries. Additionally, the result may not be applicable to other countries. Thus, replicating this model across countries and industries would help confirming and generalizing the findings.
Conclusion
This study empirically investigates the relationship between the levels of ITO and ITO success. Based on a review of the literature, expert interviews and surveys conducted, the qualitative results were confirmed by a quantitative analysis. The result fills a gap in the literature by confirming the relationship between the levels of ITO and ITO success. Moreover, the researcher proposes a model that includes the drivers of levels of ITO. Transaction costs, specific assets, percentage of IT activities and IT components all play a role in determining the levels of ITO. However, internal uncertainty and internal IT skills were not found to have significant impacts in determining the levels of ITO, and these two results differ from prior research. It is possible for future IT researchers to explore the levels of ITO and ITO success in other industries or across countries.