Abstract
Timely diffusion of IT products is critical to the success of technology companies. However, many IT products fail to attain the critical mass required for profitability. Although several studies have identified perceived usefulness as the primary factor in IT adoption, statistics indicate that some Korean consumers avoid IT products despite understanding their utility. This study empirically examines the effects of perceived risks and switching barriers on Korean non-adopters’ intention to use smartphones. The results indicate that the intention to use smartphones is generally influenced by perceived usefulness, financial risk, and cost effectiveness. Those who choose to avoid smartphones despite perceiving their usefulness have additional concerns regarding the perceived non-attractiveness of other service providers. This study samples non-adopters and analytically compares individuals with high levels of smartphone utility perception and varying levels of smartphone usage intention, thereby providing insights to organizations for customizing products and marketing approaches to tap into this market niche.
To increase the adoption rate of smartphones perceived risks and switching barriers need to be reduced
Introduction
Continuous technological innovation and diversified customer demand have increased the speed at which new IT products and services appear in the market. However, only a small proportion of these products and services achieves a critical mass and secures sufficient numbers of users to generate profits (Ahn et al., 2005). Delay or failure in market diffusion has significant impact on the survival and growth of companies, the competitiveness of business ecosystems, and user welfare (Rogers, 1995). As such, it is critical that IT products receive high acceptance and adoption rate.
A key factor that affects users’ intention to adopt an IT product or services is perceived usefulness (Davis, 1989; Hsu et al., 2013). However, technology adoption statistics in Korea show that some consumers choose not to use IT products despite understanding their values. According to the Korea Internet and Security Agency’s (KISA) annual report on public Internet use (KISA, 2009), 29.2 percent of non-mobile Internet users actually do see the Internet as being useful. Similarly, the Electronics and Telecommunications Research Institute (ETRI, 2009) reported that 26.8 percent of non-WiBro (Wireless Broadband Internet) users comprehend the usefulness of the product. Clearly, consumer perception of usefulness does not always translate into actual adoption. Therefore, there is a need to explore adoption barriers to fully understand why consumers choose not to use certain IT products and services despite perceiving the associated usefulness.
Two types of important adoption barriers are perceived risks and switching barriers. Existing research (e.g., Featherman and Pavlou, 2003; Liao and Cheung, 2001; Ram and Sheth, 1989; Teng et al., 2009) has looked at the impact of these two barriers on intention to adopt. However, these researches stay at a general level and have not explored the sub-dimensions of both perceived risks (Im et al., 2008) and switching barriers (Shin et al., 2008) in the context of smartphone adoption. Specifically, research on perceived risks focuses primarily on physical risks such as security issues, while research on switching barriers mostly concentrates on changing service providers (Aydin and Ozer, 2005; Aydin et al., 2005; Burnham et al., 2003; Ranaweera and Prabhu, 2003) but not products. Therefore, we ask what roles do perceived risks and switching barriers (as well as specific sub-dimensions of each factor) play in influencing the intention to use smartphones among non-adopters, especially among those who have high level of perceived usefulness toward the devices.
Smartphone is selected as our research object for its commonality and wide adoption rate. Currently, a total of 61.2 percent of South Korean mobile subscribers use smartphones (KIA, 2012). Furthermore, the Korean mobile device market is regarded as the one of the fastest growing markets in the world and thus serves as a good framework to understand adoption of smartphones in other countries.
The remainder of this paper is organized as follows. The next section describes the context of smartphone adoption in Korea, describes the TAM framework, and proposes the research model and hypotheses. The following two sections present the research methodology and results. The final section discusses the findings, contribution, implications and research limitations.
Smartphone adoption
Smartphone adoption in Korea
Even before full scale smartphone diffusion took place in Korea, the prerequisites for the market growth already existed. At the national level for mobile Internet infrastructure, Korea is the world’s highest and one of the first countries in the world to commercialize HSDPA service (an upgraded version of WCDMA) (ITU, 2010). Aggressive marketing by service providers saw the majority of users switching from 2G service to 3G service. In 2006, Mobile WiMAX (wireless high-speed Internet) commenced service for the first time in the world and the number of WiFi zones in Korea reached 66,000 (6th in the world) in October 2010 (KCC, 2010).
Thanks to these advanced infrastructures and business activities, there are 53.6 million subscribers to Korean mobile communications as of December 2012, which equals to a penetration rate of 106.7 percent. This figure is the highest in the world if the lack of a prepaid communications service market in Korea is taken into consideration (IT Stat, 2012; KISA, 2012). The number of 3G users is 27.1 million, which is 50.5 percent and the number of 4G LTE users is 15.8 million, which is 29.4 percent of all mobile communications subscribers respectively (IT Stat, 2012).
An advanced mobile communications network and significant numbers of mobile Internet users are the starting point for smartphone diffusion in Korea. Since the leading Korean communication company, KT, commenced its supply of Apple’s iPhone in late 2009, the number of smartphone users has increased dramatically every month from 0.74 million at the end of 2008 to 30 million in August 2012. This figure accounts for 60 percent of all mobile communications users (IT Stat, 2012).
The monthly ARPU (Average Rate per User) of smartphones is also greater than that of conventional mobile phones due to active usage of mobile Internet. According to the global IT research company, Informa Telecoms and Media (2010), the monthly ATPS (Average Traffic per User) for smartphones in Korea is 271 MB, which is significantly higher than that of Japan (199 MB) or the global average (85 MB). The IR report for the third quarter of 2010 by KT shows the monthly ARPU of mobile data access by all subscribers to be KRW 8,000 while the ARPU of smartphones is more than 2.5 times higher at KRW 20,000.
Smartphone diffusion in Korea is forecasted to increase significantly in the near future. Global IT hardware manufacturers in Korea constantly release diverse models of smartphones to meet market demand. Combined with active marketing from communication service providers and a high user demand for mobile Internet, smartphone penetration is expected to reach 70 percent of all mobile communications users by the end of 2013 (KIA, 2012). IDC (2013) forecasts that worldwide smartphone sales (50.1 percent) will be higher than feature phone sales (49.9 percent) in 2013.
Technology Acceptance Model
Founded on Ajzen and Fishbein’s (1980) Theory of Reasoned Action (TRA) and Ajzen’s (1985) Theory of Planned Behavior (TPB), the Technology Acceptance Model (TAM) explains the factors that influence users’ intention to adopt a technology (Davis, 1989). It posits that perceived usefulness and perceived ease of use determine one’s intention to use technology with the former exerting stronger effect than the latter. Perceived ease of use also has an indirect impact on intention via perceived usefulness. Over the years, research has attempt to extend TAM via three approaches: examining antecedents and moderators of perceived usefulness and perceived ease of use, adding new belief factors, and introducing factors from related models (Wixom and Todd, 2005).
Perceived usefulness
Perceived usefulness is defined as ‘‘the prospective user’s subjective probability that using a specific application system will increase his or her job performance within an organizational context’’ (Davis, 1989). It is the core determinant underlying technology adoption behavior (Gefen and Straub, 2000; Moon and Kim, 2001). Applied to the context of smartphone adoption, a consumer who believes that using a smartphone will increase his or her effectiveness in carrying out tasks will have higher likelihood of using the device. H1: Perceived usefulness of smartphones positively influences the intention to use the devices.
Eliciting sub-dimensions of perceived risks and switching barriers
Just as external beliefs in TPB and TRA (Ajzen and Fishbein, 1980), sub-dimensions of perceived risks and switching barriers are scenario specific and need to be extracted for each context. Hence we conducted a focus group discussion with three IT experts who have more than five years of IT research experience to elicit sub-dimensions of perceived risks and switching barriers. The resulting sub-dimensions for perceived risks are financial risk and device risk while the sub-dimensions for switching barriers are benefit loss cost, learning cost and attractiveness of other service providers.
Perceived risks
Perceived risk refers to ‘a consumer’s belief about the potential uncertain negative outcomes from the transaction’ (Kim et al., 2008). Cunningham (1967) classified six types of perceived risk: financial, performance, physical, psychological, social, and time/opportunity. Featherman and Pavlou (2003) studied financial, performance, psychological, social, time, privacy, and the overall risks. Previous research (e.g., Cheong and Park, 2005; Featherman and Pavlou, 2003; Lee, 2009; Liao and Cheung, 2001; Park et al., 2004; Teng et al., 2009; Wu and Wang, 2005) found that perceived risk negatively influences one’s intention to use technology. These researches model the relationship between perceived risk and intention in two ways: direct link between perceived risks and intention, and perceived risk acting as a moderator between perceived usefulness and intention to use (Grewal et al., 1994; Im et al., 2008).
In the case of smartphone adoption, perceived risk is also believed to have effect on consumers’ intention to use the device. This effect can be a direct effect or a moderating effect between perceived usefulness and intention to use. As mentioned before, via the focus group discussion session, two sub-dimensions of perceived risks were extracted for the context of smartphone adoption: perceived financial risks and perceived device risk. Perceived financial risk refers to extra expenses in monetary form incurred by consumers as a result of using smartphones (Featherman and Pavlou, 2003). Perceived device risk refers to risks associated with the performance and physical characteristics of a smartphone such as product defect or malfunctioning (Mitchell, 1999). We hypothesize that the higher consumers perceived financial and device risk, the lower their intention to use smartphones. Even when consumers comprehend the usefulness of smartphones, perceived financial risk and device risk will reduce their intention to use smartphones. H2a: Perceived financial risk of smartphones negatively influences the intention to use the devices. H2b: Perceived device risk of smartphones negatively influences the intention to use the devices. H3a: Perceived financial risk of smartphones moderates the relationship between perceived usefulness and intention to use the devices. H3b: Perceived device risk of smartphones moderates the relationship between perceived usefulness and intention to use the devices.
Switching barriers
Switching barrier was conceptualized by Fornell (1992) to explain customer satisfaction and retention. It has a customer loyalty focus to explain why dissatisfied customers do not switch to other product/service providers (Kim et al., 2004). Switching barrier has ten facets (Fornell, 1992): search costs, transaction costs, learning costs, loyal customer discounts, customer habit, emotional cost, cognitive effort, financial risk, social risk, and psychological risks. Existing research on switching barriers primarily focuses on changing of service providers (Aydin and Ozer, 2005; Aydin et al., 2005; Burnham et al., 2003; Ranaweera and Prabhu, 2003); few have looked at switching product subscription (Kim et al., 2004; Shin et al., 2008). Furthermore, to the knowledge of the authors, no existing research has looked at switching barriers in IT adoption in general, and in adoption of smartphones in particular.
Just as in the extraction of sub-dimensions for perceived risks, the focus group discussion identifies three sub-dimensions of switching barriers for smartphone adoption: perceived benefit loss cost, perceived learning cost, and perceived non-attractiveness of other service providers. Perceived benefit loss cost is the perception of reduced benefits caused by the act of switching to smartphones (Kim et al., 2004). Perceived learning cost is the perception of the cost involved in learning to use a new device when switching to smartphones (Mukherjee and Hoyer, 2001). Perceived non-attractiveness of other service providers refers to the lack of appeal in switching to another service provider (Aydin and Ozer, 2005).
When consumers contemplate switching from conventional phones to smart phones, the three identified switching barriers act as deterring factors that negatively influence their intention to use smartphones. When consumers see that they will lose certain benefits as a result of adopting smartphones, they will have lower intention to use the devices. Similarly, when they see difficulties or troubles in learning to use smartphones, they are less likely to adopt smartphones. In Korea, a particular smartphone device is only provided by a specific communication service provider. This results in non-attractiveness of other smartphone providers that in turn affects user intention to switch from their existing conventional phones to smartphones. We argue that even when consumers understand the usefulness of smartphones, the present of perceived benefit loss cost, perceived learning cost, and perceived non-attractiveness of other smartphone service providers will reduce their intention to use smartphones. Therefore, H4a: Perceived benefit loss cost of smartphones negatively influences the intention to use the devices. H4b: Perceived learning cost of smartphones negatively influences the intention to use the devices. H4c: Perceived non-attractiveness of other smartphone service providers negatively influences the intention to use smartphones. H5a: Perceived benefit loss cost of smartphones moderates the relationship between perceived usefulness and intention to use the devices. H5b: Perceived learning cost of smartphones moderates the relationship between perceived usefulness and intention to use the devices. H5c: Perceived non-attractiveness of other smartphone service providers moderates the relationship between perceived usefulness and intention to use smartphones.
Figure 1 shows the research model.
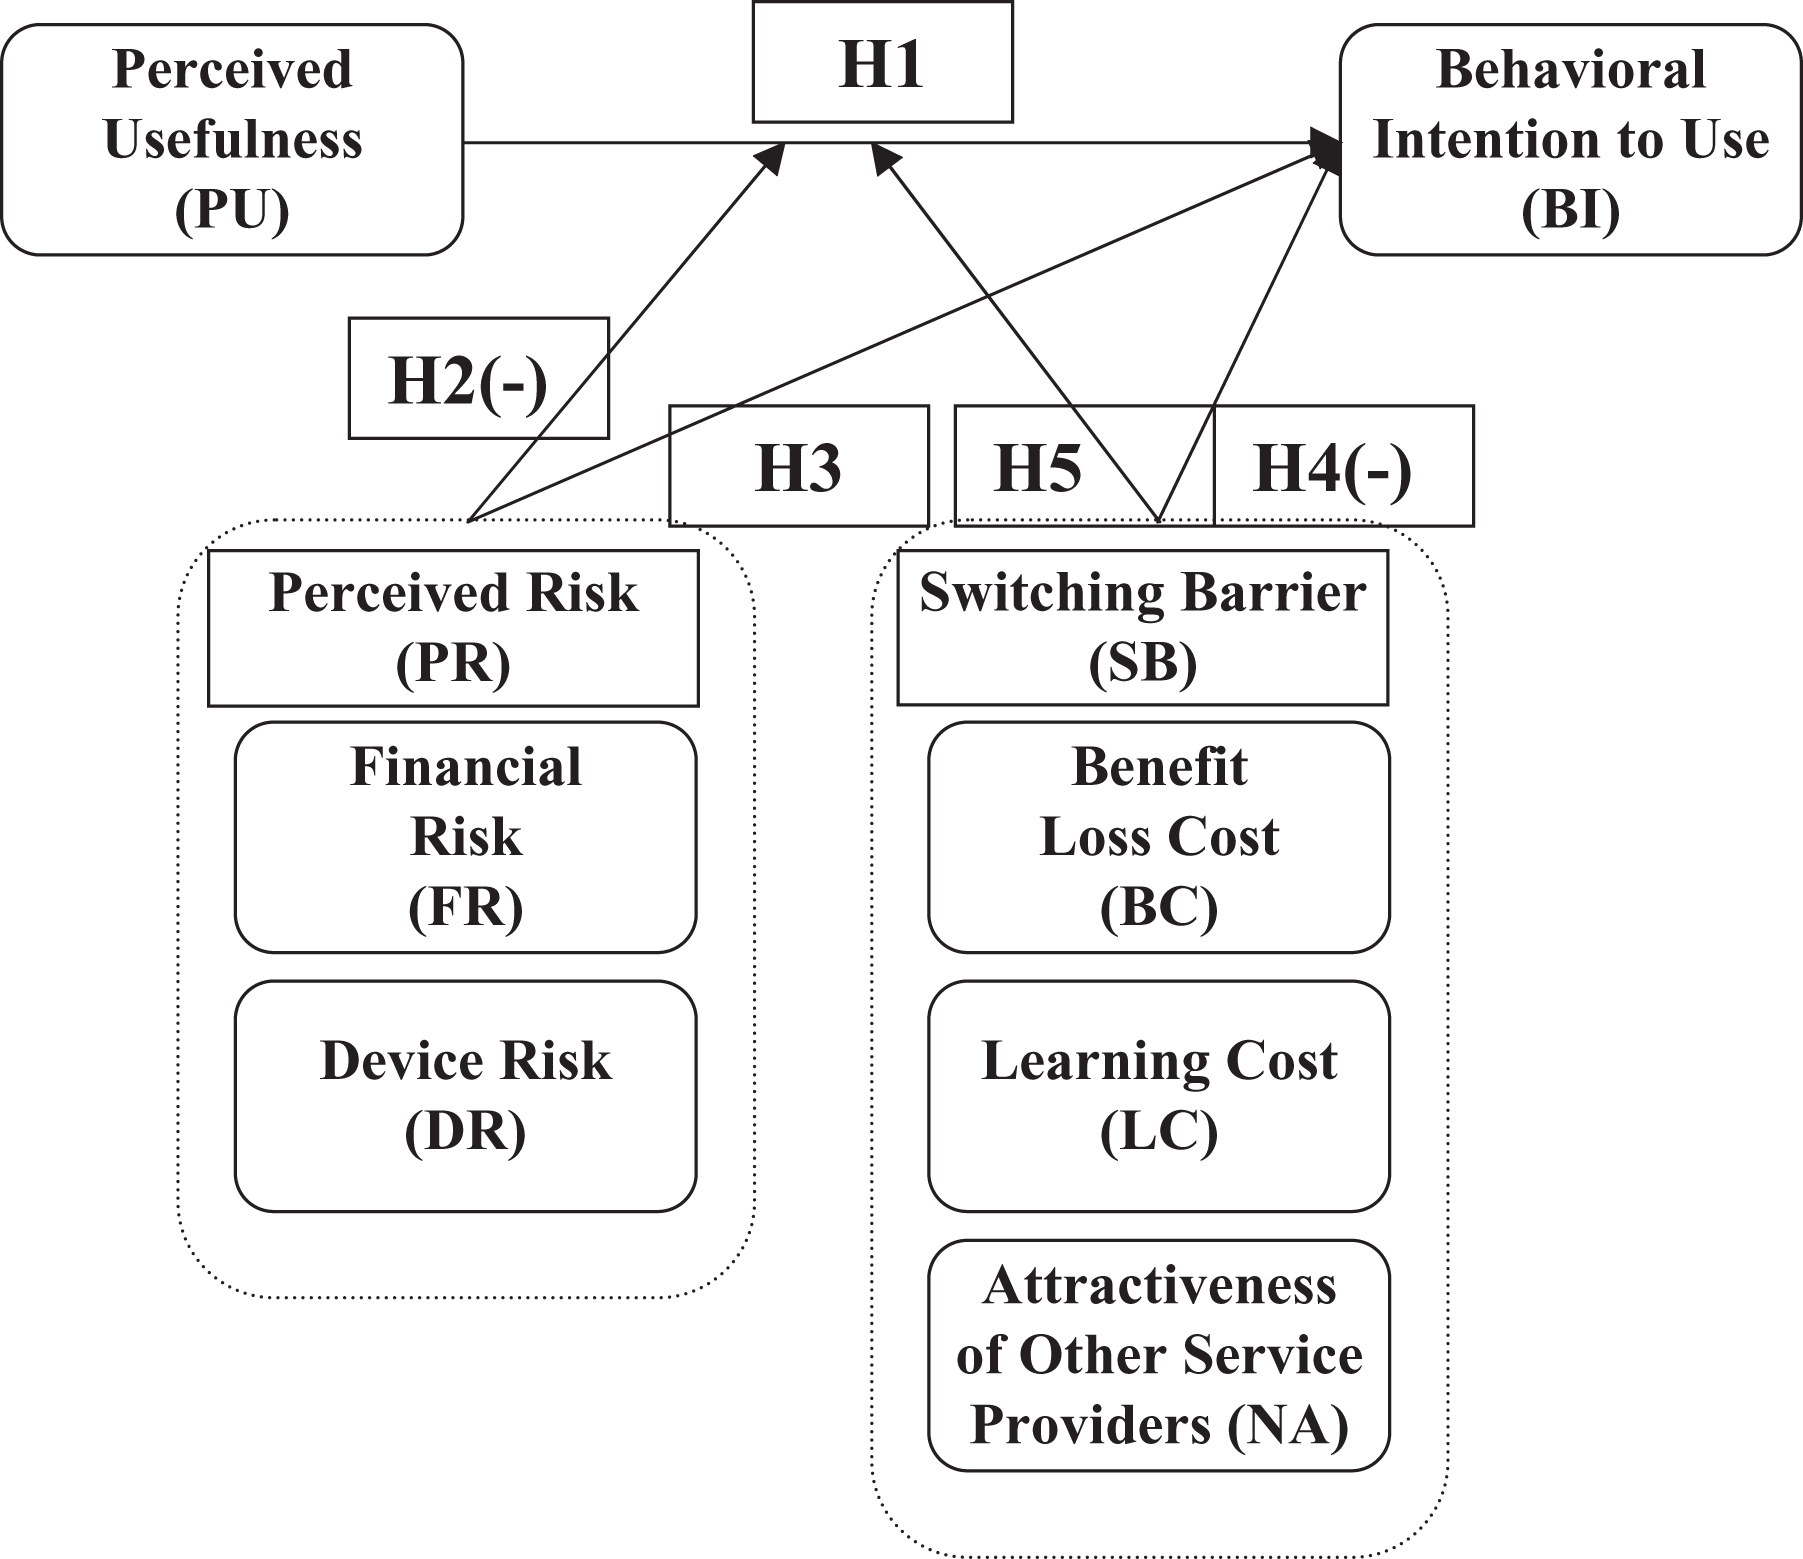
Research model.
Research methodology
Measurement development
All measurement items (Appendix 1) were drawn from the literature and were adapted to accommodate the smartphone context. Items for perceived usefulness and behavioral intention items came from Davis (1989) and Venkatesh and Davis (2000); items for perceived risks were modified from Cunningham (1967), Featherman and Pavlou (2003) and Wu and Wang (2005); and items for switching barriers were adapted from Bendapudi and Berry (1997), Jones et al. (2002) and Burnham et al. (2003). All items were measured using a 7-point Likert scale (1: not at all, 7: extremely so).
Survey administration
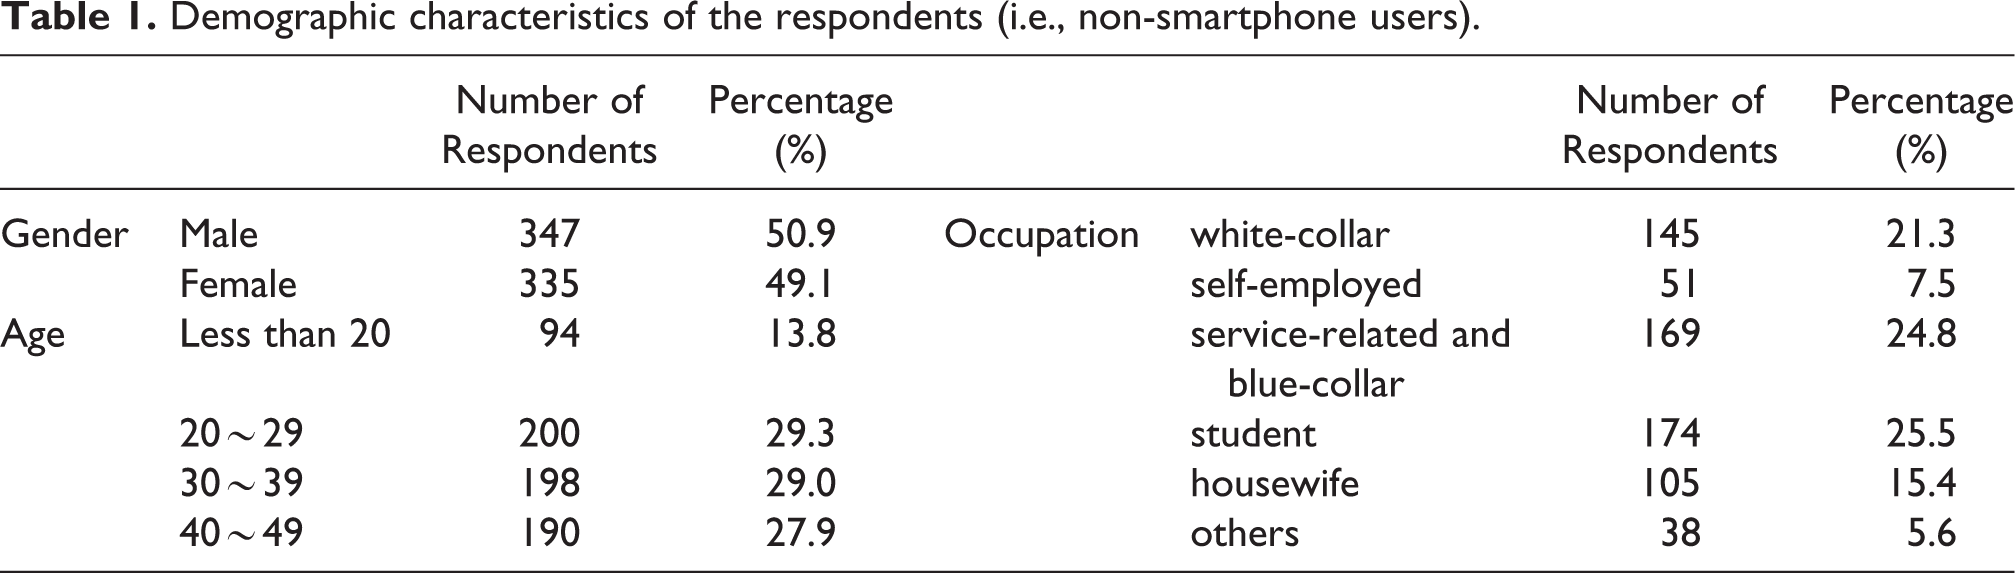
The survey data was collected from 800 males and females between the ages of 15 and 49 who live in the 15 major cities in Korea including the Seoul metropolitan area. A stratified sampling method was applied to the 2005 national census to extract the samples. Stratified sampling requires grouping of the participants in the population into certain subgroups before sampling. In this study, we considered the ratio of gender and occupation. A research panel company was engaged to collect the data via a face-to-face method by trained interviewers. After the respondents completed the survey, they were given an incentive coupon in the amount of 8,000 Korean won.
The proportion of non-smartphone users among all of the respondents is 85.3 percent (i.e., 682 out of the total 800 samples collected). Only the data from non-smartphone users are used in this study. The demographic characteristics of these non-smartphone users are shown in Table 1. The most common monthly household income levels are approximately KRW 3 million (26.8 percent) and KRW 4 million (23.0 percent). A total of 52.2 percent of the respondents have experienced using mobile Internet via mobile phones while 14.7 percent are wireless LAN users.
Demographic characteristics of the respondents (i.e., non-smartphone users).
Results
SPSS 12.0 and Smart PLS 2.0 (http://www.smartpls.de) were used for data analysis. Items for perceived risks and switching barriers were reverse-coded.
Measurement model
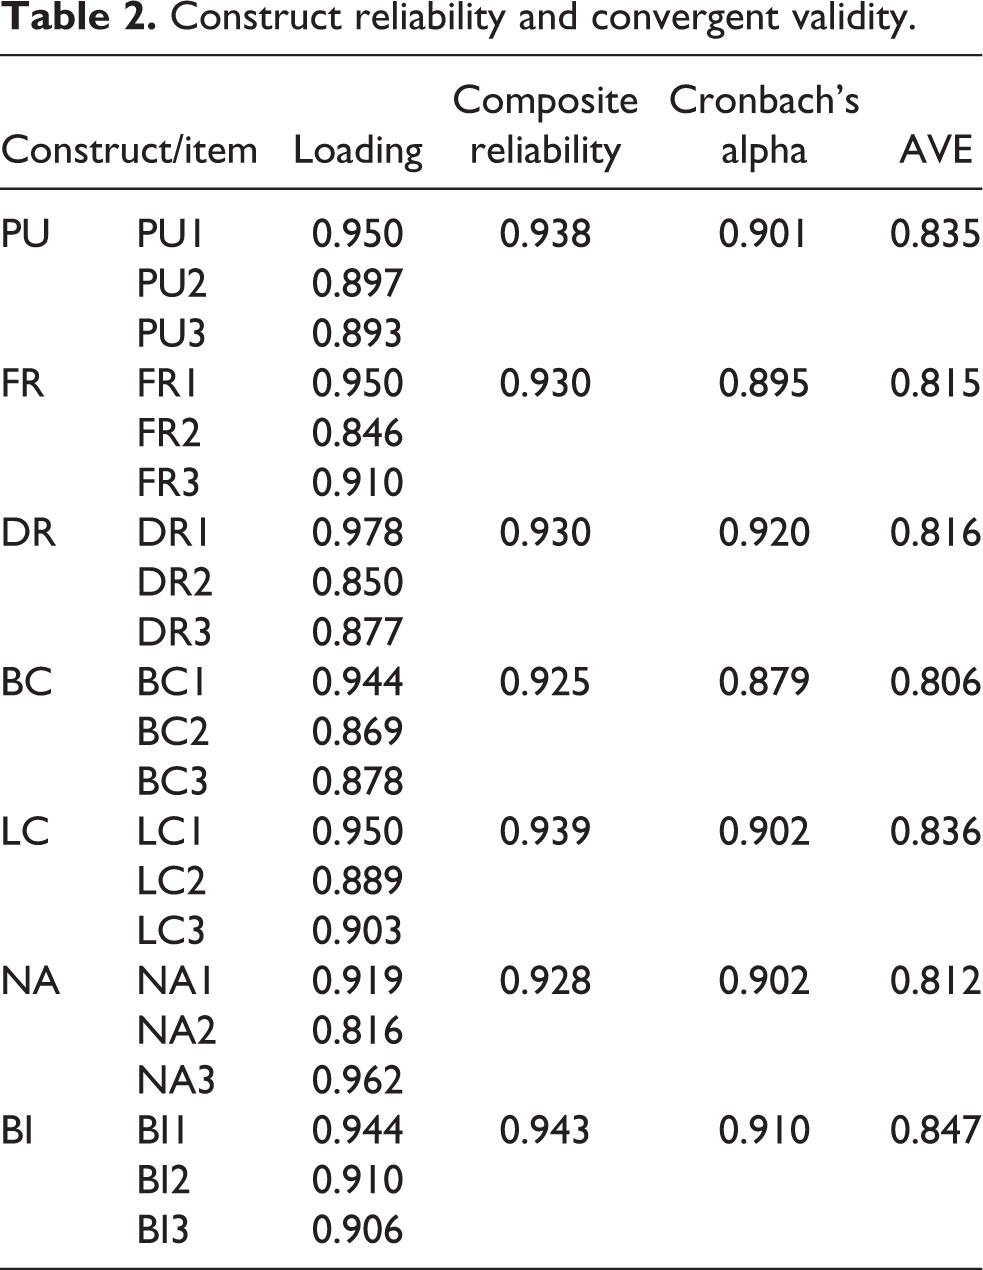
We ensured the reliability and validity of the measurement model by examining the item reliability, convergent validity, and discriminant validity (Chin, 1998; Hair et al., 2009). As shown in Table 2 and Table 3, the Cronbach’s alpha and composite reliability are all above 0.8 (Hair et al., 2009); the item loadings are greater than 0.7, the average variance extracted (AVEs) are greater than the recommended threshold of 0.5 (Fornell and Larcker, 1981), and the square root of the AVEs are larger than the correlation between any two constructs. All these signify good constructive reliability, convergent validity, and discriminant validity.
Construct reliability and convergent validity.
Correlation matrix and average variance extracted.
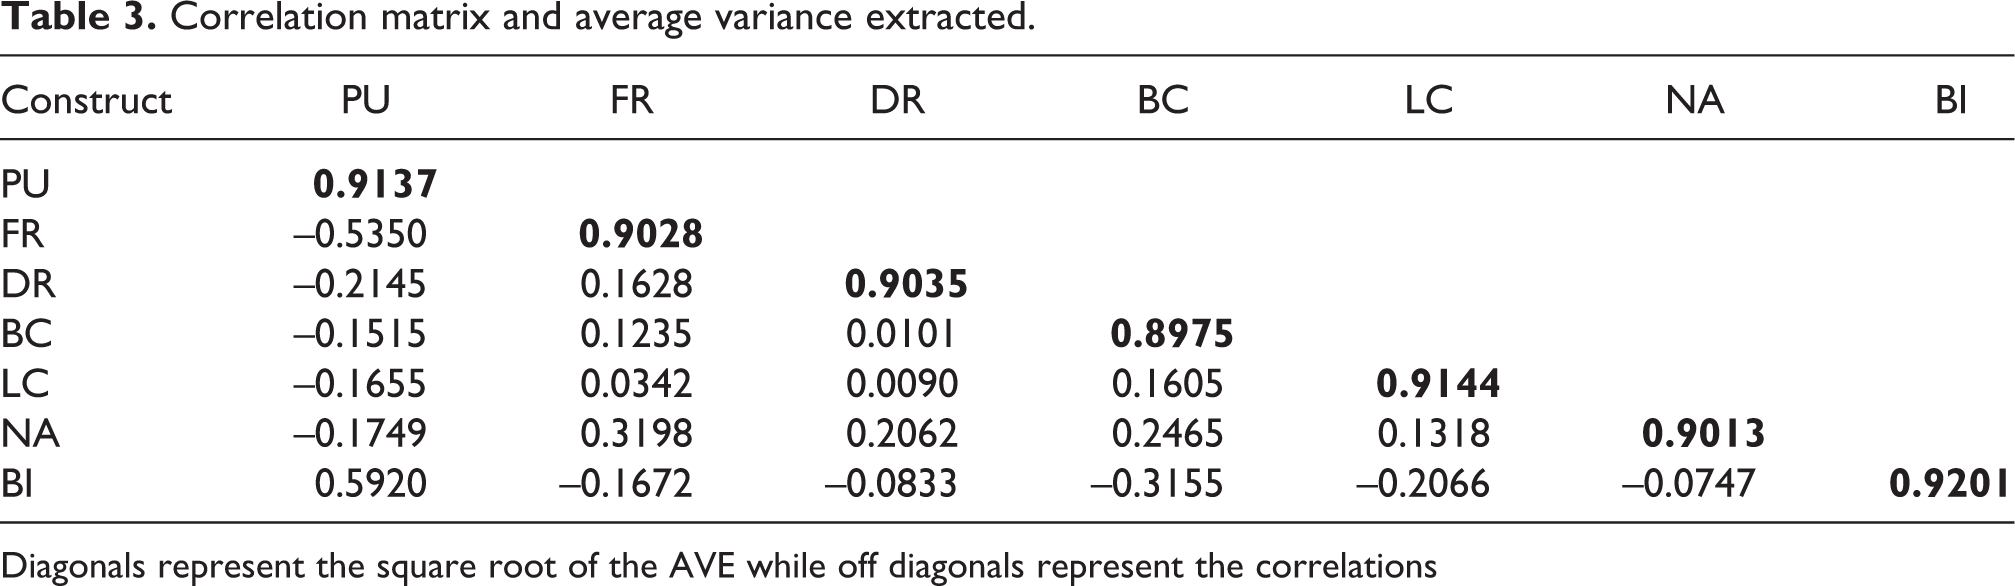
Diagonals represent the square root of the AVE while off diagonals represent the correlations
Structural model
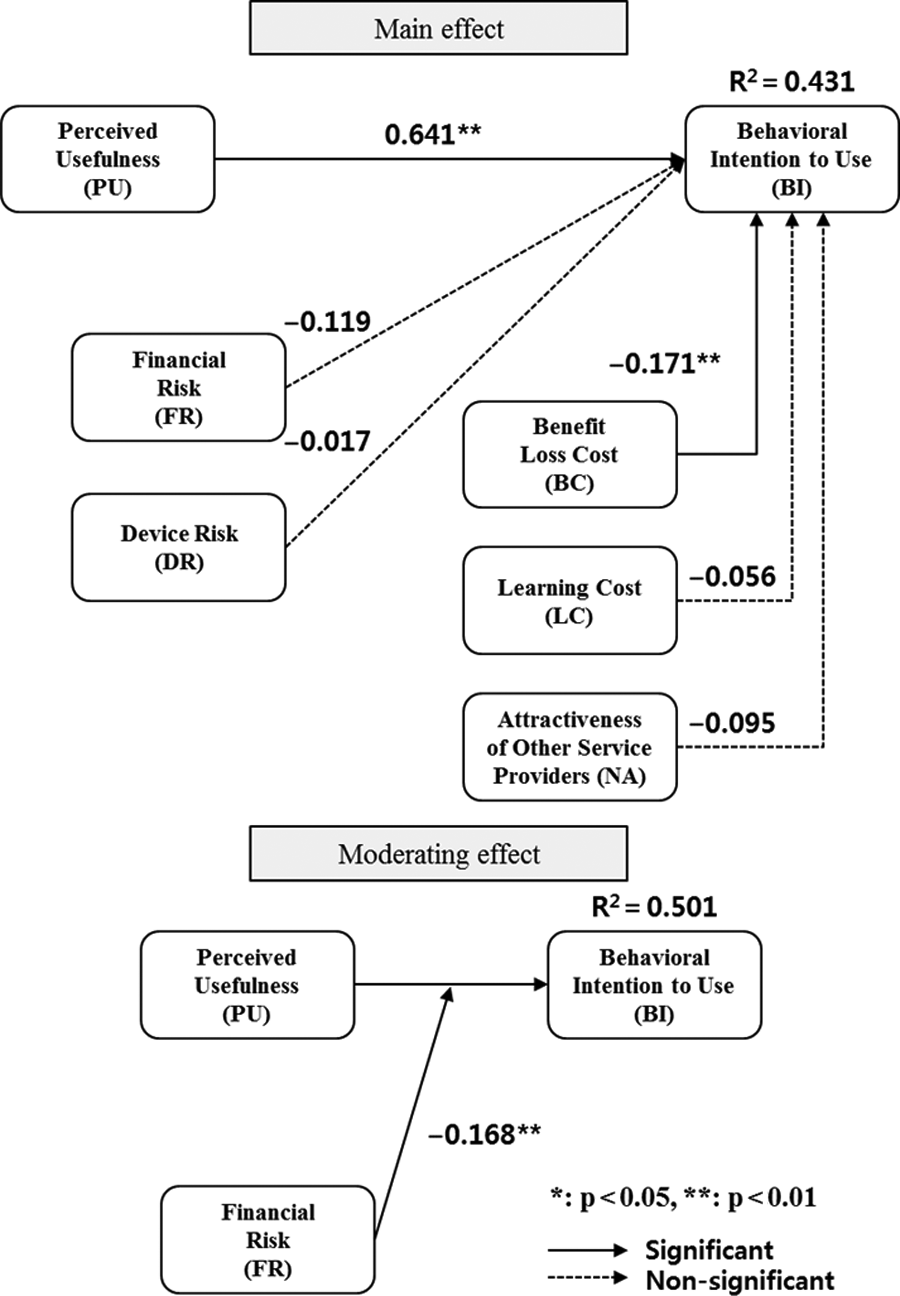
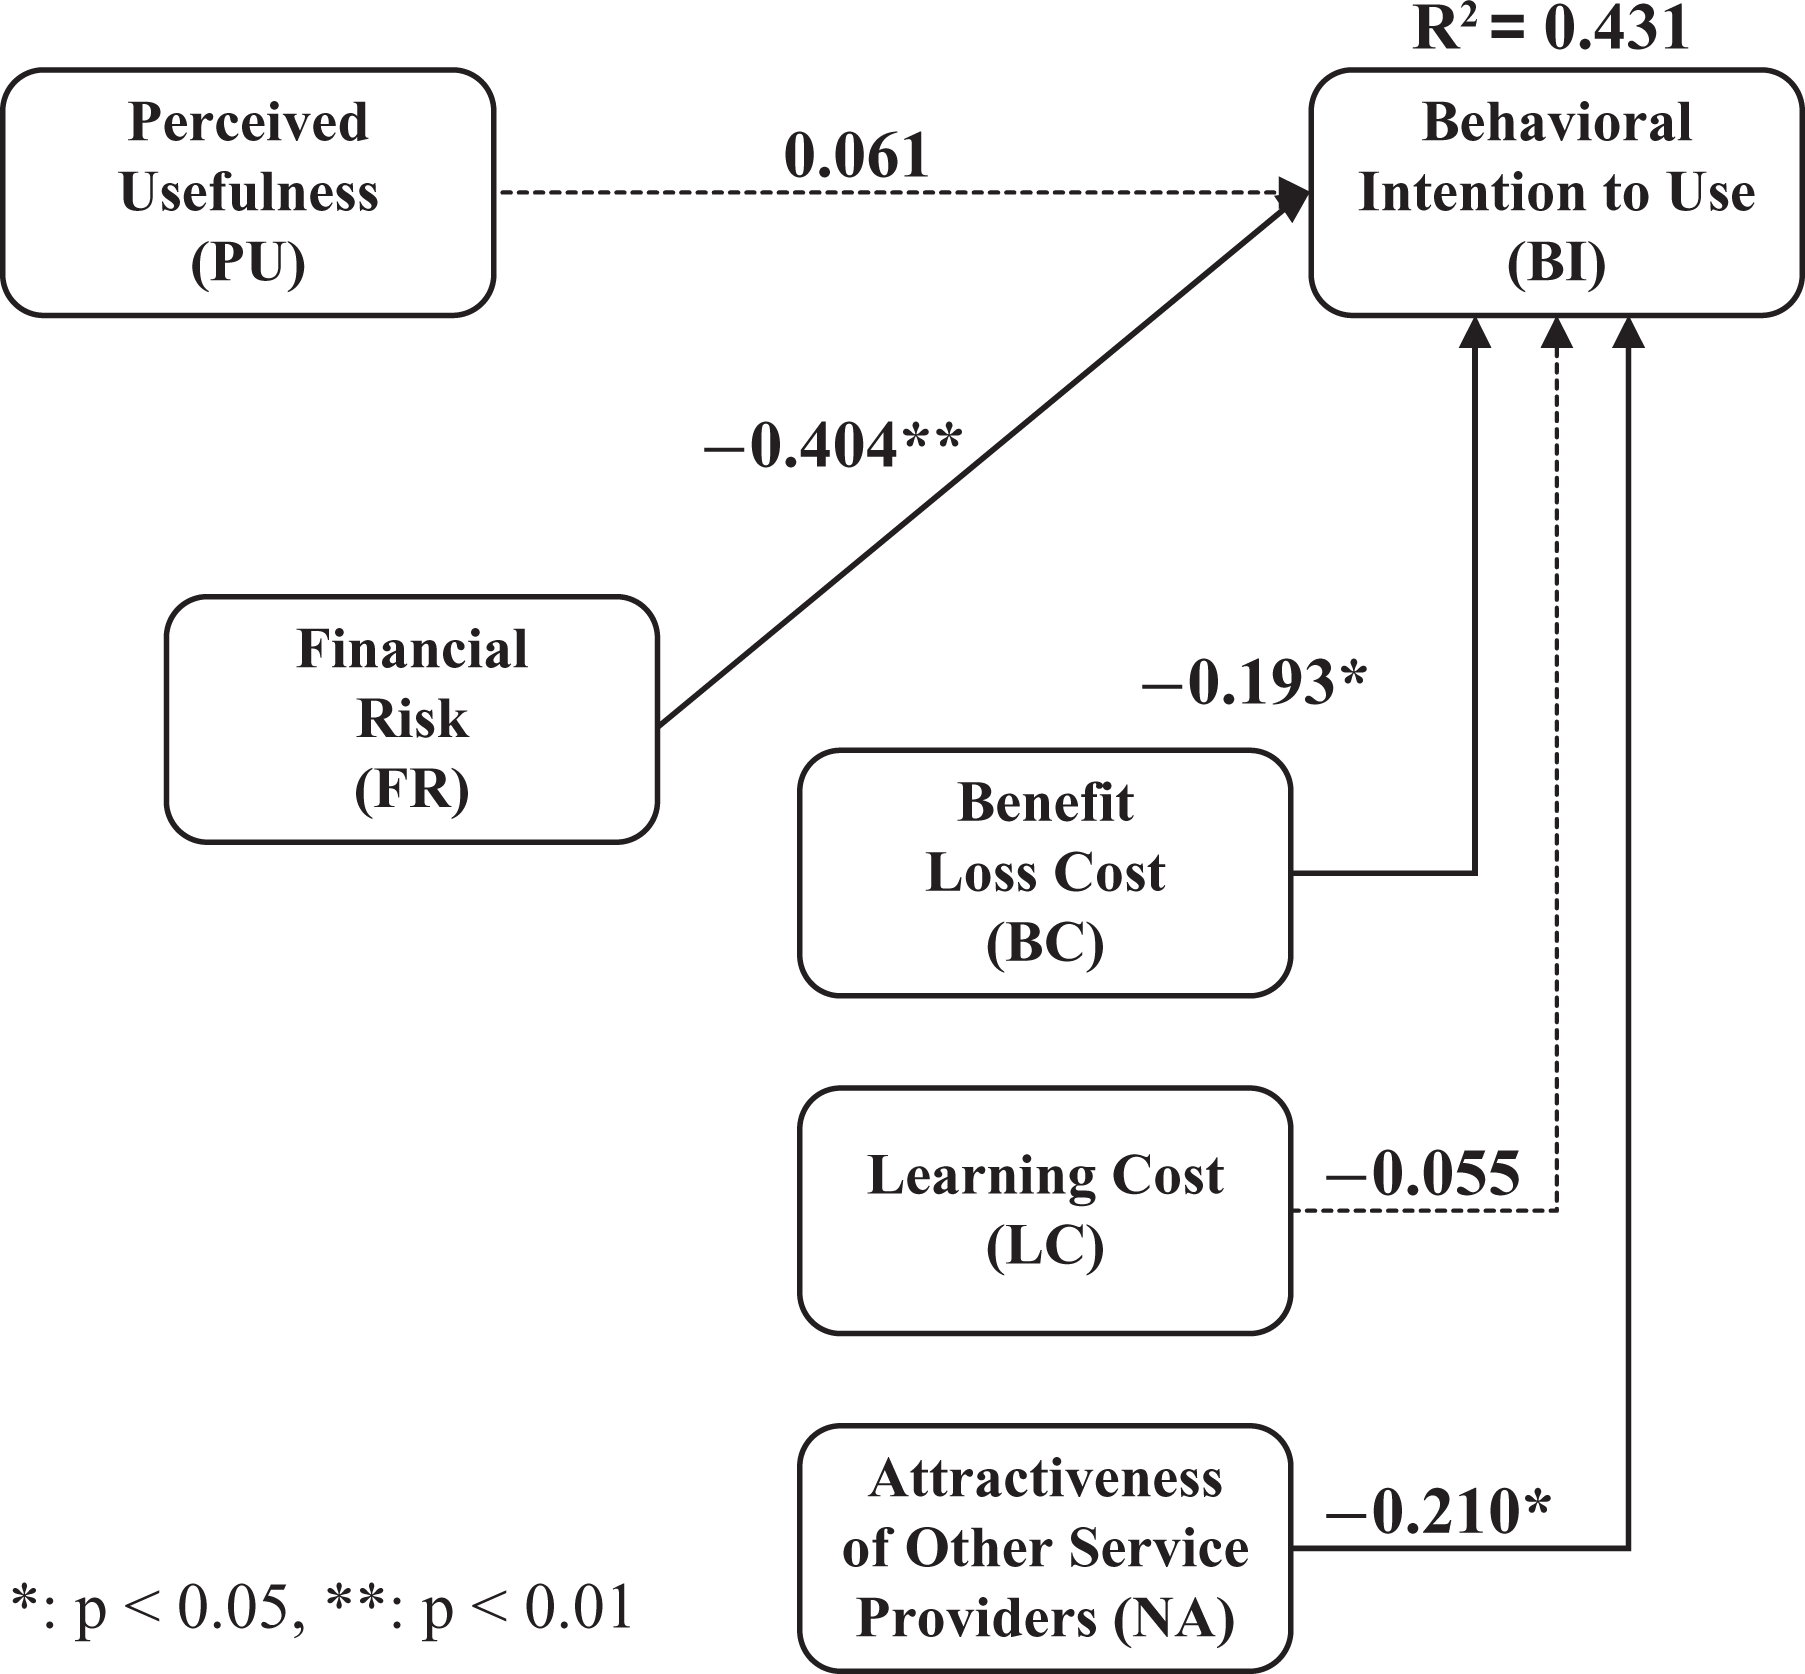
Figure 2 shows the result of the PLS analysis. Overall, the model accounts for 43.1 percent of the variance in the intention to use smartphones among non-adopters. As expected, perceived usefulness has a strong effect on intention to use (ß = 0.641). None of the sub-dimensions of perceived risks has a direct impact on intention to use but financial risk has a significant moderating effect (ß = –0.168) on the relationship between perceived usefulness and intention to use. Only perceived benefit loss cost of switching barriers has a direct impact on intention to use (ß = –0.171). None of the sub-dimensions of switching barriers has significant moderating effect on the relationship between perceived usefulness and intention to use.
SEM results.
Additional analyses based on respondent clustering
We conducted a k-mean clustering analysis using the Euclidean distances of the sums of observations for two constructs: perceived usefulness and intention to use, to assign respondents into four clusters (see Figure 3 for the clustering results). For further analyses, we focused only on those who have high level of perceived usefulness. We contended, based on TAM (Davis, 1989), that those with high level of perceived usefulness should have higher level of behavioral intention. However, the clustering results showed that more than one-third (i.e., 33.4 percent) of those who have high perceived usefulness showed low intention to adopt smartphones. From a practical organizational perspective, it is useful to know the differences between Group 1 (those with high intention to adopt) and Group 2 (those with low intention to adopt) in an attempt to convert the low intention group into high intention group. The rationale lies in the fact that Group 2 has already seen the usefulness of smartphones, thus it might require less effort to convert them as compared to changing those who are in Group 4). Therefore, for respondents who have high perceived usefulness, we further examine the differences between those who have high and low intention to use smartphones. As for those with low perceived usefulness (i.e., Group 3 and Group 4), only a small percentage (about 13 percent) intend to use smartphones. The majority of them followed the patterns suggested in existing literature where low perceived usefulness leads to low intention to adopt. Since this has been widely studied in literature, it will not be repeated here in this study.
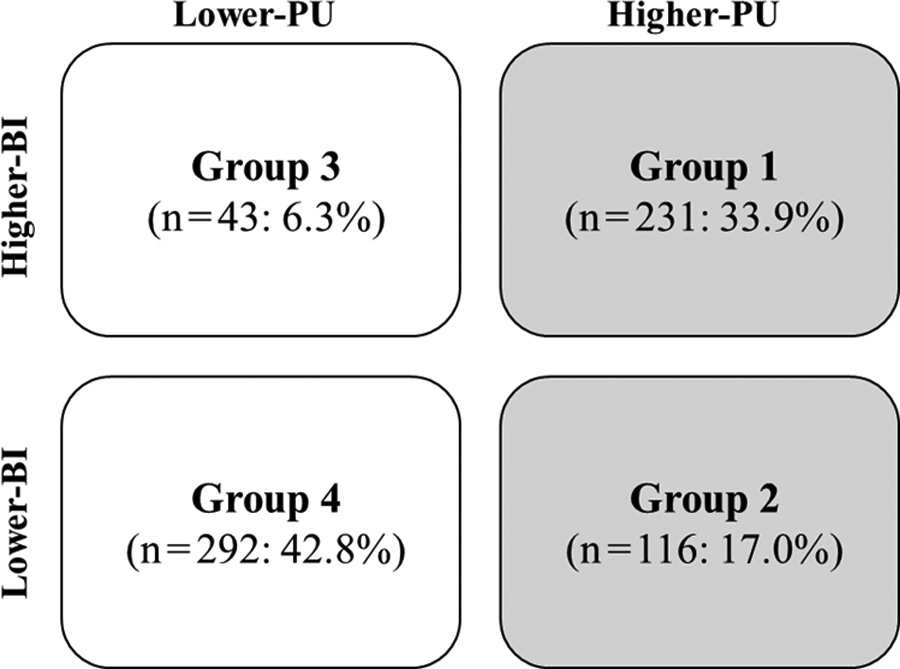
The results of respondent clustering.
For Group 1 (i.e., high perceived usefulness and high intention to use), perceived usefulness has a significant positive impact on intention to use (ß = 0.384), perceived financial risk has a direct and significant impact on intention to use (ß = –0.262) and perceived benefit loss cost has a direct and significant impact on intention to use (ß = –0.206) (see results in Figure 4).
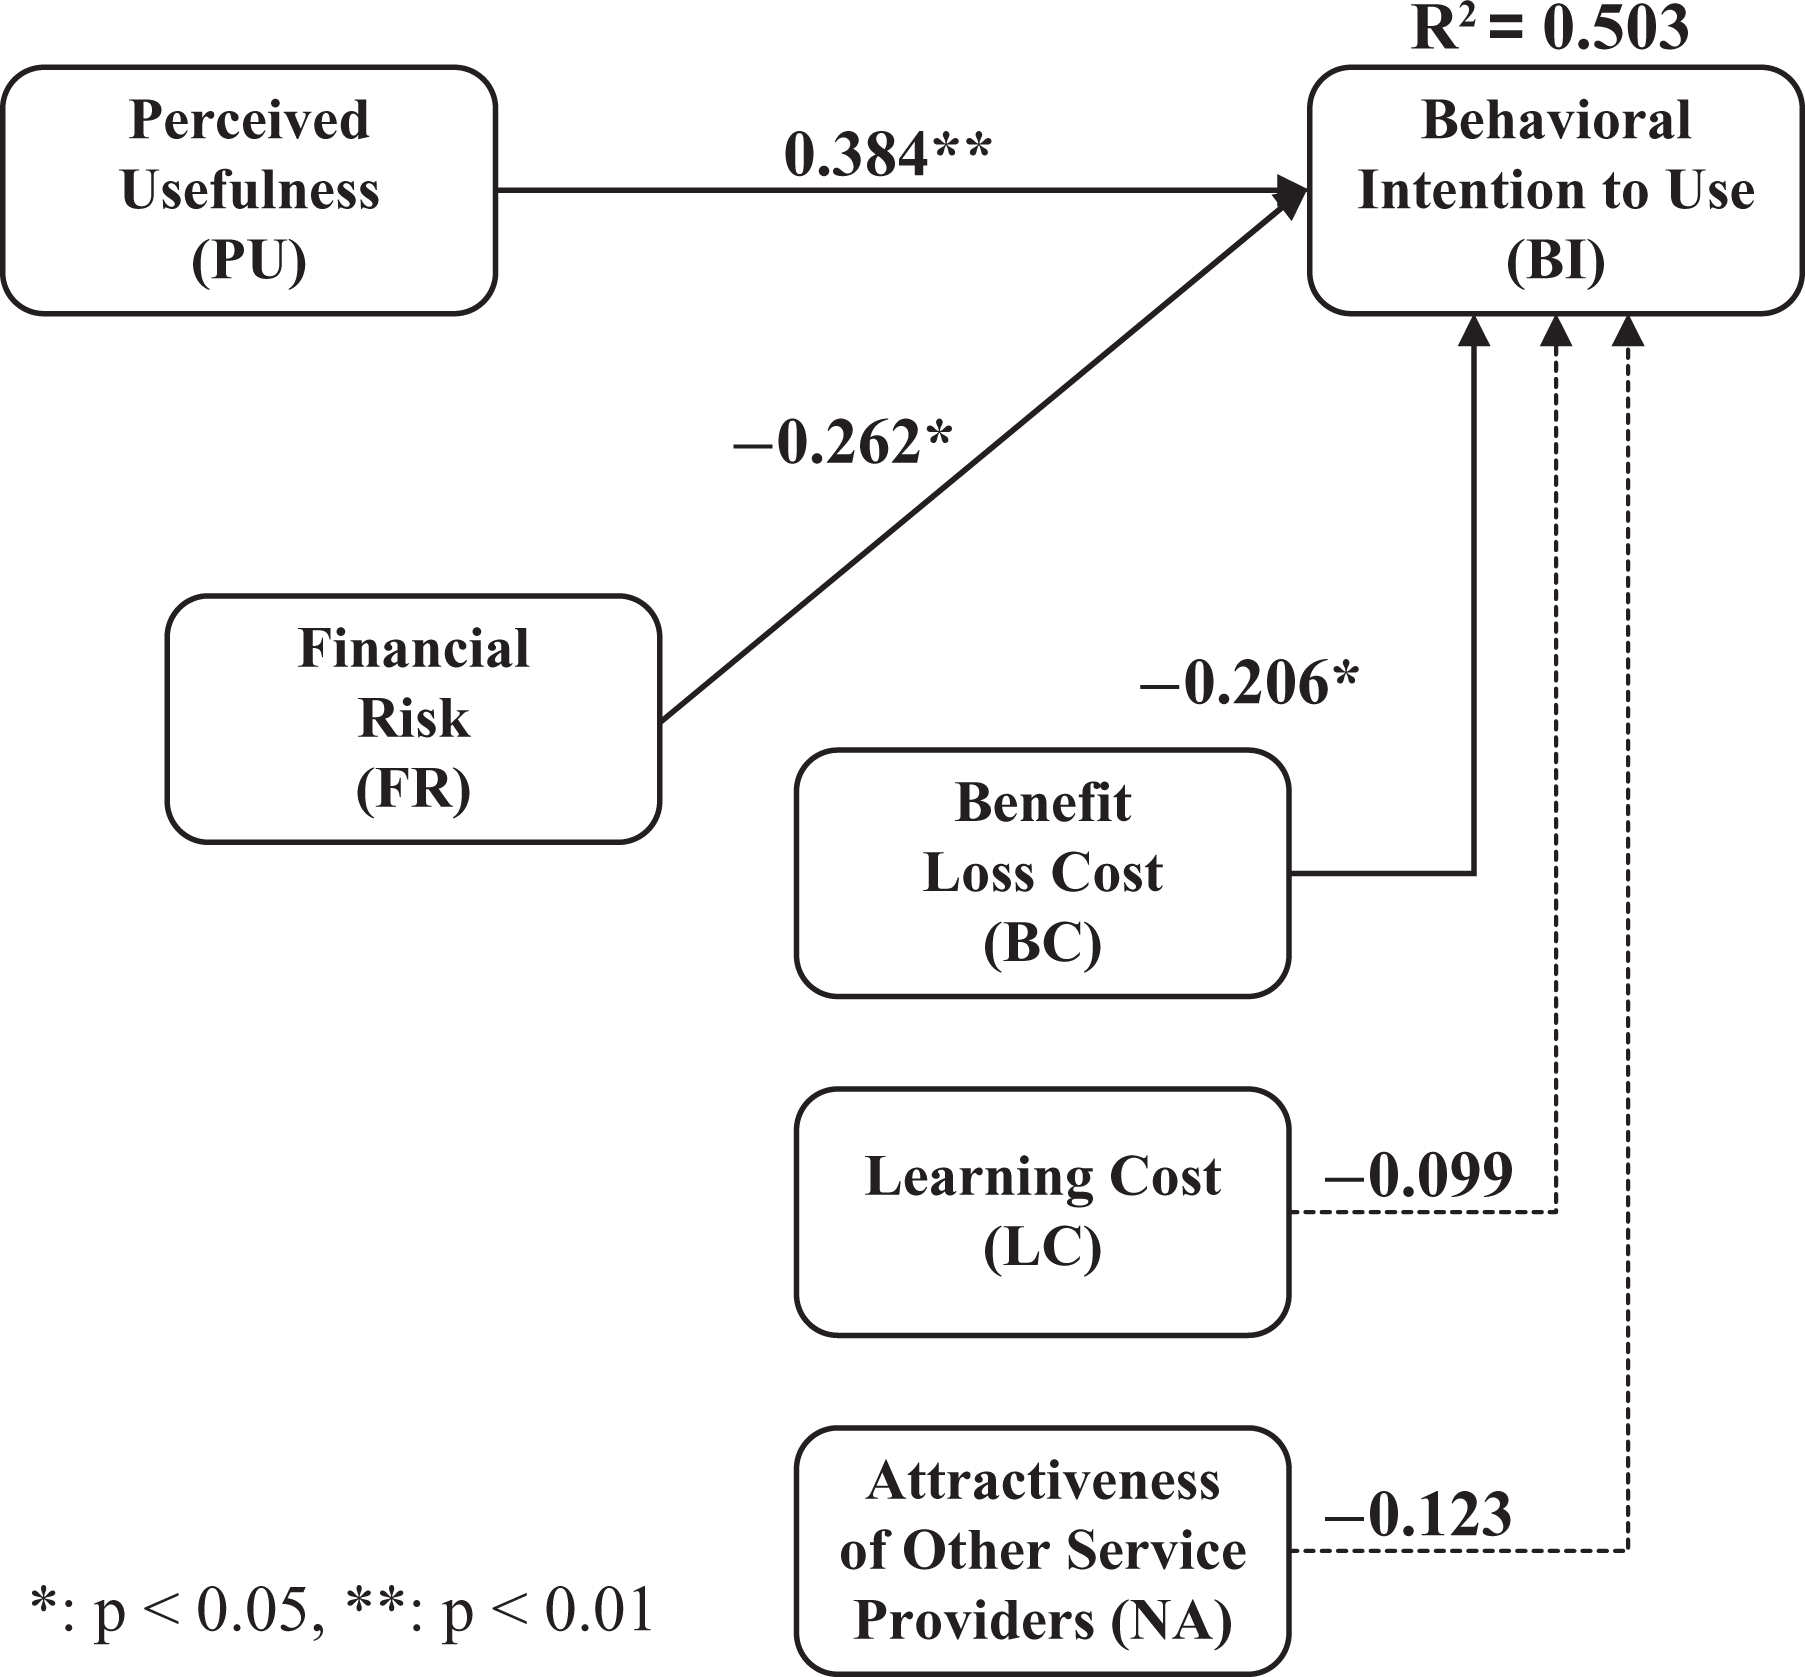
SEM results for Group 1 (high PU, high BI).
For Group 2 (i.e., high perceived usefulness and low intention to use), perceived usefulness does not have a significant impact on intention to use. Perceived financial risk, perceived benefit lost cost and perceived non-attractiveness of other service providers have a significant impact on intention to use (see results in Figure 5).
SEM results for Group 2 (high PU, low BI).
Discussion
Key findings and insights
This study examines the intention to use smartphones among non-adopters. It focuses on the role of perceived risks and switching barriers in directly affecting the intention to use smartphones and in moderating the relationship between perceived usefulness and intention to use. Consistent with existing research (Davis, 1989; Im et al., 2008), perceived usefulness is a critical determinant of intention to use smartphones. However, for the cluster with high level of perceived usefulness but low level of intention, perceived usefulness does not seem to have any significant effect. In fact, it is perceived financial risks, perceived benefit loss cost, and perceived non-attractiveness of other service providers that serve as important factors in influencing their usage intention. For the cluster with high level of perceived usefulness and high level of intention, perceived financial risk and perceived benefit loss cost also play important roles in affecting their intention to use smartphones.
The results imply that in order to increase the adoption rate of smartphones among non-adopters, adoption barriers in the form of perceived risks and switching barriers need to be reduced. While some barriers may be common across different groups, there are specific obstacles that are of higher concern to a particular group. For example, those who do not plan to use smartphones despite perceiving the value of smartphones have an additional concern of perceived non-attractiveness of other service providers. Therefore, if organizations plan to tap into this market niche, they ought to address this unique concern. They also have to customize their marketing strategy to target this group.
Perceived financial risk has a significant moderating effect on the relationship between perceived usefulness and intention to use smartphones in general (Im et al., 2008). For the clusters that have high level of perceived usefulness (i.e., Group 1 and Group 2 in Figure 3), perceived financial risk has a significant direct impact on their intention to use the devices. This implies that IT adoption will be delayed or reduced when consumers need to purchase new devices or when the price of the devices is higher than the amount consumers are willing to pay. Thus, to reduce extra expenses that may serve as an adoption barrier, new devices need to be subsidized or accompanied with attractive subscription plans and discounts. In 2009, three Korean mobile carriers introduced unlimited 3G data usage with fixed tariff service and free handsets (Lee et al., 2012). This strategy increased the number of smartphone users from one million to ten million within two years (KIA, 2012). When 4G LTE service was launched in the market in 2011, these three mobile carriers also gave almost 100 percent subsidies when consumers bought and subscribed to new smartphones and services (KCA, 2012). This move also significantly increased the number of smartphone sales and LTE service subscription (KCA, 2012). These Korean cases are good examples of how lowering financial risk will increase the rate of smartphone adoption in the market. Besides giving subsidy, low-price smartphone handsets could be another solution to increase the sales of smartphones.
Perceived benefit loss cost has a direct influence on intention to use for all non-adopters. IT adoption will be delayed or reduced if user convenience is reduced or lost by switching services. When switching to smartphones, consumers may experience reduced convenience. This reduced convenience critically hinders user adoption. According to a 2010 study by the Korea Internet & Security Agency (KISA), a minimum contractual period requirement (e.g., 2 years) is a significant barrier to smartphone adoption (KISA, 2010). Thus, new strategy should be implemented to improve user convenience by allowing flexible contractual periods to promote adoption of IT products such as smartphones. In 2011, when Mobile Virtual Network Operator (MVNO) services were launched in the market officially, the service providers gave low price and non-contractual based prepaid services (Lee et al., 2012). After MVNO was launched in Korea, Korea Communications Commission (KCC) announced a blacklisting policy that prevents consumers from switching service providers under existing handset plans (Lee et al., 2012). To circumvent this policy, three mobile operators (i.e., SK telecom, KT, LG U+) give reimbursements to churned customers for penalties incurred as a result of breaching existing contracts.
For non-adopters who have high level of perceived usefulness and low level of intention to use smartphones, non-attractiveness of other service providers serves as a significant adoption barrier. Currently, in Korea, smartphone models and their associated services are tied closely with specific providers. For example, consumers can only have access to a particular smartphone model when they choose a pre-designated service provider. Similarly, consumers can have access to certain functions (e.g., video calling) when they choose a specific smartphone model or select a particular service provider. Due to this factor, some consumers choose to stay onto their existing conventional phones despite understanding the usefulness of smartphones. Moreover, the bond between customers and service providers (e.g., brand loyalty) can also function as a switching barrier in smartphone diffusion (Aydin and Ozer, 2005). Thus, service providers should focus on building a brand image to increase their attractiveness level in the eyes of consumers.
This study makes the following contributions. First, the data from non-adopters is valuable. Existing research mostly focus on the overall market in general. This study examines the group of individuals who have not used smartphones despite the fact that these devices have been in the market for a period of time. Understanding their behaviors and the barriers that stop them from using smartphones can probably help in formulating better strategies to increase the market share for the devices.
Second, the study verifies the role of adoption barriers in smartphone diffusion. It shows that the types of barriers may differ based on group characteristics of non-users. For organizations, these findings highlight the need to establish different marketing strategies and services for different market niches. Since future advancement of IT is likely to replace the existing market rather than create a new one (Lopperi and Sengupta, 2004), the findings of this study provide a basis for future research on adoption barriers in the switching of services.
Limitations and suggestions for future research
The current study has some limitations that should be taken into account when interpreting the results. First, only one single IT product ‘ smartphones ‘ is examined in the study. Future research could extend the model to other IT products and services that are experiencing low market diffusion. Examples of these IT products in Korea are WiBro, 3G video call over HSDPA, satellite DMB and wireless LAN. Further research on these IT products and services will enable a deeper analysis of the existence and the role of different adoption barriers.
Second, the study is only conducted in Korea, making it a homogenous sample. Future research could extend the study to other countries and examine the influence of cultural and market environment on adoption barriers and intention to use different technologies. Various IT characteristics can also be taken into consideration. For example, technology that has very short life cycle such as that of a smartphone may have different adoption patterns and present different barriers to consumers compare to an IT product that has a longer life cycle.
There are also potential avenues for other future research. First, even though smartphone and mobile Internet users are increasing rapidly across different parts of the world, there are some socio-economically disadvantaged groups who still do not have access to and do not use these technologies. Future research could explore how to bring the technologies to these users. Second, future research can apply the UTAUT2 model (Venkatesh et al. 2012) to study how non-adopters differ from adopters in terms of factors such as perceived price value, habit, hedonic motivation, performance/effort expectance, social influence, and other facilitating conditions. The same UTAUT2 model can be applied when examining the socio-economically disadvantaged group as well.
Conclusion
This study represents a systematic approach to understand smartphone adoption among non-adopters. It verifies that roles of perceived risks and switching barriers on the intention to adopt smartphones among non-adopters. The findings provide valuable information to organizations in their effort to increasing the usage of smartphones in general and their own market shares in particular. Considering the speed at which IT products appear in the market, it is critical for organizations to maximize the adoption rate of their IT products as soon as a product is being launched. Only through this manner can organizations continue to survive in the competitive IT market.
Footnotes
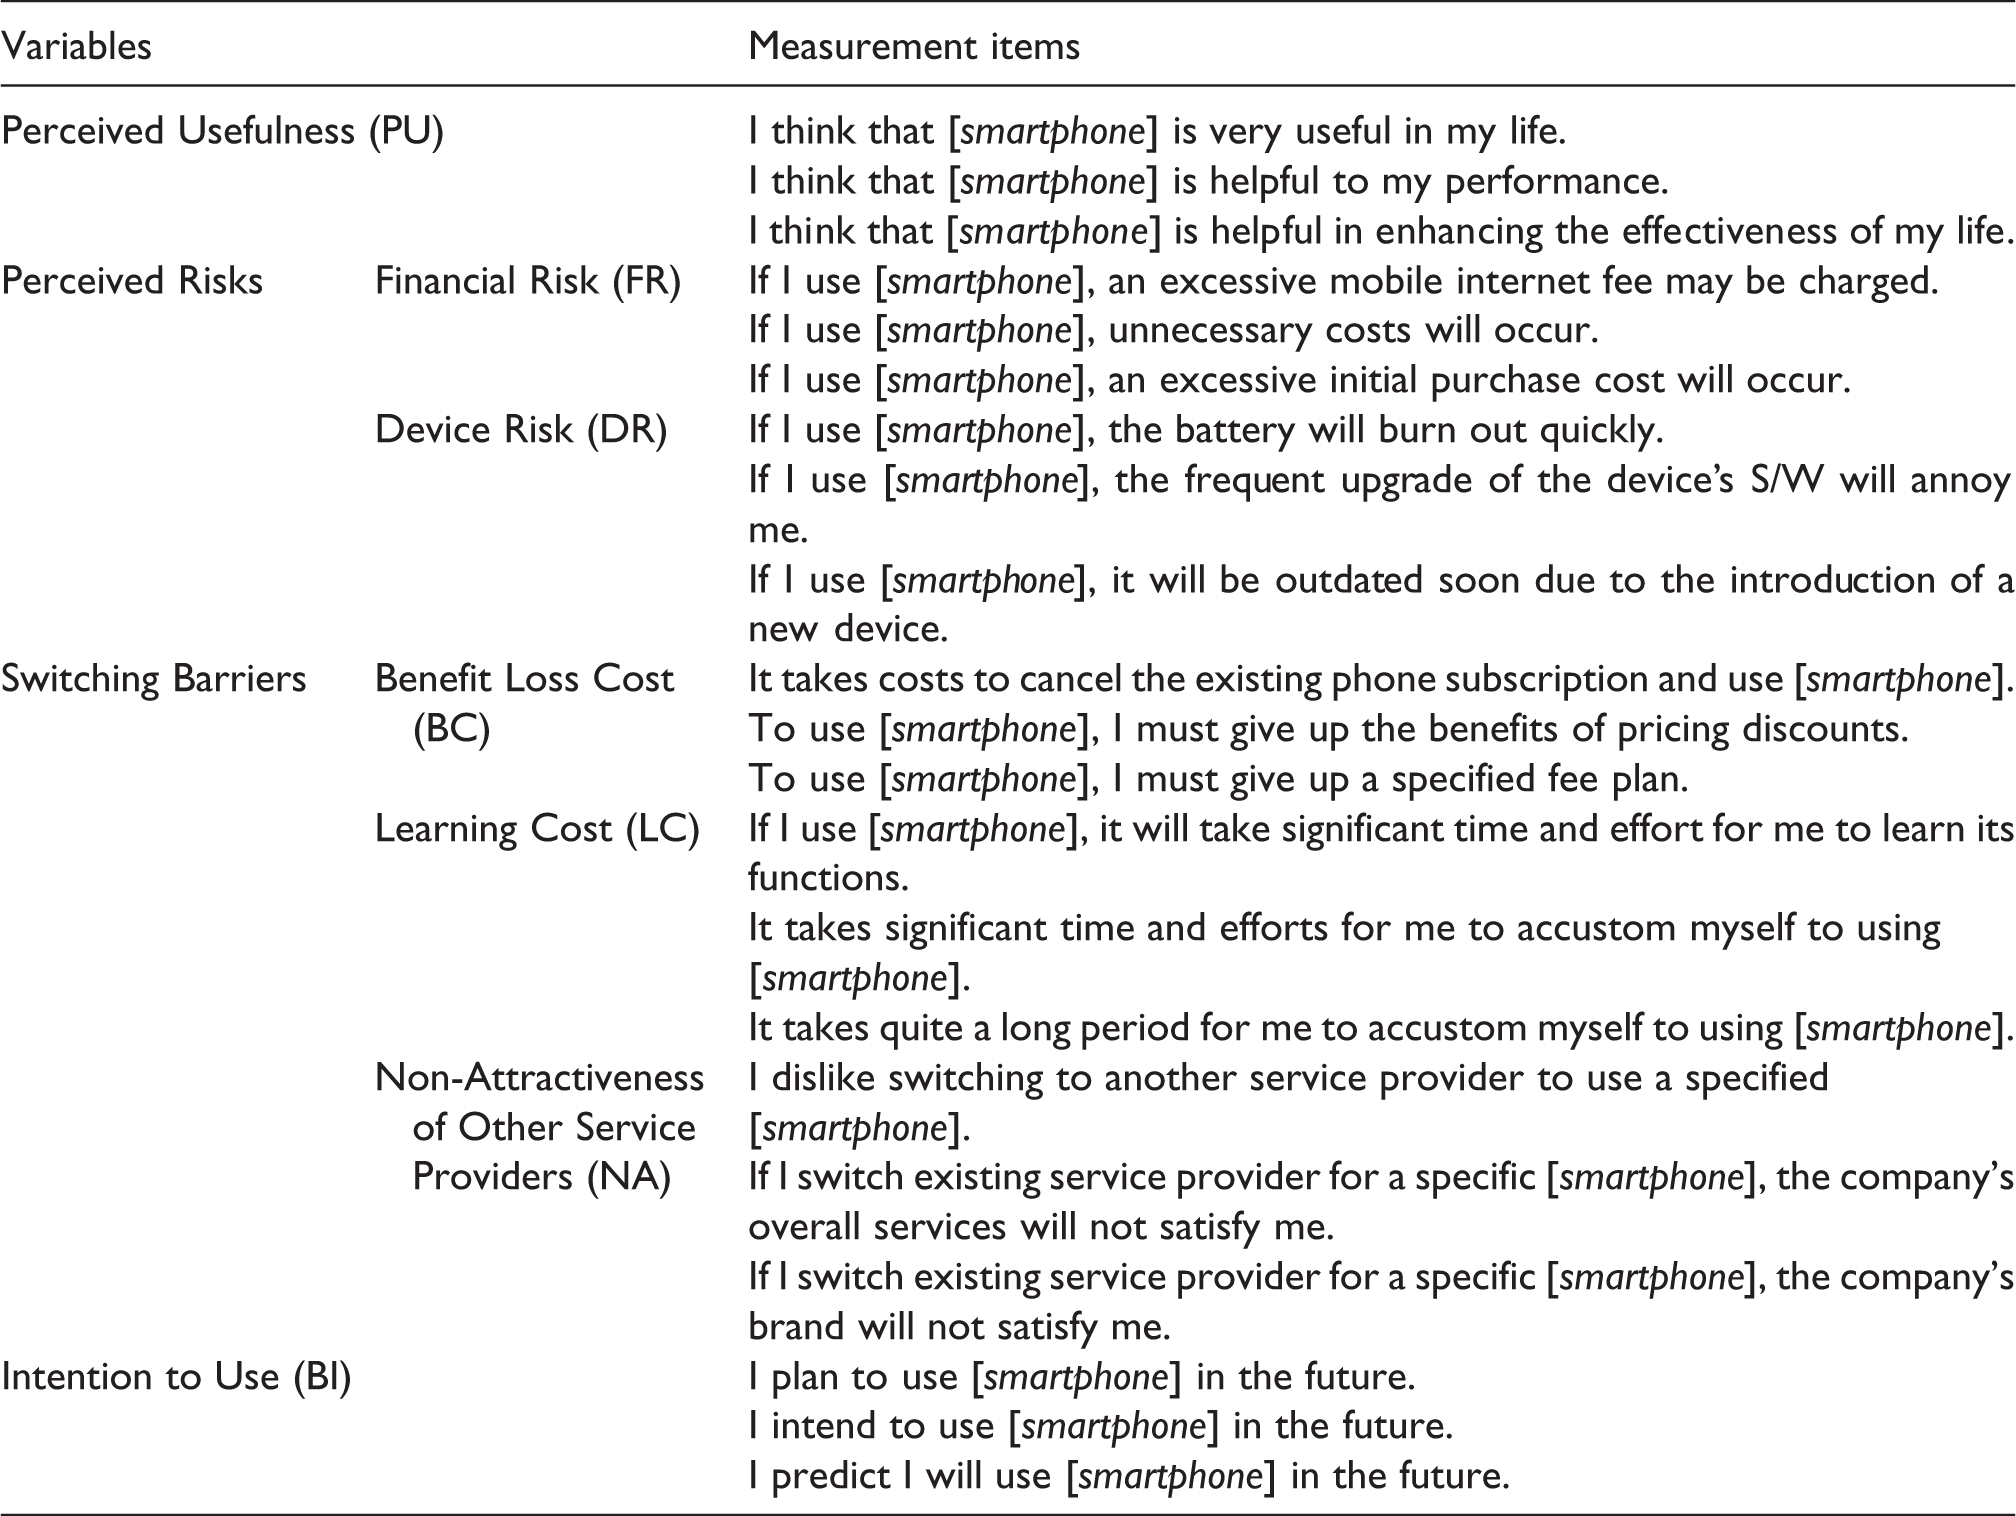
Appendix 1. Measurement items
| Variables | Measurement items | |
|---|---|---|
| Perceived Usefulness (PU) | I think that [smartphone] is very useful in my life. I think that [smartphone] is helpful to my performance. I think that [smartphone] is helpful in enhancing the effectiveness of my life. |
|
| Perceived Risks | Financial Risk (FR) | If I use [smartphone], an excessive mobile internet fee may be charged. If I use [smartphone], unnecessary costs will occur. If I use [smartphone], an excessive initial purchase cost will occur. |
| Device Risk (DR) | If I use [smartphone], the battery will burn out quickly. If I use [smartphone], the frequent upgrade of the device’s S/W will annoy me. If I use [smartphone], it will be outdated soon due to the introduction of a new device. |
|
| Switching Barriers | Benefit Loss Cost (BC) | It takes costs to cancel the existing phone subscription and use [smartphone]. To use [smartphone], I must give up the benefits of pricing discounts. To use [smartphone], I must give up a specified fee plan. |
| Learning Cost (LC) | If I use [smartphone], it will take significant time and effort for me to learn its functions. It takes significant time and efforts for me to accustom myself to using [smartphone]. It takes quite a long period for me to accustom myself to using [smartphone]. |
|
| Non-Attractiveness of Other Service Providers (NA) | I dislike switching to another service provider to use a specified [smartphone]. If I switch existing service provider for a specific [smartphone], the company’s overall services will not satisfy me. If I switch existing service provider for a specific [smartphone], the company’s brand will not satisfy me. |
|
| Intention to Use (BI) | I plan to use [smartphone] in the future. I intend to use [smartphone] in the future. I predict I will use [smartphone] in the future. |
|