
Abstract
This study aims to develop a comprehensive Government Openness Index (GOI) in developing countries, explore the relationship of the variables in the GOI, and examine the relationship of the GOI and income levels. Based on a linear scaling method, panel data from 101 countries was used to develop a GOI using four variables (e.g. accountability (ACC), information and communication technology (ICT), citizen participation and freedom (CPF), and transparency (TRA)). The results show that ICT performs highest in global means, coefficients of variation, and the contribution rate and contribution level to the change of GOI but CPT performs lowest in the contribution rate. The relationship between GOI and income is significantly positive. The results of this study suggest that developing countries should improve their capacity to utilize and sustain ICT and in particular human capacity for directing ICT toward improving citizen participation and freedom.
Keywords
Introduction and context of the study
In recent years, open government has become a critical issue around the world. A series of noteworthy efforts and actions have been made in different countries. In January 2009, the administration of American President Barack Obama issued the Open Government Directive, defining open government and directing federal governments to implement the principles of transparency, participation and collaboration (Open Government Initiative, 2009; Evans and Campos, 2013). In September 2011, one of the most influential movements regarding open government was the announcement of the Open Government Declaration by the Open Government Partnership (Open Government Partnership, 2015a). To foster and share a global open government, the Open Government Partnership (OGP) was founded by eight countries and by 2017 had expanded to 75 member countries. These member countries have declared their commitment and plans to bolster open government for their citizens and have participated in action plans and meetings (Open Government Partnership, 2015b). To join the OGP, countries are measured by certain indicators (e.g. budget transparency, access to information, asset disclosure, and citizen engagement) and validated (Open Government Partnership, 2015c). To deliver open government reforms, the OGP has adopted the following main strategies: “to maintain high-level political leadership and commitment to OGP; support domestic reformers with technical expertise and inspiration; foster more engagement in OGP by a diverse group of citizens and civil society organizations; and ensuring countries’ accountability toward achieving their OGP commitments” (Open Government Partnership, 2015d).
To evaluate the state of open data in government, several assessment tools and indicators have been produced. The World Bank’s Open Data Readiness Assessment is a good methodological toolkit for evaluating the readiness of government to plan and implement open data programs using eight factors (World Bank, 2017). The Open Data Barometer of the World Wide Web Foundation (2017) presents the overall measurement rankings of open data readiness, implementation and impacts of government in the development of open data.
The Global Open Data Index, produced by Open Knowledge International (2017), also provides the rankings and scores of assessing government open data publications with major government datasets related to government administration and citizen services. This index presents a global view of government data released in over 100 countries. To assess the progress of government open data, the open government maturity model is comprised of five levels: the initial conditions, data transparency, open participation, open collaboration and ubiquitous engagement. This model is focused on social media-based public engagement (Lee and Kwak, 2012). Benchmark approaches are used for open government assessment with data available at the US government open data portal sites (http://data.gov) (Veljković et al., 2014) and benchmarking case comparisons (Susha et al., 2015). These studies and tools have been conducted through an available open data perspective.
In a juridical perspective, to assess the level of open government, Access Info Europe has been working on defending human rights and the right of access to information in European countries. The organization developed the Open Government Standards, which define and explain the assessments that governments should make when forming open government (Access Info Europe, n.d.). These consist of three core areas: transparency, participation and accountability. The World Justice Project (WJP) developed the Open Government Index (OGI) with scores and rankings of over 102 countries in order to enhance the foundation of the rule of law around the world (World Justice Project, 2017). The OGI focuses on measuring government openness through publicized laws and government data, the right to information, civic participation, and complaint mechanisms. It helps with an understanding of the relationship between government openness and legal, social, and economic factors in countries and in regional development. Although this index is useful, and made by a reliable agency, it tends to place significant weight only on the legal dimensions of accountability and participation.
Considering that open government is closely related to information and communications technologies (ICT), the existing indices that are mentioned above do not include the comprehensive aspects related to open government, so there still exists a gap in assessing the progress of open government in the world at a macro-level.
To date, although the current open government movement has mainly been led by developed countries, 43 developing countries out of 75 OGP member countries (57%) have joined the OGP as of May 2017 and have expressed their willingness, interest and action plans for improving open government. Developing countries have also made noteworthy efforts and achievements. One example is the Africa Open Data Conference (AODC), an organization that hosts conferences to connect open data groups and share developments across Africa (Africa Open Data Conference, 2017). In addition, regional agendas and activities have promoted the development of open data in East Asia and the Pacific, Southeast Asia, across Asia and Africa (Open Data Labs, 2017). Nevertheless, to date, research on open government with a concentration on developing countries has been rare. Thus, this study attempts to fill the gap in existing indices and tools and construct a comprehensive government openness index with a focus on developing countries.
Theoretical framework
The OGP selected four dimensions to assess and promote the progress of open government: accountability; citizen participation; transparency; and technology and innovation (Open Government Partnership, 2015d). The OGP uses these dimensions to assess the status of participating countries’ commitment and action plans and to cover the broad areas in a balanced manner. Thus, this study adopts the four dimensions as a basic framework for developing a comprehensive GOI and the dimensions are further modified into the primary variables of this study.
The first dimension, ‘accountability,’ refers to “rules, regulations and mechanisms in place that call upon government actors to justify their actions, criticisms or requirements made of them, and accept responsibility for failure to perform with respect to laws or commitments” (Open Government Partnership, 2016: 3). Specifically, it indicates the juridical requirements of laws or policies in a legal context. This definition is adopted for this study.
The second dimension, ‘citizen participation’ means, according to the OGP, when “governments seek to mobilize citizens to engage in a dialogue on government policies or programs, provide input or feedback, and make contributions that lead to more responsive, innovative and effective governance” (Open Government Partnership, 2016: 3). For example, open government actively encourages the dissemination of public data gathered at the taxpayer’s expense and allows most of the population to access government information. Citizens have an opportunity to actually play a part in the analysis, manipulation and mashing up of data in order to draw their own conclusions (Ding et al., 2011).
The third dimension, ‘transparency’, indicates “information on government activities and decisions is open, comprehensive, timely, [and] freely available to the public and meets basic open data standards” (Open Government Partnership, 2015b) In a transparent government, citizens are allowed to determine whether data used to create policy was applied appropriately (Janssen et al., 2012). When citizens can “engage directly in policy options and decision making, and can contribute ideas and evidence that lead to policies, laws” (CrowdPolicy, 2017) and when all of the data is open and available, the broad meaning of accountability can be achieved. An accountable government “makes itself answerable to the public, upholding standards of behavior and integrity, and both explaining and taking responsibility for its decisions and actions” (CrowdPolicy, 2017).
The fourth dimension of OGP, open government, provides “citizens with open access to technology” (Open Government Partnership, 2016: 3). Technology necessitates technological infrastructure and is one of the most important drivers in initiating open government activities. The International Telecommunication Union (2009) pointed out that e-government development relies on the availability of ICT infrastructure (e.g. broadband or WiFi), so countries primarily push to improve ICT first. Some studies have addressed the fact that African countries are ranked low in the United Nations’ E-Government Survey because of limited accessibility to ICT infrastructure (Irani et al., 2008; Beynon-Davies and Martin, 2004). Mobile technologies are opening up new opportunities for governments to encourage citizen involvement, as they are inexpensive and easily distributed. However, Wirtz and Birkmeyer (2015) emphasize that when citizens do not have the ability to use technology or if data is incompatible with legacy systems, this can be a significant barrier. Thus, more than just technological infrastructure, governments should recognize “the role of new technologies in driving innovation, and the importance of increasing the capacity of citizens to use technology” (Open Government Partnership, 2016: 3).
These four dimensions are mapped with the assessment factors of the Open Data Readiness Assessment methodology (World Bank, 2017). Policy/legal framework and institutional structures, responsibilities, and capabilities within a government are mapped with the ‘accountability’ of OGP, while civic engagement and capabilities for open data are mapped with OGP’s ‘citizen partnership’, and national technology and skills infrastructure are mapped with OGP’s ‘technology and innovation’.
Objectives of the study
The objectives of this study are to: develop a comprehensive government openness index (GOI) for developing countries and to identify the trends and changes of GOI explore the relationship among GOI and the four variables that are used to develop the GOI in developing countries examine the relationship between the GOI and income levels.
Composition of GOI and data
Based on the OGP’s four dimensions, as explained in the theoretical framework for developing a comprehensive GOI, a suggested GOI is composed of the following four variables extended from the OGP’s dimensions: accountability (ACC) information and communication technology (ICT) citizen participation and freedom (CPF) transparency (TRA).
Each variable consists of several components that are adopted and taken from worldwide data sources. The data selection and adoption are based on the following criteria: the dataset is reliable with value to the given topic the data source has a broad and specialized coverage of the topic the data creation agency is an authoritative and reliable institution the dataset is popular and frequently adopted in the relevant field.
The composition of data sources is displayed in Table 1.
Data sources and variables.
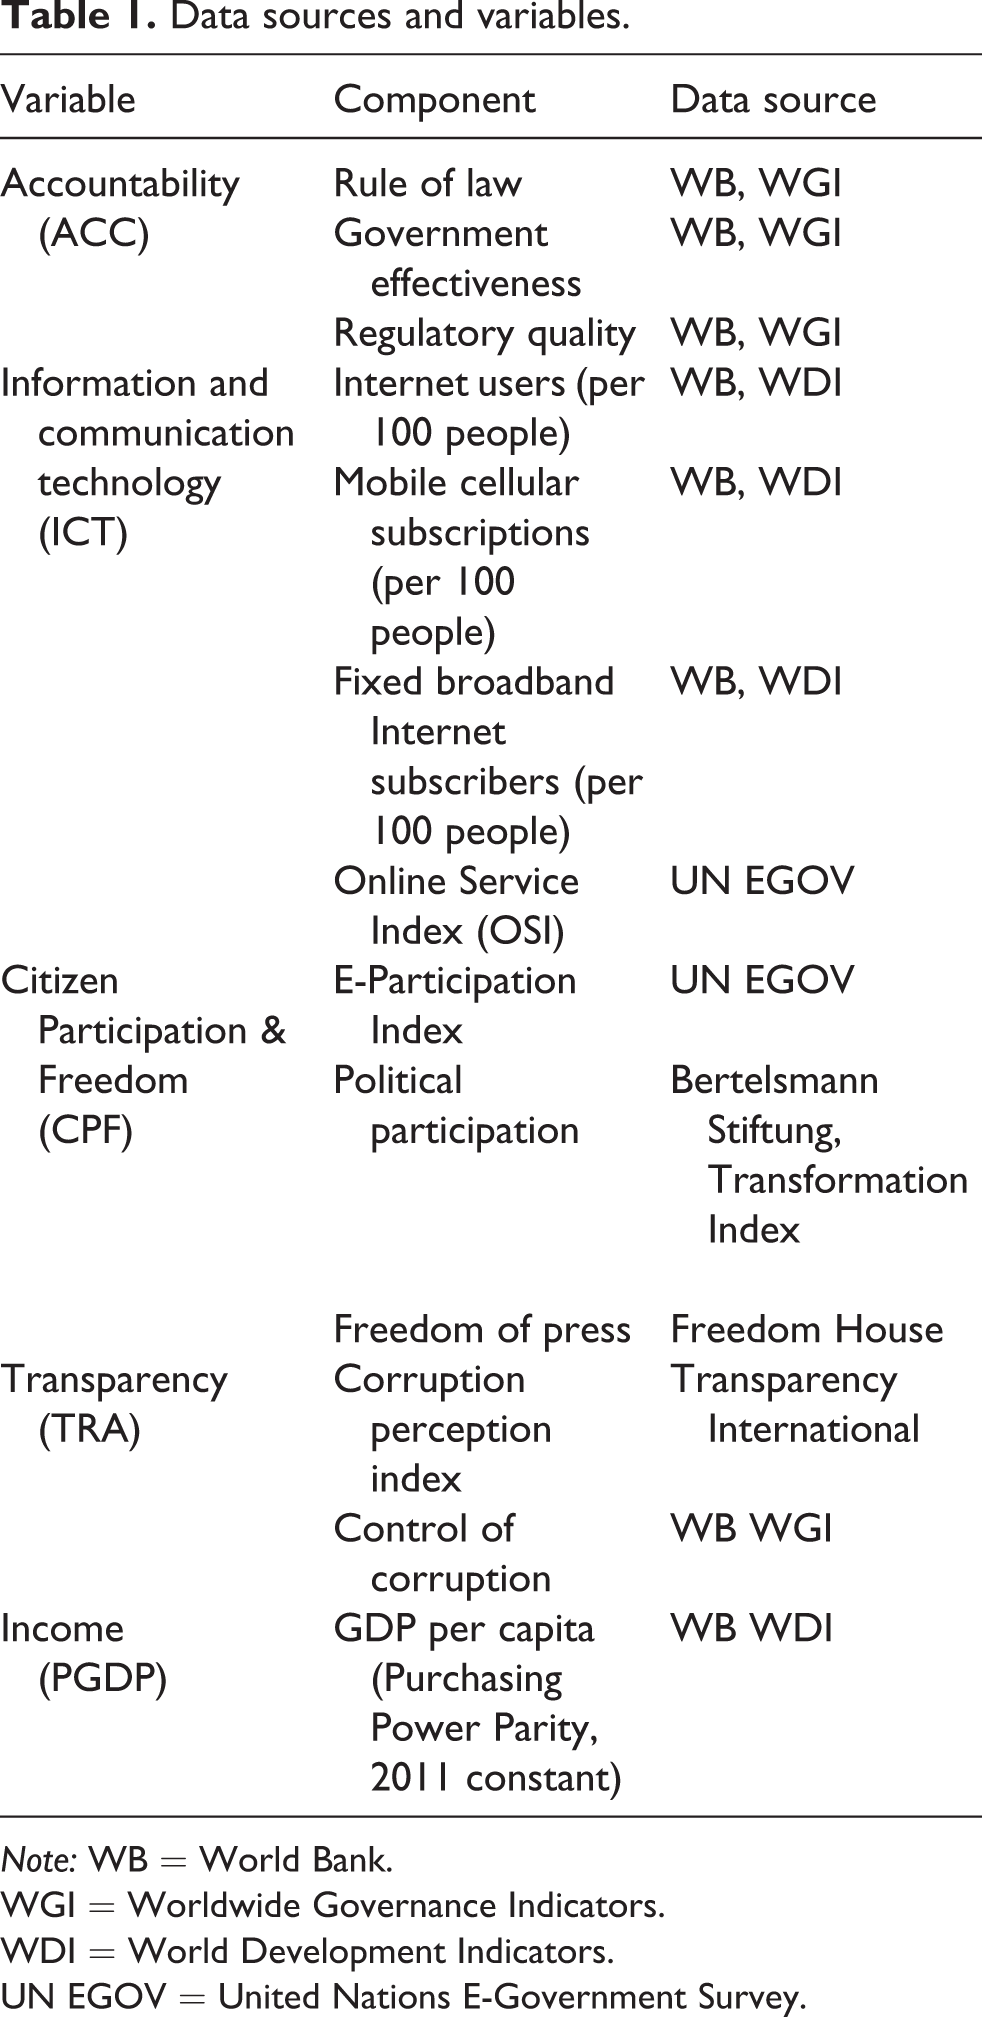
Note: WB = World Bank.
WGI = Worldwide Governance Indicators.
WDI = World Development Indicators.
UN EGOV = United Nations E-Government Survey.
Accountability (ACC)
First, since a specific definition of accountability as a legal requirement is adopted in this study, ACC consists of three components: rule of law, government effectiveness, and regulatory quality. These three kinds of data are taken from the World Bank’s Worldwide Governance Indicators (WGI) (2017), which is one of the most comprehensive governance indicators (e.g. rule of law, government effectiveness, regulatory quality and others) in over 200 countries, made by a reliable agency and commonly adopted in the studies of social sciences (e.g. information studies, economics, sociology, international relations, public administration among others).
Information and communication technology (ICT)
ICT consists of four components: three infrastructure facilities and one area of service. These are: the number of Internet users (per 100 people), mobile cellular subscriptions (per 100 people), fixed broadband Internet subscribers (per 100 people), and the Online Service Index (OSI). The former three data areas are taken from the World Bank’s World Development Indicators (WDI) (2016), which are selected as an accurate source of global development data that include specific ICT related items and facilities. The OSI is the quantitative outcome of a survey on a government’s use of services, delivery, and bridging the digital divide, which is taken from the United Nations E-Government Survey (United Nations Department of Economic and Social Affairs, 2014). These data sources are selected because they contain both broad and specific data from authoritative agencies regarding ICT and e-government.
Citizen participation and freedom (CPF)
CPF has been expanded upon more in this study than the dimensions of OGP, as it has three components: the e-participation index, political participation, and, in particular, freedom of press - to assess the weight of freedom in developing countries. The e-participation index is taken from the United Nations E-Government Survey. This is a qualitative assessment of online service tools on government websites that are meant to improve communication between citizens and government. It was selected because it presents “the comparative ranking of countries as indicative of the broad trends in promoting citizen engagement” (United Nations, 2014: 196). Political participation is taken from the 17 criteria of the Bertelsmann Transformation Index (Bertelsmann Stiftung, 2017). Freedom of the press is taken from Freedom House’s Freedom in the World (2016), which is selected since it is dedicated to freedom and democracy across the world and is one of the most reliable and renowned data sources on freedom of the press.
Transparency (TRA)
TRA consists of two components: the Corruption Perception Index and the Control of Corruption. The Corruption Perceptions Index is from Transparency International, which is considered a commonly adopted data source on the issue of corruption and international policy (Transparency International, 2016). The Control of Corruption is taken from the World Bank’s WGI (2017).
The final variable and data source used to analyse the relationship between GOI and income is real GDP per capita (PGDP) for income levels, which is taken from the World Bank’s WDI (2016). The World Bank classifies countries into four income groups. For the 2015 fiscal year, low-income economies are defined as those with “a gross net income (GNI) per capita, calculated using the World Bank Atlas method, of US$1,045 or less in 2013; lower middle income economies are those with a GNI per capita between US$1,045 and US$4,125; upper middle income countries are between US$4,125 and US$12,746; high-income economies are US$12,746 or more” (World Bank, 2016). The World Bank divides countries into developing countries (middle-and low-income countries) and developed countries (high-income countries) (World Bank, n.d.). Based on the World Bank’s classification, this study deals with developing countries and their income groups. The list of developing countries selected for this study is presented in Table 2 according to income group and GOI values. The list of developing countries was selected from the World Bank WDI’s country list. The countries without values were removed, resulting in a total of 101 countries.
The list of developing countries with GOI and income group.
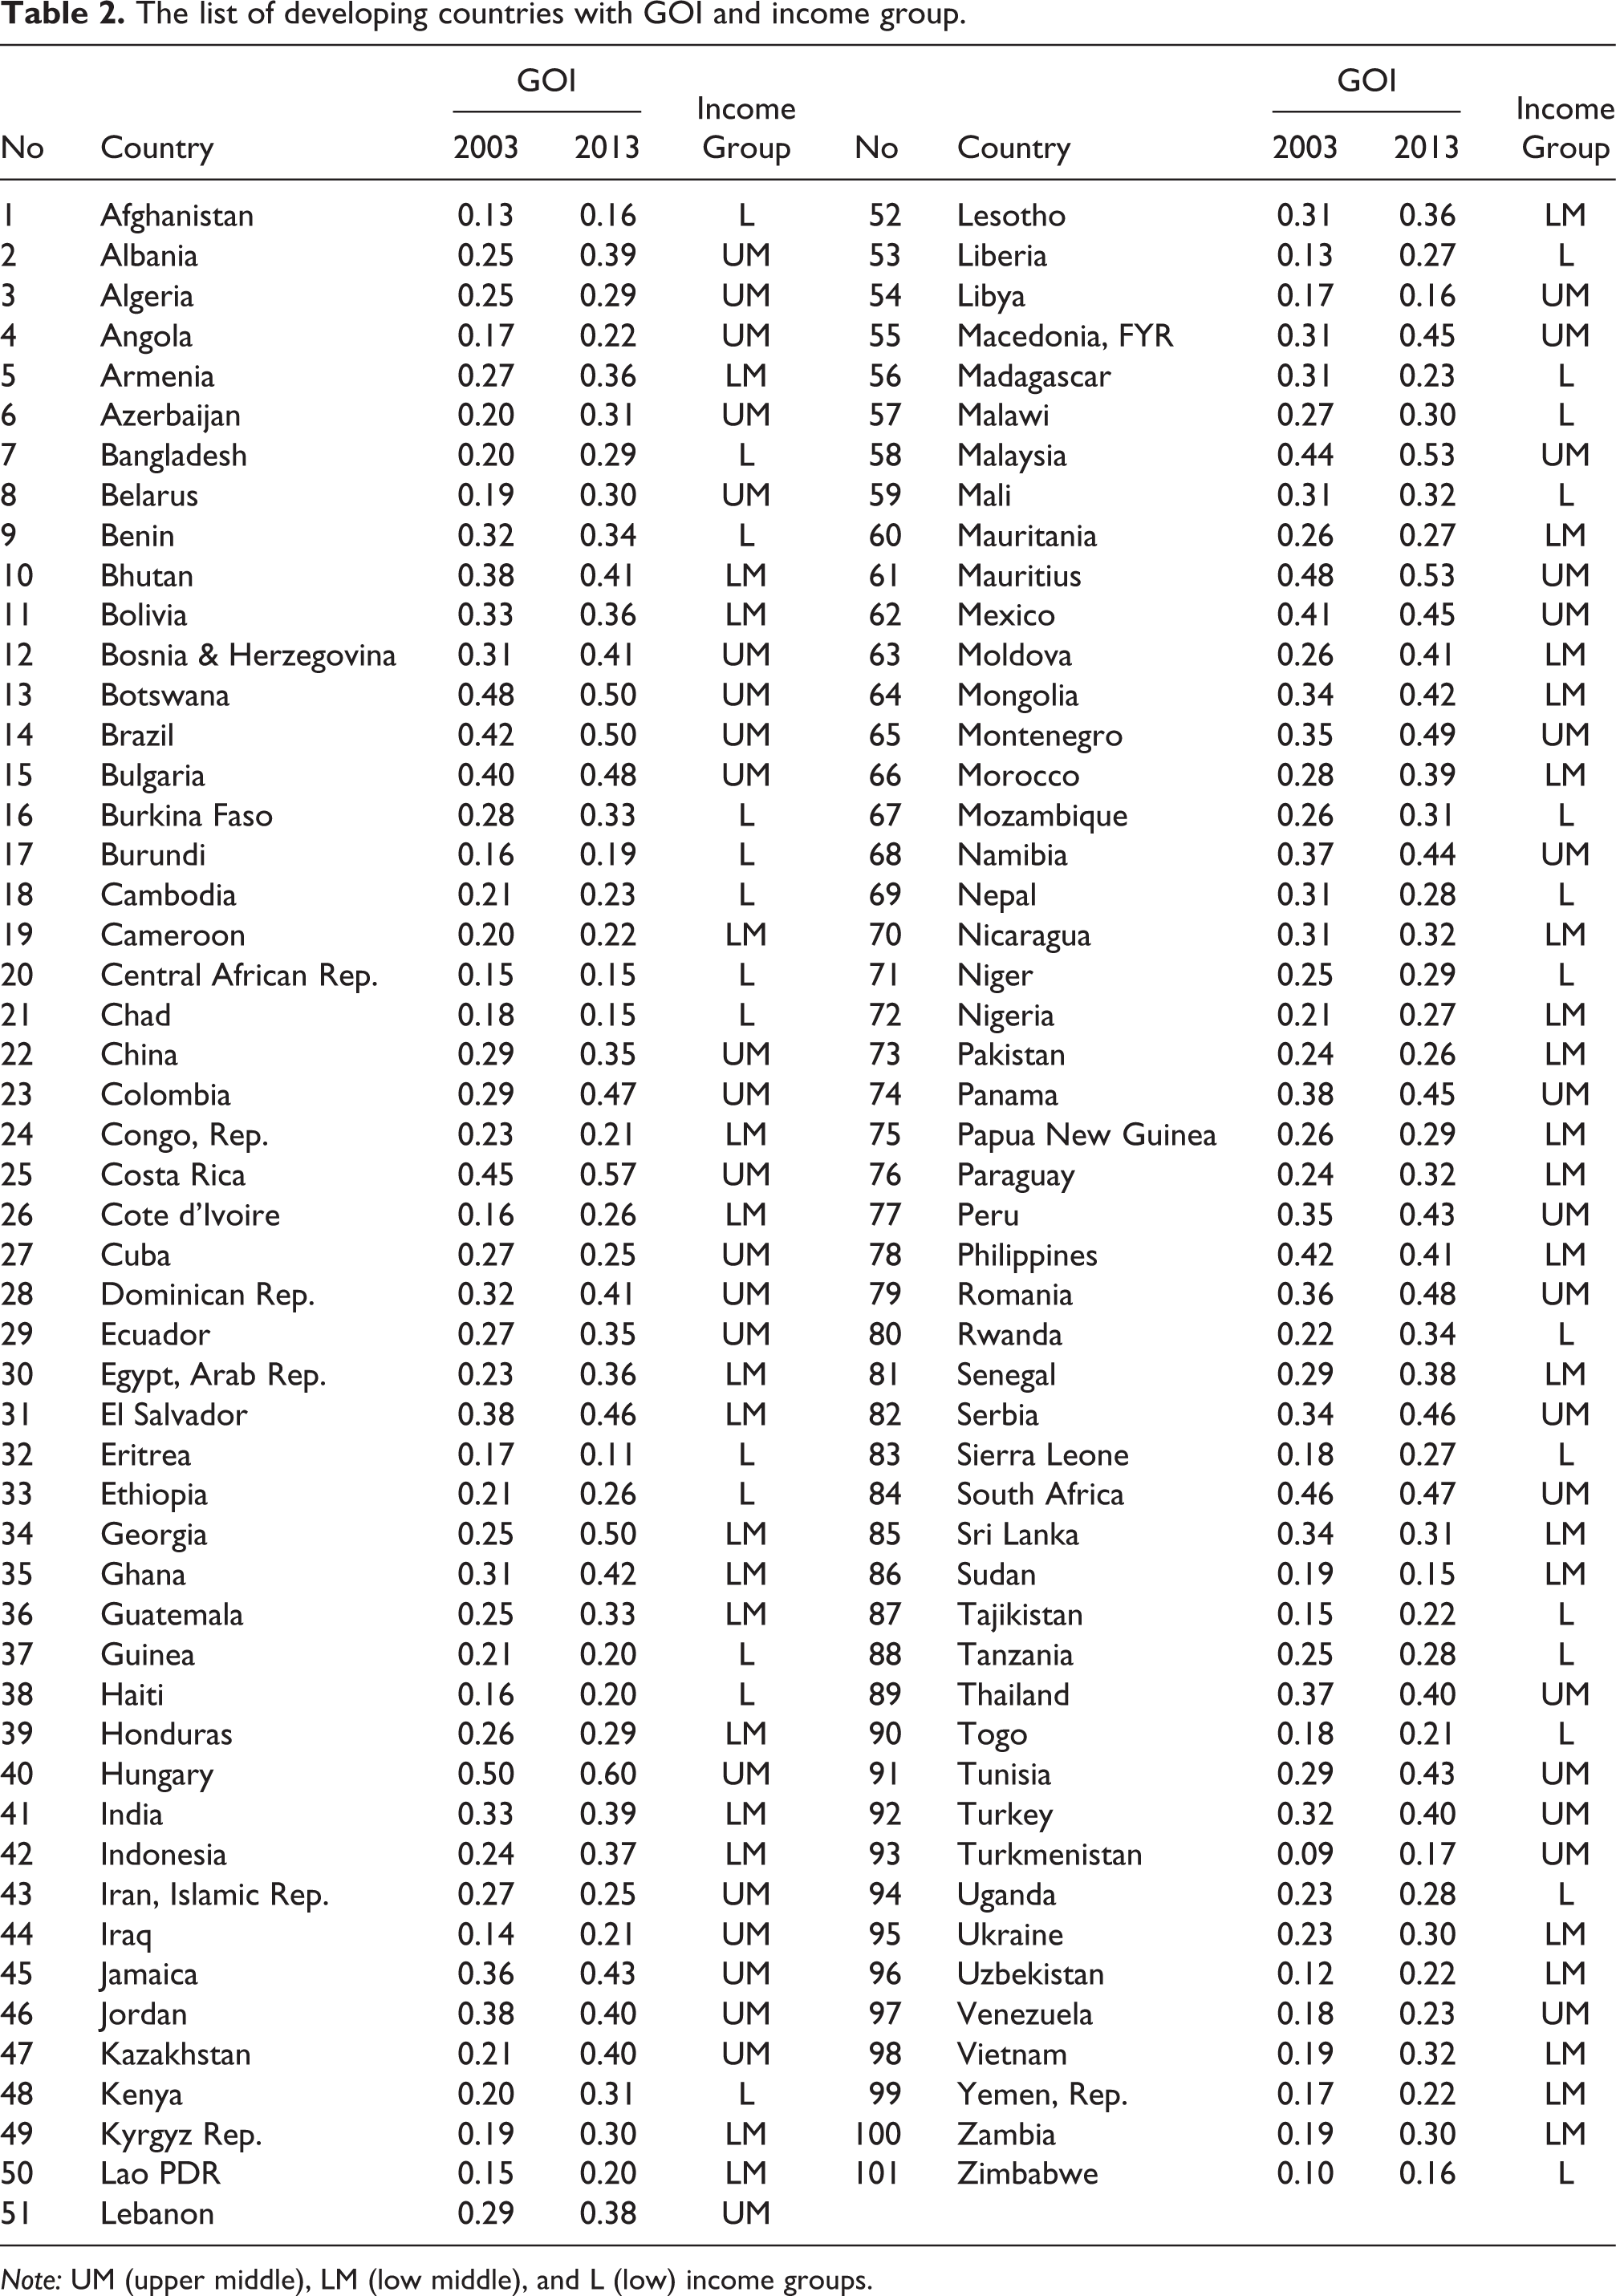
Note: UM (upper middle), LM (low middle), and L (low) income groups.
Research procedures
The research was conducted using six steps.
First, as all of the values of components and variables have different units and ranges, they should be put into equal weights and ranges prior to developing a GOI. Components that are taken from data sources are standardized by adopting the linear scaling method (LSM) from Osberg and Sharpe (2005), calculated with the following formula: LSM index = (Value - Min) / (Max - Min) where, Max = global Max + |global Max * 10%|, Min = global Min - |global Min * 10%|
Second, by using the linearized values and equal weights, the values of four variables (ACC, ICT, CPF, and TRA) are developed. They are then summed up and divided by 4, producing the value of GOI for each country.
Third, using panel data, the levels and change rates of trends for the entire developing countries over the past 11 years (2003-2013) are listed and compared.
Fourth, this study calculates the coefficient of variations, which is a standard deviation divided by the average in each year. The increase in the coefficient of variation value over time means that the gaps between countries are enlarged. In other words, an increase (decrease) in a coefficient of variation in a variable means a divergence (convergence) among the countries for the time period.
Fifth, the correlations between the four variables, GOI, and PGDP are conducted. These correlations are also analysed for the three income groups: upper middle, lower middle, and low income groups, based on the country classification of the World Bank.
Sixth, this study performs a panel regression analysis focusing on the GOI and PGDP. Through the regression analysis, this study examines the relationships of GOI and income.
Results
Global trend
Table 2 displays a GOI value of 101 developing countries. Table 3 and Figure 1 show the global trends of GOI and four variables (i.e., accountability (ACC), information and communication technology (ICT), citizen participation and freedom (CPF), and transparency (TRA). All of the values increased during the period. To identify the growth change of each variable, the highest average annual growth rate (AAGR) is in ICT (13.85%), followed by GOI (2.37%), TRA (1.47%), CPF (1.06%), and ACC (0.07%). Among these values, ICT has increased the fastest and ACC the slowest. Two variables, CPF (2009–2011) and TRA (2008–2010) decreased during the global financial crisis years (2008-2009). However, even during the same period, the other three variables, ACC, ICT, and GOI, increased.
Global means of GOI and four variables by year.
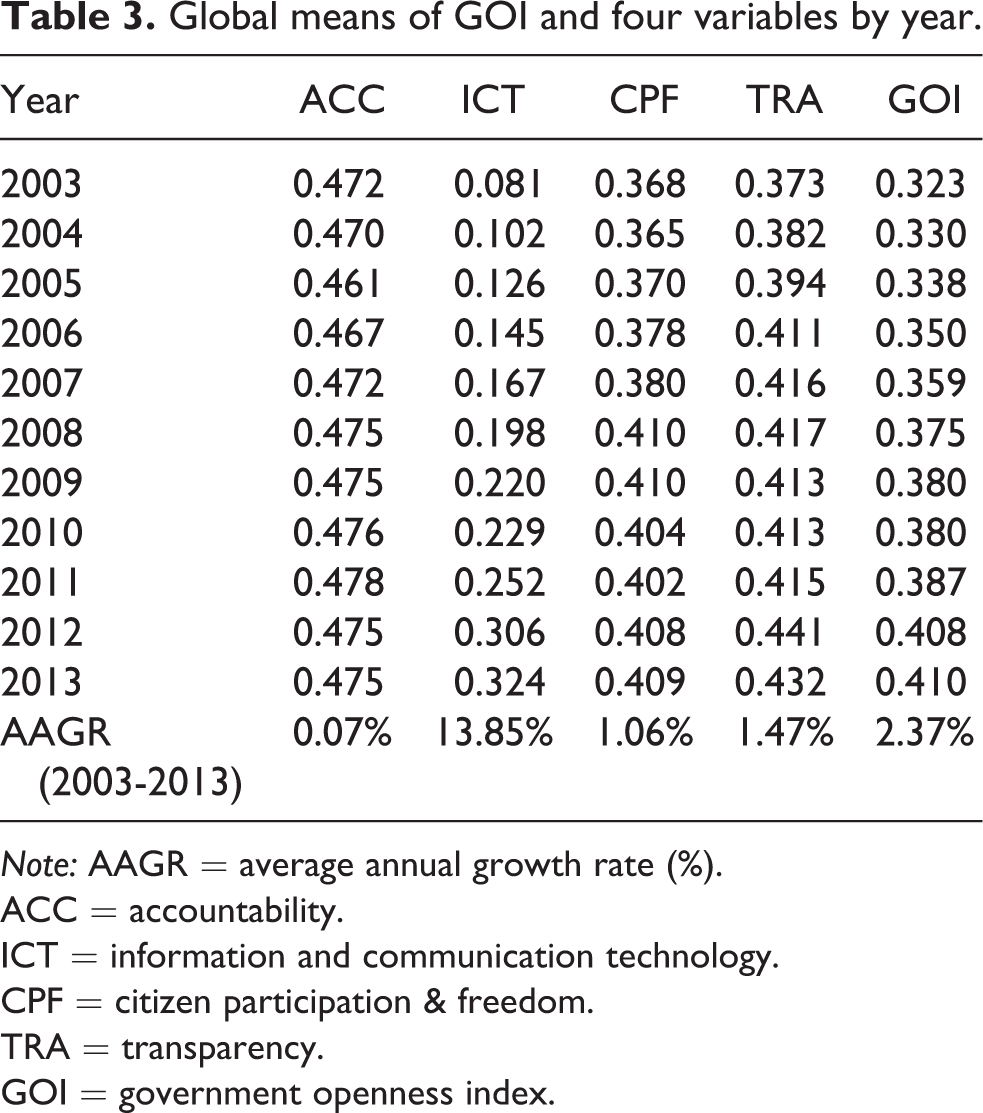
Note: AAGR = average annual growth rate (%).
ACC = accountability.
ICT = information and communication technology.
CPF = citizen participation & freedom.
TRA = transparency.
GOI = government openness index.
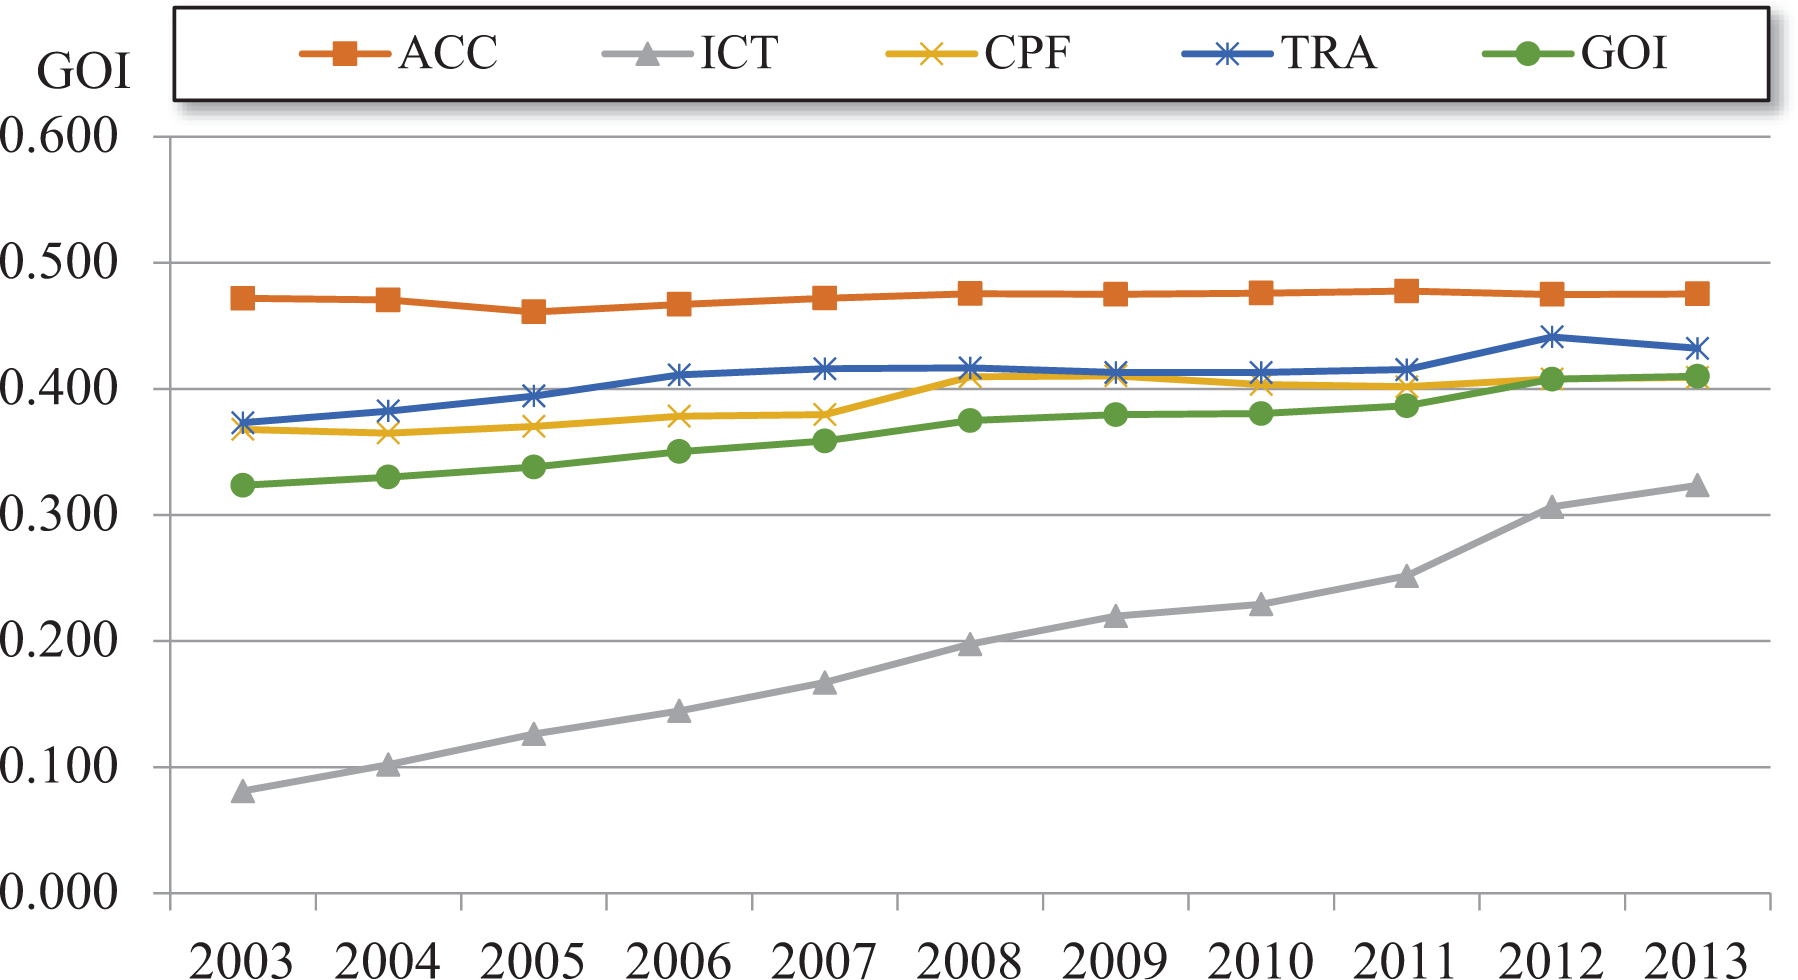
Trends of GOI and four variables.
Figure 1 displays the trend of changes in GOI and four variables. Overall, all of them increased during the period.
While two variables (CPF and TRA) and GOI increased slightly, the ICT increased steeply and ACC remained steady. Among the four variables, ICT increased the most.
To take a closer look at the GOI value changes by income level, Figure 2 divides countries into four income groups: all, upper middle, lower middle, and low groups. The vertical axis represents the values of GOI.
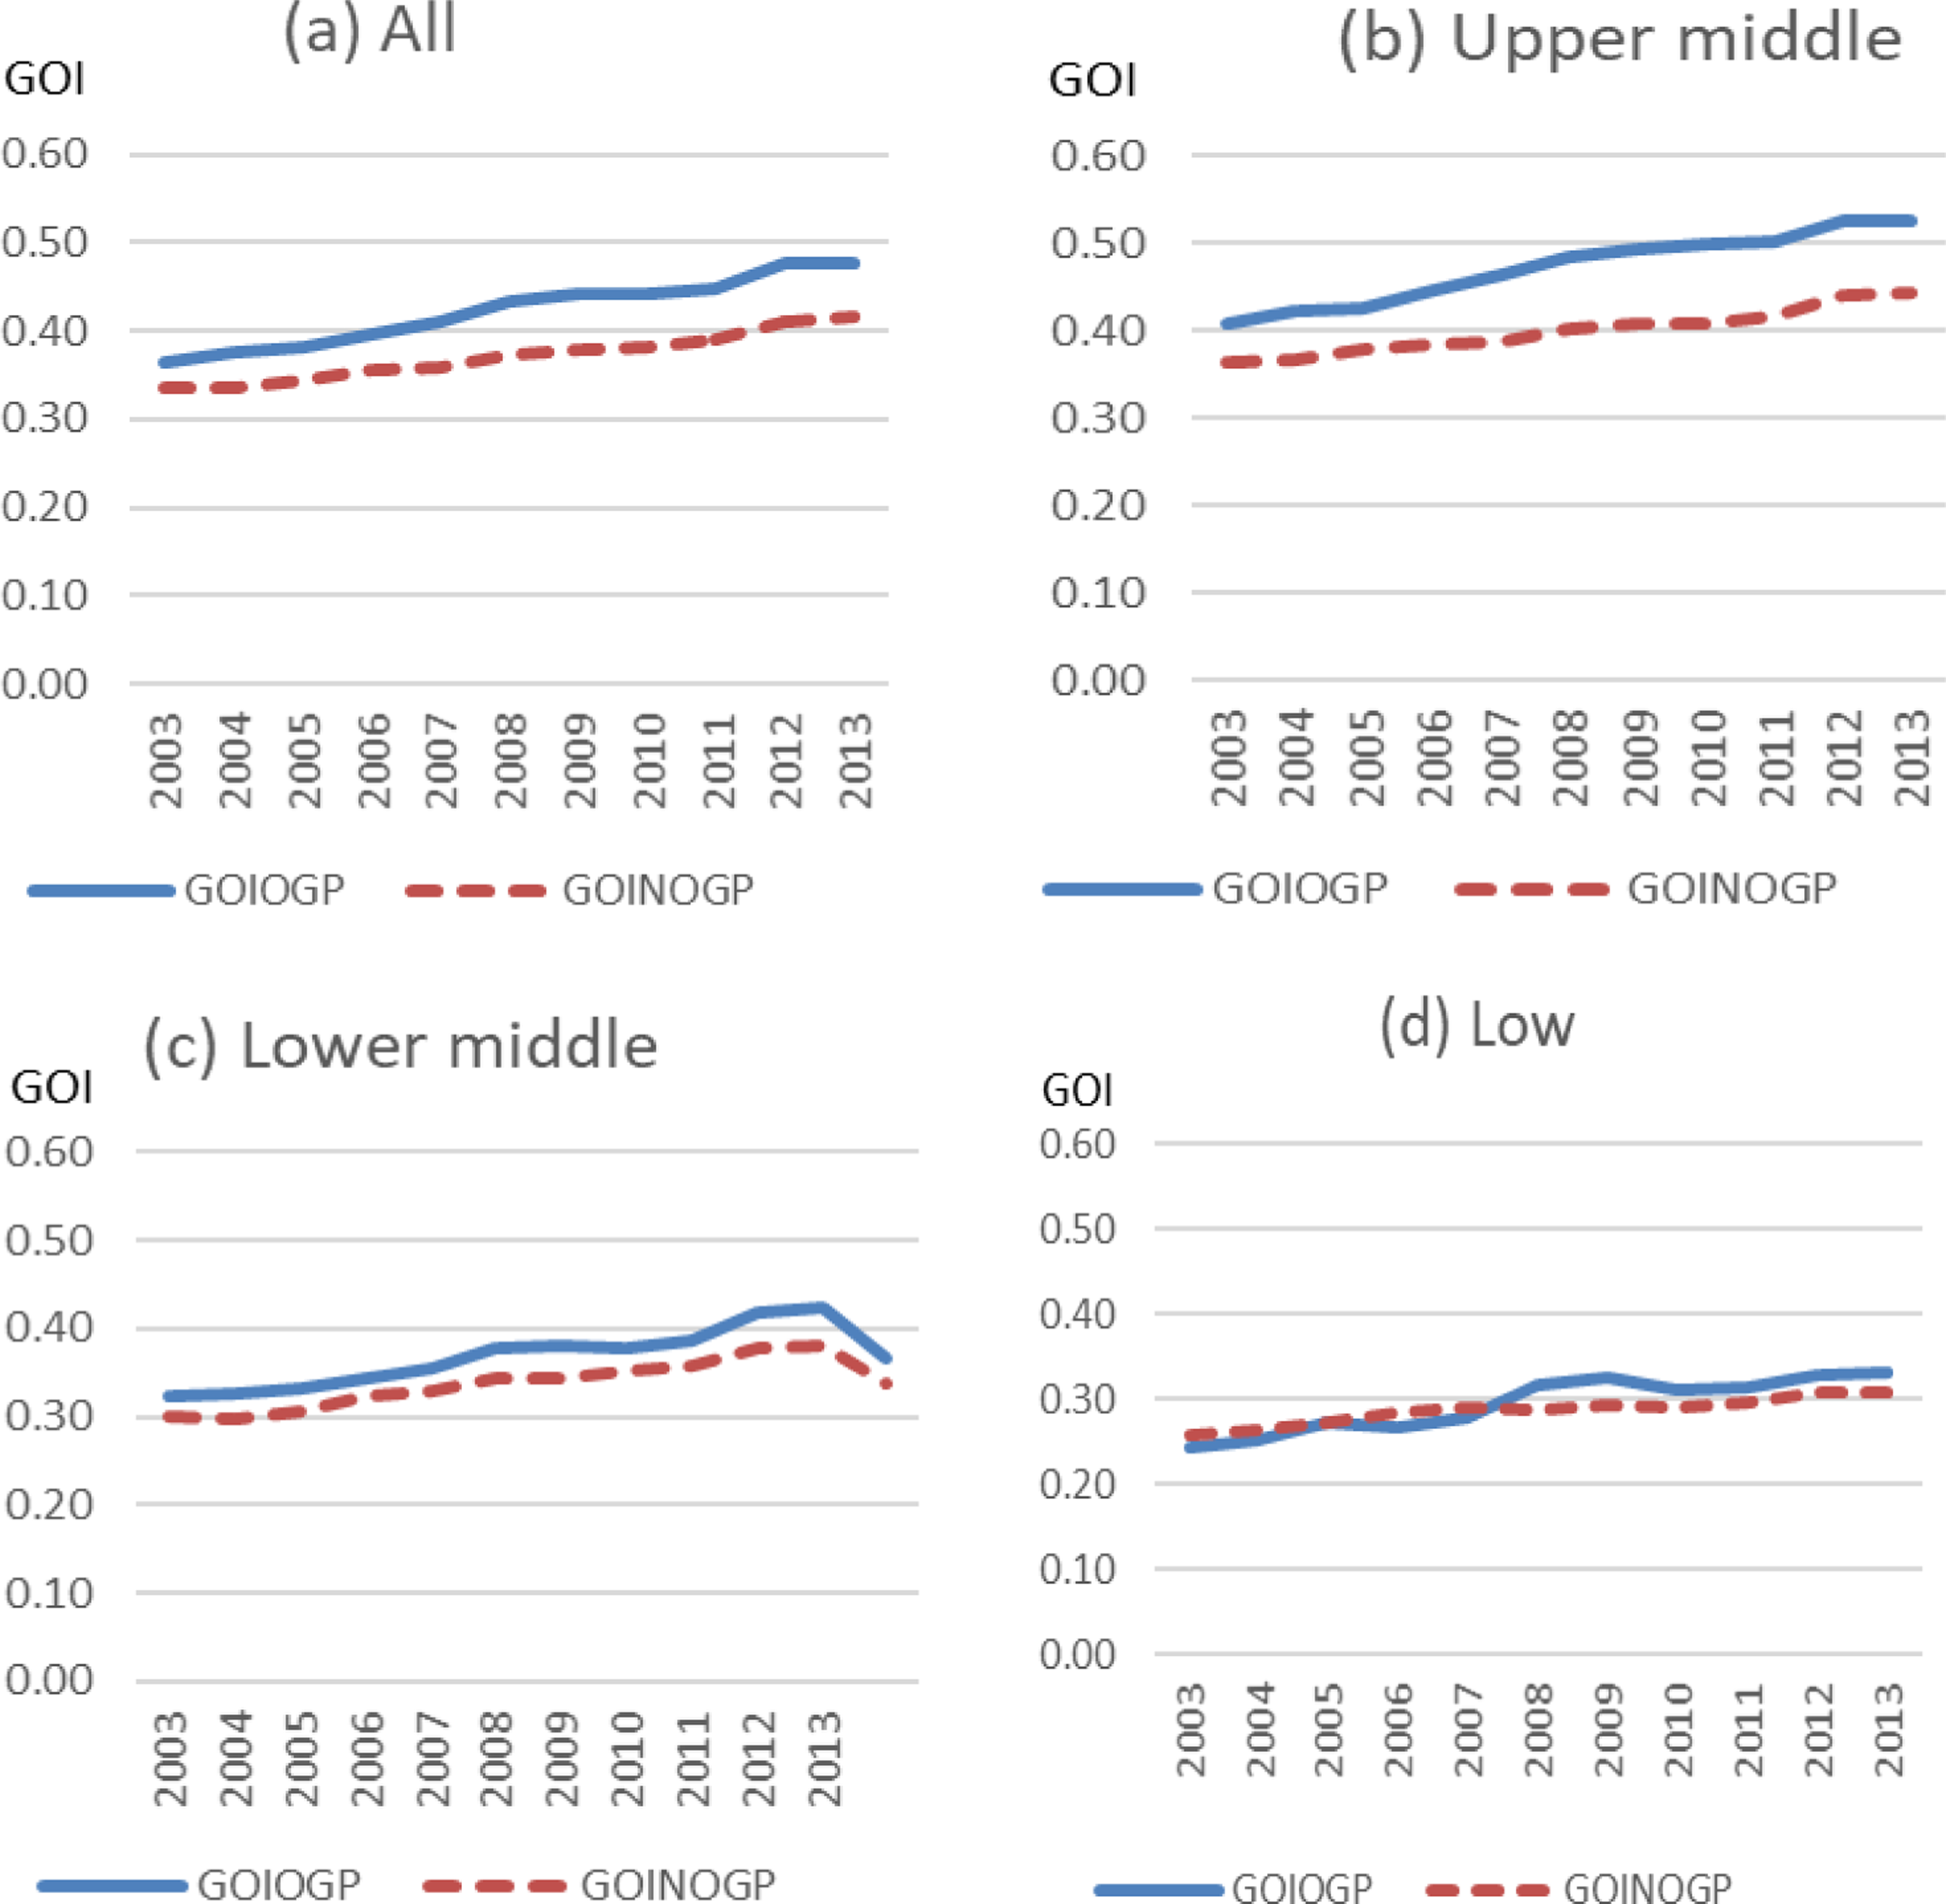
Trends of GOI means by OGP membership and income group.
In each graph, each group is further sub-divided into participating countries from the OGP and non-member countries. Figure 2 shows that changes move upward in all four cases. The values of the upper middle group are higher than the lower middle and low groups in both the GOP and NGOP groups. The OGP member countries from the developing countries perform much better in all countries and the upper middle, and slightly better in the lower middle group.
Coefficient of variation
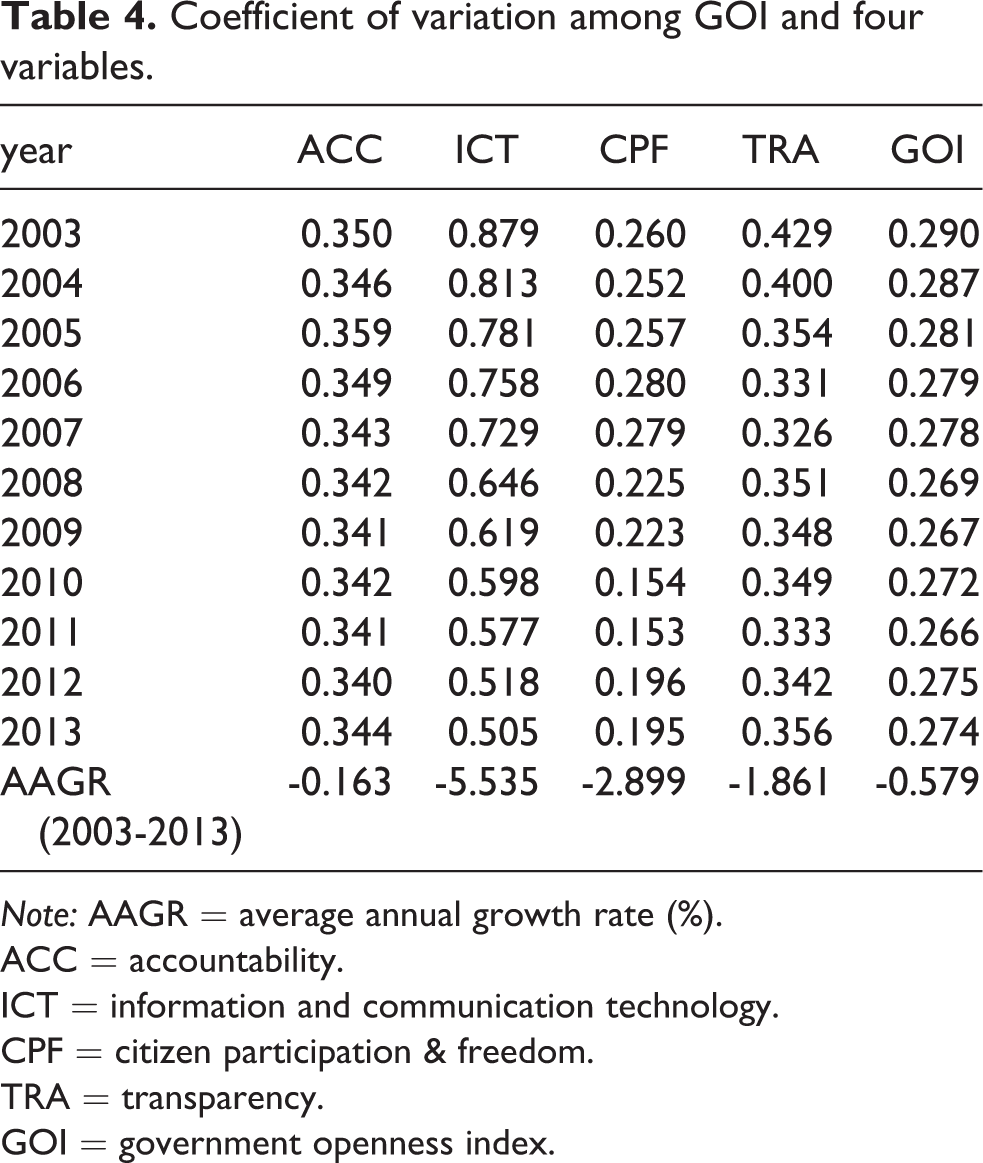
To explore the relationship among the GOI and the four variables, Table 4 shows a trend of coefficient of variation (CV) for the four variables and GOI. Looking at AAGRs during the period, the results of the CVs illustrate negative numbers, meaning that there is convergence among the countries. In other words, the gaps among the countries have been reduced. The size of CVs shows that ICT has the largest negative AAGR value, which means that the speed of convergence for ICT is the fastest, followed by CPF, TRA, GOI, and ACC in absolute size.
Coefficient of variation among GOI and four variables.
Note: AAGR = average annual growth rate (%).
ACC = accountability.
ICT = information and communication technology.
CPF = citizen participation & freedom.
TRA = transparency.
GOI = government openness index.
Correlation
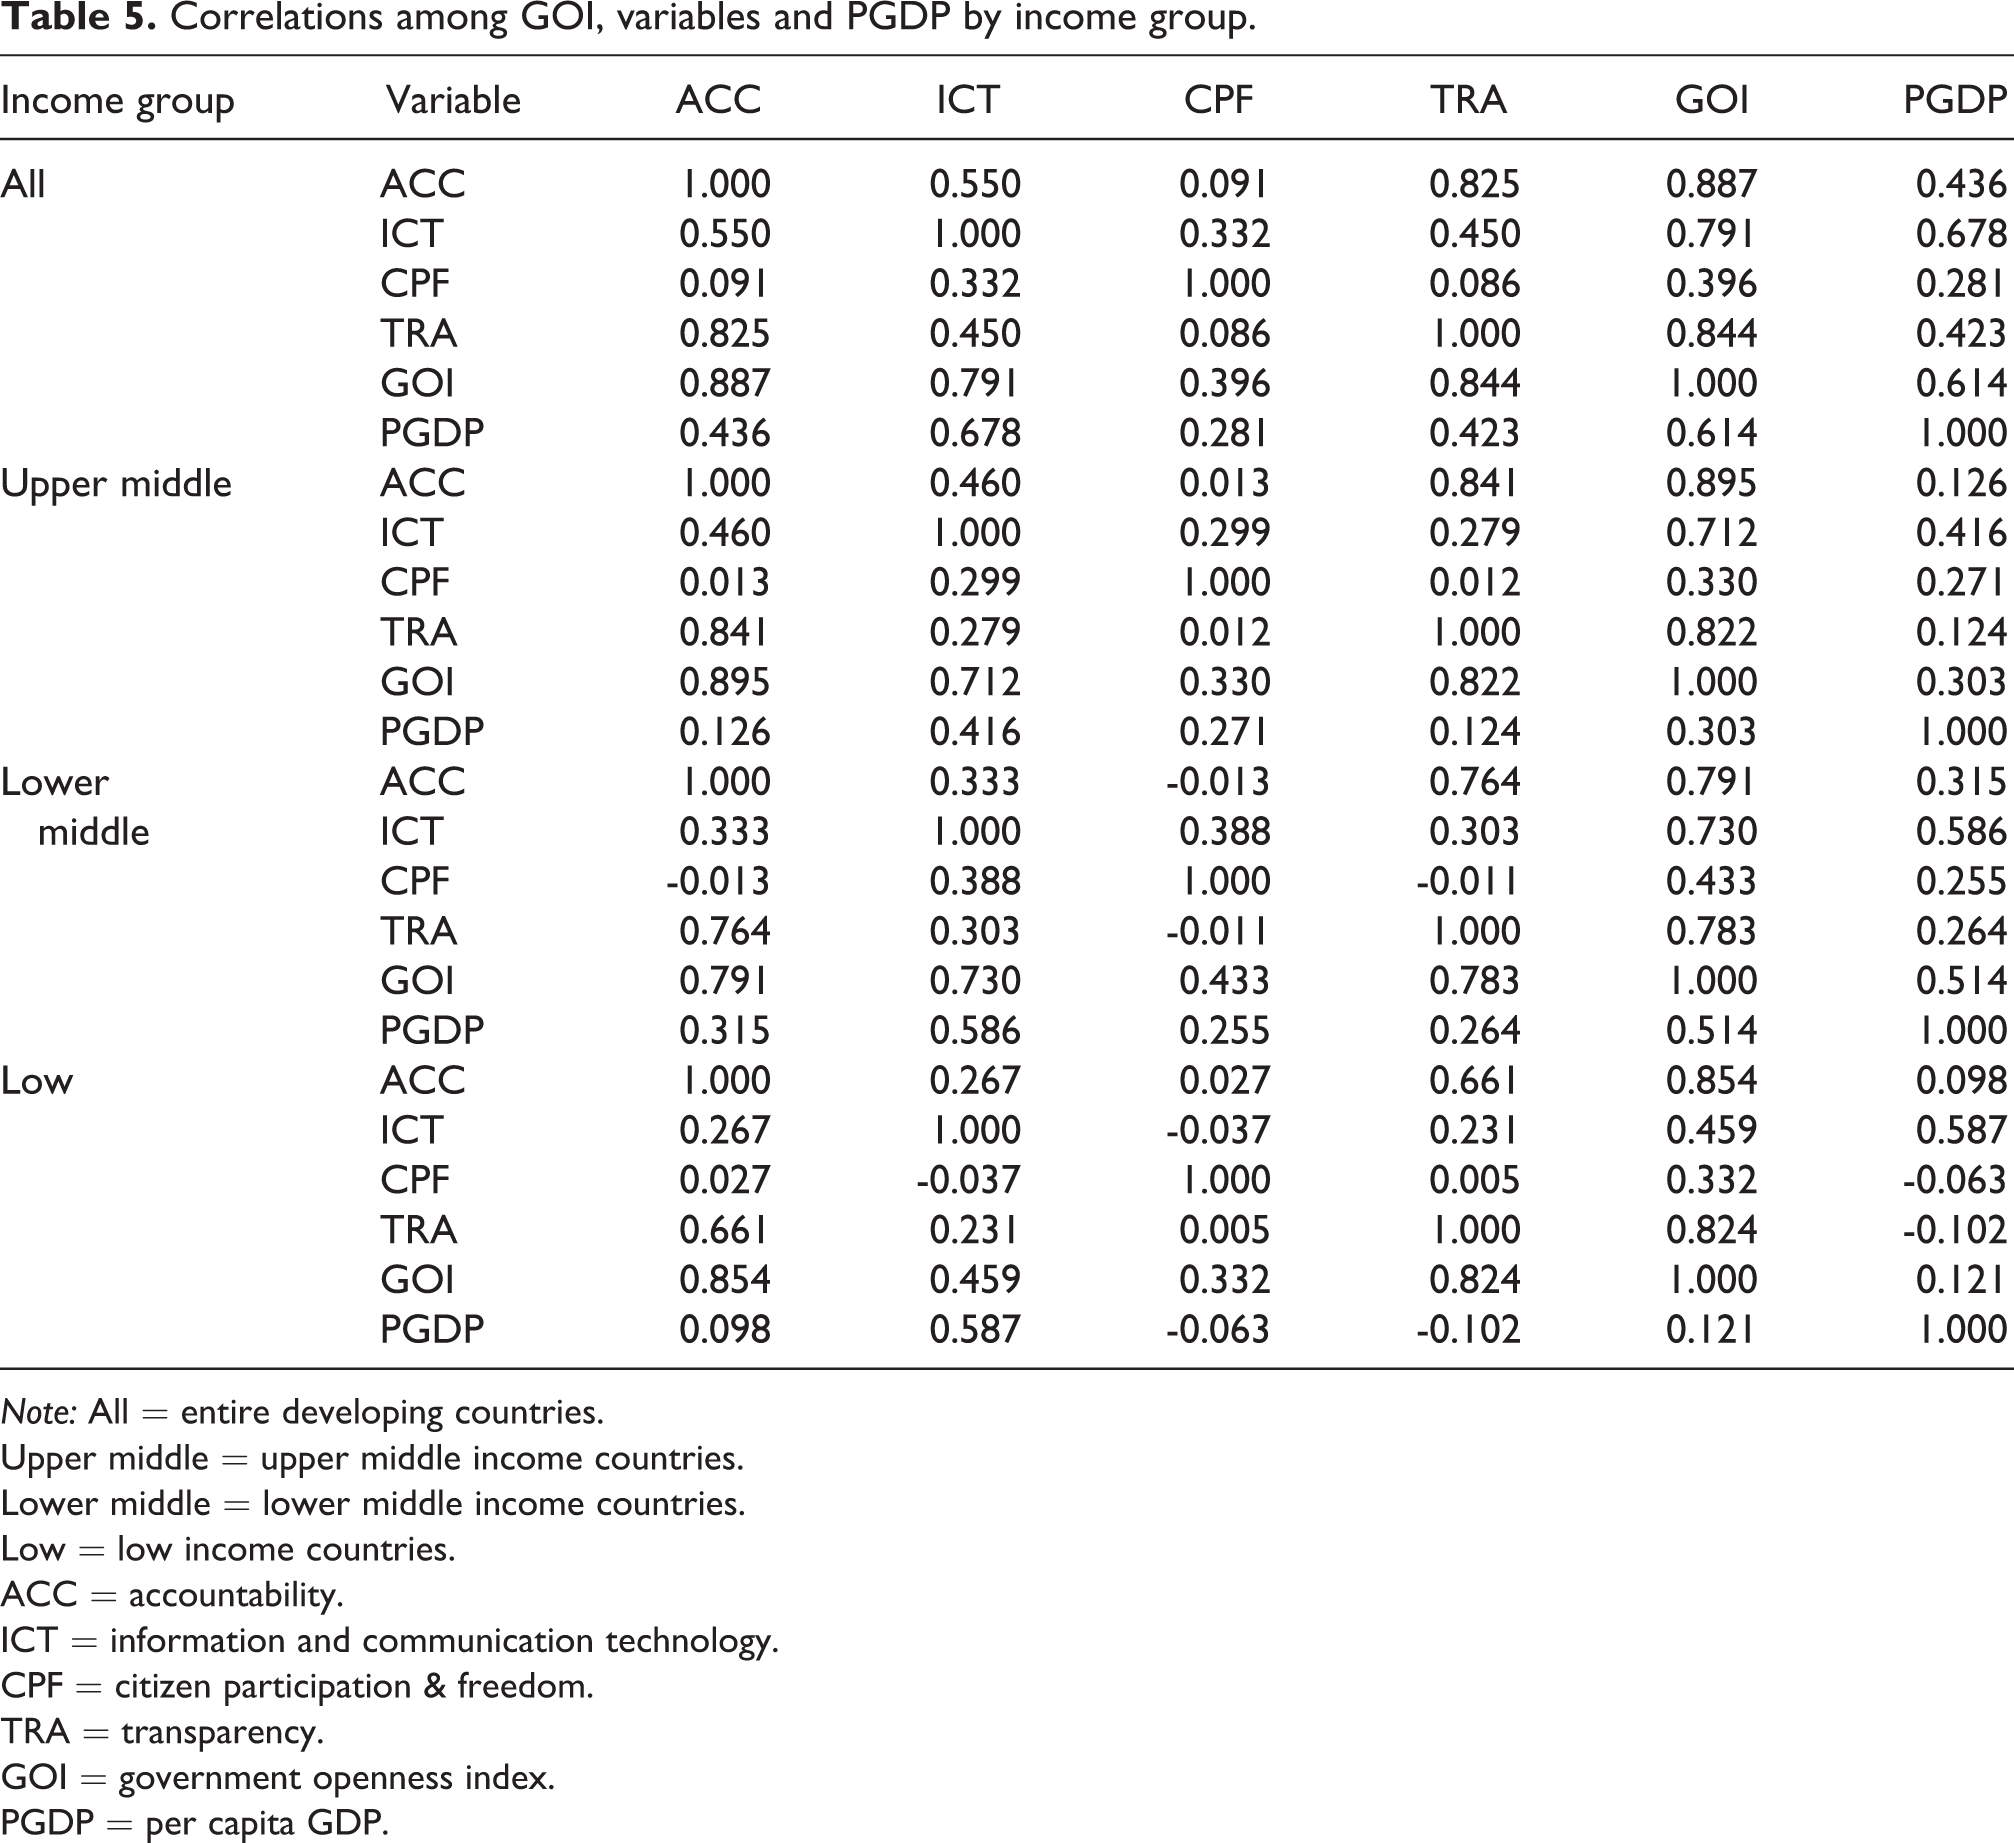
Table 5 shows the correlation among the four variables and GOI by income group.
Correlations among GOI, variables and PGDP by income group.
Note: All = entire developing countries.
Upper middle = upper middle income countries.
Lower middle = lower middle income countries.
Low = low income countries.
ACC = accountability.
ICT = information and communication technology.
CPF = citizen participation & freedom.
TRA = transparency.
GOI = government openness index.
PGDP = per capita GDP.
In all developing countries, ACC has the highest correlation with GOI (0.887), followed by TRA (0.825), ICT (0.550) and CPF (0.091). As for income (PGDP), ICT (0.678) has the highest correlation, followed by GOI (0.614), ACC (0.436), TRA (0.423), and CPF (0.281). This high correlation value of ICT with income implies that ICT has the biggest positive impact on economic growth. On the other hand, the lowest correlation of CPF with income indicates that CPF has no impact on the income level of developing countries. In other words, the sample countries have not made enough of an effort to promote citizen participation and freedom.
In comparison to correlation coefficients by income groups in different countries, ICT values with GOI in the upper and lower middle income groups have similar correlation coefficients (0.712 and 0.730, respectively) but a very low coefficient (0.459) in the low income group. CPF has a negative correlation coefficient with ACC (-0.013) and TRA (-0.011) in the lower middle income group and with ICT (-0.037) and PGDP (-0.063) in the low income group. This implies that citizen participation does not have an impact on the low income group.
Rates and levels of contribution
The contribution rate estimates the portion that each variable contributes to the change in GOI so that the sum of the contribution rate of each variable equals 100%.
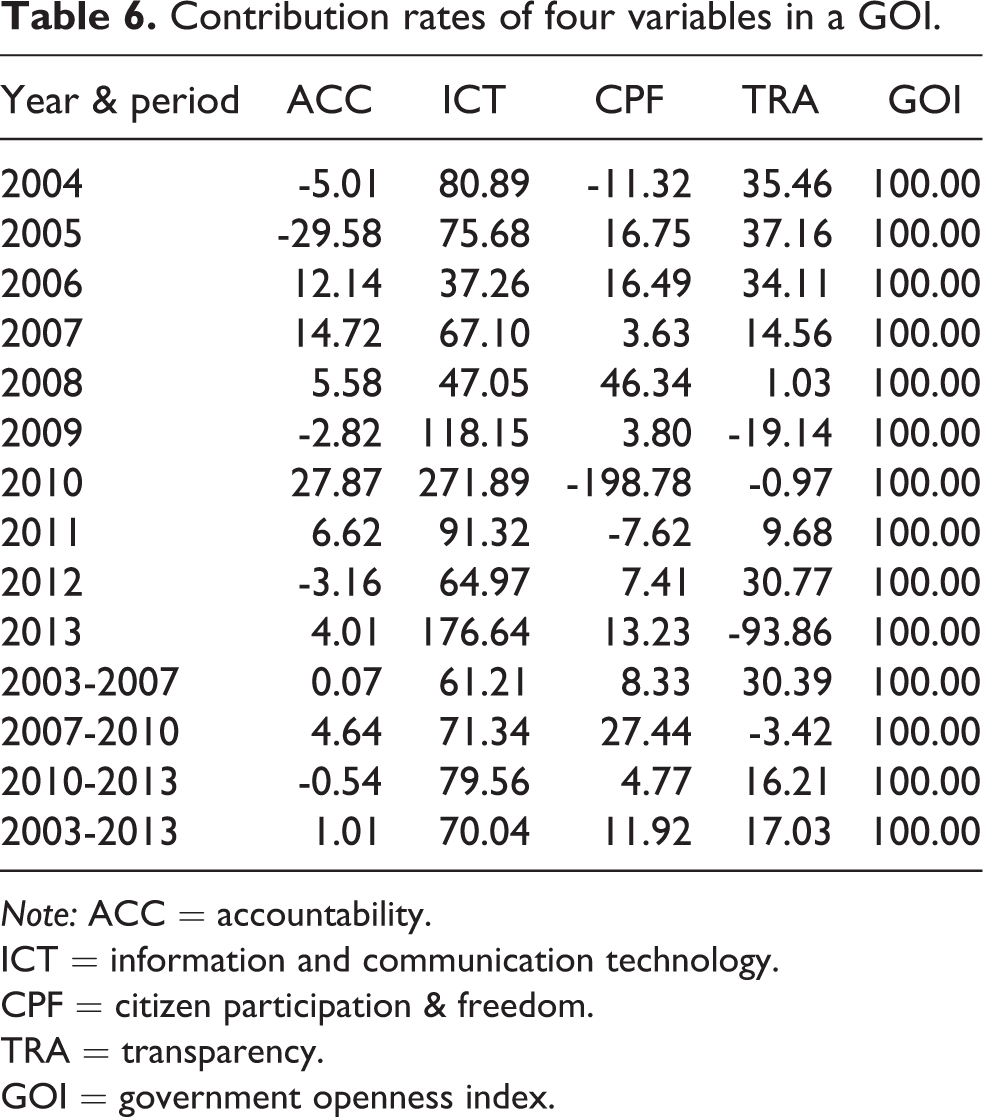
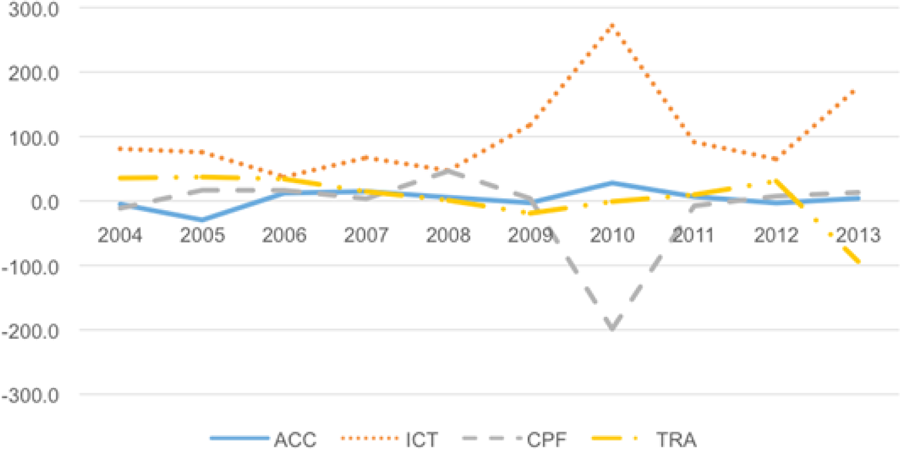
As demonstrated in Table 6, for the full period, ICT has the highest contribution rate of GOI (70.04%), followed by TRA (17.03%), CPF (11.92%), and ACC (1.02%). As for the change of contribution rates in Figure 3, CPF and ICT variables fluctuate in a relatively larger amount than those of the other two variables. In particular, it is noticeable that ICT moves in opposite symmetry to CPF.
Contribution rates of four variables in a GOI.
Note: ACC = accountability.
ICT = information and communication technology.
CPF = citizen participation & freedom.
TRA = transparency.
GOI = government openness index.
Movement of contribution rates in a GOI.
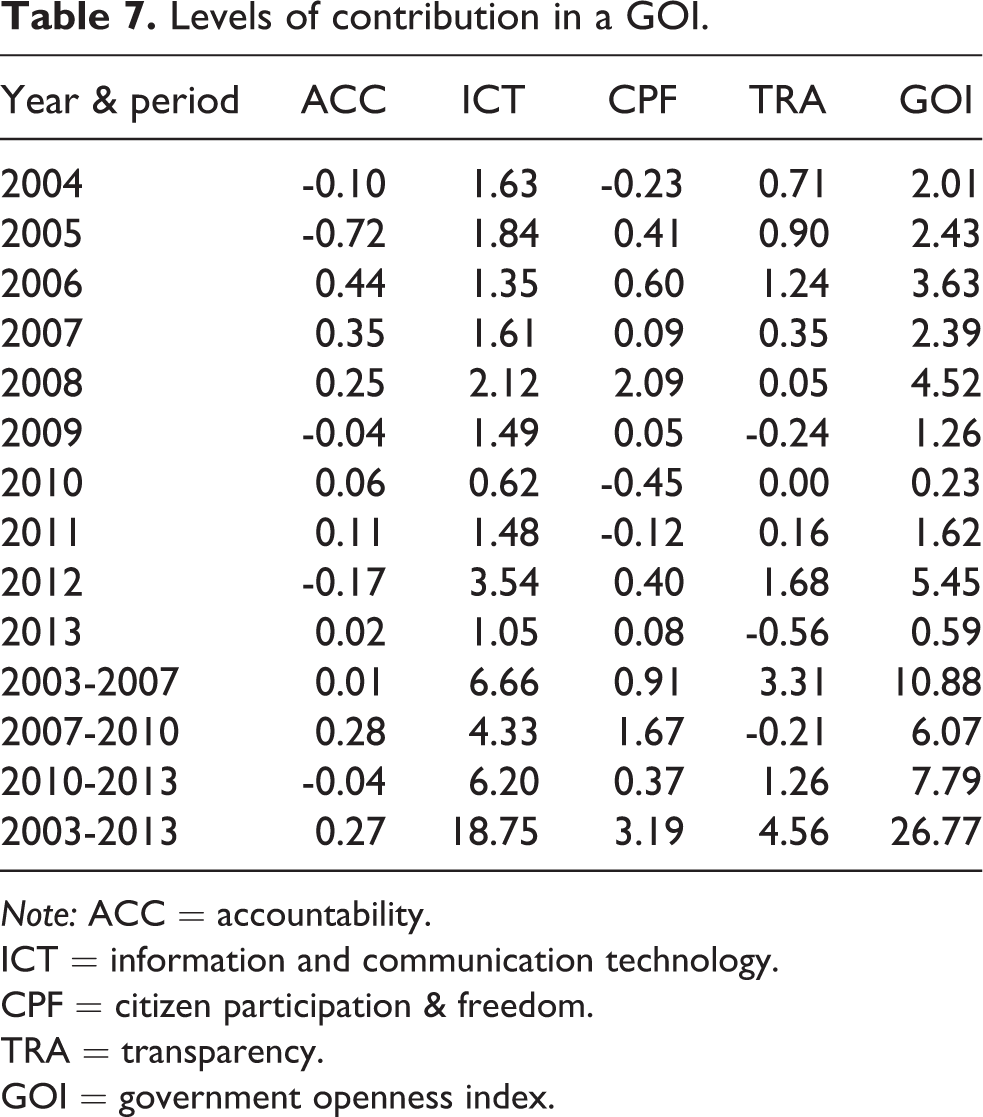
On the other hand, the contribution level is the growth rate of four variables in the composition of GOI, so the sum of contribution levels in each variable makes up the growth rate of GOI. Table 7 shows that there is a dominant effect of ICT on the change rate of GOI. For the full period, GOI increased by 26.77%, consisting of ICT (18.75%), TRA (4.56%), CPF (3.19%), and ACC (0.27%). TRA increased during 2003-2007 but decreased - to negative levels (-0.21) - in 2007-2010 and increased again in 2010-2013. CPF fluctuates, as does ACC, by a small amount.
Levels of contribution in a GOI.
Note: ACC = accountability.
ICT = information and communication technology.
CPF = citizen participation & freedom.
TRA = transparency.
GOI = government openness index.
Regression
To examine the relationships of GOI with income levels, a panel regression is conducted. Panel data are used as a combination of cross-section and time-series data from 101 countries for the period. Using the panel data is more advantageous than one kind of cross-section or time-series data because more observations are available by improving the efficiency and increasing the degree of freedom.
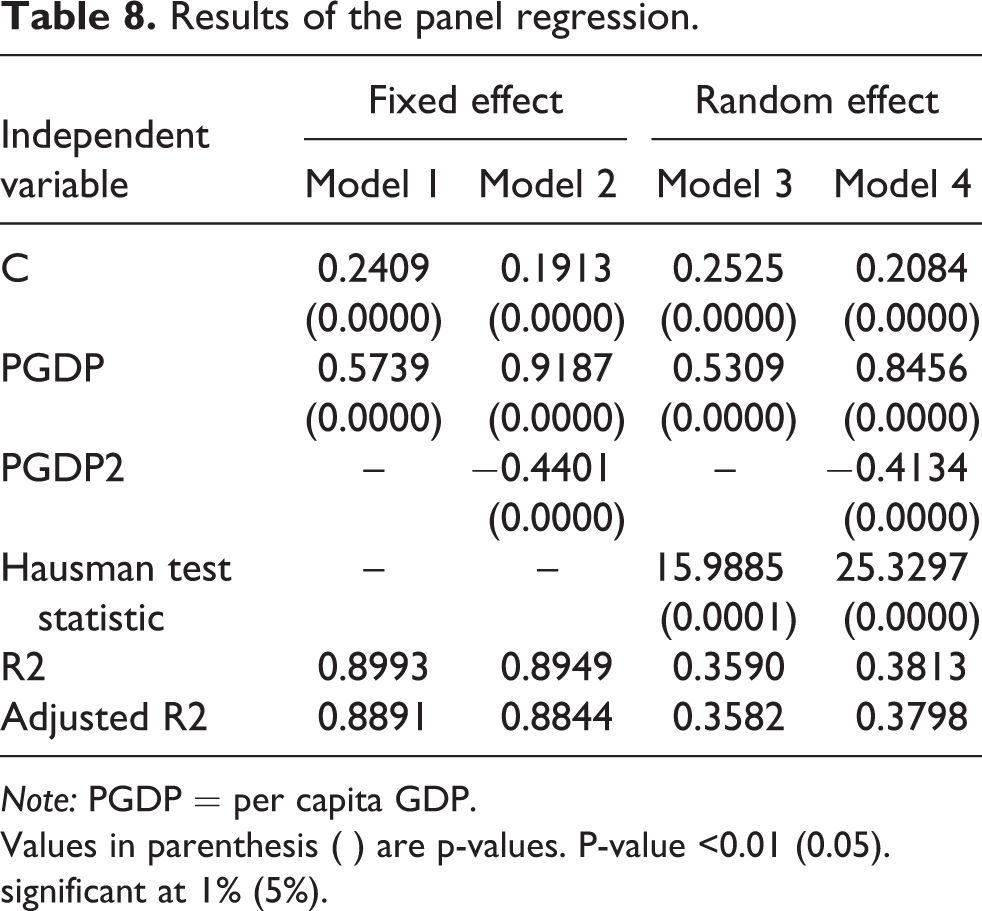
A simple panel model can be expressed as follows. GOIit = α + β1PGDPit + β2PGDP2
it + η it
Results of the panel regression.
Note: PGDP = per capita GDP.
Values in parenthesis ( ) are p-values. P-value <0.01 (0.05). significant at 1% (5%).
Each effect model has two kinds of models, depending on the inclusion of a variable PGDP2, totalling four models. The estimations of the results, driven from the two effect models, are consistent. The empirical results demonstrate that income (PDGP) has a positive and statistically significant coefficient, while income square term has statistically significant negative coefficients. Thus, the two coefficients of Models 2 and 4 mean that as income increases, GOI also increases. However, when income level reaches a certain level, GOI reverses and begins to decrease.
Discussion and implications
This study was conducted to develop a GOI in developing countries, identify GOI’s trends and examine the relationship of GOI and the four variables that are produced in the GOI. In addition, this study examined the relationship of the GOI and income levels in developing countries. The GOI was developed with four variables for each country: ACC, ICT, CPF and TRA, as GOI values are displayed in Table 2. The results show that, as observed in Tables 3 through 7, among the four variables, ICT has experienced the most noticeable increase in global means, the fastest convergence in coefficient of variation, and the highest performance in the contribution rate. The contribution level of ICT is also dominant on the change rate of GOI. ICT is unquestionably a primary driving force to move upward GOI to developing countries, which is consistent with the findings of existing e-government studies (International Telecommunication Union, 2009; Irani, et al., 2008; Beynon-Davies and Martin, 2004). This was also supported in the study by Maumbe et al. (2008), which explained that the limited availability of ICT infrastructure could hamper the access of citizens to information. Regarding OGP membership participation, it is of interest to note that OGP member countries perform better than non-OGP countries in all of the income groups. As developing OGP member countries have shown interest and commitment to the improvement of open government, their efforts seem to have proven to be effective.
Taking a look at the other variables, ACC has been steady and was the lowest in the four analyses in Tables 3, 4 (in absolute value), 6 and 7 during the period, which means that ACC has not changed in developing countries. CPF performs the second worst compared to ACC with regards to global means, contribution rate and contribution level in Tables 3, 6 and 7. In particular, the contribution rate of CPF moves opposite to that of ICT, as observed in Table 6 and Figure 3 in the same period, although the CPF’s values are small. This point, with regards to the role of CPF in improving GOI, is noteworthy.
The highest correlation value of ICT with income implies that ICT has the most significantly positive impact on economic growth. The higher the income a country has, the higher its ICT. On the other hand, CPF is negatively correlated with ACC and TRA in lower middle countries, as demonstrated in Table 5. In low-income countries, the value of CPF is negative with income. This is consistent with Barro’s study (2003), which demonstrated that democracy influences economic growth negatively in the initial stage. If mapped with the five levels of the open government maturity model (Lee and Kwak, 2012), low-income countries seem to be at the initial level. The lowest correlation of CPF with income indicates that CPF has the least impact on the income level of all countries. Based on the overall results of CPF, developing countries do not seem to have made enough effort to promote citizen participation and freedom during the period.
Regarding the relationship of GOI and the income levels of developing countries, the regression analysis shows that income (PDGP) is positive and statistically significant. Income square term has a negative and statistically significant coefficient. In other words, income and GOI move proportionally to a point where GOI then decreases. These values are observed in the correlations of GOI and income in upper middle countries (0.303), lower middle countries (0.514) and low income countries (0.121) in Table 5. Similar to ICT, countries from a higher income group tend to move toward open government more than lower income countries, as income considerably helps with the installation of ICT infrastructure facilities in the early stage. However, after a certain point, countries decrease their level of GOI.
The overall results of the study bring up an important issue related to the impact of ICT on GOI and the balance of ICT and CPF in developing countries. An ICT boosting strategy has been positive, which enables the provision of fundamental infrastructure facilities through which citizens are able to connect to the Internet and access government data, utilizing ICT as a tool to promote citizen participation. That is why most countries have made a direct effort toward implementing more ICT infrastructure facilities in the past decade. However, developing countries do not seem to be able to reach the point of maximizing ICT as a useful tool and further promoting CPF via ICT, because developing countries have not advanced their capacity to effectively use ICT. At least, they have not yet learned how to sustain ICT and promote CPF. The reasons for this may involve complicated causes including educational, economical, legal and social factors, as e-government projects in African countries should be considered with policy, infrastructure, law, human capacity and economy (United Nations E-Government Survey, 2014). Thus, in order to move toward the promotion of open government, as observed in Figure 2, it is recommended that developing countries join the OGP and present their commitments and specific action plans to improve open government. They should further focus on improving their capacities to thoroughly use ICT and, in particular, enhancing human capacities for directing ICT toward improving citizen participation and further transparency and accountability. The OGP’s technology and innovation dimension emphasizes, “the importance of increasing the capacity of citizens to use technology” (Open Government Partnership, 2016: 3). Developing countries should make significant effort to educate their human resources by assigning this task to a relevant ministry or agency with short- and long-term plans and provide training programs for citizens and ICT professionals.
Conclusion
To fill the gap of existing indices and tools related to open government, this study attempts to develop a comprehensive GOI and examine the relationships between GOI, four variables and income levels. An analysis of the data produces useful insights into developing a GOI in several ways. It helps to recognize and assess the current level of government openness in an individual developing country in quantifiable and exploratory measurements. It also helps move to its higher levels in a systematic way. The results of this study can contribute to developing, evaluating and implementing policies and strategies for improving open government and open data in an unbiased manner. With regards to methodology, to make a new GOI, the four variables are made from 13 different components drawn from the data sources of six institutions. To make the components in even weights and ranges, the LSM for a data standardization purpose is used, as in authoritative international organizations. The strengths of the GOI include providing a more comprehensive index to countries and contributing toward an adequate landscape of open government movements in developing countries. The four variables are interrelated and complementary to each other. In other words, improving transparency can help encourage citizen engagement, which is possible through equipped ICT tools and facilities and open data accessibility. This leads to being closer to building accountable government through increased GOI, which contributes toward making transparent and accountable information management within governments.
This study has some limitations. As a variety of data sources are used, it is assumed that the data has credibility and reliability because of the credibility and reliability of the institutions that developed this data. The selected period and sample countries used in this study were chosen based on the availability of the data sources when conducting this study. Thus, a different selection of data sources and different components may result in uncertainties in the results.
For future studies examining global government openness, a larger sample of countries will be used to develop a comprehensive government openness index. In addition, a panel regression of GOI will be conducted with sub-divided income level groups to investigate how different countries with different levels of income can act and react to a GOI. A correlation analysis will be conducted with sub-divided CPF variables when performing the GOI to examine factors that determine citizen participation and freedom.
Footnotes
Acknowledgement
Wankeun Oh gratefully acknowledges the financial support from the Hankuk University of Foreign Studies Research Fund 2017.