
Abstract
Structural equation modeling (SEM), with the technique of partial least squares (PLS), can be used for exploratory and predictive evaluations of the causal relationships and impact among variables postulated in theoretical models. This work presents PLS-SEM’s basic notions as a useful methodology to validate the abundance of models in the library and information science field; it offers an example of its application to test a model for measuring the impact of information resources and services on Mexican universities’ academic competitiveness; and it proposes its application to test the Information Needs Model.
Keywords
Introduction
Structural equation modeling (SEM) with the technique of partial least squares (PLS) is a multivariate statistical technique that has been recently popularized. This descriptive, causal and correlational measurement method was first used around 1980, particularly in business and marketing research, to test theories and concepts, but in recent years it has been adopted by other fields such as social sciences (Hair et al., 2011). The number of published investigations using PLS-SEM has been exponentially increasing, mainly in the fields of administration and marketing information systems, but it is still a scarcely used method in the library and information science (LIS) field.
Traditionally, statistics recognized experimentation as the only justification or validation that something was affecting a phenomenon in a causal manner. This principle presented a disadvantage for social sciences, because we needed to promote experimental research designs, which is not always possible. However, PLS-SEM offers several advantages for its usage in the social sciences, including: a) it can clearly detect which element can cause which kind of effect within the variables under study; b) it tolerates small samples, usually lower than 40 subjects; c) it does not require the validation of the strongest statistical assumptions, such as normality, homoscedasticity and non-linearity; and d) statistically, it allows to measure impact and causal effects, as well as confirming or rejecting theories (Hair et al., 2011, 2016; Wong, 2013; Lowry and Gaskin, 2014).
Before using PLS-SEM, it is necessary to formulate a theoretical-conceptual model (TCM) from the specialized literature or use an existing one, as there must be a theoretical foundation behind the model so it can be tested. Such a model has to indicate the existing relationship among its concepts, dimensions, constructs and variables. After having the TCM, it is necessary to gather the empirical data that can be contrasted against the postulated relationships. Around 20 years ago, the application of methods such as PLS-SEM was very difficult, because the specialized software needed did not exist, so it required the manual application of complicated regression equations and linear regression models. Current statistical software allows copying the models and gathered data to solve equations by obtaining a stochastic model and then confirm or reject the TCM.
Stochastic models are based on a multivariate technique that estimates the causal relationships from statistical data against qualitative causal assumptions. SEM analyzes have two main alternatives: exploratory and predictive (PLS-SEM) and confirmatory (CB-SEM), based on covariance. The first allows exploring theories and models with small samples; but if the objective is to confirm and if the gathered data is normal, variances are homogeneous and there is a large sample, then CB-SEM is the ideal alternative to use (Hair et al., 2011, 2016; Lowry and Gaskin, 2014). However, Hair et al. (2011) suggest that, if the models, measurements and data have an appropriate quality, both alternatives should offer the same results. It is important to highlight that for using CB-SEM, it is necessary to apply PLS-SEM first, as a pilot and exploratory stage is widely recommended before conducting a confirmatory stage. Regarding the available software to conduct SEM analyzes, two examples are AMOS (used for CB-SEM) and Smart-PLS (for PLS-SEM).
PLS-SEM in library and information science
There are few but diverse LIS studies that have used PLS-SEM. Dachyar and Dewi (2015) studied several variables evaluated by Quacquarelli Symonds university rankings and their relationship with the University of Indonesia competitiveness; they found that both academic reputation and citations per paper have a significant correlation with competitiveness. Rifai and Hasan (2016) used PLS-SEM to study user expectancy and the use of institutional repositories from 50 universities in Indonesia, finding that expectancy contributes to use in 57.6%. Haque et al. (2017) used the theory of planned behavior to analyze professors’ knowledge management and sharing intention (KMSI) in Bangladesh, finding that most of their constructs have a significant influence over KMSI. Zheng and Liang (2017) adopted the Information System Success Model to investigate the adoption of information and communication technologies (ICTs) in Chinese education and particularly its effects on educational equality. According to such model, ICTs’ quality includes information, system and service; while users’ perception is divided in user satisfaction and usage intention. Findings included that these ICT factors directly affect users’ perception and can influence educational equality. Aboelmaged (2018) sought to predict the impact of staff motivations on using enterprise social networks from United Arab Emirates’ users and found a positive significant impact between such use and employee’s productivity, but the use of the network was significantly motivated by hedonic and not utilitarian motivations; which are part of technology adoption models. Qazi, Raza and Shah (2018) used PLS-SEM and the modified diffusion innovation theory to explore Pakistan students’ intention to adopt e-books, finding that behavioral intention has a significant positive effect on e-books usage.
In Latin America, most studies conducted more than 10 years ago were almost exclusively dedicated to conduct descriptive analyzes over the usage of information resources and services (IRS) and tried to establish correlations with some performance parameters, such as user satisfaction and learning. Most of the LIS TCMs are kept to a theoretical level and seldom specify the relationship between their propositions, and are grouped or quantitatively tested (Wilson, 1999; Shenton and Hay-Gibson, 2012; Savolainen, 2016). However, if the majority of studies remain at such level, there are still doubts about, for instance, if IRS really affect aspects such as university competitiveness. To study topics such as IRS’ impact over institutional performance is complex, because of the data collection involved and the application of adequate methods (Lau, 2001; Tarango y Hernández, 2009). Hence, it is necessary to have reliable and valid methods, techniques and tools, which allow measuring such phenomena from a cause-effect perspective and transcending the frequently employed, but limited, diagnostic-descriptive vision.
Measuring the impact of information resources and services on Mexican universities’ academic competitiveness
Given the area of opportunity highlighted above, Romo-González et al. (2018) developed a quantitative and non-experimental research that consisted of an exploratory and predictive evaluation of the impact of information resources and services on Mexican universities’ academic competitiveness, both public and private, using PLS-SEM. This study used IRS data from the libraries of 33 universities (CONPAB-IES, 2015) and data about their academic competitiveness (UNAM-DGEI, 2016).
As a construct, competitiveness was divided in the following dimensions: a) productivity, subdivided in the indicators, number of students, articles published and journals edited; b) quality: academic groups registered in PRODEP 1 , members in the National Researchers System (NRS), and accredited academic programs; and c) innovation: patents requested and approved. The construct IRS was divided in a) print resources: number of volumes and number of journal subscriptions; b) digital resources: number of databases; c) services: number of users (professors and students); and d) infrastructure: number of square meters. The data gathered was analyzed using SmartPLS 2.0 2 , to explore and predict the causal relationships posed in a TCM that was a simplification of Murguía et al. (2013), as shown in Figure 1.
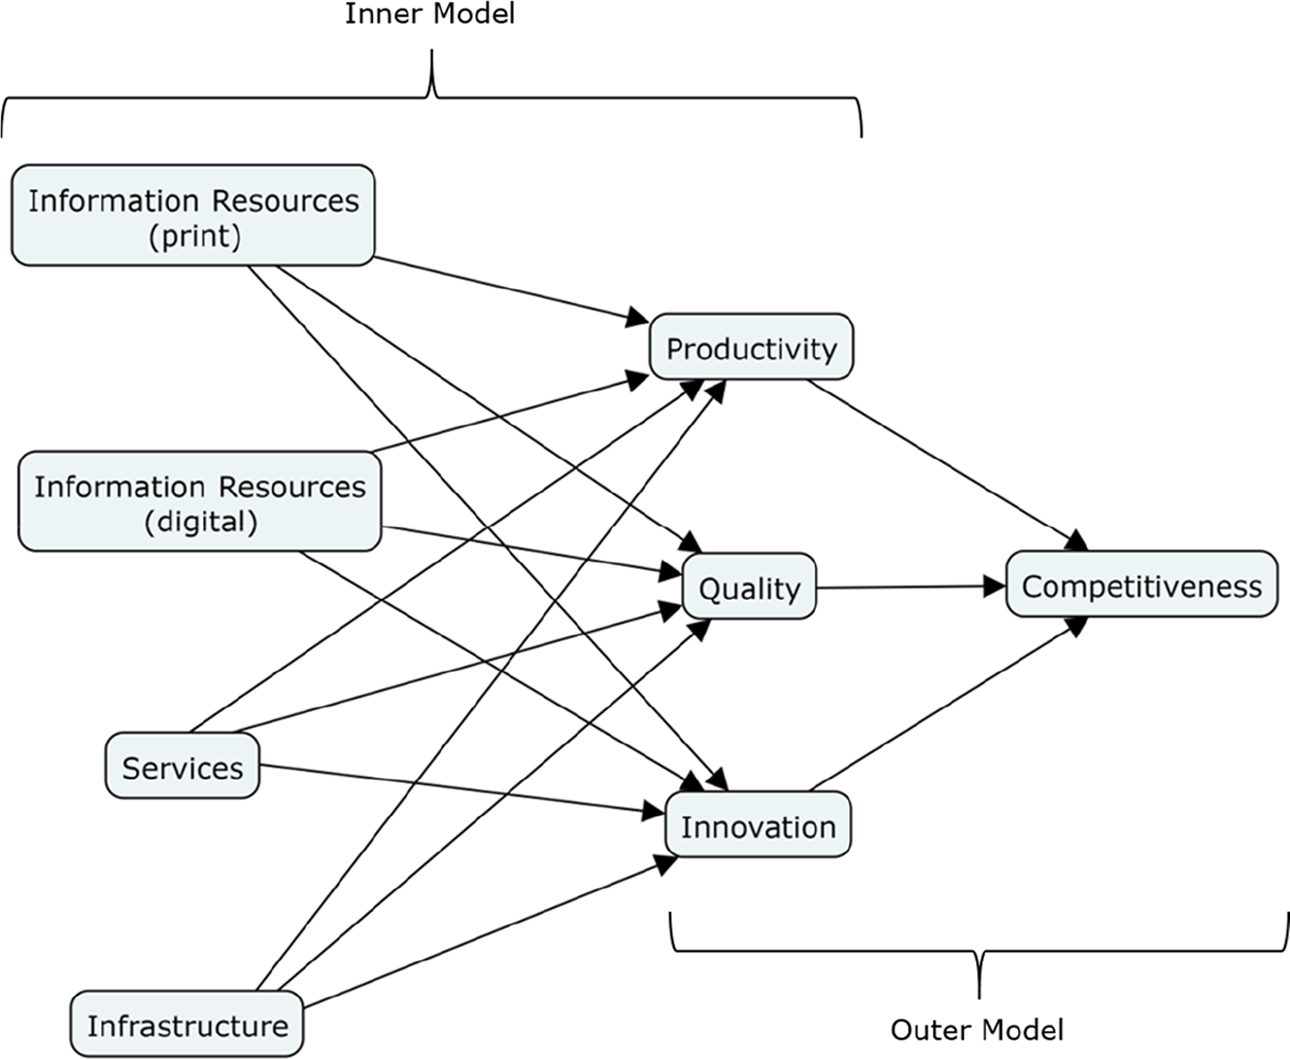
Research model and hypotheses for measuring the impact of information resources and services on Mexican universities’ academic competitiveness.
Among the results, we found that academic competitiveness (endogenous variable) was affected by the three latent exogenous variables (productivity, quality and innovation), with a coefficient of determination (R2) of 0.973, meaning that the latent exogenous variables explain 97.3% of the competitiveness’ variance. Moreover, IRS had a high impact toward productivity and quality, but their effect over innovation was almost null. Regarding the inner model’s path coefficient sizes and significance, the three competitiveness predictors were statistically significant (with standardized path coefficients higher than 0.10, minimum required for significance). Quality was the strongest predictor (0.636), then productivity (0.312) and innovation (0.261). Print resources had significant and moderate effects over quality (0.688) and productivity (0.560); digital resources had moderated effects over productivity (0.313) and poor on quality (0.157); library infrastructure had a limited effect over quality (0.218) and productivity (0.202); library services did not show any significant effect over quality (0.048) nor productivity (0.009); and no IRS had significant effects over innovation (<0.061). Regarding the outer model’s weight and significance, the indicators that explained academic competitiveness, ordered by their correlation, were: number of NRS members (0.8792), patents approved (0.8444), journals edited (0.6842), articles published (0.3845), academic groups registered in PRODEP (0.1921), patents requested (0.1691), accredited academic programs (0.0516) and number of students (0.0059). The PLS-SEM algorithm accomplished the convergence criterion after 13 iterations, rather than the 300 maximum number of iterations tolerated (Wong, 2013); hence, the estimation of the model is good.
Information Needs Model
Drawing from an exhaustive theoretical research and with the purpose of building a theory on information needs, Calva (2004) proposed the Information Needs Model (INM). Such emerging TCM supports collection development, systems design, abstract and indexing production and a more effective development of IRS. INM articulates the following constructs: a) phases that intervene on the information needs phenomenon, including the emergence of needs, information behavior and satisfaction of needs; b) factors that intervene in the phenomenon, including external and internal factors; c) types of information needs; d) information behavior types and patterns; e) satisfaction assessment; f) various elements that include time, pertinence, relevance, precision, information use and compilation; and g) methods, techniques and instruments to evaluate the phenomenon. This is a brief summary of INM, as each construct includes other dimensions and variables that are susceptible to quantitative measurement. Given the characteristics of this useful TCM, which includes information behavior as one of its various dimensions, we consider that it should be further examined by implementing it in practice and analyzing the data from its application, firstly through PLS-SEM and then with CB-SEM; as an opportunity for strengthening it and consider its national and even regional adoption. Figure 2 exemplifies INM articulation for SEM analysis, either by PLS-SEM or CB-SEM.
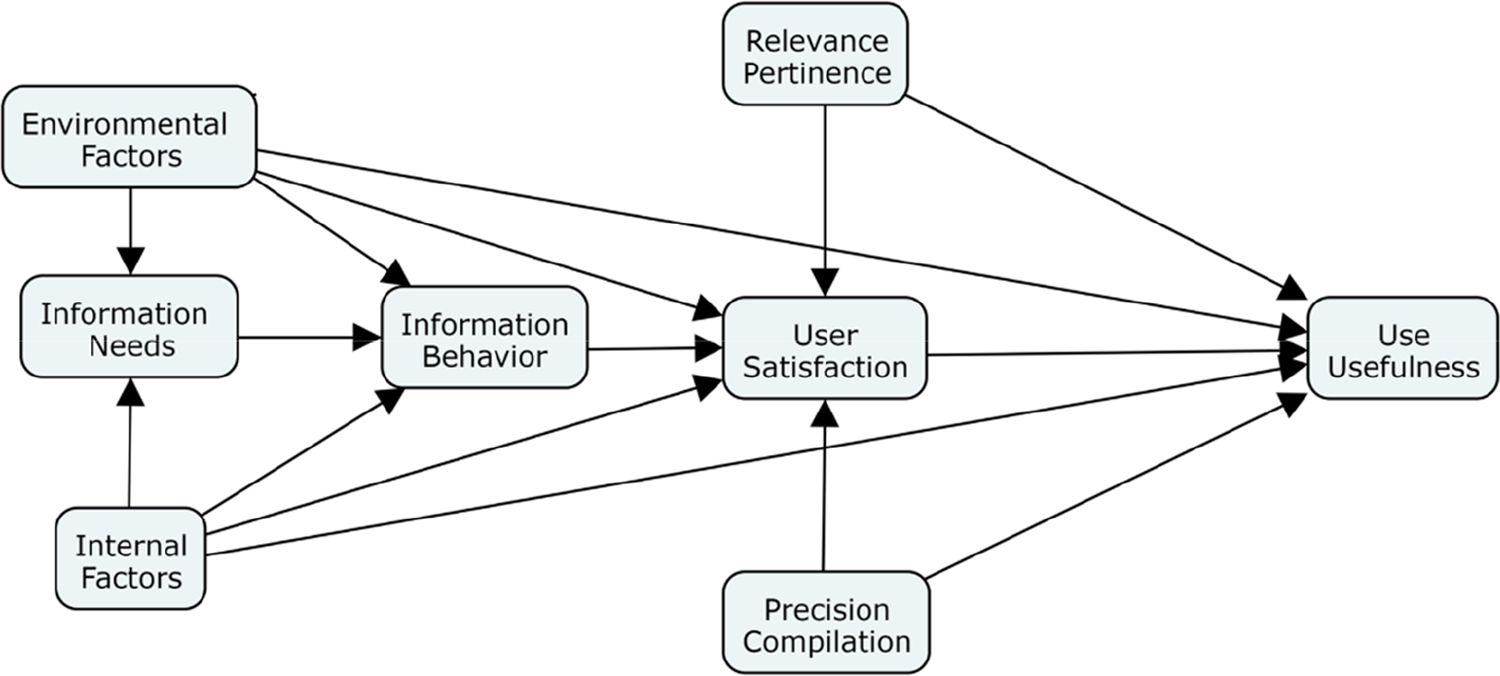
Information Needs Model articulation for SEM analysis.
Conclusion
PLS-SEM and CB-SEM emerge as useful quantitative analysis methods that allow testing LIS TCMs and answering to the issues derived from their abundance, apart from allowing such TCMs to transcend their theoretical, diagnostic or descriptive stages. Such kind of model validation is important for academic libraries, as both SEM variants allow confirming and improving the role of libraries in issues such as: a) teaching, research and cultural tasks; b) fulfilling their mission and vision; and c) optimize the use of the information resources acquired and of the services provided; d) evaluate more precisely IRS’ impact on the performance of professors, researchers and students. SEM variants also offer a good opportunity to test and confirm the variety of TCMs and expand upon the abundant LIS research that remains at a theoretical-diagnostic-descriptive stage, particularly in Latin America, and hence, strengthening research on this discipline. This is why we proposed the exploratory PLS-SEM validation of the INM as an opportunity for further research, which would be valuable for strengthening it and consider its national and even regional adoption, given its promising characteristics.
Most of the cited LIS research that used PLS-SEM presents different studies that cannot be conducted with experimental designs. For instance, to experimentally conduct the study of measuring IRS impact on universities’ academic competitiveness would mean altering their availability in the institutions during the study, which would negatively affect users and institutions. We conducted the study of IRS impact on academic competitiveness with data from the Mexican universities that consistently register and share such data, which is vital for conducting similar studies. Hence, we see the need to conduct further research by gathering data from libraries and universities at a regional level, to explore the resulting tendencies that could emerge from a more diverse dataset and confirm the usefulness of the model for a wider geographical scenario. However, this line of research implies the difficulty of gathering a large amount of data, which is also dispersed and is not likely to be uniform between different countries. For instance, in Mexico there are established indicators such as PRODEP academic groups and NRS members, such data would be comparable only among countries that consider similar elements. Dachyar and Dewi (2015) also present us with an opportunity for enhancing the model to include other bibliometric indicators that are important for competitiveness, such as citations per paper.