
Abstract
Customer satisfaction with personal information security management directly measures the effectiveness of insurance companies in ensuring customer confidentiality. However, previous studies focused either on the level of awareness among customers or the corporate measures taken whereas this study integrates both dimensions for a holistic analysis. This paper examines how demographic factors, corporate practices, and satisfaction interlink to determine which factors have the most influence on customers’ level of satisfaction regarding managing information security within the insurance sector. This research had a quantitative research design aiming to assess the customers’ satisfaction with the personal information security practices of China's insurance sector. There were 77 participants, of which 61 were taken from 13 insurance companies, and they held two policies each, amounting to 138 insurance policies in total. Purposive sampling was adopted in order to ensure that a good range of demographics is covered. Structured questionnaires were used to collect data in April 2024, with tech-friendly participants reached via social media and elderly participants interviewed by phone. The results show that the effect of insurance type on satisfaction is not significant when stratified by educational degree. However, age and insurance type have a significant joint effect on satisfaction. Furthermore, satisfaction depends on insurance pricing and channels of potential information leakage. Regression analysis reveals that monetary capital, claims reserves, and highly educated personnel are significant corporate factors that affect satisfaction. This research introduces a novel perspective by integrating the dimensions of customer satisfaction and information security management comprehensively. The paper proposes new insight into potential risks concerning leakage across various channels of information, which is related to how this affects customer trust.
Keywords
Introduction
The insurance industry has been revolutionized by the rapid growth of digital technology, which has significantly improved accessibility, efficiency, and customer relations (Braun and Jia, 2025). Despite the benefits of digital transformation, it has also brought about new risks and vulnerabilities, particularly in terms of safeguarding personal information (Li et al., 2021). Insurance firms are responsible for processing significant volumes of sensitive data, including financial details, medical records, and behavioral insights. Any breach in information security can severely damage customer trust, violate regulatory compliance, and lead to financial penalties (Zheng and Guo, 2020). Given these risks, ensuring robust data security practices while maintaining high customer satisfaction has become an urgent challenge for insurance companies in China.
Although China has implemented strict data protection laws like the Personal Information Protection Law (PIPL), the Data Security Law, and the Cybersecurity Law (Huang et al., 2022), concerns about data leakage and misuse persist. Reports show that many customers in China continue to receive unsolicited marketing calls, spam, and phishing attempts after engaging with insurance products, leading them to suspect that their personal data has been sold or leaked without their consent (Calzada, 2022). This issue has become particularly problematic in the age of digital insurance, where information is often stored and transmitted through multiple online channels, increasing the risk of unauthorized access and data breaches (Alharbi et al., 2024). Existing studies have primarily focused on either corporate data security measures (Da Veiga et al., 2020) or customer awareness and perceptions of data privacy (Li et al., 2021; Ofori et al., 2022). Despite existing studies, there is a lack of in-depth research that considers how corporate security practices and customer demographic factors work together to impact satisfaction with information security management in the insurance sector. Moreover, while financial services and banking sectors have received considerable attention in information security research (Tiwari et al., 2021), the insurance sector remains understudied, despite handling some of the most sensitive and confidential customer data (Loan, 2023). Furthermore, many previous studies have not conducted a systematic analysis of how specific demographic factors, such as age and education level, influence customer satisfaction with information security (Jin et al., 2024). Given that customers with different education levels may have varying degrees of awareness, expectations, and trust in an insurer's security measures, understanding this variation is crucial for designing effective customer-centric security policies (Wilson et al., 2021). Similarly, age-related differences in digital literacy and security concerns may influence customer satisfaction differently, yet this remains poorly explored in insurance security research (Esmaeili et al., 2021).
The goal of this study is to bridge this gap through a comprehensive examination of how corporate security measures, demographic variables, and perceived risks impact customer satisfaction regarding information security management in the insurance sector of China. This study's findings provide critical implications for advancing academic research as well as enhancing industry practices. Through an assessment of China's data protection laws, this research sheds light on whether the current regulations effectively secure customer information or if there is a need for further regulatory enhancements (Huang et al., 2022). The study also offers actionable recommendations for insurance companies to optimize their security investments, enhance compliance efforts, and build customer trust through improved data protection policies (Alharbi et al., 2024). By exploring how factors such as age, education level, and insurance type shape customer satisfaction, insurers can craft targeted approaches to meet distinct customer expectations, fostering greater trust and transparency (Li and Shang, 2020). Furthermore, by identifying the most vulnerable information leakage channels—whether through mobile apps, sales agents, email, or third-party platforms—this study provides a data-driven approach to mitigating security risks (Kolotylo-Kulkarni et al., 2021). To achieve these goals, this study addresses several key research questions. First, it examines how customer satisfaction varies between different types of insurance and education levels. Second, it investigates the impact of age and insurance type on customer satisfaction with information security management. Third, it explores how various corporate security practices and perceived information leakage risks affect customer satisfaction. By examining these factors in a structured manner, this research contributes to the broader dialogue on digital trust, cybersecurity, and how customers perceive data protection in the insurance industry.
This study offers a fresh perspective by combining corporate and customer-centric viewpoints to gain a comprehensive understanding of how personal information security affects customer satisfaction in China's insurance industry. Unlike prior studies, which primarily examined corporate security strategies (Ofori et al., 2022) or customer perceptions (Tiwari et al., 2021), this research delves into the relationship between demographic variables, corporate security measures, and the risks of information leakage. Furthermore, while most studies on information security have focused on banking, e-commerce, or general digital platforms, this study extends the analysis to the insurance sector, which faces unique data protection challenges due to its highly sensitive customer information (Esmaeili et al., 2021). By quantifying satisfaction levels and identifying key determinants of trust, this research provides practical recommendations that can inform both policy development and industry best practices.
The rest of this paper is organized as follows: Literature review provides a review of the existing literature on customer satisfaction and information security management in the insurance industry. Theoretical framework and hypothesis development provides an overview of the theoretical framework and the hypotheses that guide the study. Methodology provides a comprehensive overview of the research methodology, which includes data collection, sample demographics, and the methods of analysis employed. In Results, the results are outlined, Discussion delves into the theoretical and practical implications, along with the study's limitations and future research recommendations, and Conclusion provides the study's conclusion.
Literature review
This section critically examines existing literature on customer satisfaction, information security management, and their interrelation within the insurance sector. The review follows an audit structure by categorizing previous studies under themes related to the study's research objectives and questions. Additionally, this section integrates relevant theories to provide a structured understanding of the variables under study.
Customer satisfaction and information security management
Customer satisfaction is a key determinant of customer retention and long-term business sustainability, particularly in service-oriented industries like insurance (Ahmed et al., 2020). Numerous studies have established a direct relationship between customer satisfaction and trust in the organization's information security management systems (Li et al., 2021). Loan (2023) emphasizes that by protecting customer data; service providers can enhance customer trust and cultivate long-term loyalty.
Information security breaches can significantly impact customer perception, leading to dissatisfaction and distrust toward service providers (Loan, 2023). In the insurance sector, customers share sensitive personal and financial data with service providers, making data security a critical concern. Studies such as those by Al-Shanfari et al. (2020) have indicated that companies with robust security measures experience higher customer satisfaction levels, primarily because security assurances reduce perceived risks. A study by Kuswanto (2024) in Indonesia's life insurance sector found that psychological factors, including trust and emotional connection, significantly contribute to customer loyalty. Similarly, Alharbi et al. (2024) found that electronic management systems enhance customer experience by streamlining operations, reducing waiting times, and increasing transparency. The findings highlight that robust information security management enhances customer satisfaction and contributes to long-term customer retention. AlHares et al. (2024) showed that organizations with cybersecurity awareness programs for customers experienced higher satisfaction ratings, underlining the importance of customer education on security measures.
Factors influencing customer awareness of information security
According to Tiwari et al. (2021), customer awareness of information security is crucial in influencing their satisfaction levels. Research suggests that individuals with higher awareness levels are more critical of data protection measures taken by service providers (Ofori et al., 2022). Various demographic factors, including age, education, and technological exposure, influence customer awareness of security practices in financial services (Zeng, 2024). Li et al. (2021) found that cloud services and e-learning are effective in enhancing customers’ comprehension of security risks, ultimately strengthening their trust in banking institutions. Similarly, Da Veiga et al. (2020) highlighted the importance of organizational policies in raising information security awareness among employees, which ultimately benefits customers. A comparative analysis by Familoni and Shoetan, (2024) found that insurance firms implementing proactive customer awareness campaigns on cybersecurity threats experienced higher customer retention and satisfaction rates compared to those with minimal educational initiatives.
The role of organizational factors in information security management
Organizational policies and practices significantly influence customers’ perceptions of data security (Ahmed et al., 2020). Key factors influencing information security management include policy enforcement, technological infrastructure, and employee training (Delso-Vicente et al., 2025). According to a study by Al-Shanfari et al. (2020), organizational policies and technological infrastructure play a crucial role in promoting secure environments. Organizations that invest in advanced security frameworks, such as blockchain-based security systems and biometric authentication, report increased customer satisfaction levels (Sharma and Dwivedi, 2024). Ahmed et al. (2020) investigated the economic dimensions of business operations in the airline industry and concluded that timely complaint resolution, fast response times, and a reputable brand image played crucial roles in enhancing customer satisfaction and loyalty. Although their study focused on the airline industry, similar factors can be applied to the insurance sector, particularly regarding customer service responsiveness and data security management. Recent studies, such as those by Mohapatra and Reddy, (2024), indicate that insurance firms adopting artificial intelligence-driven security protocols experience fewer customer complaints related to data breaches. This suggests that organizations integrating cutting-edge technology into their security frameworks can significantly improve customer trust and satisfaction.
Research gap and theoretical integration
Despite extensive research on customer satisfaction and information security, there is limited literature on how demographic and organizational factors influence customer satisfaction specifically in the insurance sector (Loan, 2023). Previous studies have primarily focused on customers’ awareness of information security (Tiwari et al., 2021) and technological solutions implemented by organizations (Li et al., 2021).
Given the deductive approach of this study, the theoretical framework incorporates multiple perspectives. The Knowledge-Attitude-Behavior (KAB) Model (Jin et al., 2024) explains how customer awareness influences their perception of information security and, consequently, their satisfaction levels. Higher awareness leads to a demand for better security practices, which influences customer loyalty. According to the Technology Acceptance Model (TAM) (Wilson et al., 2021), customers tend to be more satisfied with insurance platforms that are intuitive, ensure seamless digital interactions, and maintain high security levels. Companies with advanced security technology and accessible digital interfaces report better customer satisfaction levels. Channel Risk Theory (Abdelkader et al., 2024) is also relevant, as it highlights customer concerns about information security across different service delivery channels, such as online platforms, phone consultations, and face-to-face interactions. The perceived risk of information leakage significantly affects customer trust and, consequently, satisfaction. This study integrates these theories to examine the relationship between knowledge, technology, and perceived risk in shaping customer satisfaction within the insurance industry. The research will provide empirical insights into how different theoretical constructs contribute to customer perceptions of security, guiding insurance firms in refining their information security strategies.
This study explores the factors that influence customer satisfaction with information security management in China's insurance sector, focusing on the interplay between demographic characteristics, corporate security practices, and perceived risks of information leakage. With the growing digitalization of the insurance industry, customers’ personal and financial data are increasingly vulnerable to breaches, making data protection a critical concern. The research examines how factors such as age, education, and insurance type shape customers’ perceptions of security measures, while also evaluating the role of corporate practices like technological infrastructure and employee training in fostering trust. This study identifies key channels of information leakage and explores the influence of perceived risks on customer satisfaction, providing valuable insights for insurance companies to improve their security practices and build customer confidence in the face of digital transformation.
Theoretical framework and hypothesis development
The proposed research framework combines the Knowledge-Attitude-Behavior Model, the Technology Acceptance Model, and Channel Risk Theory in understanding the influences on satisfaction and risk perception by factors within the insurance sector. For this purpose, each of these theoretical approaches is applied along with hypothesizing systematic dynamics to study these phenomena.
Knowledge-Attitude-Behavior (KAB) model
The KAB Model refers to a relationship sequence in which knowledge impacts attitudes, and attitudes determine behavior (Jin et al., 2024). This is very relevant in the insurance industry because customer satisfaction and decision-making are highly determined by their awareness of insurance products and services. For instance, customers who are more educated will know much more about insurance, allowing them to understand complex products such as investment-linked plans, while less educated clients will be attracted to less complex and easier-to-understand plans (Zeng, 2024). Other age groups also reflect varying knowledge and preferences, in which younger people focus on cost efficiency and new-age solutions, while the elderly will focus on security and familiarity. Hence, satisfaction does not vary uniformly but mediates through demographic variables. Based on this model, it is hypothesized that different types of insurance affect the satisfaction levels of various educational degrees (Hypothesis 1) and that different types of insurance have an impact on the satisfaction of different age groups (Hypothesis 2). These hypotheses seek to examine how demographic differences influence knowledge, attitudes, and ultimately satisfaction and thus guide insurers to tailor their offerings more effectively.
Technology acceptance model (TAM)
According to the Technology Acceptance Model, perceived usefulness and ease of use are key factors that significantly influence whether individuals will adopt technology or be satisfied with its usage (Wilson et al., 2021). In the insurance domain, this model applies strongly because customers are ever-increasingly using digital platforms for the management of policy, claims processing, and customer care. The heterogeneity in the adoption of technology by insurance companies influences customer satisfaction, with technologically advanced insurers delivering smooth, efficient, and transparent services (Hassan et al., 2023). For example, the use of user-friendly mobile applications and automated support systems by an insurer will improve customer experiences, but an insurer that uses outdated systems may experience a decline in customer satisfaction. According to this theory, the company's technological infrastructure directly influences customers’ perceptions of service quality (Li and Shang, 2020). Accordingly, it is hypothesized that different insurance companies will affect customer satisfaction (Hypothesis 3). This hypothesis seeks to examine how the disparity in technological advancements and usability between insurers influences customer experiences and loyalty, encouraging the industry to adopt innovative solutions for competitive advantage.
Channel risk theory
Channel Risk Theory is concerned with inherent vulnerabilities in different channels for communication and transactions. Such theory emphasizes information security in customer satisfaction (Abdelkader et al., 2024). Different channels used by the customer in the insurance industry consist of online platforms, office-based transactions, and calls, all of which hold different risks of leakage and misuse of information. For example, although online media are convenient, they are probably viewed as more vulnerable to cyberattacks, which can make customers lose trust (Ahmed et al., 2024a, 2024b). On the other hand, traditional face-to-face communication may be seen as relatively safer but less efficient. The perceived risk of each channel greatly influences customer confidence and overall satisfaction (Esmaeili et al., 2021). According to this theory, it is hypothesized that there are differences in the channel-specific leakage possibility (Hypothesis 4). Therefore, the present hypothesis will discuss channel-specific risks and their effects on customer trust and satisfaction. Based on this, insurers would be encouraged to use robust security and communication measures to handle these issues satisfactorily.
As shown in Figure 1, the theoretical model highlights the factors that affect customer satisfaction with the management of personal information security in insurance companies. The figure demonstrates how customer satisfaction is affected by the types of insurance chosen by customers and how demographic factors, including education and age, contribute to differences in individual preferences and perceptions. Additionally, the framework examines the influence of different insurance companies, with a focus on how organizational factors such as service quality, trust, and reputation shape customer satisfaction. Additionally, the framework examines the important issue of information leakage, demonstrating the impact of security breaches through various channels on customer trust and satisfaction. The model combines demographic, organizational, and security-related factors, offering a comprehensive understanding of the elements influencing customer satisfaction and providing insights for enhancing insurance services and data security practices.
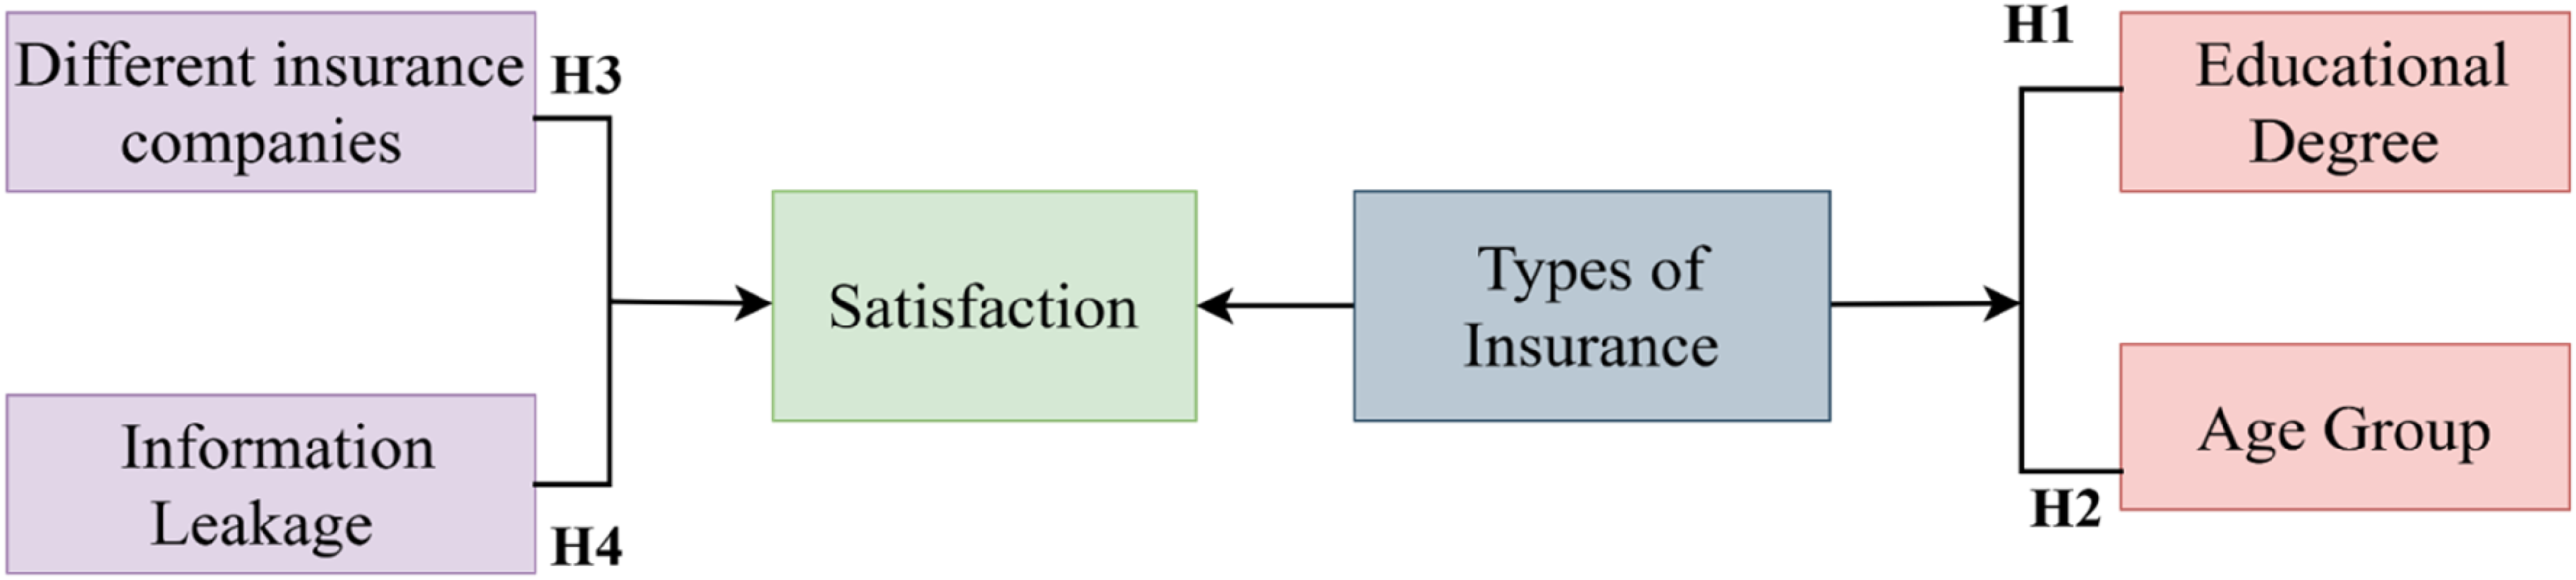
Theoretical model.
Methodology
This section provides an overview of the research methodology used in the study, covering the research design, measurement instruments, data collection methods, data analysis techniques, and ethical considerations. The methodology is designed to align with the study's objectives and ensure transparency in each stage of the research process.
Research design
A quantitative research design was utilized in the study, with an emphasis on measurable data to explore the relationship between customer satisfaction and the management of personal information security by insurance companies. This design was selected to find statistical evidence supporting the respective hypotheses concerning different factors related to types of insurance, groups by age, degrees of education, and the leakage channels of the information. The study used quantitative methods to deliver accurate and reliable findings to inform better security practices within the insurance sector. Using a quantitative research approach, this study investigates the connections between customer satisfaction, personal information security management, and organizational factors within the insurance sector. The study employed a cross-sectional survey method to collect data at a single point in time, capturing customer perceptions about personal information security management. This approach facilitates statistical analysis and hypothesis testing.
The research follows a deductive approach, where hypotheses were developed from established theories such as:
Knowledge-Attitude-Behavior (KAB) Model: To examine how customer knowledge and attitudes affect satisfaction and behaviors related to information security. Technology Acceptance Model (TAM): To evaluate how customer perceptions of technology affect their trust in insurance companies’ data protection measures. Channel Risk Theory: To assess perceived risks associated with data leakage across various communication channels in the insurance sector.
These theories were integrated into the study's framework to test the hypotheses concerning customer satisfaction and information security practices.
Measures
A structured questionnaire was developed to measure key variables related to customer satisfaction and perceptions of information security (Ahmed et al., 2024a, 2024b). The structure of the questionnaire includes two sections:
Demographics: Captures age, gender, education level, and insurance ownership details. Main Constructs: Measures customer satisfaction, trust in information security, perceived risk, and technological adoption.
The measurement items were derived from validated scales in prior research, with responses recorded on a five-point Likert scale (1 = Strongly Disagree to 5 = Strongly Agree). The key constructs include:
Customer Satisfaction: Adapted from Ahmed et al. (2020), assessing service quality, security, and transparency in information handling. Perceived Security and Trust: Derived from Li et al. (2021), focusing on customer confidence in the insurance company's data protection policies. Perceived Risk: Adapted from Abdelkader et al. (2024), assessing concerns about data leakage through various channels. Technology Adoption: As stated by Wilson et al. (2021), assessing the ease of use and perceived usefulness of digital platforms is important in the context of the insurance industry.
A pilot study involving 15 respondents was conducted to refine the questionnaire and ensure its content validity.
Data collection
The study targeted customers from 13 insurance companies in China. A purposive sampling technique was employed to ensure participation exclusively from individuals with insurance policies, as they are directly affected by and knowledgeable about the company's information security practices.
The data collection process included the following methods:
Online Surveys: Distributed via email and social media platforms to reach tech-savvy respondents. Telephone Interviews: Conducted with elderly respondents or those unfamiliar with digital tools to ensure diverse participation.
The data collection was carried out over four days in April 2024. Of the 110 surveys distributed, 89 responses were received, and after data cleaning, 77 valid responses remained for analysis.
The method used to gather primary data includes systematic gathering from a selected target population of customers. The population considered includes customers who are affiliated with 13 insurance companies in China. A purposive sampling technique ensured relevant participants for this type of research, whereby individuals possessing insurance policies qualified them as being direct stakeholders able to evaluate information security management quality in the companies to which they were affiliated. An online questionnaire method of data collection took four days in April 2024. The questionnaire is divided into two sections: the first part gathers demographic data, and the second part focuses on the objectives concerning customer views on information security (see Appendix Table A1). A pilot test was carried out to assess both the design and effectiveness of the questionnaire before proceeding with the main survey. To reach the targeted respondents, contact information was obtained from the 13 insurance companies. The questionnaires were distributed using a dual method: social media was used to reach the tech-friendly respondents, while telephone interviews were conducted with the elderly, who may not be comfortable with electronic devices. Initially, 110 questionnaires were given out, and 89 responses were received. After eliminating invalid responses, 77 valid samples remained for analysis. This process, therefore, is holistic and ensures the gathering of robust data while taking into account diverse demographic needs that further enhance the quality and relevance of findings.
Secondary data was integrated to provide a richer insight and cross-validate the findings. The supplementary views about customer behavior and preferences in the online insurance market were sourced from the China Online Insurance Customer Insight Report (Yuan Bao, 2021). Furthermore, company-specific metrics such as financial and human resource data were extracted from the China Insurance Yearbook (2021). These datasets gave a more general background in which the analysis of customer satisfaction levels and organizational factors influencing information security would be conducted.
Procedure
This survey began in April 2024. In order to fix the time variable, the researchers only surveyed respondents who had insurance purchase and consulting experience in 2020.
The process of investigation, as depicted in Figure 2, involved a sequence of structured procedures designed to accurately obtain and analyze the data. Initially, the questionnaire was prepared based on the theme of “personal information security management” around key issues such as education of customers, age, level of satisfaction with the information privacy protection in the Chinese insurance industry, companies’ efforts towards protection, kinds of insurance taken, consulted companies, and prices of the products and grades for potential channels of leakage of information. A 100-point scoring system was used to assess satisfaction and estimate the probability of leakage of information, consistent with how people in China score publicly, and thus allowing for more extreme data variation. Then, five scholars with experience in sampling surveys assessed the questionnaire to point out problems such as privacy, damaging content for the reputation of insurance companies or the industry, and the convenience of the survey process for the respondents. Any problematic elements were modified accordingly. The questionnaire was distributed mainly through online channels. For the elderly, who did not know how to use digital tools, telephone surveys were conducted. This helped in including diverse groups in the study based on age, education, income, and occupation. Finally, responses that were incomplete and data from participants who were inattentive were excluded, retaining only valid data for statistical analysis so that the reality was portrayed accurately.

Flow chart of the investigation.
Samples
This study targeted customers of 13 insurance companies in China. These people were chosen for the fact that they are direct stakeholders who experience and evaluate the quality of information security management implemented by the companies. In total, 77 customers participated, with 61 respondents having two insurance policies, which brings the total number of analyzed policies to 138. This population would help identify customer satisfaction levels and areas that need improvement. The data from this population is crucial in the analysis of patterns and actionable conclusions from customer perceptions and corporate security practices. To ensure the involvement of relevant participants, a purposive sampling technique was used, targeting individuals with insurance policies who are direct stakeholders and can assess the quality of information security management within their companies.
The questionnaire captured the demographic characteristics, including age, gender, educational qualifications, and the number and types of insurance policies held. By categorizing the respondents into different groups based on this information, a clearer understanding of the variations in satisfaction levels across the segments was achieved. Segmentation thus assisted the study in determining the demographic factors that have a significant influence on satisfaction levels and provided a basis for customized approaches to enhance information security management.
Figure 3 presents the demographic information of customers, revealing that there are 40 males and 37 females in the gender distribution. The age demographic indicates that the largest distribution falls under the age category of 30–44 years old with 28, followed by 21 between 45–59, 18 between 18–29 years old, and 10 in and over 60 years old. In terms of educational level, 35 participants hold a Bachelor's degree, 23 have a Master's degree, 12 have completed high school, and 7 participants have a PhD. When it comes to the types of insurance, the most preferred is life insurance by 47 participants, whereas 30 participants have property insurance. For channels through which information leakage occurs, mobile applications are the most frequently cited at 25, followed by websites at 20, email communication at 15, and other sources at 17. Lastly, in terms of price categories in Yuan, 35 participants fall into the 80,000–500,000 range, followed by 22 participants in the 600,000–1,000,000 range and 20 participants in the 0–20,000 range.
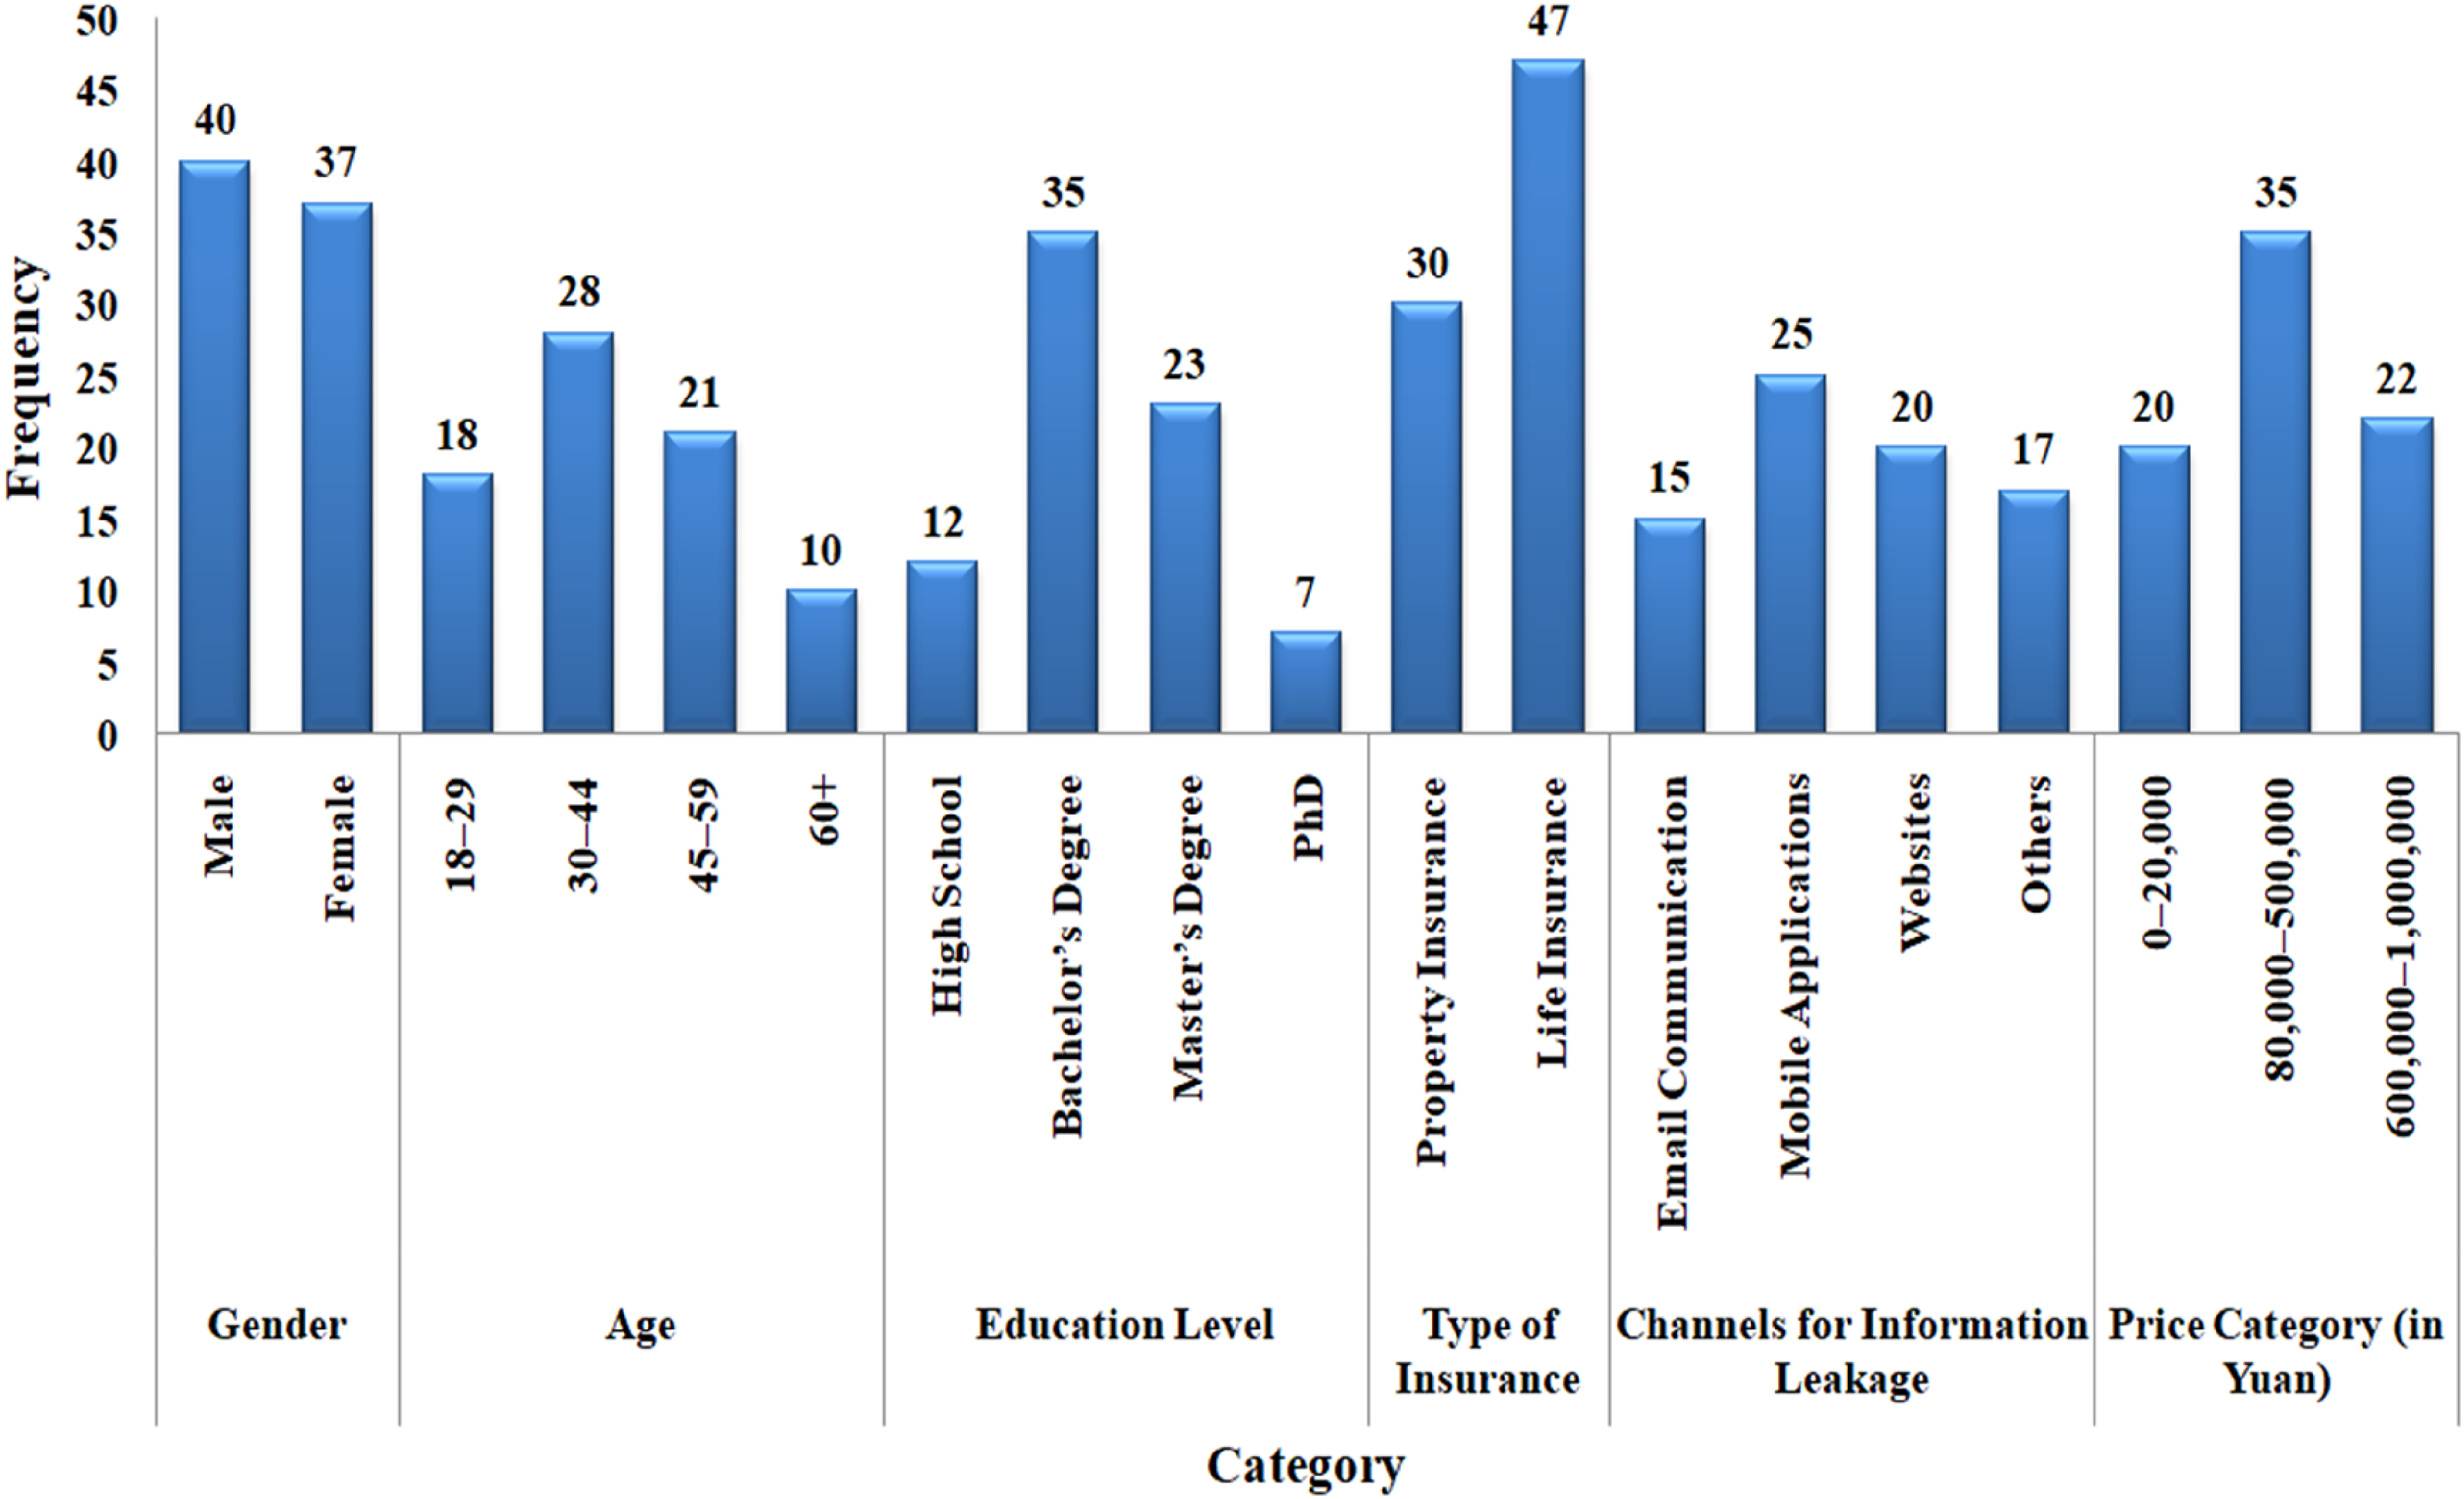
Demographic details.
Data analysis
SPSS software was employed to analyze the data, applying interval estimation, ANOVA, and regression analysis techniques. Interval estimation has been used to find confidence intervals for customer satisfaction levels. ANOVA has helped to analyze the variations in the satisfaction levels across different groups of demographics and policies, and regression analysis has tried to figure out the interdependencies between independent variables such as types of insurance and levels of satisfaction.
The analysis of the collected data was performed using SPSS software, utilizing the following statistical techniques:
Descriptive Statistics: To summarize, the study outlined the demographic characteristics of the respondents and the means of key variables. ANOVA (Analysis of Variance): To identify differences in customer satisfaction across different demographic groups and types of insurance policies. Regression Analysis: To examine the relationships between independent variables (insurance type, security measures, technology adoption) and dependent variables (customer satisfaction, perceived risk).
Ordinary Least Squares (OLS) Regression: Used to identify relationships between variables. Variance Inflation Factor (VIF): To ensure valid regression results, the study examined multicollinearity among the independent variables. Reliability and Validity Tests: The study used Cronbach's Alpha to measure the internal consistency of the scales.
In addition, Structural Equation Modeling (SEM) was applied to confirm the measurement model by conducting Confirmatory Factor Analysis (CFA), path coefficient analysis, and tests for discriminant validity such as the Fornell-Larcker criterion and HTMT. Goodness-of-Fit Measures were used to assess the overall quality and robustness of the proposed research model.
The study adhered to strict ethical guidelines. Participants were fully briefed on the study's aims, and their participation was entirely voluntary. Informed consent was acquired from all participants, ensuring they were aware of the study's goals and confidentiality protocols. The responses were kept anonymous, and all data were handled in strict compliance with ethical standards for privacy and data protection. This methodology section outlines a structured approach for investigating customer satisfaction and personal information security in the insurance sector. It integrates a quantitative research design, validated measurement scales, diverse data collection strategies, and rigorous statistical analysis methods. By applying methods such as ANOVA, OLS regression, and Structural Equation Modeling, the study delivers comprehensive insights into customer satisfaction and the impact of information security practices within the insurance sector.
Results
This section reports on the study findings by giving a comprehensive analysis of customer satisfaction with personal information security management in the Chinese insurance industry. The study is reported as interval estimation and average satisfaction levels for the sampled population. Analysis of variance is used to pinpoint demographics and corporate factors that have an effect on satisfaction. An analysis of information leakage is conducted to explore potential vulnerabilities across different channels. Regression analysis results disclosed a few very important corporate determinants such as monetary capital, claims reserves, and highly educated personnel as the mains factors of satisfaction.
Interval estimation
In interval estimation, the population parameter is estimated within a range, which is usually derived by adding and subtracting the estimation error from the sample statistic. The confidence interval refers to the range within which the population parameters are estimated, based on the sample statistics during interval estimation. The minimum value of the confidence interval is referred to as the lower confidence limit, while the maximum value is known as the upper confidence limit.
This study uses this interval estimation to estimate consumers’ overall satisfaction with client information security management in China's insurance industry.
In the case of a large sample (n ≥ 30) and known population variance (σ²), the sample mean's distribution is normal, with a mean equal to the population mean (μ) and a variance of σ²/n. When the sample mean is standardized, the resulting random variable follows a standard normal distribution:
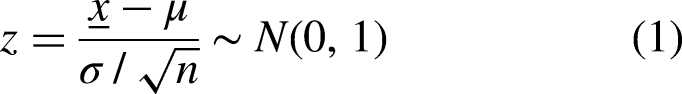
According to formula (1) and the properties of the normal distribution, the confidence interval for the population mean (μ) under a confidence level of 1-α is:
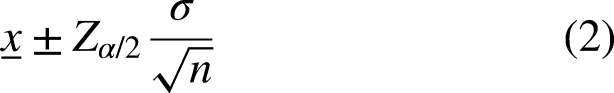
In Equation (2),
Table 1 presents the interval estimation for the variable “satisfaction” (Satindustry) of China's insurance industry through responses from 77 observations. The mean satisfaction is 61.16, which has a standard error of 2.98. In other words, it indicates that a sample mean is a reasonably good estimate for the actual population mean when the standard error is low. The satisfaction level is estimated to lie within a 95% confidence interval of 55.23 to 67.09.
Interval estimation of “satisfaction” in China's insurance industry.
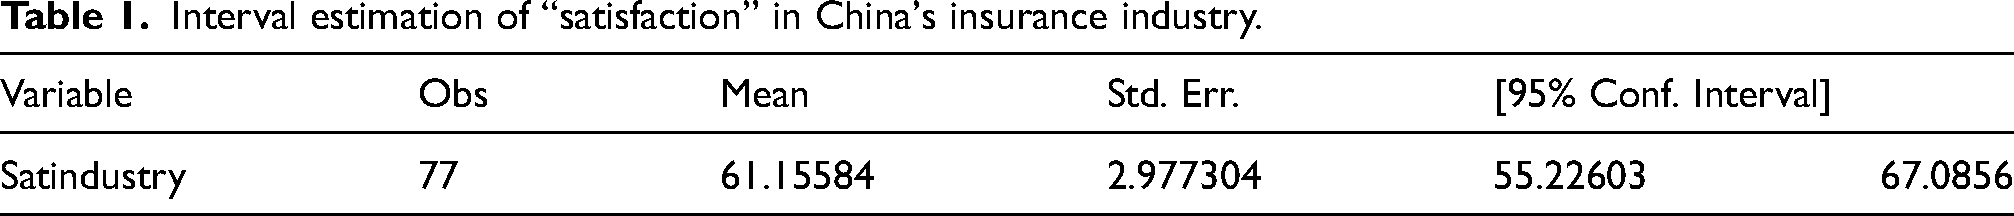
Therefore, it is likely that the population's true mean satisfaction level would be in this range. These confidence intervals give insight into how the customers perceive it as an organization, where the midpoint satisfaction score indicates there are improvement spots for information security management practice across the insurance sector.
ANOVA results
Analysis of variance (ANOVA)
Analysis of variance (ANOVA) assesses whether categorical variables have a significant impact on their levels by comparing the mean values across different populations to see if they are equal. According to different types of independent variables, ANOVA can be divided into one-way ANOVA, interactive and non-interactive two-way ANOVA. This study will use one-way ANOVA and two-factor ANOVA without replication.
One-way ANOVA
Table 2 presents one-way ANOVA to analyze hypotheses H3 and H4. The specific steps are as follows:
Step 1: Hypotheses presentation Step 2: Construction of test statistics
The one-way ANOVA summary table.
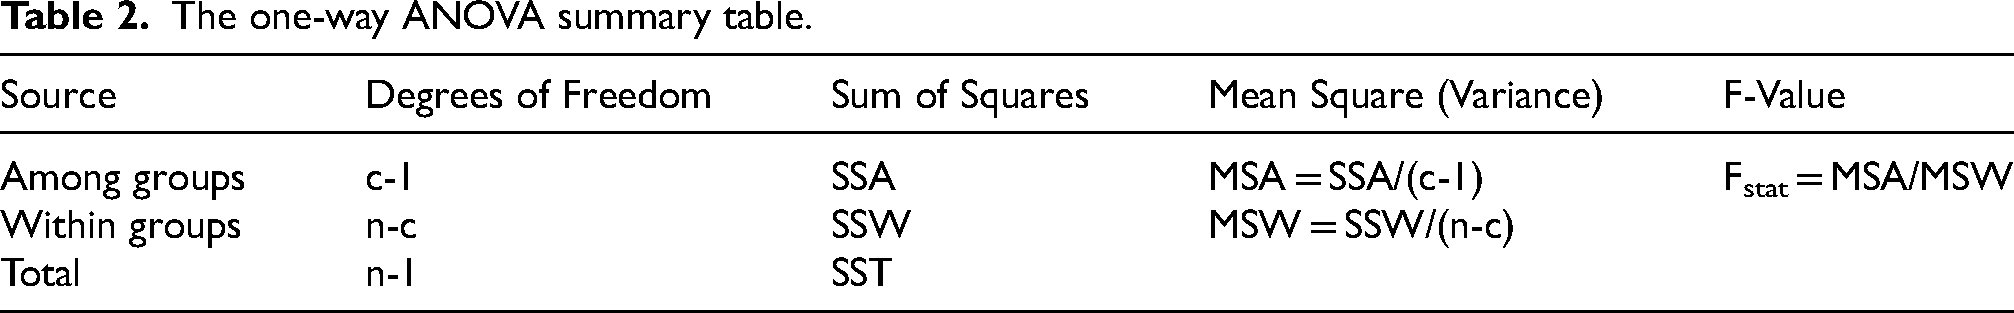
In order to construct test statistics, it is necessary to calculate the sum of squares for total (SST), the among-group variation (SSA), and the within-group variation (SSW) through Equation (3).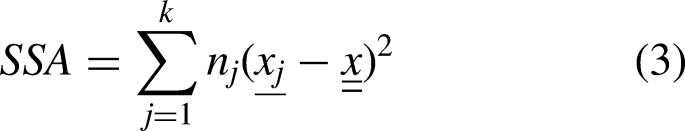
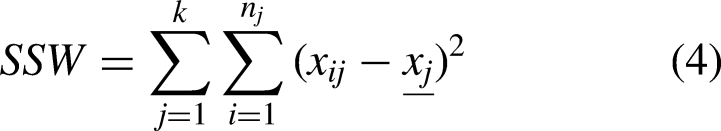
Finally, the sum of squares for total (SST) can be obtained by adding SSW and SSA together (refer to Equations (4) and (5)). Step 3: Statistical decision
When the significance level is 0.05
When Fstat exceeds Fα (with a p-value less than 0.05), the null hypothesis is rejected, indicating a significant impact of the independent variables on the dependent variables.
When Fstat is less than Fα (with a p-value greater than 0.05), the null hypothesis is retained, indicating that the independent variables do not significantly impact the dependent variables.
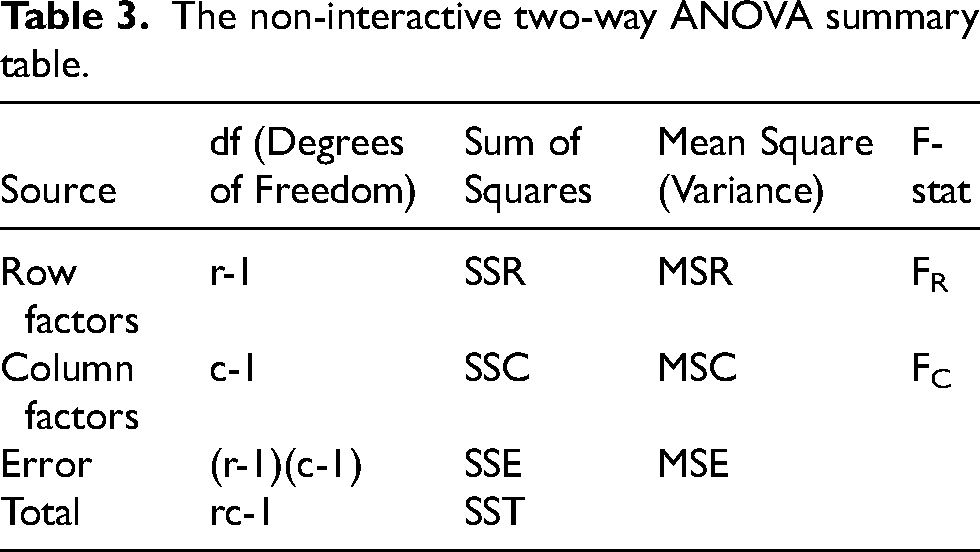
Two-way ANOVA with no interaction
Table 3 presents the non-interactive two-way ANOVA summary table. Two-way ANOVA with no interaction would be adopted to analyze Assumption H1 and H2 which are:
Different types of insurance would affect the satisfaction of people with different educational degrees Different types of insurance would affect the satisfaction of different age groups
The non-interactive two-way ANOVA summary table.
The specific steps are as follows:
Step 1: Hypotheses presentation
The hypotheses put forward for the row factors are:
The hypotheses put forward for the column factors are:
Step 2: Construction of test statistics
In the two-way ANOVA, it is necessary to determine the statistics of test row factors and column factors respectively, which are:
Regression sum of squares caused by row factors (SSR) see Equation (6):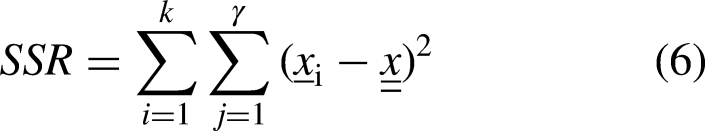
Regression sum of squares caused by row factors (SSC) see Equation (7):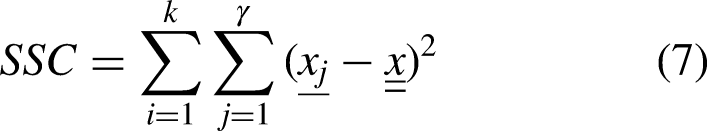
Sum of squares of random errors caused by residual factors other than row factors and column factors (SSE) see Equation (8)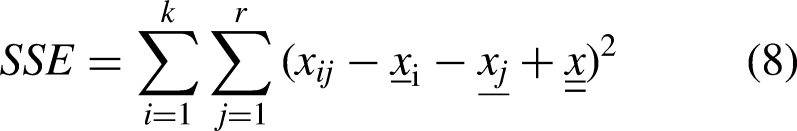
Finally, the sum of squares for total (SST) can be calculated as the following Equation (9). Step 3: Construction of test statistics
When Fstat exceeds Fα (with a p-value less than 0.05), the null hypothesis is rejected, indicating that the row factors have a significant effect on the observed value.
When Fstat < Fα (with a p-value greater than 0.05), the null hypothesis is not rejected, indicating that the column factors do not significantly affect the observed value.
ANOVA of “satisfaction” between “educational levels” and “insurance types”
In this part, the analysis investigates whether varying educational levels and types of insurance products have a notable impact on satisfaction in a non-interactive setting.
As per the insurance law of the People's Republic of China, insurance objects are categorized into two types: personal insurance and property insurance. Life insurance refers to insurance where the subject of coverage is a person's life and body, including types like life insurance, injury insurance, and health insurance. Property insurance is a form of insurance that focuses on property and its related benefits, including categories like property insurance, agricultural insurance, liability insurance, guarantee insurance, and credit insurance. Therefore, the study formulates the following variables:
“Type 0” refers to property insurance; “Type 1” refers to life insurance; “Edu 1” refers to the educational level of high school, technical secondary school and below; “Edu 2” refers to the college level; “Edu 3” refers to the undergraduate level; “Edu 4” refers to the educational level of master and above;
Table 4 presents the results of a non-interactive two-way ANOVA, showing that neither the type of insurance nor customers’ educational levels have a significant impact on satisfaction, as indicated by the high p-values.
Non-interactive two-way ANOVA result.
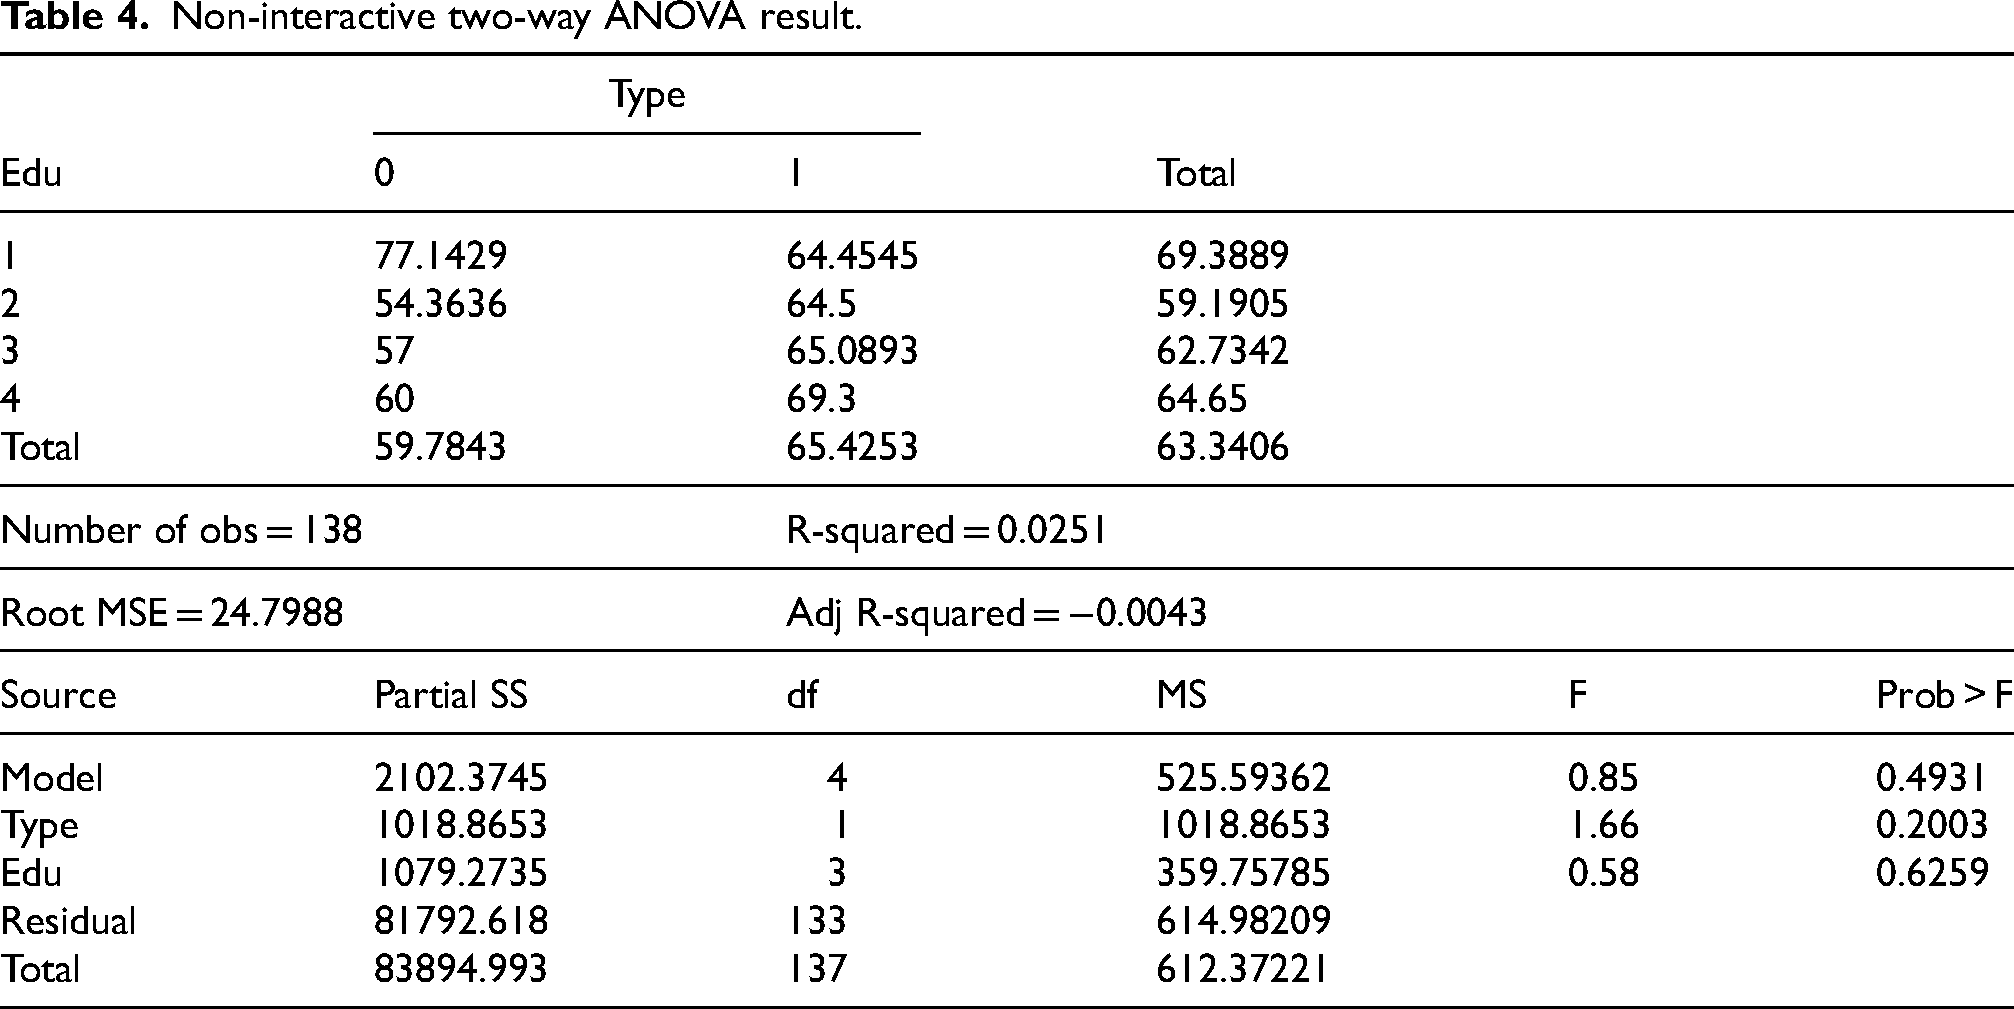
In Table 4, the P-value (Prob > F) corresponding to variable “type” is 0.2003, indicating that the impact of different types of insurance on “satisfaction” is insignificant, and the P-value (Prob > F) corresponding to variable “edu” is 0.6259, indicating that the impact of customers’ educational levels on satisfaction is also insignificant.
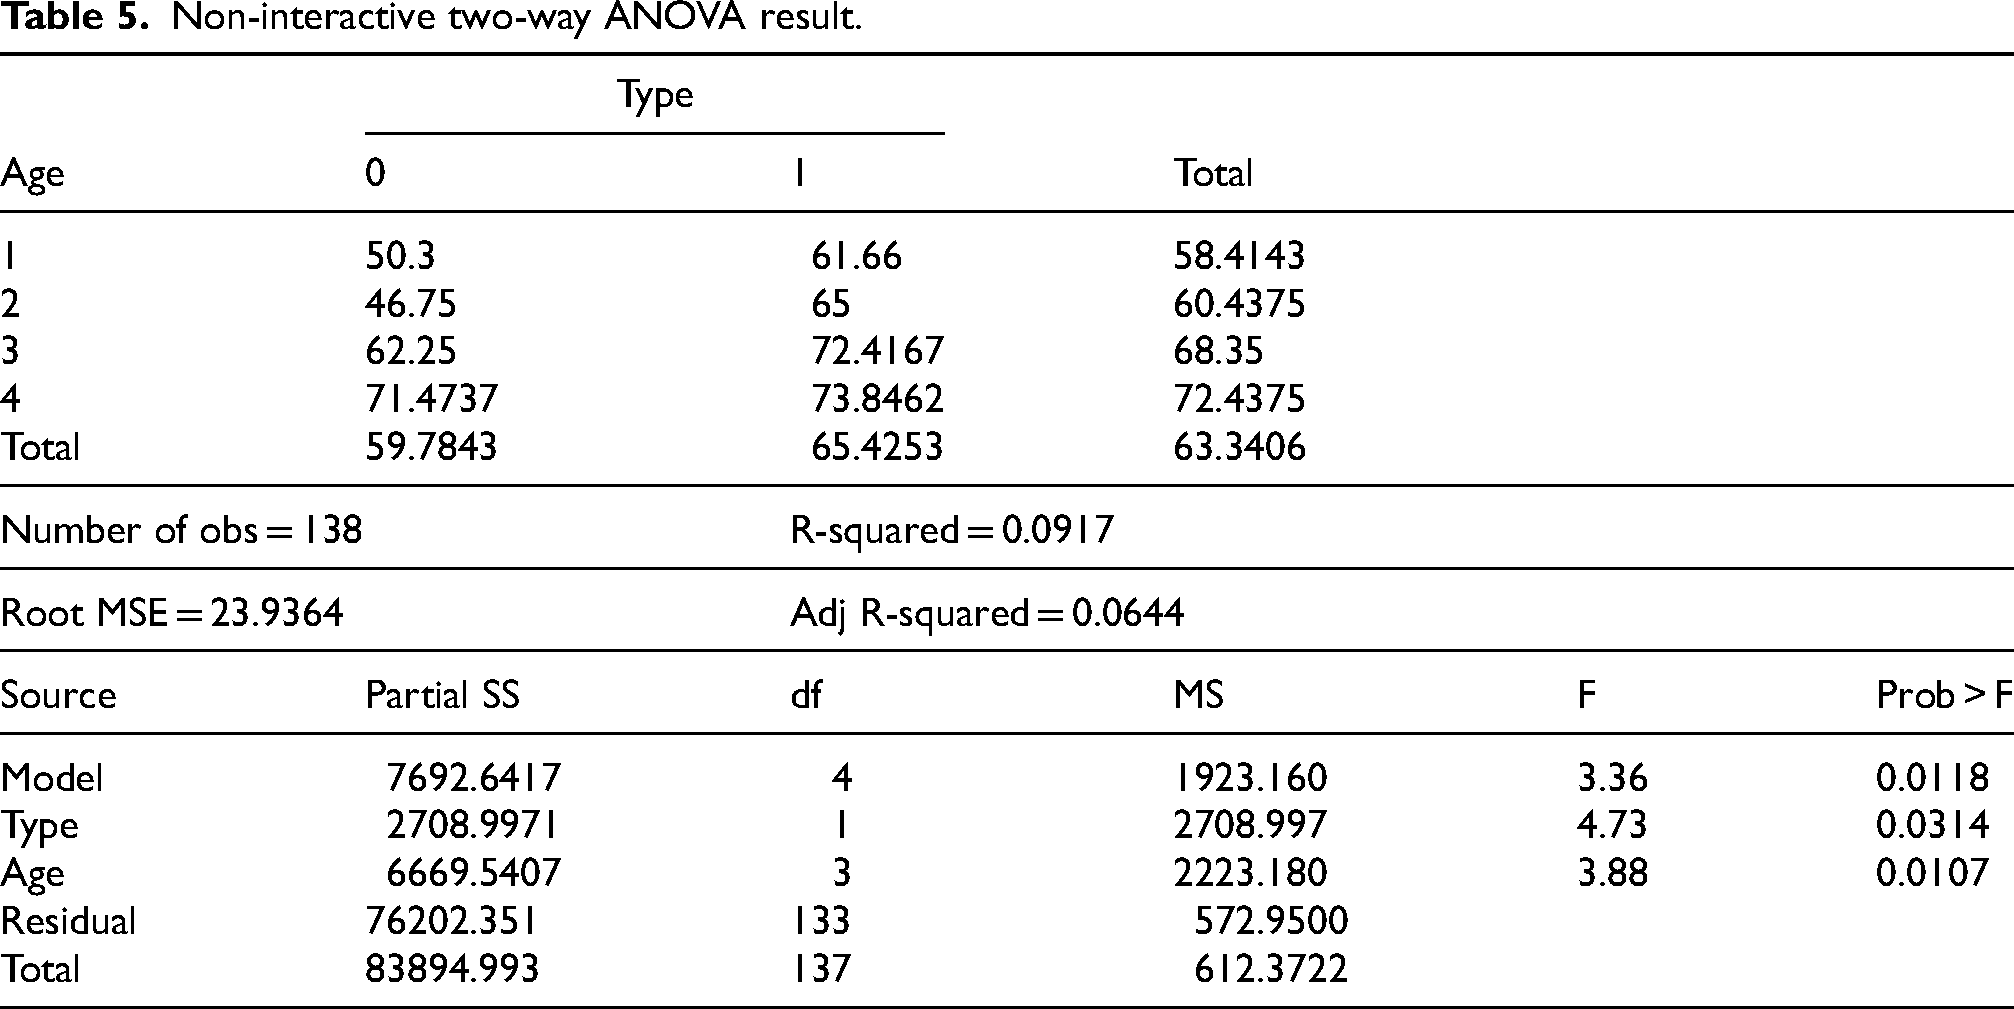
ANOVA of “satisfaction” between “ages” and “insurance types”
China Online Insurance Customer Insight Report (https://max.book118.com/html/2022/0212/6202030144004114.shtm) in 2021 shows that the post-80 s and post-90 s are more likely to buy insurance because of financial management configuration, and the post-60 s and post-70 s are more likely to be touched by people around them or their own health conditions and buy insurance. In addition, the report surveyed 3155 samples in September 2021. Among them, the proportion of people aged 20–30 is 15%, the proportion of people in age group 31–40 and 41–50 is the largest, 45% and 30% respectively, and the proportion of people aged 51–60 is 10%. The results of the report are roughly the same as what the study investigated by telephone survey. Therefore, according to the number and the characteristics of samples, the study formulate the following four age groups.
“Age 1” represents people aged 18–29, who are new to the workplace, with generally low income, less personal assets, generally high health level and low demand for insurance; “Age 2” represents people aged 30–44, whose income tends to be stable, their health level is generally high, and they begin to bear more family responsibilities, such as supporting parents and children, repaying car loans and housing loans, so they begin to pay attention to buying insurance; “Age 3” represents people aged 45–59, who generally have higher income and more personal assets, but their health level begins to decline, so they have a greater demand for insurance; “Age 4” refers to people over 60. This kind of people began to retire, their income began to decrease, their living and investment expenses were low, and their health level began to decline; “Type 0” refers to property insurance; “Type 1” refers to life insurance;
Table 5 shows that the P-value corresponding to variable “type” is 0.0314, indicating that the impact of insurance product type on “satisfaction” is significant, and the P-value (Prob > F) corresponding to variable “age” is 0.0107, indicating that the impact of different age groups on “satisfaction” is significant. From the perspective of insurance types, consumers are generally more satisfied with the information security management of life insurance than property insurance. From the perspective of age, the older the policyholder is, the higher the “satisfaction” tends to rise.
Non-interactive two-way ANOVA result.
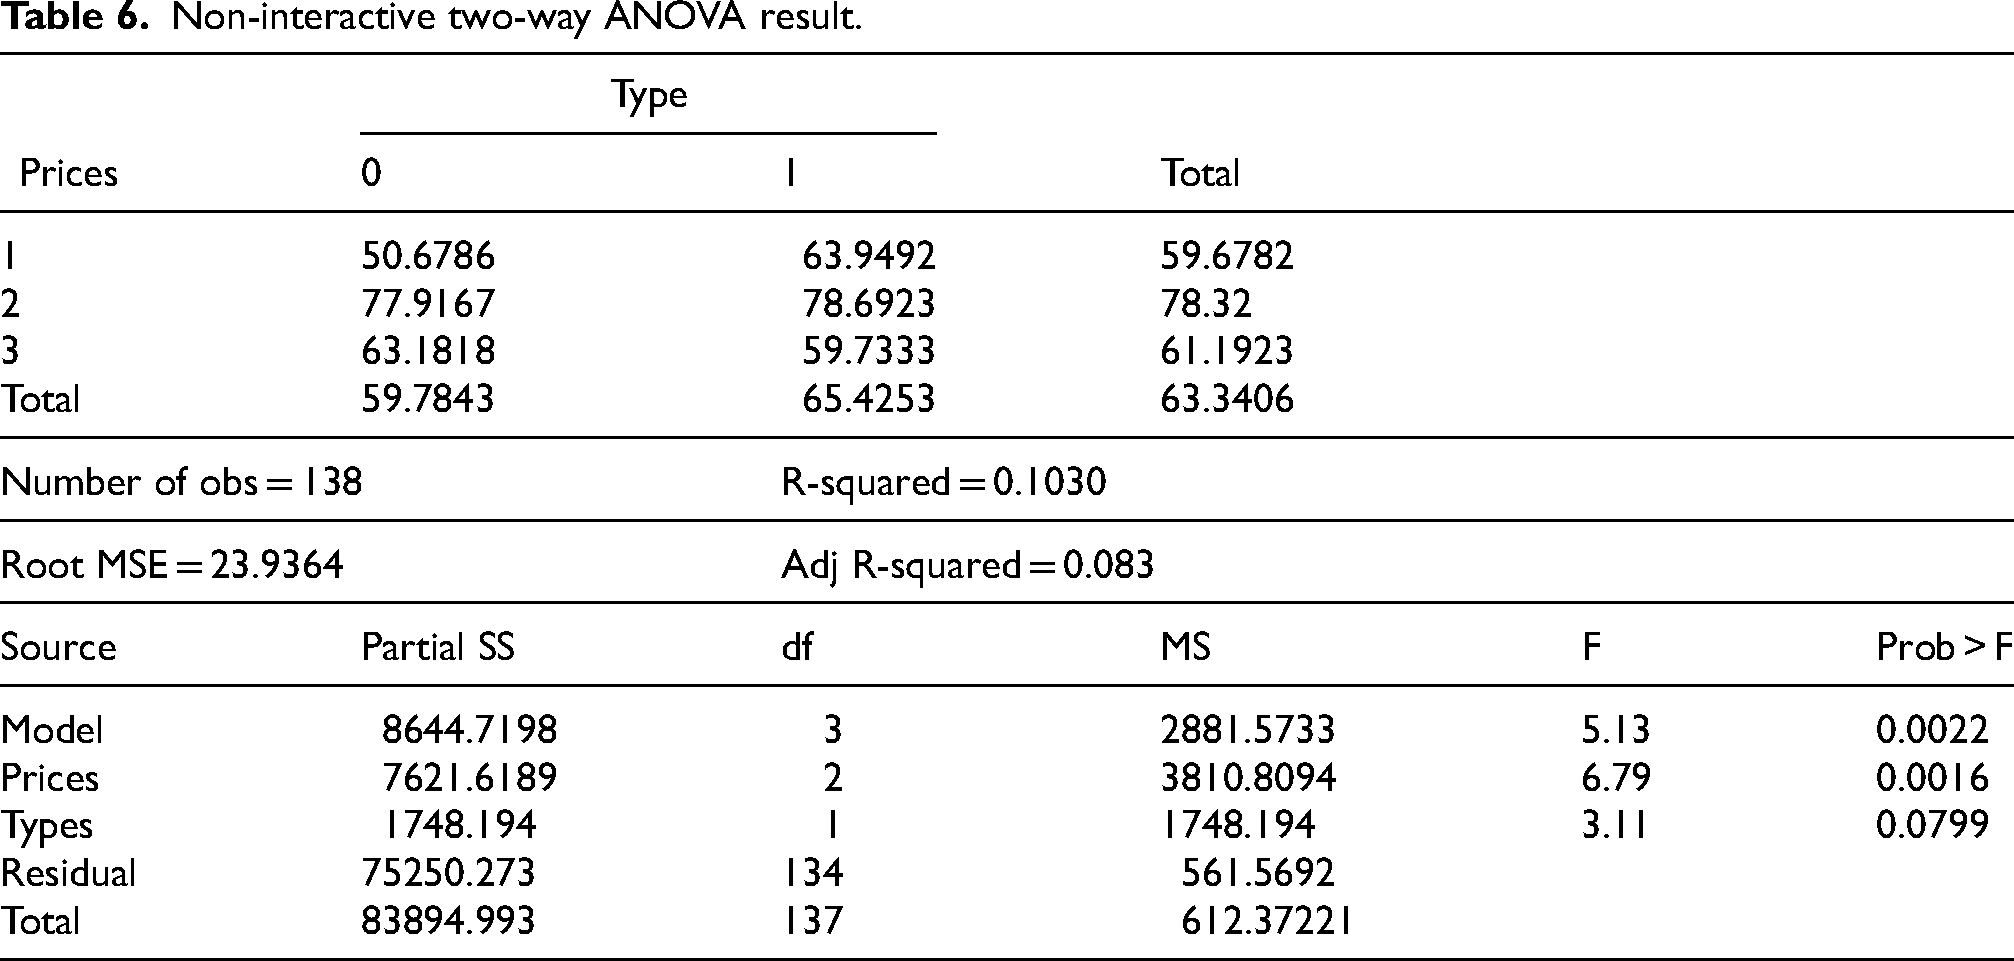
ANOVA of “satisfaction” between “prices” and “insurance types”
In this survey, the insurance prices consulted and purchased by all respondents ranged from 0 Yuan to 1000000 Yuan (about US $148302). Besides, the National Bureau of Statistics in China recorded (http://www.stats.gov.cn/xxgk/sjfb/zxfb2020/202101/t20210118_1812464.html), in 2020, the per capita disposable annual income of Chinese residents was 32189 yuan (about US $4774), of which the median was 27540 yuan (about US $4085).
According to the number of interviewees, the total insurance price range and the per capita income level in 2020, roughly divide the prices of insurance purchased by the interviewees into the following three ranges:
“Prices 1” means “low-priced insurance”. The total price range of this insurance is 0–20000 yuan (the US dollar price is about $0–$2968), of which 0 yuan is the insurance products given to customers by the seller of goods and services; “Prices 2” means “mid-priced insurance”. Its total price range is 80000–500000 yuan (US $11864–$74150). “Prices 3” means “high-priced insurance”. Its total price range is 600000–1000000 yuan (US $88981–$148302).
In addition, by combine insurance prices and insurance types for the non-interactive two-way ANOVA to explore whether they will affect “satisfaction”.
“Type 0” refers to property insurance; “Type 1” refers to life insurance;
It can be seen from Table 6 that the corresponding P-value (prob > F) of insurance types is 0.0799, indicating that the influence of insurance type on “satisfaction” is not significant in this two-way ANOVA. The P-value (prob > F) corresponding to the insurance price is 0.0016, which means that the relationship between the insurance price and “satisfaction” is significant. Moreover, the total “satisfaction” will rise with the price rise.
Non-interactive two-way ANOVA result.
ANOVA of “satisfaction” among companies
In Table 7, the P-value (Prob > F) of the one-way ANOVA is 0.0329, so it is considered that the difference among the indicators of average “satisfaction” of different companies is significant. In addition, the average “satisfaction” of company C and company G is relatively high, and the average “satisfaction” of company H is the lowest.
One-way ANOVA result of “satisfaction”.
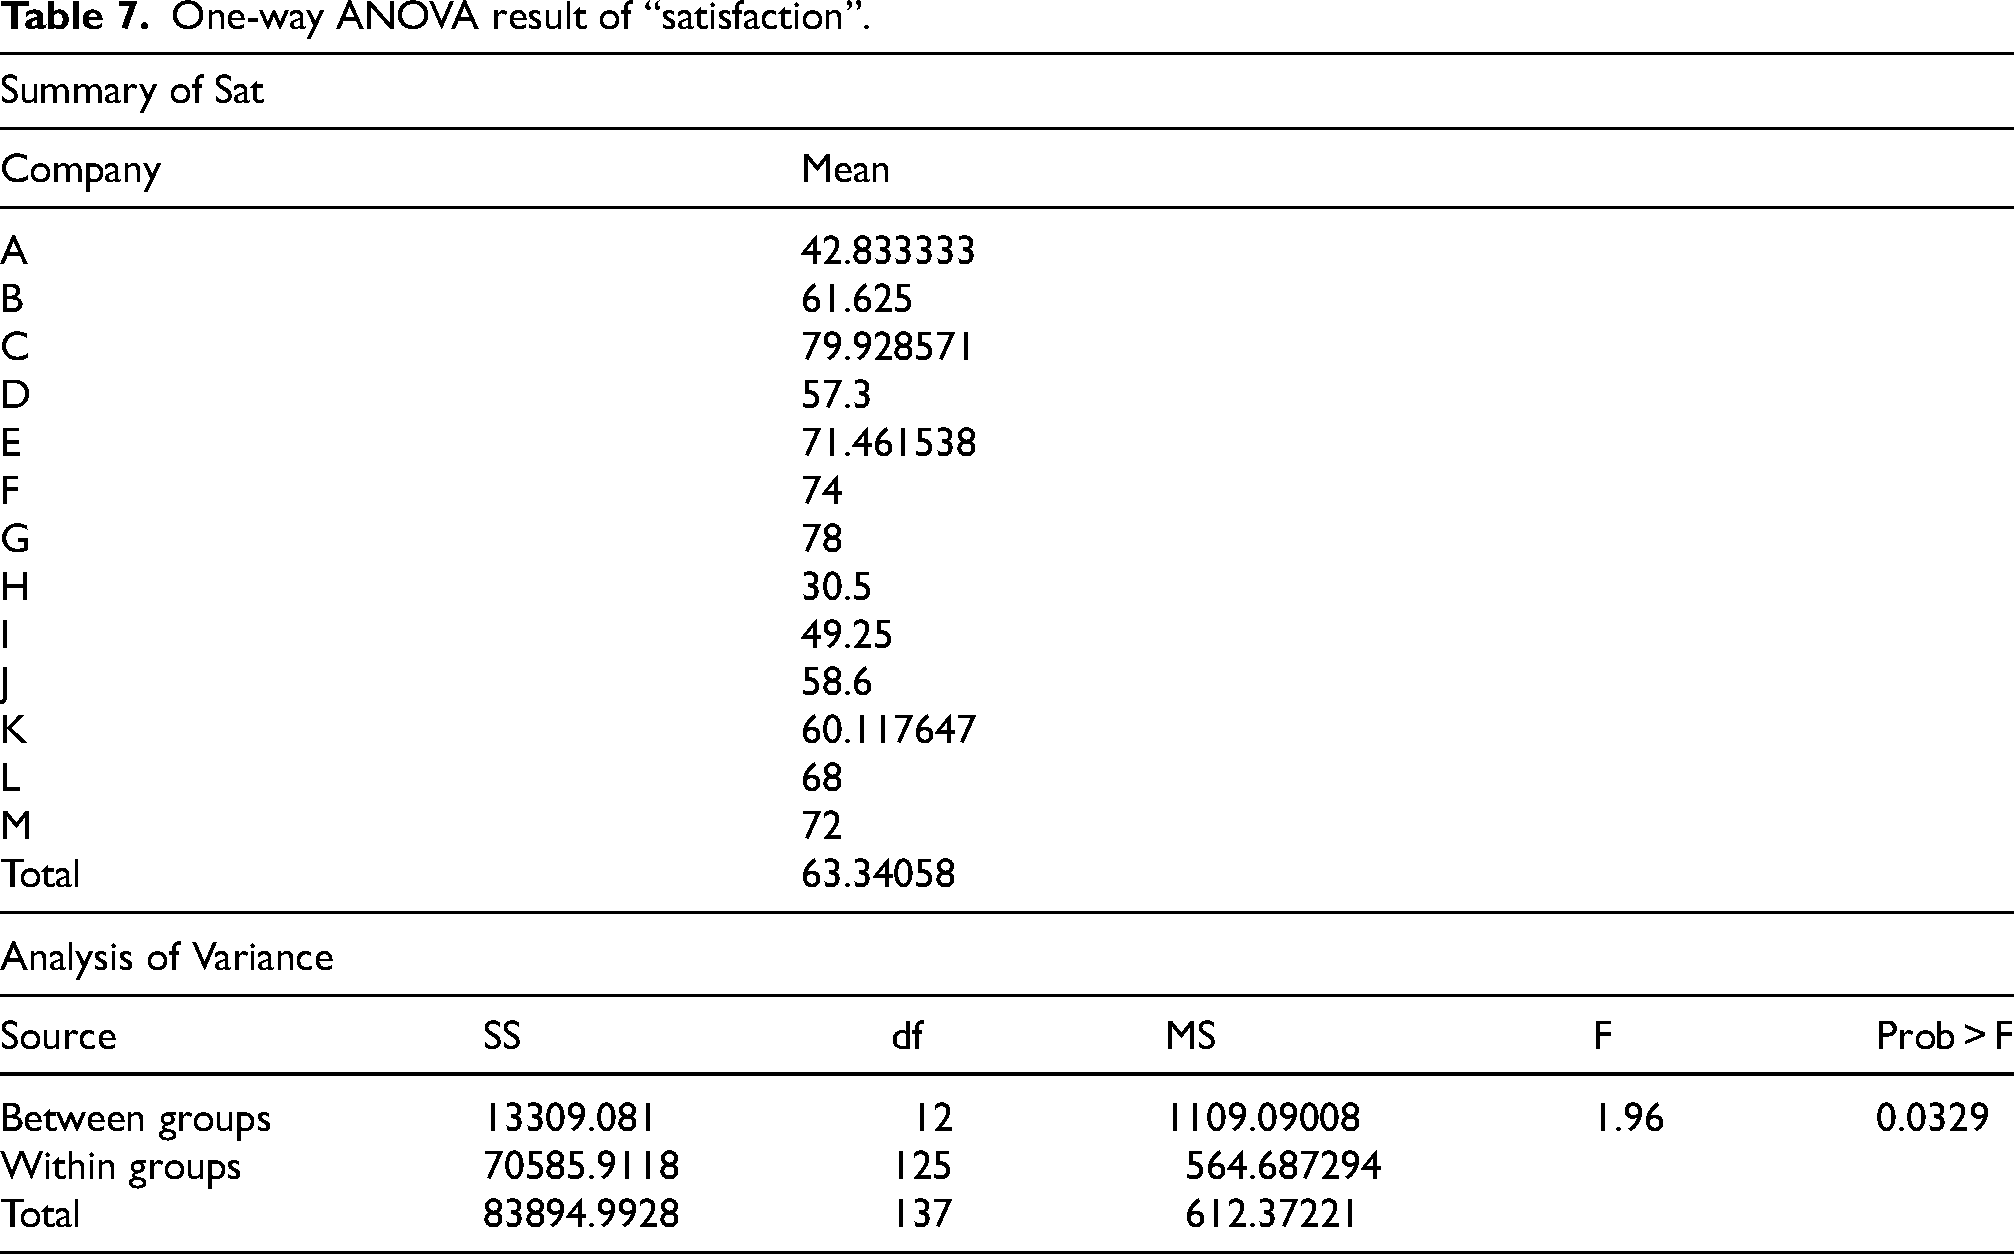
However, one-way ANOVA cannot explain which corporate factors will affect the average “satisfaction”. Therefore, in section 4.7, the study will make up for the deficiency of one-way ANOVA in this part.
Information leakage analysis
One-way ANOVA of “grades” among ways of information leakage
Many studies have explained the ways of information leakage. In the trading channel, Kolotylo-Kulkarni et al. (2021) found that customers’ personal information might be disclosed when registering at a commercial website, or other online platforms. In terms of logistics, information leakage would be used to affect mainline carriers’ competition and their profits during cross-border logistics (Niu et al., 2022).
Security risks in computer networks include physical breaches, illegal external connections, unauthorized access by devices, password compromises, identity theft, software or operating system vulnerabilities, network assaults, and virus intrusions (Aslan et al., 2023). Therefore, in analyzing the ways of information leakage, the study not only consider the individuals and organizations associated with insurance sales, but also consider logistics and network platforms. The specific ways are as following:
“Products” refers to products and services containing insurance business, such as real estate sales, automobile sales, tourism sales, etc. “Agencies” refers to insurance agencies “Applications” refers to applications on cellphones “Friends” refers to friends who recommend insurance products. “Logistics” refers to people or organizations of express logistics “Staff” refers to Employees of insurance companies “Virus” refers to trojan virus from internet
The study required interviewees to rate the above ways. The higher is the grade, the higher is the possibility of customer information disclosure.
In Table 8, the P-value (Prob > F) of the one-way ANOVA is 0.0024, meaning that customers believe that the grades of information disclosure in different ways are significantly different.
One-way ANOVA result of information leakage ways.
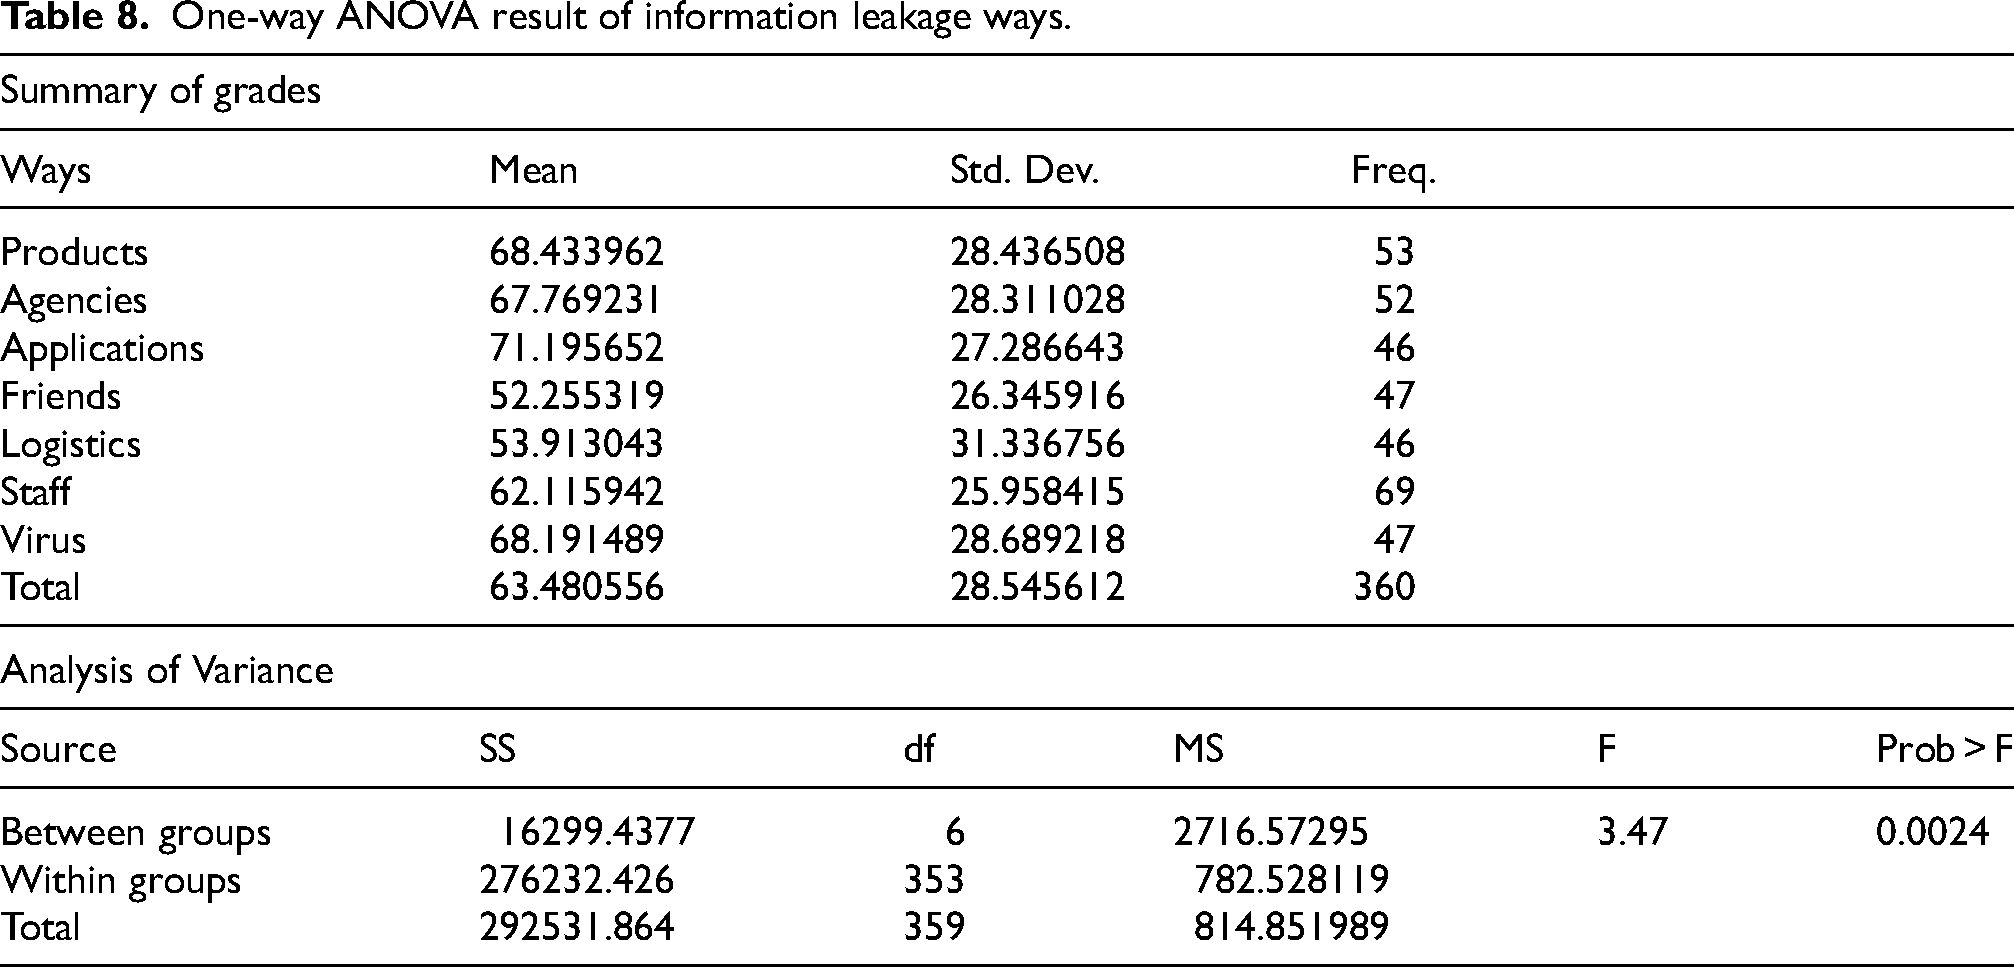
Besides, customers believe that applications on phones are the most likely to disclose personal information, while friends and express logistics are the least likely to disclose personal information.
Regression analysis
This analysis of customer satisfaction in relation to corporate factors employs an OLS model. The variables are examined for capital, reserves, and talent of employees for reliability using heteroscedasticity and multicollinearity tests. This method thus brings into view the significant organizational factors influencing satisfaction and presents recommendations to improve information security management within insurance companies.
The OLS regression between “satisfaction” and corporate factors
Multiple regression model construction
The variable ln(avgsati) is used in the regression to transform the average satisfaction scores, helping to linearize relationships, stabilize variance, and improve model interpretability by representing proportional changes. Table 9 shows that the p-values (p>| t |) of all explanatory variables including ln(capitali), ln(reservesi), and ln(talentsi) passed the test at the 0.05 level. Variables ln(capitali) and ln(talentsi) have significant positive correlations with ln(avgsati), while ln(reservesi) had a significant negative correlation.
Small-sampled multiple regression results.
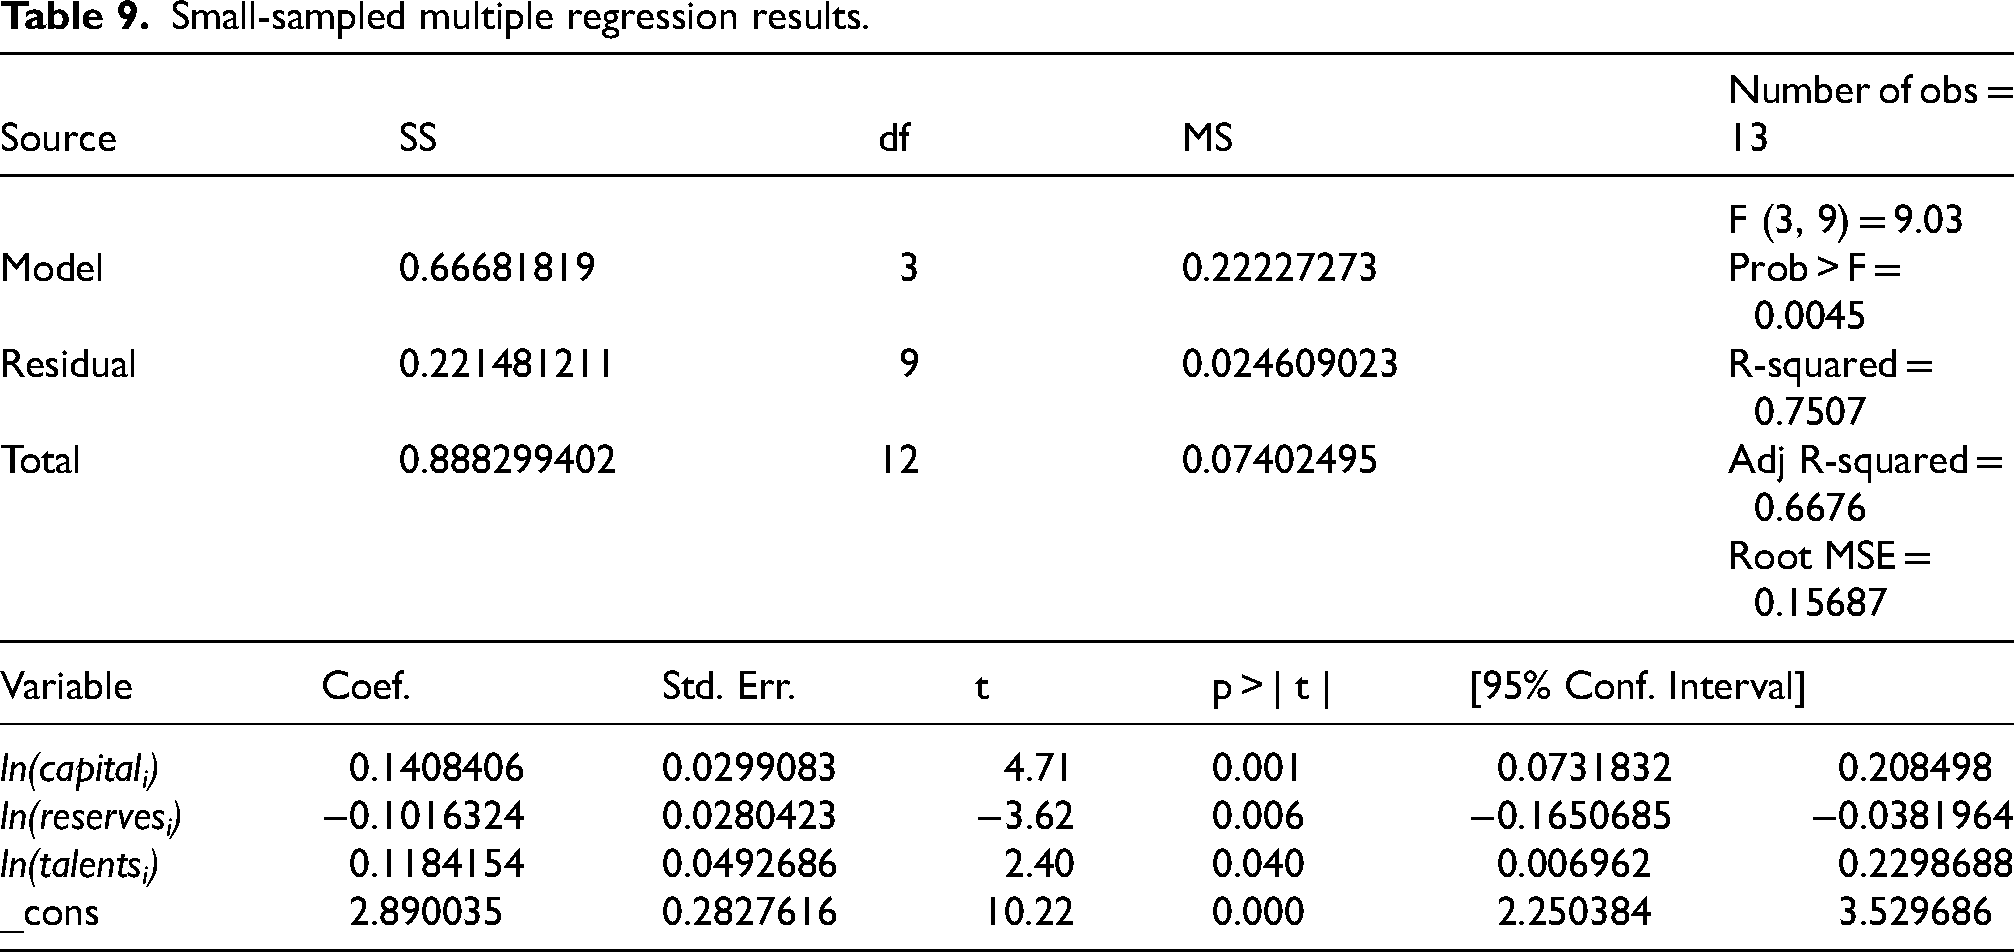
Thus, the study construct the following regression function (see Equation (10)):

According to the assumptions mentioned in Equation (10), the study conduct multiple collinearity and heteroscedasticity tests on the multiple regression model by implementing Equation (11).
Heteroscedasticity test
The heteroscedasticity test determines whether the variation of residuals in a regression model is homogeneous at all the levels of independent variables. Homoscedasticity, which is characterized by constant variance of residuals, is one of the most important assumptions of the Ordinary Least Squares (OLS) regression. In case heteroscedasticity occurs in a model due to violated assumptions, it can affect the efficiency and validity of a model, making statistical inferences drawn from it unreliable. The presence of heteroskedasticity affects the standard errors of the regression coefficients, which in turn diminishes the reliability of hypothesis tests.
Figure 4 illustrates the residual plot used to check heteroscedasticity in regression analysis. This plot represents residuals plotted against fitted values, with the residuals on the y-axis and the fitted values on the x-axis. It can be seen roughly that when the fitted value ln(avgsati) is between 3.8 and 4.2, the variance of the disturbance term is large, and when the fitted value ln(avgsati) is between 4.2 and 4.4, the variance of the disturbance term gradually decreases, so it can be preliminarily determined that the possibility of heteroscedasticity is low.
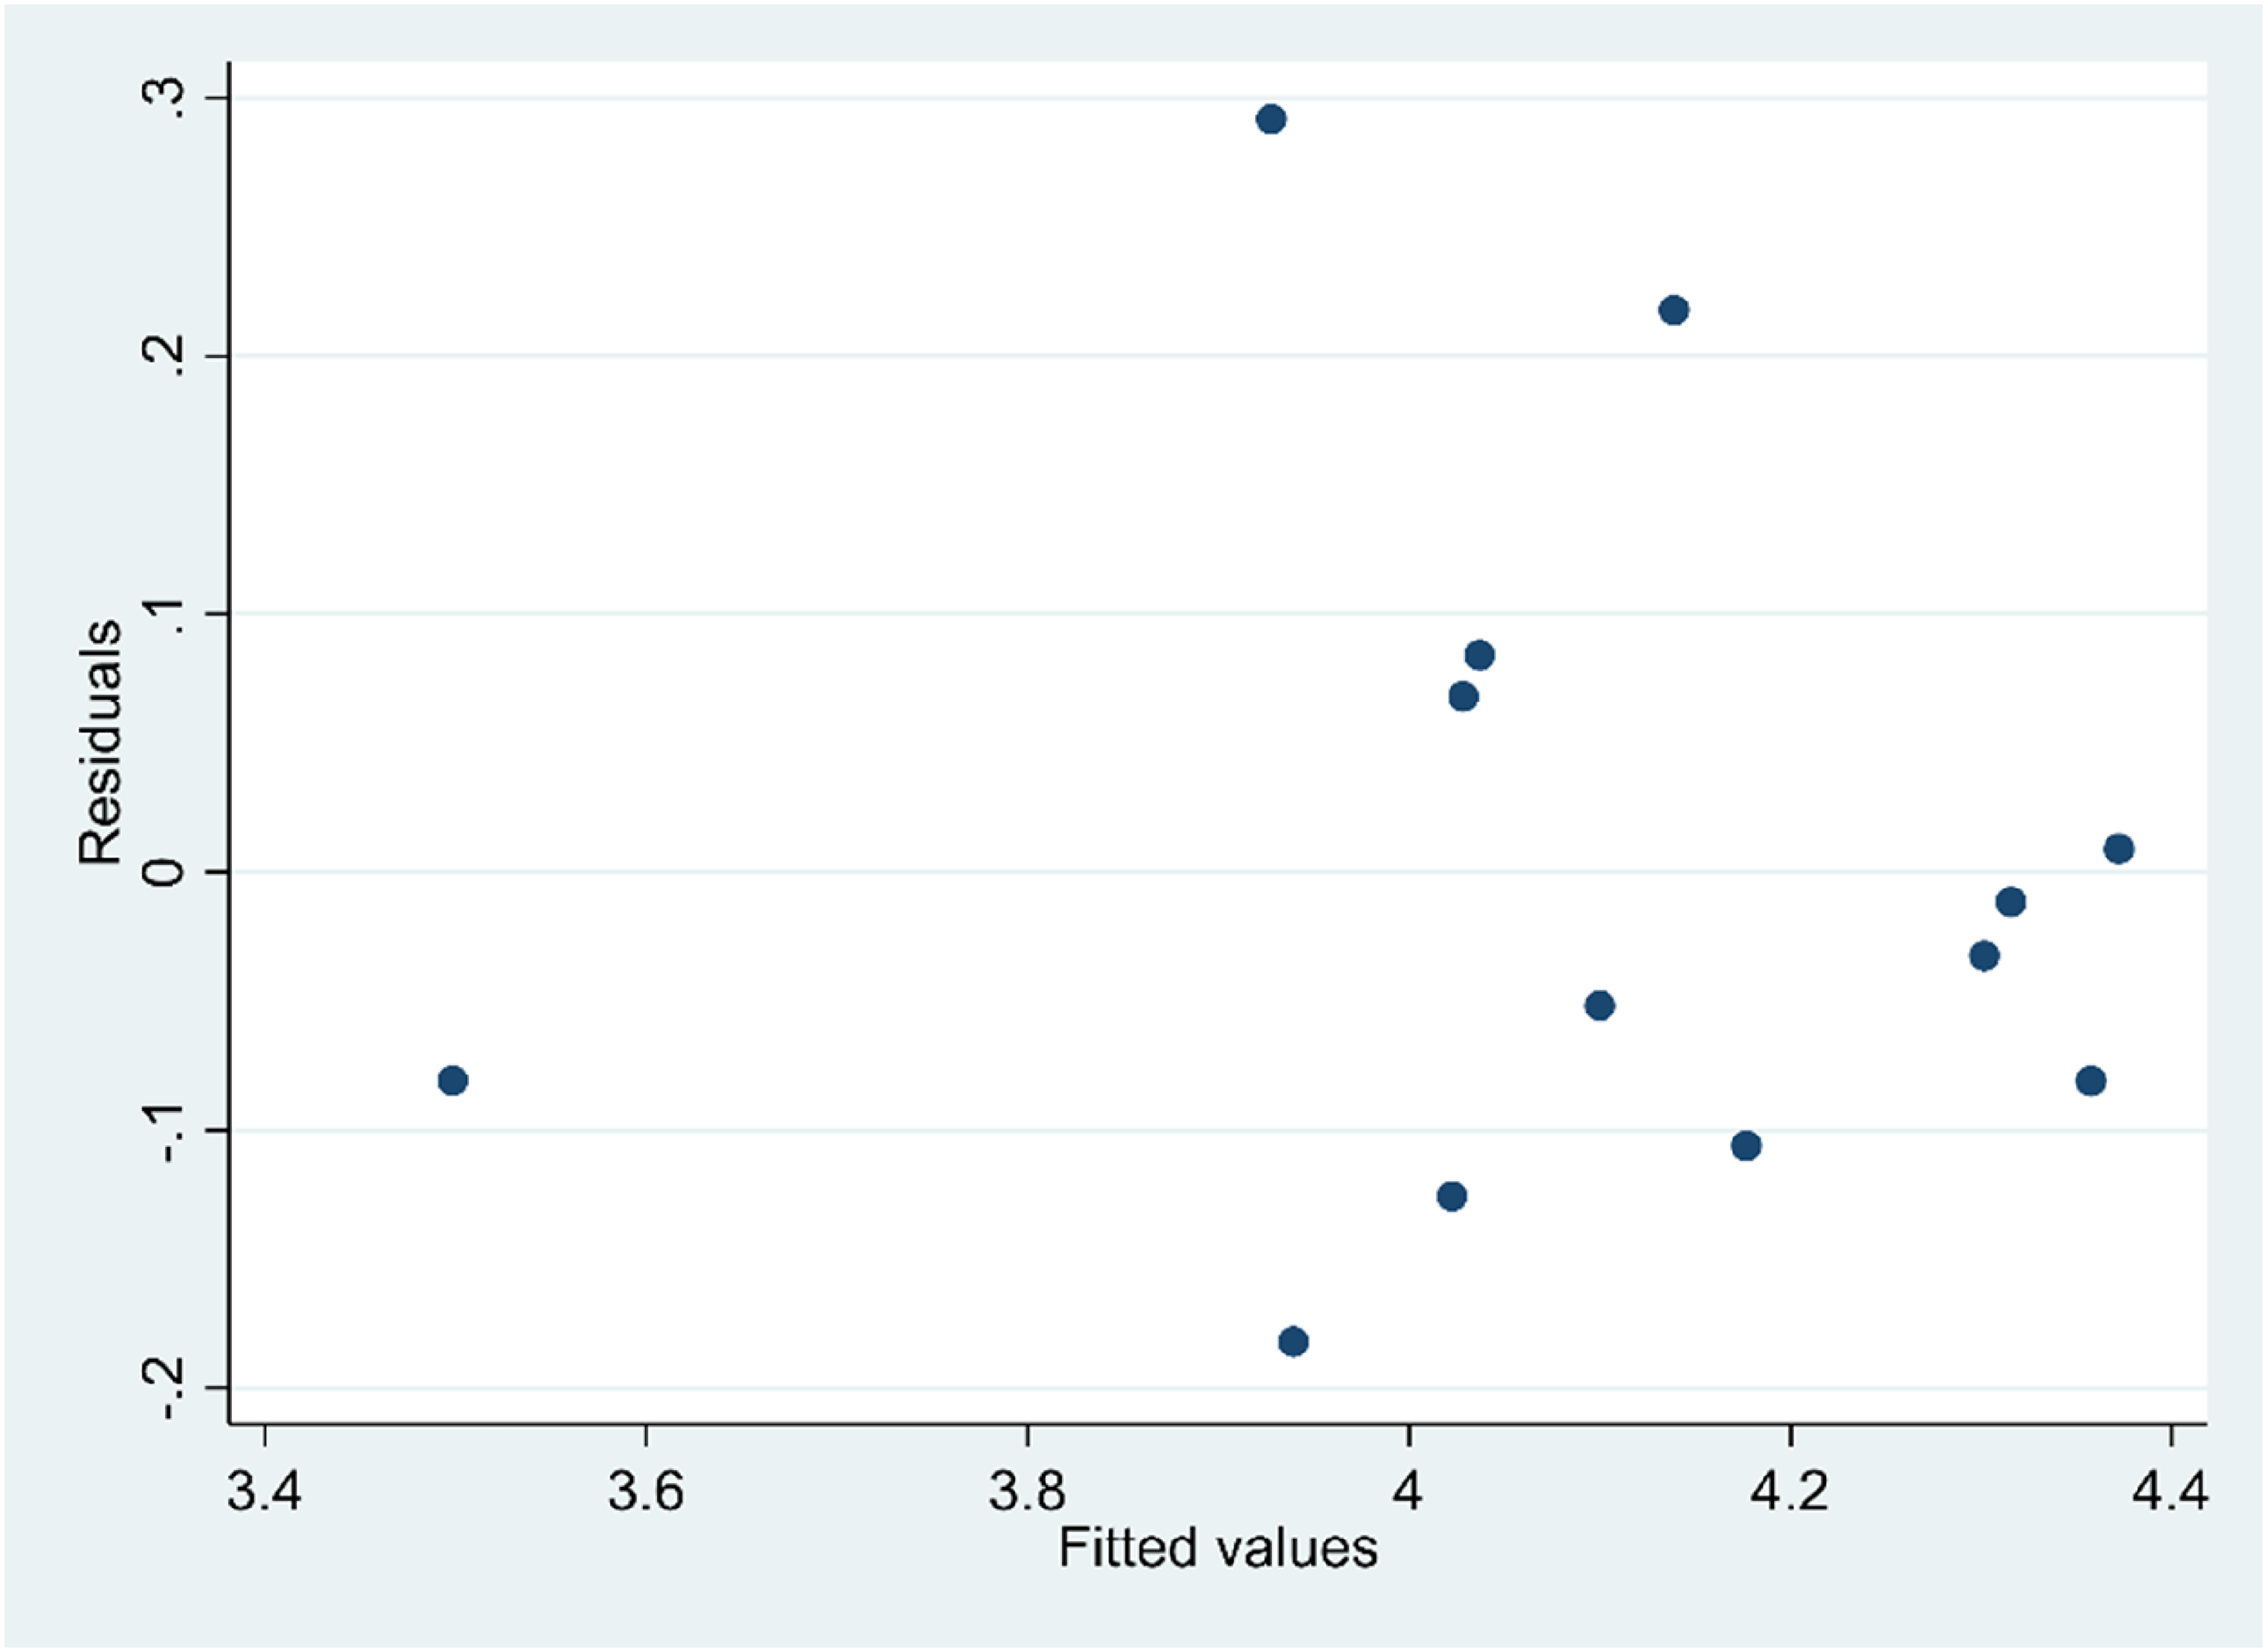
The residual plot.
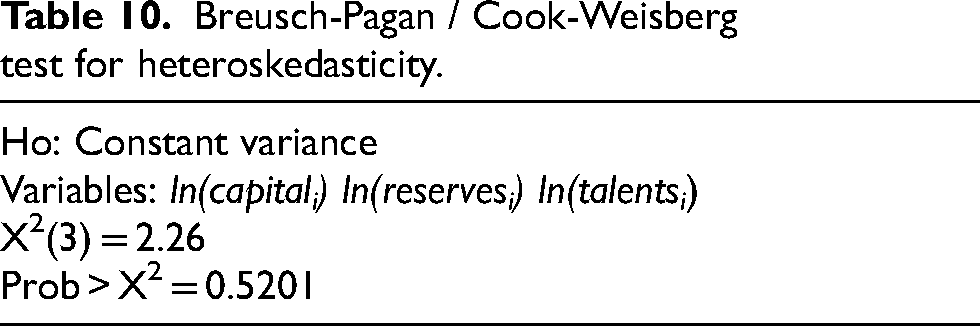
Table 10 displays the results of the Breusch-Pagan/Cook-Weisberg test for heteroskedasticity, suggesting that the variance of residuals in the regression model remains constant. By employing the null hypothesis H0, the test checks for the absence of heteroskedasticity, assuming that the variance remains constant. The test was done on independent variables ln(capitali), ln(reservesi) and ln(talentsi). The Chi-square value computed is 2.26, with a corresponding p-value of 0.5201. As the p-value is above the conventional significance level of 0.05, the null hypothesis is retained, which implies that there is no evidence of heteroskedasticity in the model.
Breusch-Pagan / Cook-Weisberg test for heteroskedasticity.
The results of White's test, assessing heteroskedasticity in the regression model, are shown in Table 11. Heteroskedasticity is a condition where the variance of residuals varies, in contrast to homoskedasticity, where the variance is assumed to be constant. A chi-square statistic of 12.56, accompanied by 9 degrees of freedom and a p-value of 0.1837, was obtained for the test. With a p-value greater than the conventional 0.05 significance level, we fail to reject the null hypothesis, meaning there is no evidence to suggest heteroskedasticity in the model. The heteroskedasticity p-value of 0.1837 further confirms that variance problems are not significant.
White's test result.
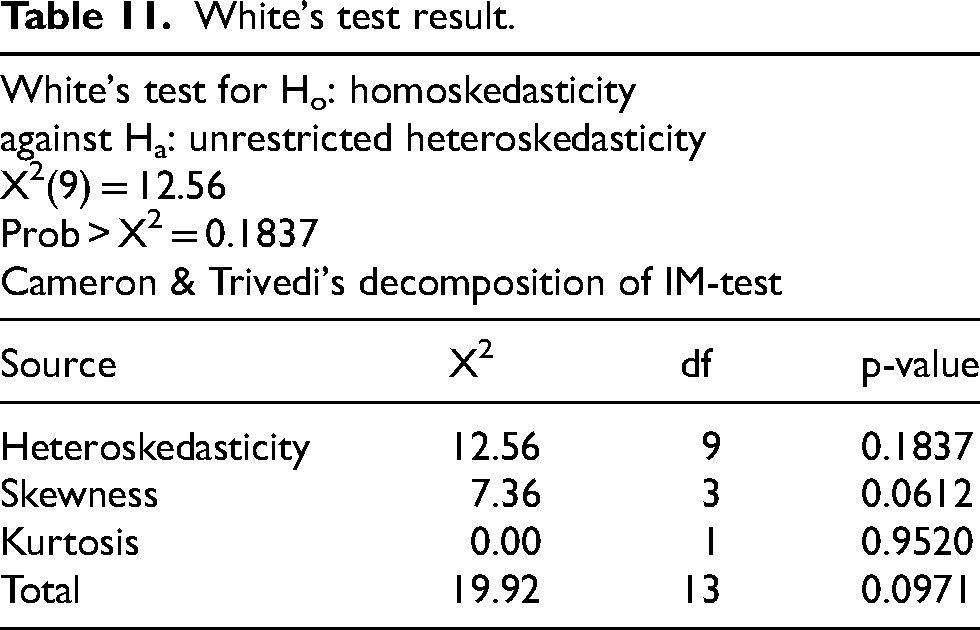
The skewness test gives a p-value value of 0.0612, which falls under the threshold limits; this seems to indicate that the residuals are mildly asymmetric. However, the kurtosis test has a p-value of 0.9520, implying no problems in the tail behavior. A chi-square value of 19.92 with 13 degrees of freedom and a p-value of 0.0971 supports the conclusion that there are no significant deviations from homoskedasticity.
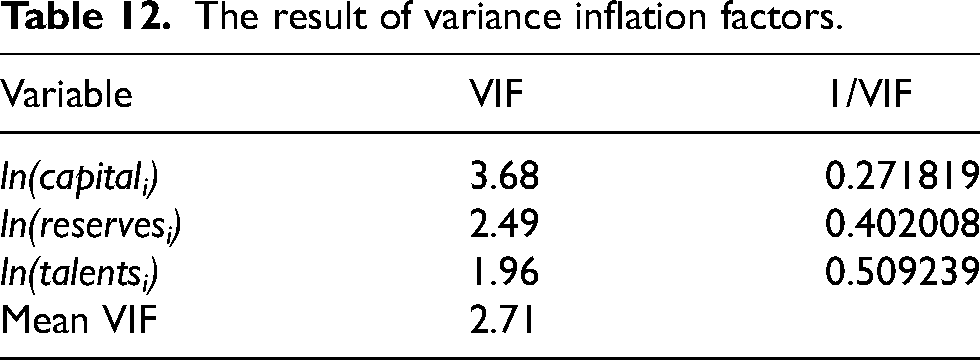
Multicollinearity test
The variance inflation factor (VIF) was employed in the study to evaluate the potential multicollinearity within the model. According to Equation (11), when the value of 
From Table 9, the value of
The result of variance inflation factors.
Structural equation modeling (SEM) assessment
Structural Equation Modeling (SEM) was used to analyze the relationships between customer satisfaction, insurance types, education levels, age groups, and channels of information leakage. The analysis ensured the model's reliability and validity while assessing overall goodness-of-fit measures and path coefficients.
Reliability and validity
The study assessed the reliability of the constructs using Cronbach's Alpha and Composite Reliability (CR). As presented in Table 13, the Cronbach's Alpha values for all variables exceed the acceptable threshold of 0.70, demonstrating strong internal consistency. Moreover, the Composite Reliability (CR) values for each variable surpass the recommended threshold of 0.70, further validating the reliability of the measurement scales. The Average Variance Extracted (AVE) was used to assess convergent validity, which determines whether items designed to measure the same construct are achieving that goal. The results in Table 13 indicate that the AVE values for all variables surpass the 0.50 threshold, meaning that the items in each construct explain more than 50% of the variance, demonstrating sufficient convergent validity.
Reliability, convergent, and discriminant validity of constructs.
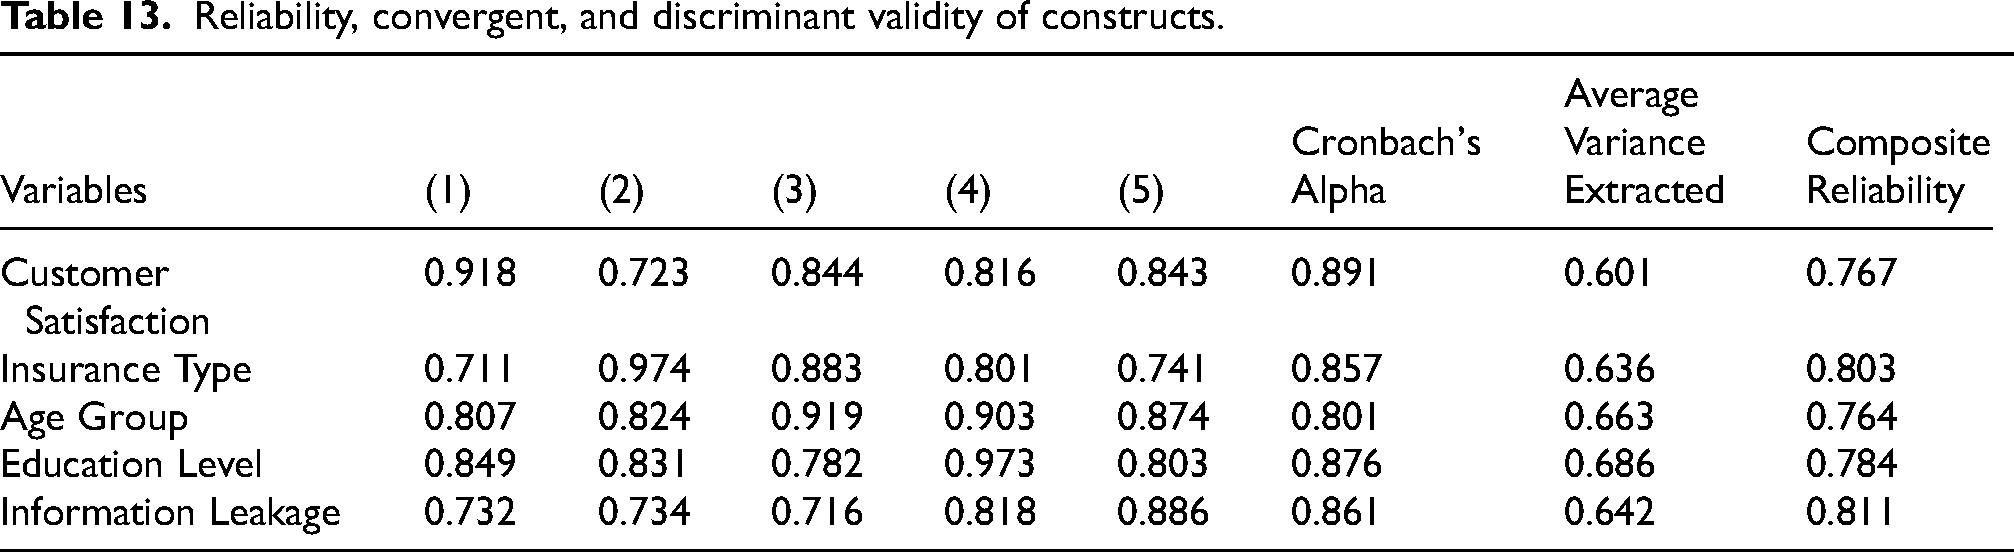
The Fornell-Larcker Criterion and the Heterotrait-Monotrait Ratio (HTMT) were employed to test discriminant validity. The findings demonstrate that, as reflected in the diagonal values of Table 13, the square root of the AVE for each construct is greater than its correlations with other constructs. This supports the establishment of discriminant validity, signifying that the constructs are sufficiently separate from each other. Overall, the measurement model adheres to the required standards for reliability, convergent validity, and discriminant validity.
Goodness-of-Fit measures
The model's fit indices suggest that it aligns well with the recommended values and the results obtained, indicating a good fit. With a Chi-squared/degree of freedom ratio of 3.562, which is under the recommended threshold of 5 (Marsh and Hocevar, 1985), the model demonstrates a good fit. With values of 0.912, 0.924, and 0.950 for the Tucker-Lewis Index (TLI), Comparative Fit Index (CFI), and Incremental Fit Index (IFI), respectively, all exceed the 0.90 threshold, indicating a highly favorable model fit (Hu and Bentler, 1999; Olmstead and Bentler, 1992). The Goodness of Fit (GFI) value of 0.874 and the Adjusted Goodness of Fit (AGFI) value of 0.911 exceed the recommended thresholds, providing additional evidence of the model's suitability (Anderson and Gerbing, 1984; Hair, 2011). With values of 0.076 for the Root Mean Square Residual (RMR) and 0.079 for the Standardized Root Mean Square Residual (SRMR), both falling under the 0.08 threshold, the model demonstrates a good fit (Chen et al., 2008; Hu and Bentler, 1999). Finally, the Root Mean Square Error of Approximation (RMSEA) value of 0.043 is below the recommended threshold of 0.05, indicating that the model closely fits the data (Byrne, 2013). In summary, the fit indices indicate that the model accurately represents the data, reinforcing its validity for further analysis.
Path analysis
Table 14 presents the outcomes of the route coefficients and hypothesis testing, analyzing the correlations among different parameters and customer satisfaction. The findings show that the level of education significantly enhances customer satisfaction, indicated by a path coefficient of 0.436 and a p-value of 0.0009, which is statistically significant. The findings suggest that individuals with higher education levels generally report greater satisfaction with insurance services. With a t-value of 22.456, the robustness of this connection is further validated, suggesting that the influence of education level on customer satisfaction is both considerable and statistically sound. Similarly, age group plays an important role in shaping customer satisfaction, with a path coefficient of 0.458 and a p-value of 0.0078 indicating statistical significance. This implies that the satisfaction levels vary among different age groups, with age-related factors like experience and expectations potentially affecting how customers perceive their interactions with insurance providers. Additionally, the findings show that the type of insurance has a considerable positive effect on customer satisfaction, as indicated by a path coefficient of 0.488 and a p-value of 0.0291. This indicates that the type of insurance policy a customer holds may shape their overall satisfaction, with particular policies being perceived as more fulfilling based on their features or advantages.
Path coefficients and hypothesis testing.
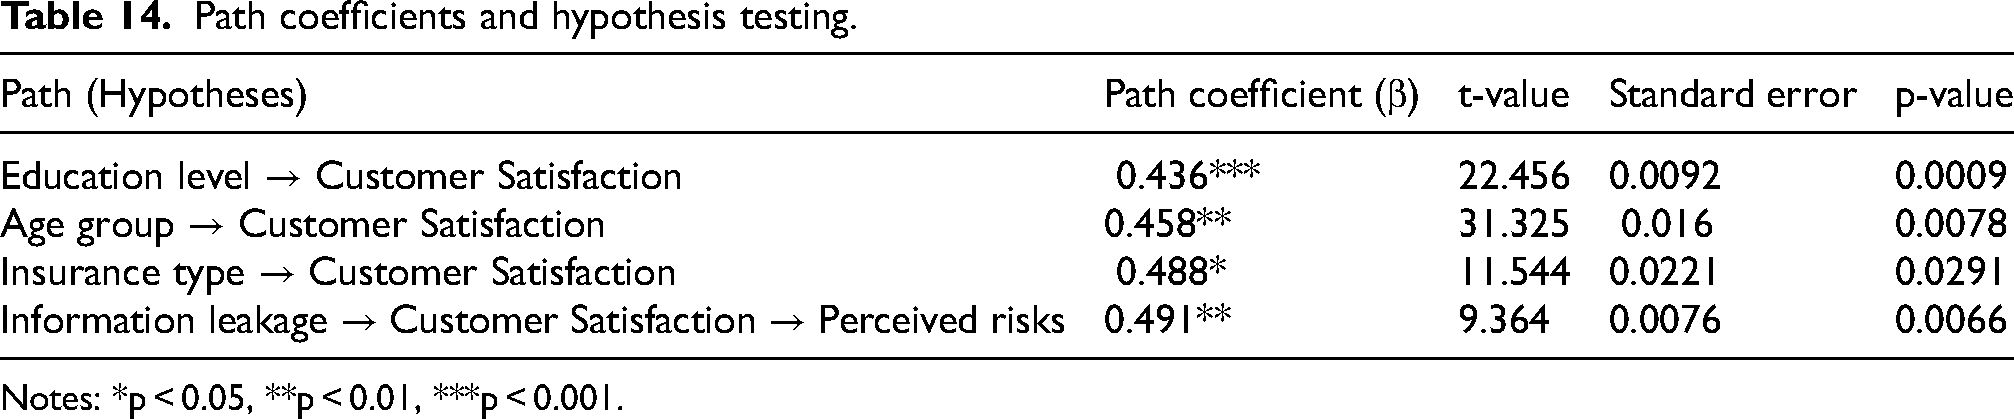
Notes: *p < 0.05, **p < 0.01, ***p < 0.001.
Finally, the relationship between information leakage and customer satisfaction, mediated by perceived risks, also demonstrates significance. The path coefficient of 0.491, accompanied by a p-value of 0.0066, signifies that apprehensions regarding the protection of personal information directly influence the perceived dangers related to insurance businesses. This perception of risk, in turn, influences customer satisfaction. The results highlight the importance of managing information security and mitigating risks in maintaining high customer satisfaction levels. All paths in the table are statistically significant, reinforcing the importance of these factors in shaping customer perceptions and satisfaction in the insurance industry.
Discussion
In the digital age, to maintain concern towards data privacy, it becomes critically important to understand customer satisfaction with information security measures in terms of sustaining trust and loyalty. Corporate security practices, as a variable, were analyzed for being a part of this investigation under the umbrella of customer awareness and perceptions toward the management of information security. Safeguarding personal information has become increasingly critical in the digital age, especially in industries that handle sensitive data, such as insurance. This study explores customers’ satisfaction regarding personal information security management in China's insurance sector, which aims to assess how well these companies protect customer data and meet their privacy expectations. As the incidence of data breaches and information leaks is increasing, the analysis of customer perceptions and satisfaction levels not only offers an insight into the industry's current performance but also draws attention to areas for improvement in building trust and compliance with data security regulations.
Li et al. (2021) observed that the intersection of service quality and security attributes influences customer satisfaction in banking, particularly among more informed consumers. On the other hand, less educated customers need much simpler processes and clearer communications and hence require more straightforward service structures. This aligns with present findings that customers with higher educational attainment display a more discerning approach toward the assessment of insurance services, which mainly focuses on technical aspects such as inclusions in policies, data safety, and benefits. The insights were that the insurance provider must consider diversity in terms of education through designing tiered communication strategies and product simplification. Age-related differences in satisfaction levels highlight generational preferences for service design and delivery. Younger customers are concerned with flexibility, digital access, and interactive customer support, which are now part of service quality as shown in Loan (2023). Older age groups, however, tend to focus on reliability and comprehensive coverage, which is aligned with the traditional service models. This is supported by Tiwari et al. (2021), which indicates that younger populations tend to trust digital platforms more when these systems are secure and user-centric, whereas older people are more careful and appreciate transparency. These results challenge insurance companies to adopt a dual-channel approach that combines digital innovation with traditional touch points to meet the needs of multiple generations. Satisfaction variances among the firms correlate with service consistency, new feature offerings, and safe data handling practices. Electronic management systems improve customers’ experiences, making Alharbi et al. (2024) differentiate the services of companies from those of competitors in markets. Customers view companies that integrate modern technology and strong data privacy measures as more trustworthy. Likewise, Delso-Vicente et al. (2025) reveal that risk management and experiences that cater to customers at organizational levels directly impact satisfaction. This reveals the need to benchmark performance in services among insurance service providers and continually improve the services by utilizing consumer feedback. The risk of a leak of information differs very much among digital and non-digital media. Digital channels, though easy to use, are more vulnerable to breaches, and thus, the practice of data protection becomes a concern. Ofori et al. (2022) emphasized that robust organizational policies and compliance behaviors are essential to mitigate security risks. Furthermore, Da Veiga et al. (2020) emphasized the essential need of cultivating an organizational culture focused on information security to safeguard consumer data successfully. Customers are more satisfied if their perceptions of a company's security measures are trustworthy and adaptive, implying a strong relation between data security practices and overall satisfaction. It is only through multi-layered cybersecurity systems and transparent data usage policies that the risk factors will be reduced and trust built in the long term. These findings suggest that the principal factors for customer satisfaction are educational diversity, generational differences, competitive practices among insurance companies, and secure data management systems.
This study considerably enhances the current research by examining consumer satisfaction about personal information security management in insurance businesses, a domain that has been inadequately investigated in previous studies. Unlike earlier research that often focused on broad customer satisfaction factors, such as service quality (Li et al., 2021) or digital transformation (Alharbi et al., 2024), this study narrows its scope to personal information security, a critical concern in today's data-driven environment. It bridges this gap by exploring how insurance types, customer demographics in education and age, and corporate practices are related to satisfaction, revealing granular information that had not been known before. For example, the research uniquely explores how educational diversity impacts satisfaction with the different insurance types, thus moving from general correlations to actionable specifics to tailor the services. Furthermore, the study addresses the leakage of information across various channels, which has been a subject that has not been sufficiently addressed in previous studies. The studies by Ofori et al. (2022) and Da Veiga et al. (2020) examined organizational policies and cultural dimensions of information security, yet they overlooked the impact of specific channels, such as digital versus traditional methods, on customer satisfaction disparities. This research contributes by finding subtle differences in perceived data security risk across these channels and connecting these perceptions directly to customer satisfaction. These findings enable insurance companies to know where and how to strategically prioritize and enhance data security measures that will have the most impact on fostering trust and loyalty in a competitive market.
Theoretical implication
This study enhances the theoretical comprehension of customer satisfaction in the insurance sector by integrating the KAB Model, the Technology Acceptance Model (TAM), and Channel Risk Theory. The KAB model emphasizes how awareness and attitudes toward information security shape satisfaction behaviors, offering insights into educational and age-related differences. TAM focused on the adoption of technology-enabled insurance services, highlighting the role of perceived security in adopting digital insurance platforms. Channel Risk Theory gives a framework for analyzing disparities in satisfaction due to the risk of information leakage across communication and service delivery channels. The study connects these theories to advance the discourse on how customer satisfaction in insurance intersects with technology, demographics, and organizational practices in the context of information security.
Practical implication
This study's results can offer insurance businesses insights for enhancing client happiness via data security. The differentiating strategy on educational levels and age groups can improve satisfaction by ensuring that various demographics have optimized satisfaction. Trust can be enhanced by giving data protection policies to the specific vulnerabilities of the service channels, which could either be digital or traditional. Through minimizing information leakage and strengthening security protocols, insurers can build more customer loyalty. Additionally, knowledge of variations in satisfaction levels for different types of insurance and providers helps tailor services to deliver a competitive advantage and retain customers over the long term.
Limitation
This study focused on the analysis of customer satisfaction in terms of the personal information security management that exists within the insurance sector in China. However, this study did not highlight important aspects. The analysis only covered a specific geographical area, which may not present a complete representation of the customer satisfaction patterns and the issues of information security in other regions or countries. The research focused on customer-related issues but overlooked the organizational dynamics that might impact information security management, including employee behavior, internal security policies, and technological infrastructure. This research study's reliance on data from 2020 could limit the applicability of its findings to changing customer preferences and technological advancements. Besides, other macroeconomic factors such as inflation or economic downturns may impact both customer satisfaction and corporate information security management, which was not analyzed in detail. In the future research, addressing such limitations would give a better understanding of information security management and customer satisfaction in the insurance sector.
Future scope
This study acknowledges certain limitations that give avenues for future research. A low sample size of customers and insurance companies, together with the restricted data collection period in 2020 resulted in lower explanatory power of the ANOVA analysis. This might lead to future research with large-scale samples of both customers and insurance companies to conduct a thorough analysis and additional factors including corporate financial indicators and structure of employees influencing customer satisfaction. The statistical approaches employed in this study might also be applied to other sectors, such as travel and activities like sports, which exhibit both similarities and variations in service quality across many operational domains. In addition, the effect of macroeconomic factors on the information management of a company may be researched, since it is strongly related to information security. For example, research on how macroeconomic factors like inflation, changes in GDP, and pandemics, such as COVID-19, affect a firm's information security management as well as people's awareness in this area can be considered very valuable.
Conclusion
This study underscores the critical importance of information security management in influencing client satisfaction in the insurance industry. The results indicate that, in addition to overall service quality, customer happiness is markedly affected by the robustness and efficacy of security measures employed by insurance companies. Trust in data protection and privacy assurance emerged as critical factors driving customer confidence and long-term engagement with insurance services. The study further reveals that customers perceive varying levels of risk across different service delivery channels, underscoring the need for insurance firms to adopt a multi-layered security approach tailored to different interaction modes. Additionally, demographic factors such as age, education level, and digital proficiency influence how customers evaluate security measures and perceive their overall satisfaction with insurance services. This study employs the Knowledge-Attitude-Behavior (KAB) Model, Technology Acceptance Model (TAM), and Channel Risk Theory to elucidate how consumers’ awareness, perceptions of technology security features, and risk assessments influence their happiness. The results confirm that increased knowledge about security mechanisms and the ease of adopting digital security tools positively influence customer trust and satisfaction levels. This research enhances the comprehension of the intricate link between information security management and customer satisfaction within the insurance industry. It establishes that well-implemented security measures, transparency in data handling, and customer-centric security policies play a decisive role in ensuring positive customer experiences. These results underscore the necessity of including security as an essential element of service quality, enabling insurance companies to cultivate more robust, trust-based relationships with their customers.
Furthermore, the ethical dimensions of AI-driven security systems in financial services can be explored, assessing their implications for privacy, customer autonomy, and regulatory compliance. As artificial intelligence continues to evolve, its integration into fraud detection, automated claims processing, and risk assessment presents opportunities and ethical challenges requiring deeper investigation. Understanding how customers perceive AI-based decision-making in insurance security protocols will be crucial in balancing efficiency with fairness and transparency. Additionally, the intersection of quantum computing and cybersecurity introduces an exciting research avenue that could redefine encryption standards and risk mitigation strategies in the insurance industry. Quantum-resistant cryptographic techniques could address vulnerabilities in current encryption protocols, providing unprecedented levels of security for sensitive customer data. As the field of quantum computing advances, insurance firms will need to explore its implications for securing policyholder information against emerging cyber threats. Another compelling direction is the impact of decentralized finance (DeFi) and blockchain-based insurance models, which have the potential to transform traditional risk management frameworks. Blockchain technology can enhance transparency, streamline claims processing, and minimize fraudulent activities by providing immutable records of transactions. Smart contracts can automate policy execution, ensuring that claims are processed efficiently without intermediaries. However, regulatory challenges and adoption barriers remain critical aspects that future research must address to understand the feasibility and scalability of blockchain-based insurance ecosystems. By exploring these new areas, future studies can build on the fundamental knowledge this study offered, opening the door to creative security solutions and a more robust insurance market.
Supplemental Material
sj-docx-1-idv-10.1177_02666669251333395 - Supplemental material for Understanding satisfaction in information security management: An integrated study of corporate practices and demographic factors in China's insurance sector
Supplemental material, sj-docx-1-idv-10.1177_02666669251333395 for Understanding satisfaction in information security management: An integrated study of corporate practices and demographic factors in China's insurance sector by Changzhou Liang, Xiaohua Zeng, Haohong Zhang and Yanling Huang in Information Development
Footnotes
Availability of data and material
The data that support the findings of this study are available from the corresponding author upon reasonable request.
Declaration of Conflicting Interests
The authors declared no potential conflicts of interest with respect to the research, authorship, and/or publication of this article.
Funding
The authors received no financial support for the research, authorship and/or publication of this article.
Human and animal rights
This article includes studies involving human or animal subjects conducted by the authors.
Informed consent
Informed consent was obtained from all individual participants included in the study.
Supplemental material
Supplemental material for this article is available online.
About the authors
References
Supplementary Material
Please find the following supplemental material available below.
For Open Access articles published under a Creative Commons License, all supplemental material carries the same license as the article it is associated with.
For non-Open Access articles published, all supplemental material carries a non-exclusive license, and permission requests for re-use of supplemental material or any part of supplemental material shall be sent directly to the copyright owner as specified in the copyright notice associated with the article.