
Abstract
The steel Q345 is extensively used in pressure vessels with low and medium pressure because of good mechanical properties and low cost. Good resistance to sulfide stress cracking (SSC) is required for the pressure vessel steel, but the SSC behavior of the Q345 has received little attention. This work investigated the SSC behavior of the Q345 in a wet H2S environment. The microstructure contained the irregular various-sized polygonal-like ferrite grains plus a carbon-rich degenerate pearlite banded structure. The Q345 had high ductility but failed to pass the SSC tests. The SSC cracking involved hydrogen embrittlement. The SSC preferentially occurred at the carbon-rich degenerate pearlite banded structure. The elimination of the carbon-rich degenerate pearlite banded structure is necessary to improve the SSC resistance of the Q345 pressure vessel steel.
Introduction
Pressure vessel steel refers to a type of professional steel with special requirements used in the manufacture of the pressure vessels for the petroleum industry, the chemical industry, gas separation, gas storage and gas transportation, and has important applications in many areas such as the petrochemical industry, the energy industry, scientific research and the military.1,2 The service conditions of the pressure vessel steel can be harsh for the pressure vessels used to separate, store and transport the oil and natural gas that contains H2S gas and acidic media. Sulfide stress cracking (SSC) failure can result in serious consequences. Therefore, good resistance to the SSC is desirable for pressure vessel steel. The steel Q345 (yield strength ≥345 MPa, ultimate tensile strength ≥470 MPa) is a standardised low carbon, low alloy, medium tensile strength steel available in China that is produced using hot rolling.3,4 The Q345 is a 16Mn steel grade and has mechanical properties and chemical compositions similar to those of ASTM A572 steel (yield strength ≥345 MPa, ultimate tensile strength ≥450 MPa). The Q345 is extensively used to produce pressure vessels with low and medium pressure in China because of its good mechanical properties and low cost. 5
Many studies have investigated the microstructure, thermal deformation behavior, mechanical properties, fatigue performance and corrosion resistance of the Q345,5–10 but few studies have investigated its SSC behavior. The SSC failure of steels has been identified as often occurring at hydrogen congregation sites. Micro zones in microstructure eventually become major trap sites for hydrogen atoms, leading to the exacerbation of the cracks at critical levels. In general, chemical compositions and microstructures have important influences on the SSC behavior of the steel. These are the main variables of the steel itself that can be optimised during the steel production to improve the SSC resistance.11,12 These two variables are not independent. A change in the chemical compositions may change the microstructures, even though the chemical compositions are still within the standard composition limits of the steel. For example, carbides forming elements such as V, Mo and Nb can combine with C to form alloy carbides. Mn can easily combine with S to form MnS inclusions. The evolution of these microstructure characteristics affected by alloy compositions has a significant influence on the SSC behavior of the steel.13,14 The Q345 steel currently used and studied had been usually optimised for its chemical compositions during steel production to improve the SSC resistance, but practical service experience has indicated that the Q345 pressure vessel steel in the wet H2S environments might experience SSC failure. To the best of our knowledge, no prior work has specifically studied the SSC of the Q345, and the details of the factors and mechanism influencing its SSC are not yet clarified. However, the wide industrial production and engineering application of the Q345 require an understanding of its SSC resistance in the wet H2S environments and how these behaviors are affected by the microstructure.
The present work investigated the SSC of a commercial Q345 pressure vessel steel, and analysed the details of the factors and mechanisms influencing the SSC of the Q345 in a wet H2S environment. This should also in turn help to better design production processing of the SSC resistant Q345 pressure vessel steel.
Experimental procedure
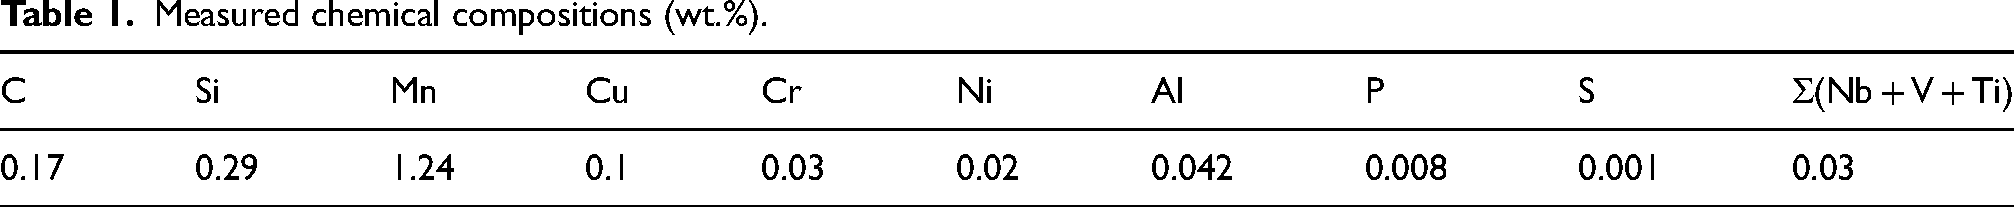
The experimental steel was a commercial Q345 pressure vessel steel with hot-rolled plate thickness of 10 mm, and was provided by Xiangtan Iron & Steel Co., Ltd. of Hunan Valin, China. Table 1 lists its measured chemical compositions.
Measured chemical compositions (wt.%).
The ingots were heated at 1180 °C for 120 min and hot rolled to 10 mm thick plates using a two-stage controlled rolling process. The first stage rolling was in the recrystallised austenite region at a higher temperature and the second stage rolling was in the non-recrystallised austenite region at a lower temperature range above Ar3. The hot-rolled plate was immediately cooled at a cooling rate of ∼5 °C/s to room temperature.
The microstructural characteristics of the specimens were characterised using an optical microscope (OM), a scanning electron microscope (SEM), a transmission electron microscope (TEM) and electron backscattered diffraction (EBSD). The specimens for the OM and SEM characterisation were mechanically ground, polished, and then etched in a 2-pct nital solution. Tensile tests were conducted at room temperature with a cross-head speed of 5 mm/min in a Schenck-100KN servo-hydraulic machine. The fracture morphologies of the samples after the tensile test were characterised using the SEM.
The SSC evaluation was conducted using the uniaxial constant load test according to the NACE TM 0177-2005 Method A. The specimens had a 6.35 mm gauge diameter and a 25.4 mm gauge length. The specimen, with an applied uniaxial tensile stress of 293 MPa (i.e., 85% of the nominal yield strength of 345 MPa), was immersed in the solution A saturated with 0.1 MPa H2S at room temperature. The solution A consisted of an acidified aqueous solution containing 50 g/L NaCl and 5 g/L of CH3COOH with an initial pH value of ∼2.7. The SSC evaluation was performed through a set of three test specimens that were loaded to the selected applied stress to measure the failure time. The termination of the SSC test should be at the test specimen failure or after 720 h, whichever occurred first. If the failure did not occur until 720 h, the test specimen was considered to pass the SSC test. If either of the three test specimens did not pass the SSC test, the steel failed to pass the SSC test. After the SSC test, each specimen was ultrasonically cleaned using acetone. The morphologies of the specimens after the SSC test were characterised using a digital camera, OM and SEM.
Results
Microstructure and mechanical property
Figure 1(a) shows a typical optical micrograph. The microstructure was not very uniform, and was characterised by irregular various-sized polygonal-like ferrite grains plus faintly visible slightly dark banded structures. Figure 1(b) shows a typical SEM micrograph. The grey regions corresponded to the ferrite matrix, and the white regions corresponded to the second-phase carbides in the SEM micrographs. Many carbides were randomly distributed in the banded structures. The compositions of Points A and B in Figure 1(b), evaluated using the Energy dispersive X-ray spectroscopy (EDS) spectra, are listed in Table 2. Point A represented a site in the ferrite matrix, and Point B represented a site in the banded structures. Point A mainly contained Fe, 2.7 wt.% Mn and ∼1.2 wt.% C, and Point B mainly contained Fe, ∼2.1 wt.% Mn and ∼5.8 wt.% C.

(a) Optical micrograph; (b) SEM micrograph.
EDS compositions of Points A and B in Figure 1(b) (wt.%).
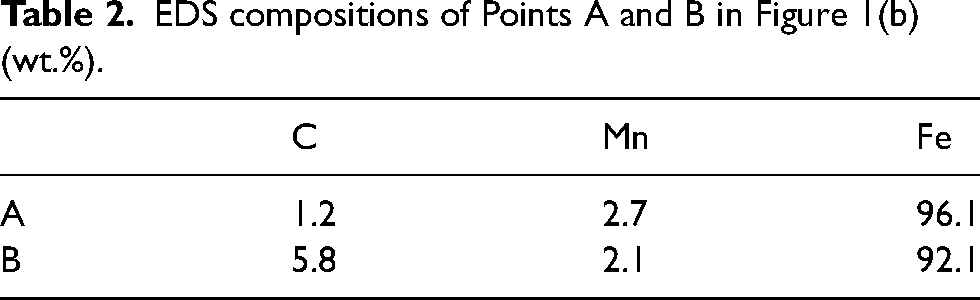
Figure 2 shows the SEM-EDS results. The corresponding X-ray maps for the elements, C, Mn, Fe of Figure 2(a), were exhibited in Figure 2(b), (c) and (d), respectively. The X-ray map of carbon showed purple and was mostly distributed along the banded structures. Combined with the above, the carbon was enriched in the banded structures.

SEM-EDS results: (a) SEM image, and (b, c, d) X-ray maps of the elements, C, Mn, Fe, respectively.
Figure 3 shows inverse pole figure (IPF) and grain boundary figure obtained from EBSD data. In the IPF map as shown in Figure 3(a), different grain orientations showed different colours, and the colour difference of adjacent grains reflected their orientation difference. Red represented the grain orientation of <001> direction, green represented the grain orientation of <101> direction, and blue represented the grain orientation of <111> direction, respectively. The IPF map indicated that there was no obvious preferred orientation. A misorientation of more than 15° was defined as high-angle grain boundary, while a misorientation from 1° to 15° was defined as low-angle grain boundary. There were essentially no grain boundaries with a misorientation less than 1°. The grains with low-angle grain boundaries were not, strictly speaking, grains, but sub-grains or sub-structures. In grain boundary figure delineated by a misorientation of 15° as shown in Figure 3(b), there presented a zonal distribution of some finer-sized grains, which had similar appearance and morphology with faintly visible slightly dark banded structures as shown in Figure 3(a). This indicated that the finer-sized grains located in banded structures with numerous carbides. The mechanism of the fine grain appearance should be related to the carbides in banded structures, which could inhibit grain growth during hot rolling.

EBSD-characterised map. (a) inverse pole figure (IPF). (b) grain boundary figure.
Figure 4 shows the engineering tensile stress-strain curve at room temperature (Figure 4(a)) and the SEM tensile fracture morphology (Figure 4(b)). The engineering tensile stress-strain curve had the typical tensile characteristics of low carbon steels, exhibiting an evident yield point as shown Figure 4(a). There was initially a linear elastic region, and then a slope change to undergo plastic deformation. The flow stress increased rapidly and the strain hardened rapidly in the initial elastic deformation stage, followed by a relatively lower strain hardening plastic deformation. The yield phenomenon occurred, followed by a quasi-steady state deformation with the relatively lower strain hardening, that is, the uniform deformation stage, where the stress gradually increased. After the maximum stress was achieved, the stress gradually decreased until fracture occurred. The tensile properties including the yield strength (YS), the ultimate tensile strength (UTS), and the elongation (EL) from Figure 4(a) were a YS of ∼380 MPa, a UTS of ∼490 MPa, and an EL of ∼29%. The appearance of the tensile test specimen, recorded with a digital camera after the room temperature tensile test, was also shown in Figure 4(a). There was much necking, which meant a high ductility. 15 This was consistent with the nominal engineering stress-strain curve. The SEM tensile fracture morphologies at room temperature exhibited typical dimple fracture, illustrating clear ductile dimples characteristics of microvoid coalescence as shown in Figure 4(b). This fracture characteristic substantiated that ductile fracture occurred as the tensile test was conducted at the room temperature, well reflecting its high ductility.
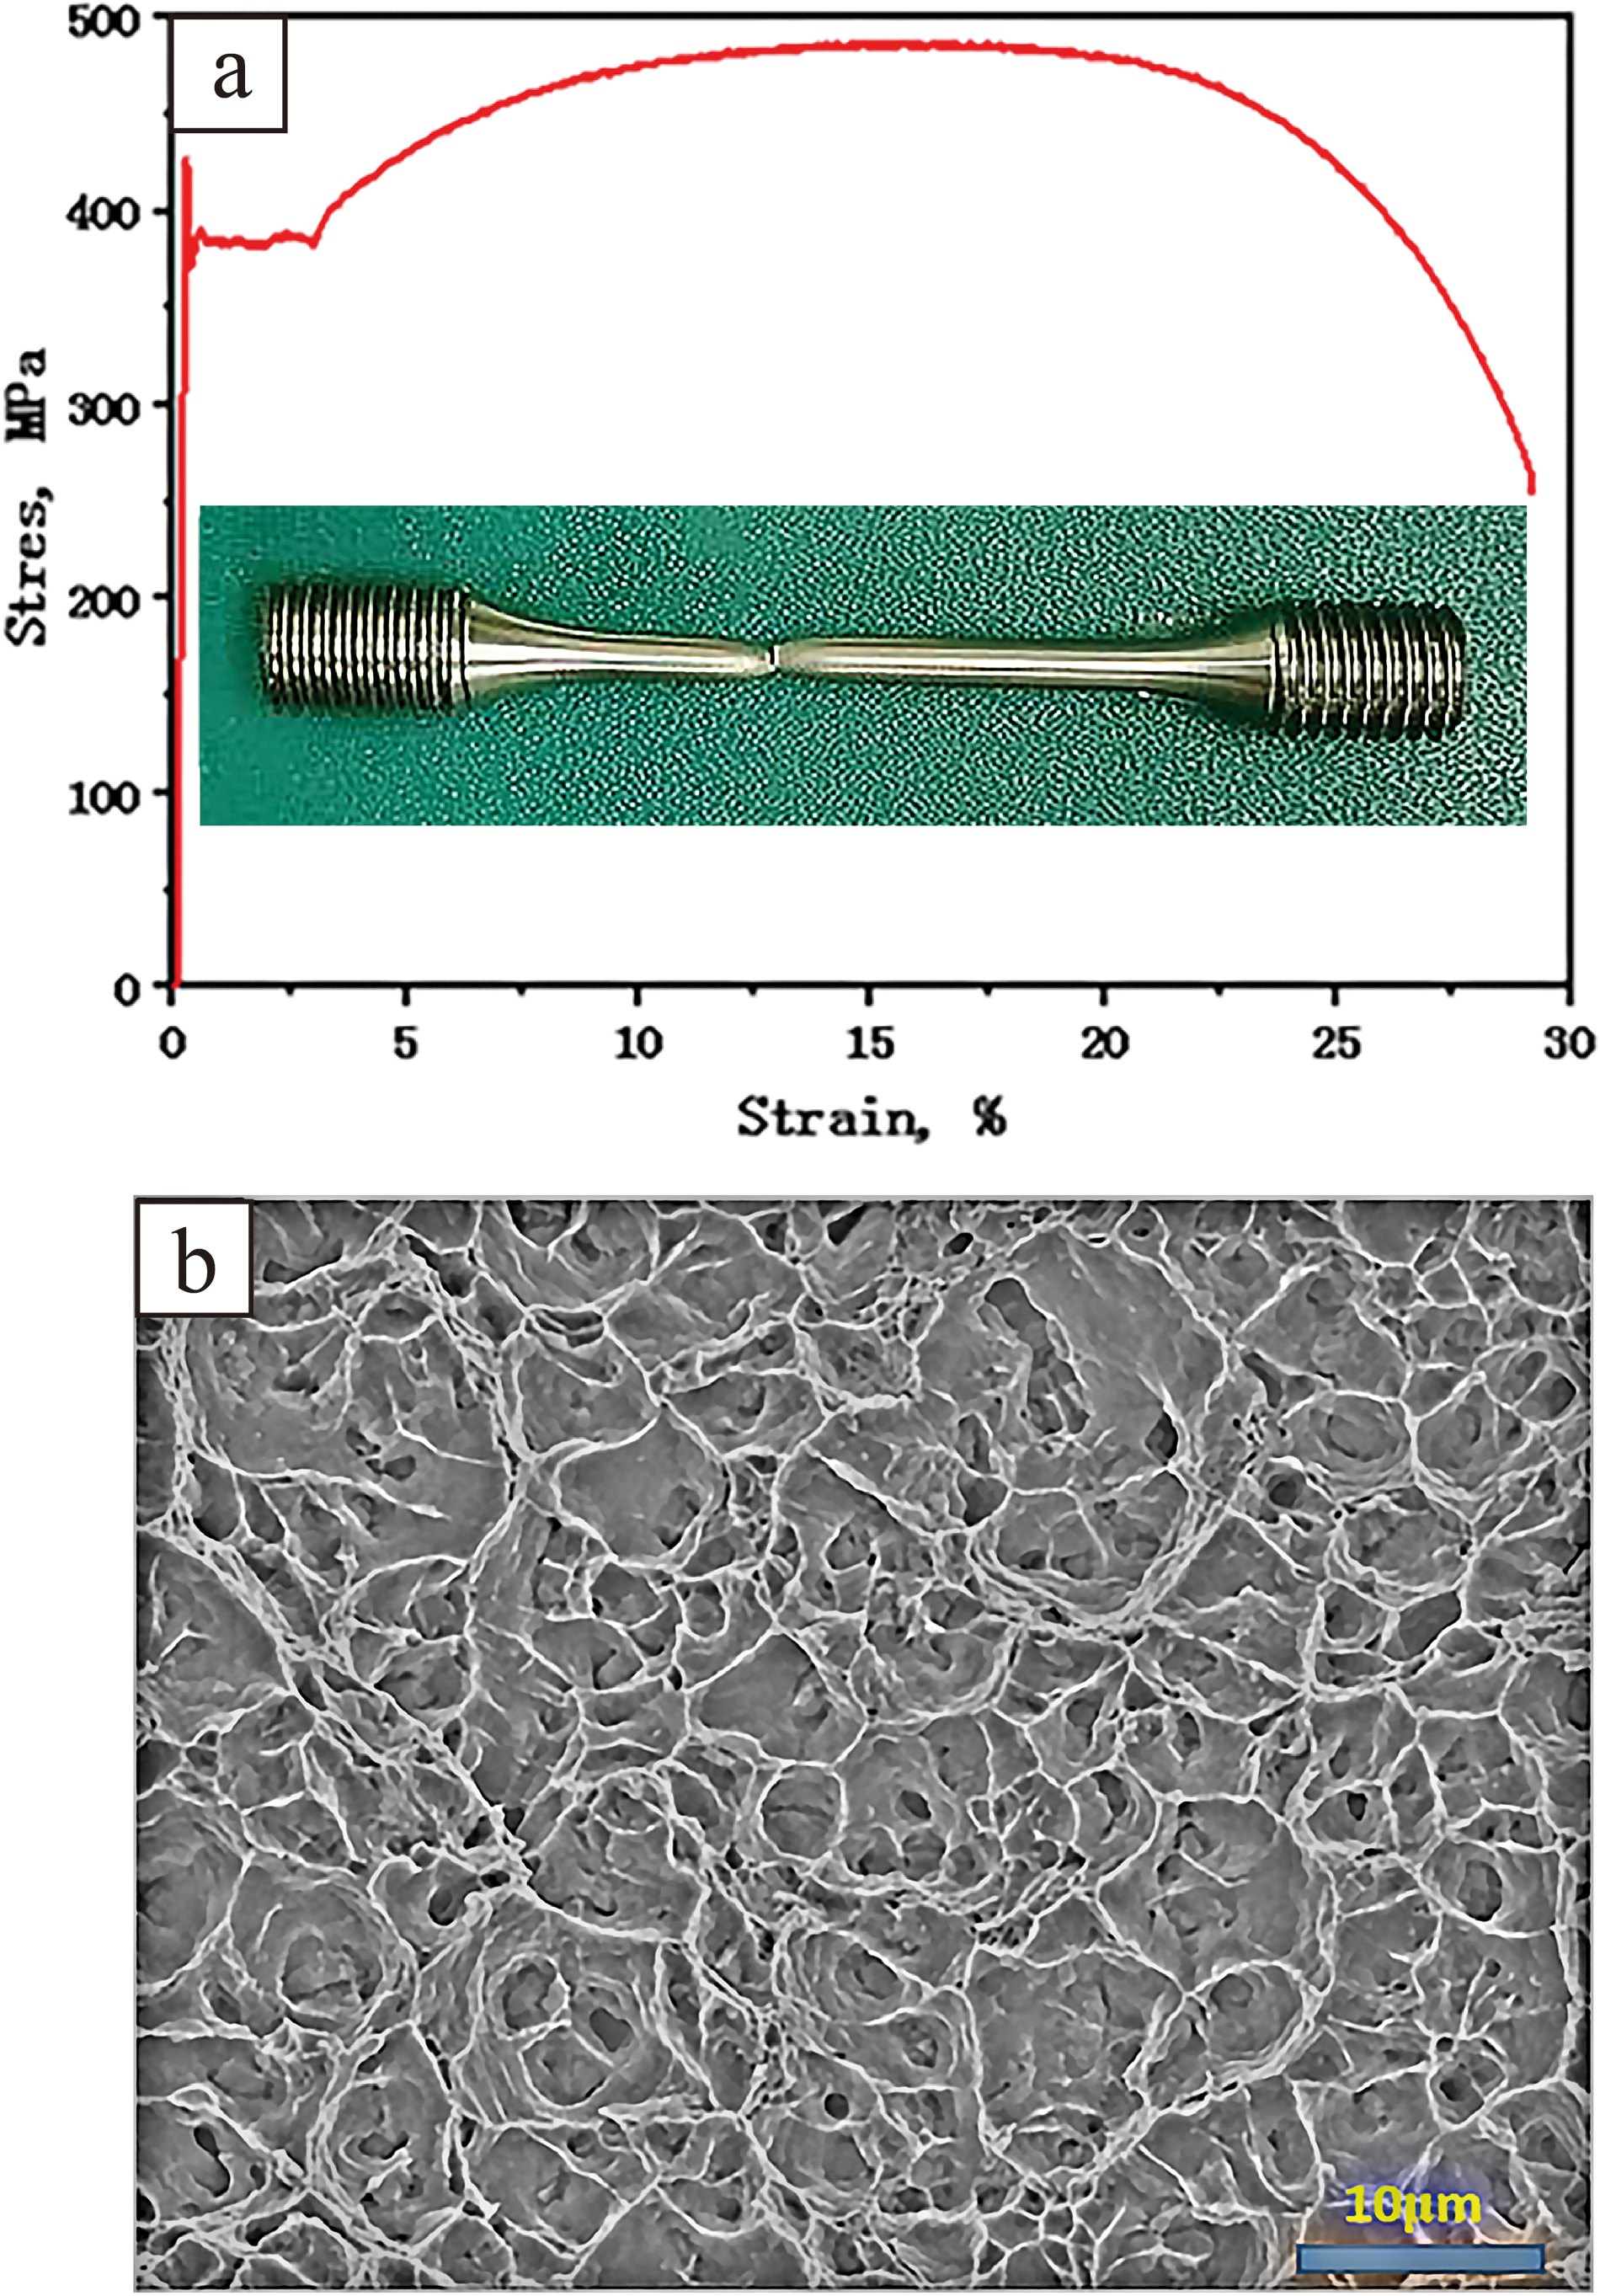
(a) Engineering tensile stress-strain curve at room temperature; (b) SEM tensile fracture morphology at room temperature.
SSC behaviour
Figure 5 shows the appearances of the SSC test specimens that was recorded with a digital camera or low magnification OM after the SSC test. Two of the three SSC test specimens broke completely, whose failure time was 426 and 435 h, respectively, and the other one had many micro-cracks on the surface although it did not break completely (Figure 5(a)). As a consequence there was a resulting SSC failure, that is, the SSC test specimens did not pass the SSC tests. There were the hydrogen blisters and the micro-cracks on the surface of the SSC test specimens (Figure 5(b)). A blister image at higher magnification was also embedded in Figure 5(b). The broken fracture appearances were uneven, having a layered characteristic, and the un-cleaned fracture was entirely covered with brown and yellow corrosion products (Figure 5(c)), which might be caused by the corrosion of the fracture surface during and after the SSC tests.
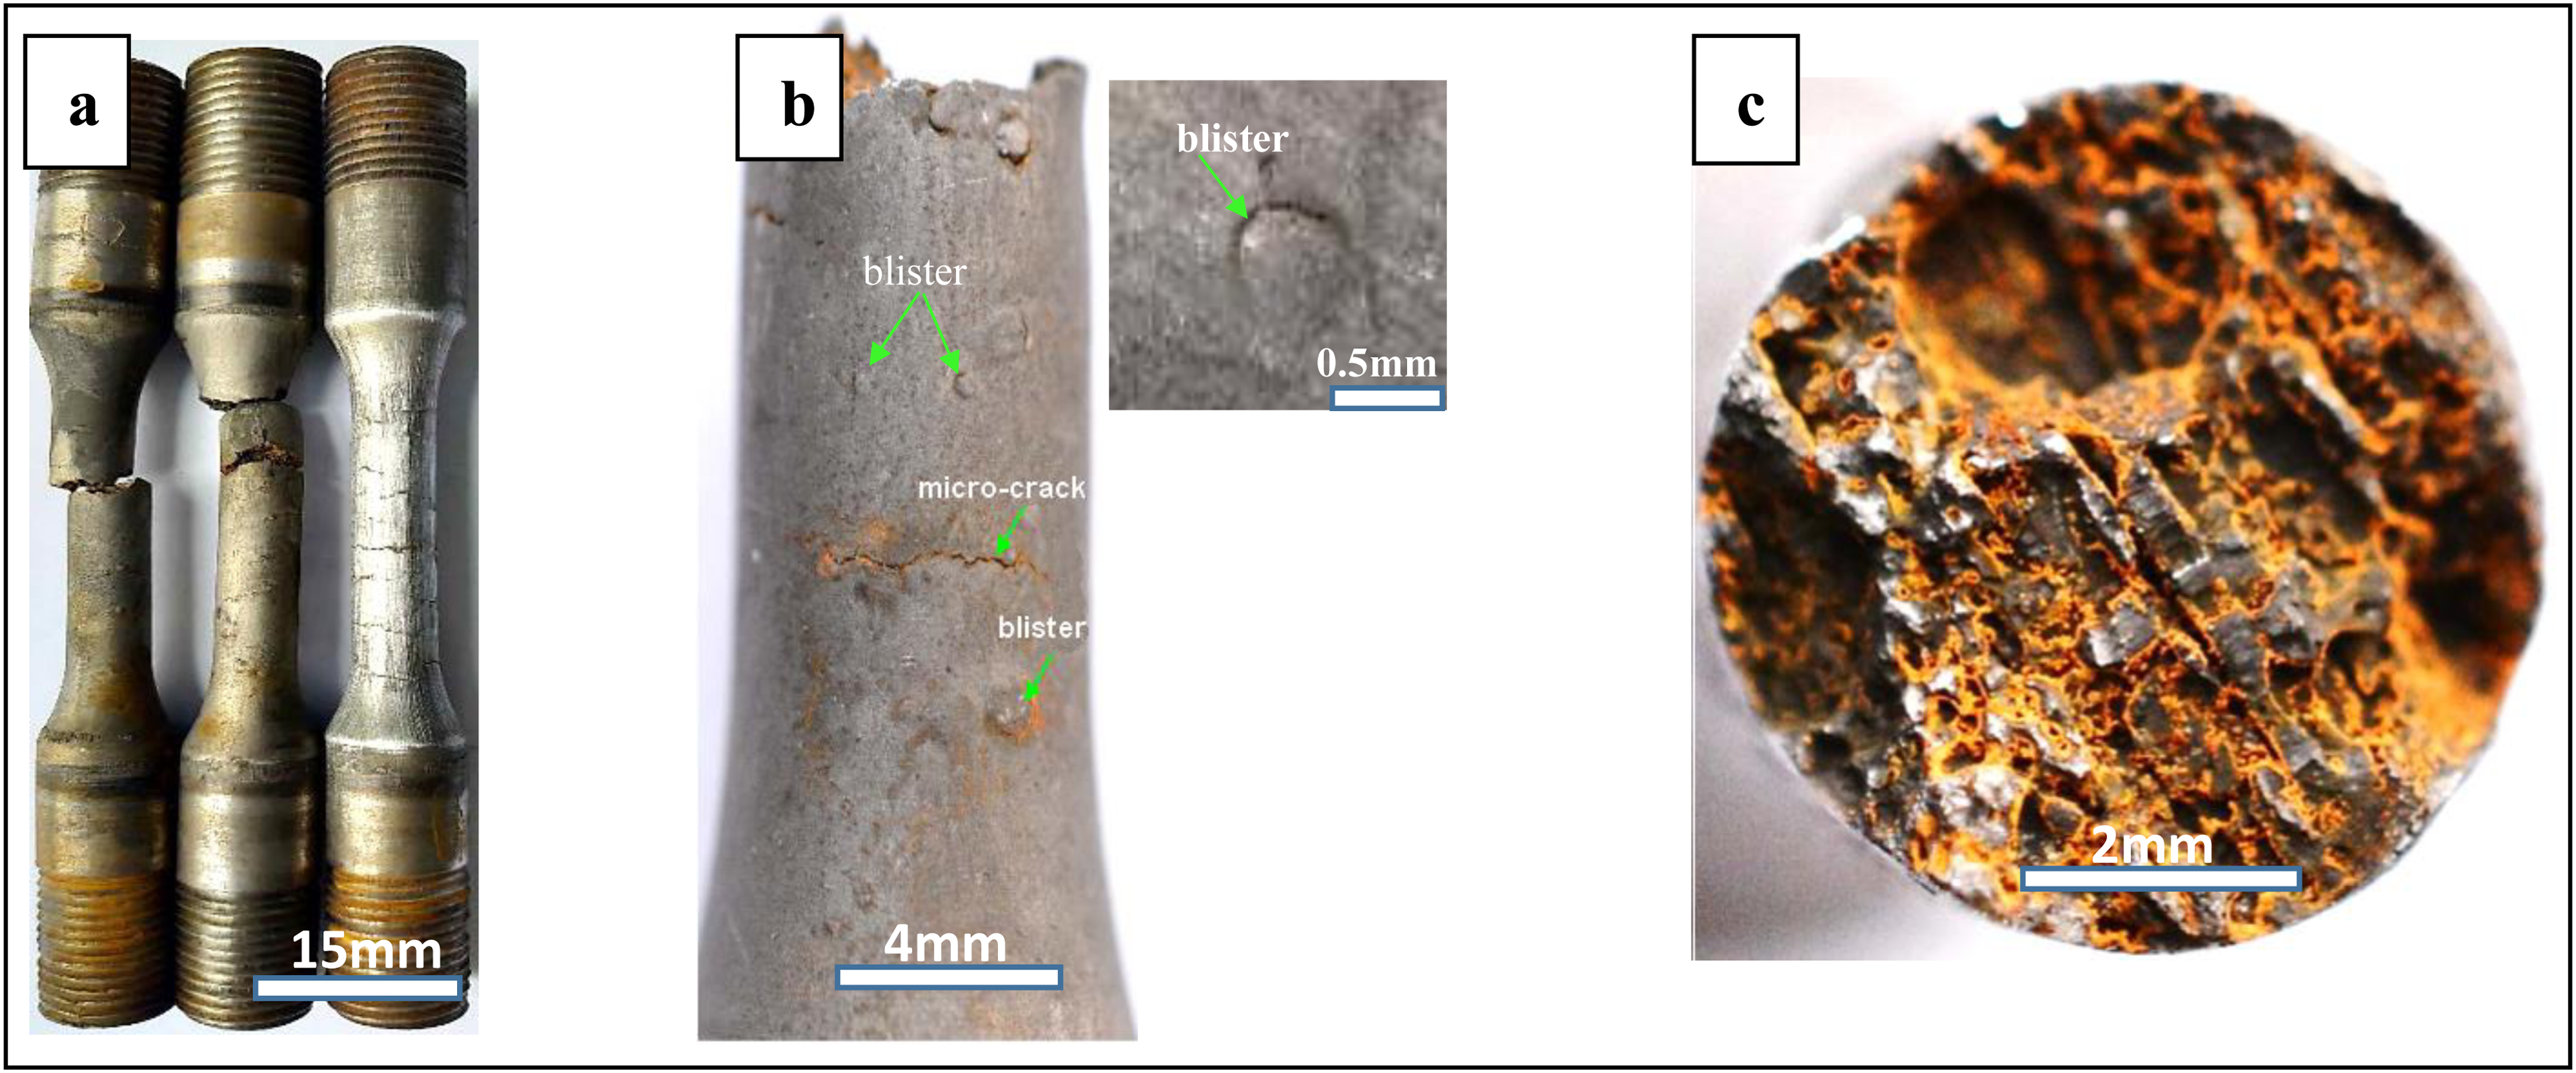
Appearances of the SSC test specimens. (a) macro-appearance. (b) hydrogen blisters and micro-cracks. (c) broken fracture.
Figure 6 shows the cleaned SEM fracture morphologies of the cracked SSC test specimens. The fracture was characterised by uneven layered features. There presented crystal-like products in the interlayer gaps (Figure 6(a)). The EDS spectra indicated that those crystal-like products mainly contained Fe and S (Figure 6(b)), and hence they were recognised as FeS, which was caused by the corrosion reaction:
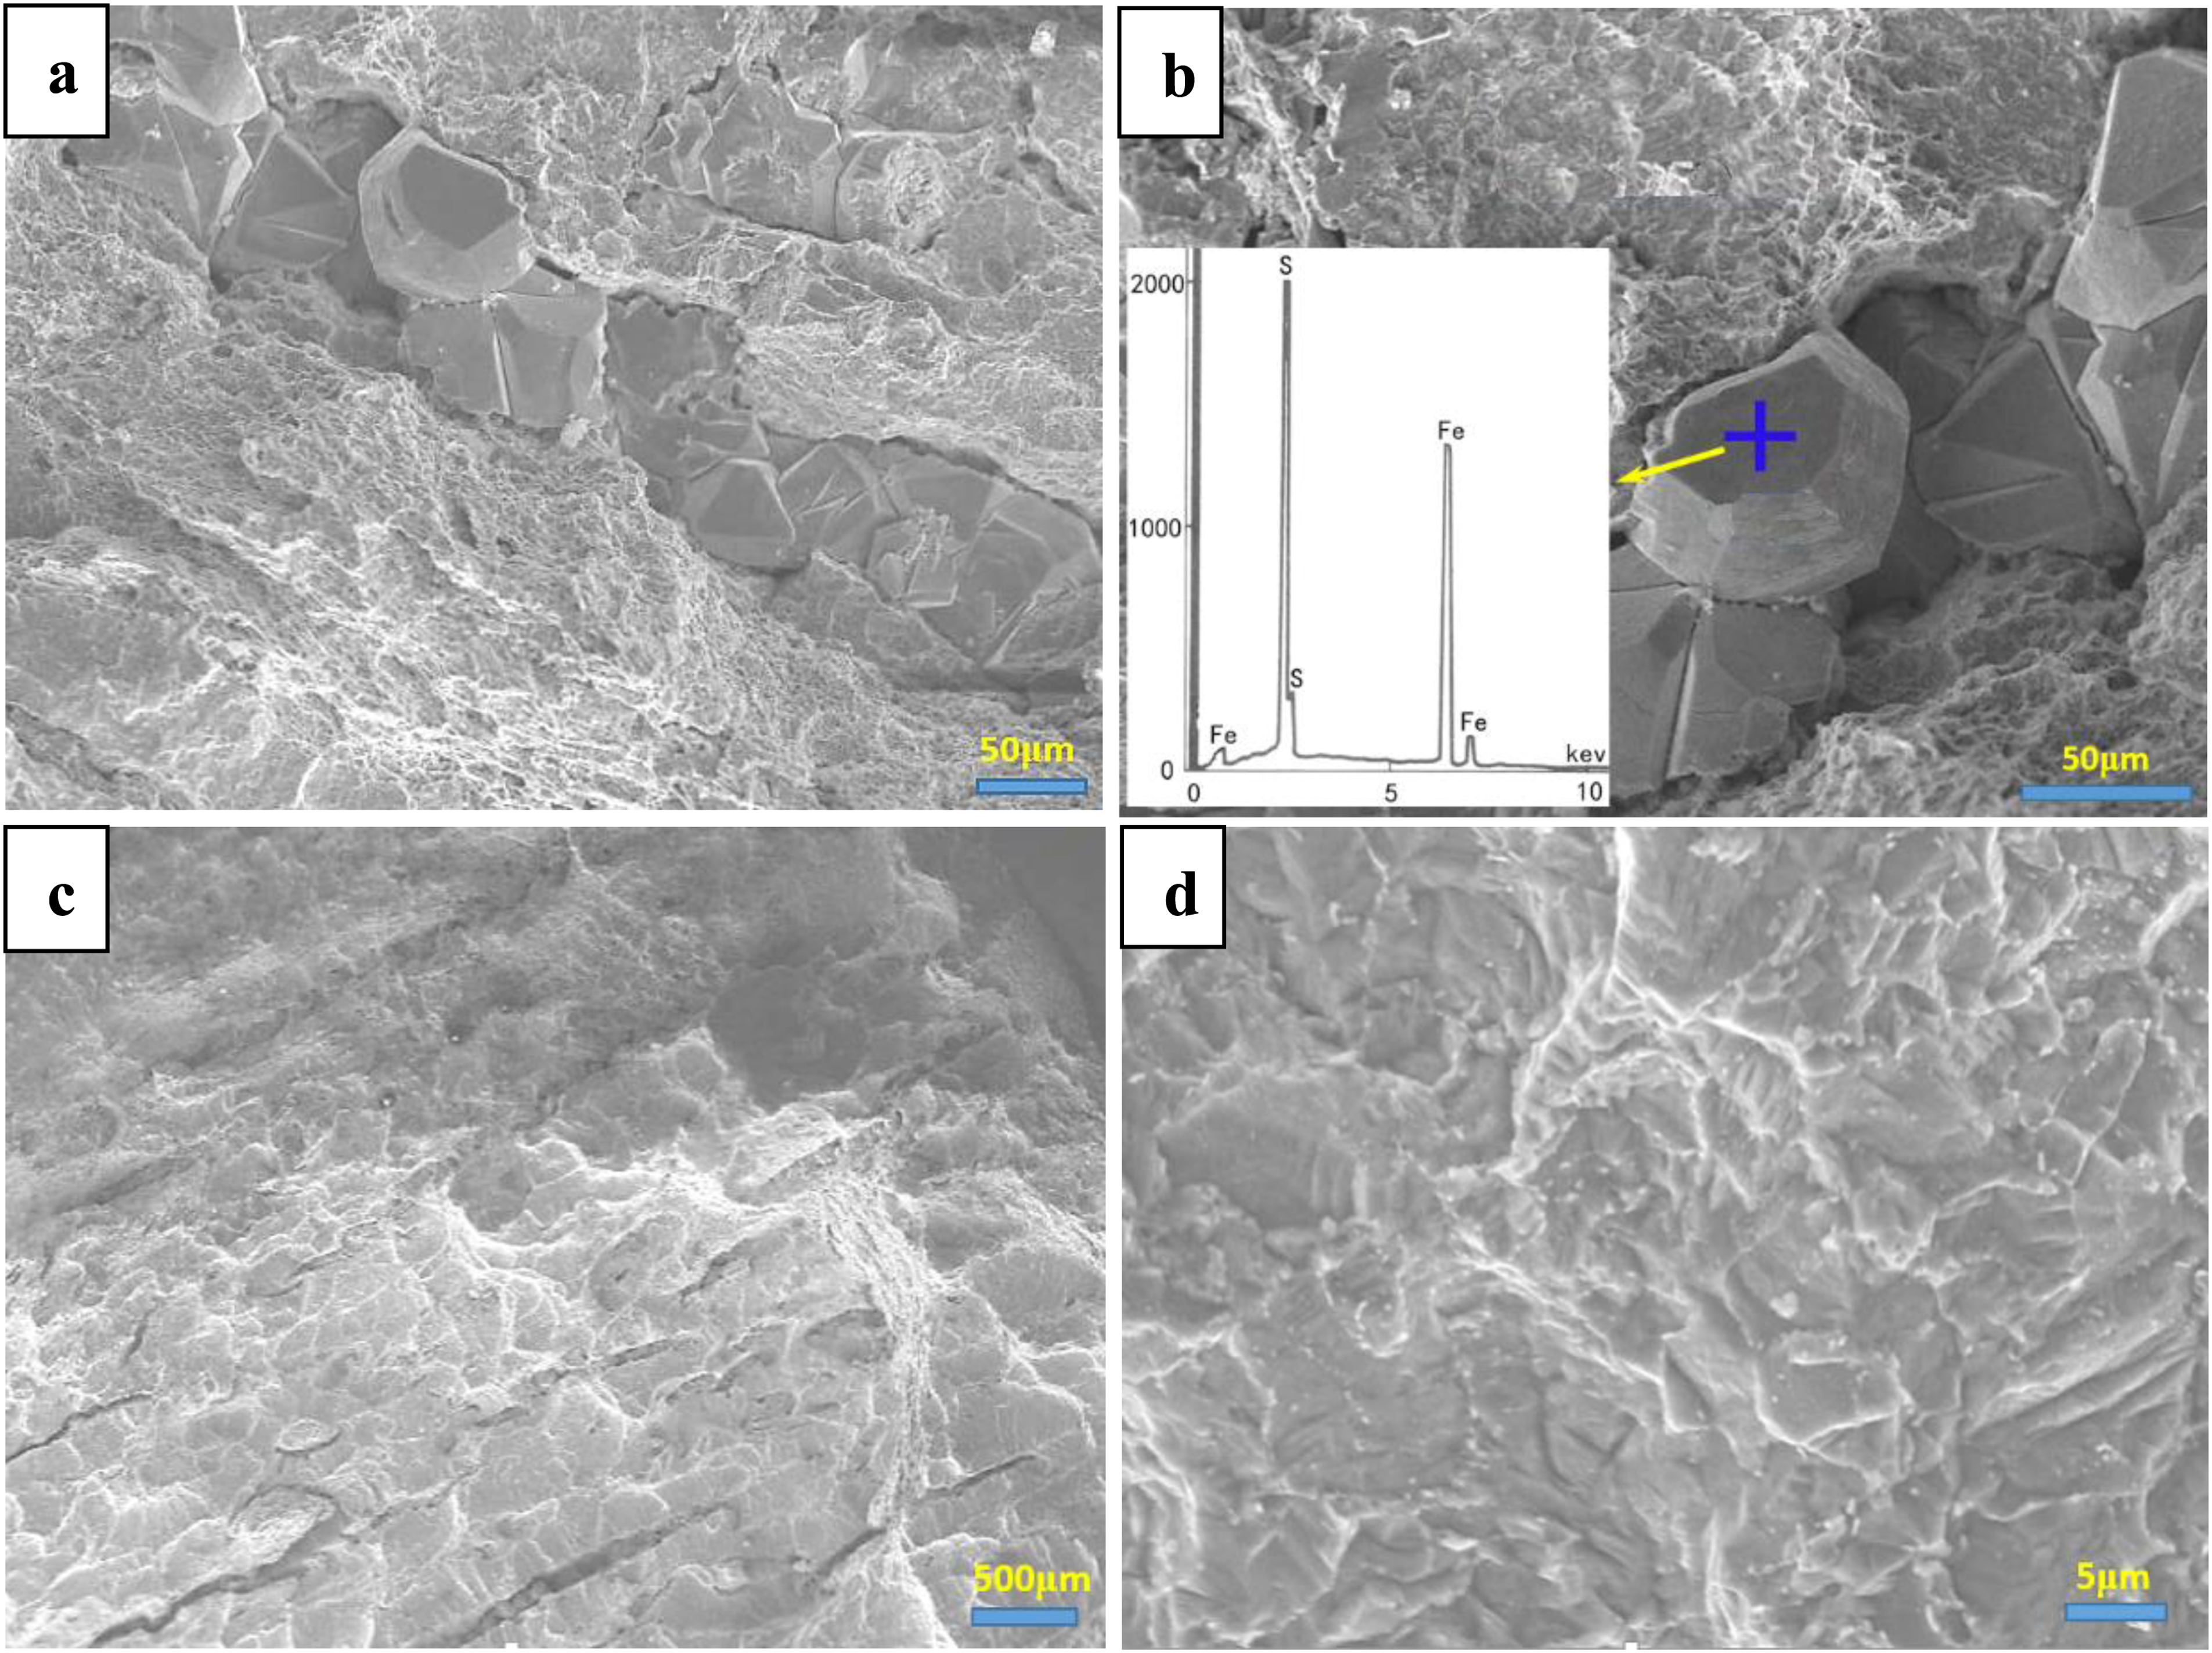
Cleaned SEM fracture morphologies of the cracked SSC test specimens: (a) crystal-like products in the interlayer gaps; (b) EDS spectra for those crystal-like products; (c) secondary cracks; and (d) predominant quasi-cleavage.
Discussion
Banded structure
As stated above, the microstructure of the Q345 contained a carbon-rich banded structure. Zhao 14 revealed that this banded structure was usually accompanied by non-polygonal ferrite in hot-rolled plate, and was mainly a carbon-rich degenerate pearlite band or a martensite/austenite (M/A) island band that was mainly attributed to the component segregation. The carbon-rich and carbon-poor bands showed an alternate distribution after hot rolling. Ferrite was preferentially formed on the carbon-poor bands with higher critical points during the continuous cooling process, which further repelled carbon into the carbon-rich bands, and finally, the residual austenite within the carbon-rich band transformed into a degenerate pearlite band or a M/A island band that depend on the cooling rate at the transition. Figure 7 shows the TEM micrograph in the region with the banded structure (Figure 7(a)) and the corresponding selected area electron diffraction (SAED) pattern of the carbides (Figure 7(b)). The carbides were identified as mainly M3C carbides. Therefore, there was degenerate pearlite rather than M/A islands in the region with the slightly dark banded structure, which contained fragmentised cementites, distinguished from the common pearlite that contained lamellar cementites.
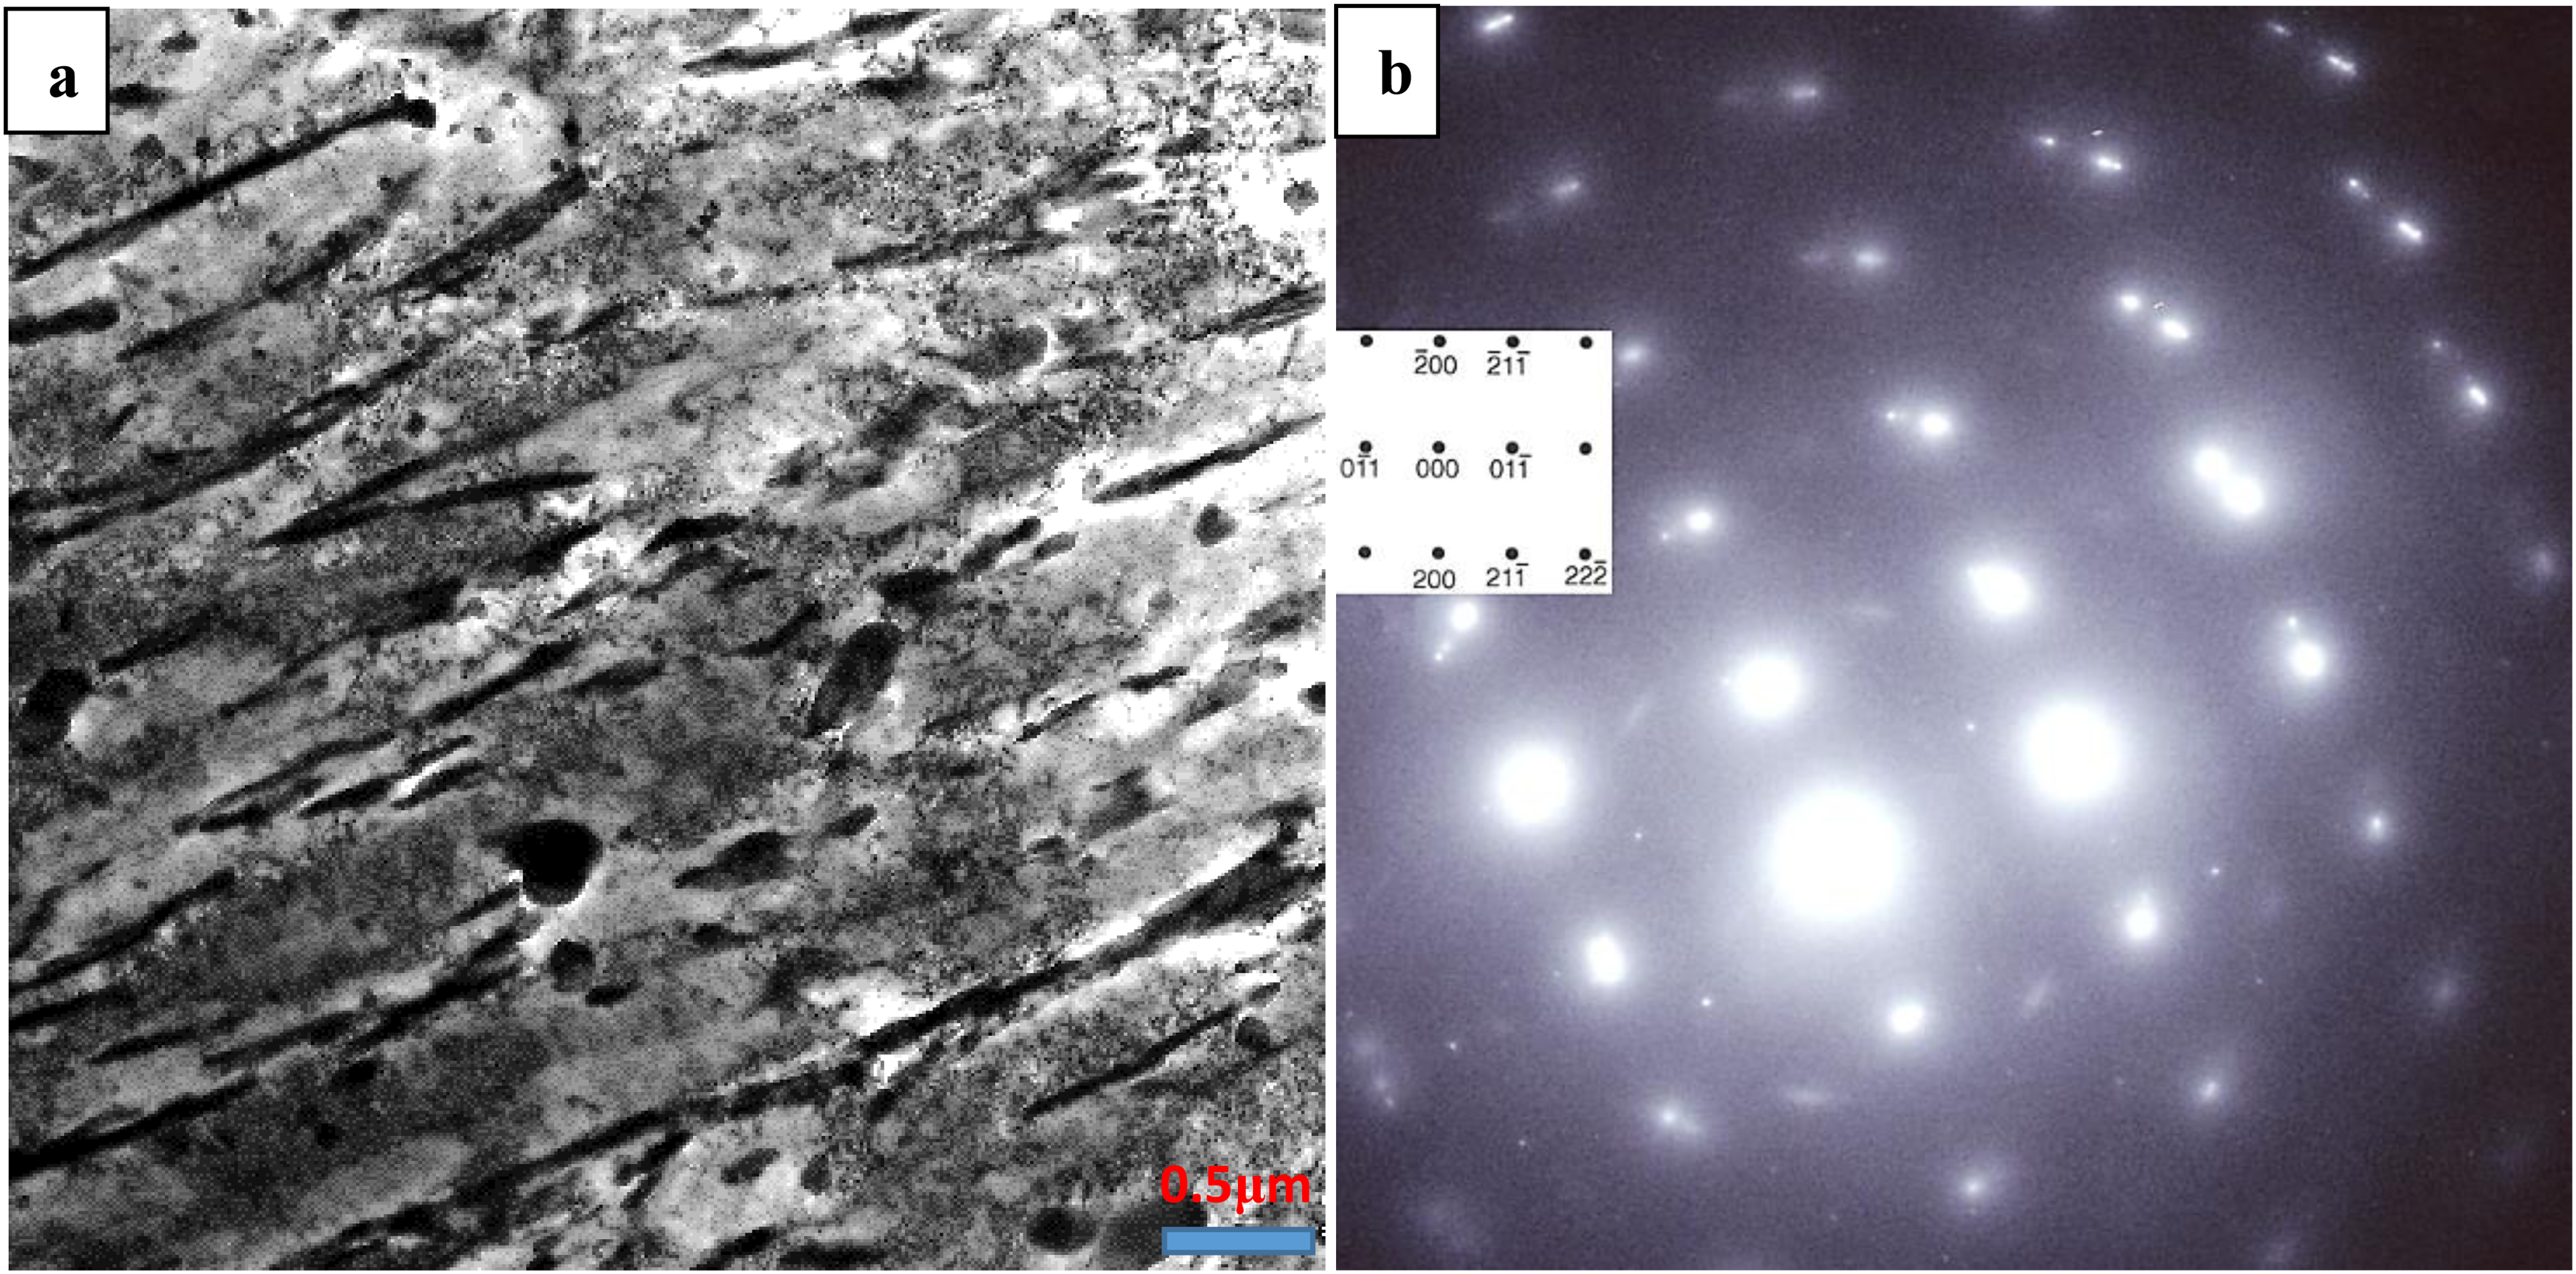
(a) TEM micrograph; (b) the corresponding SAED pattern in the region with the banded structure.
SSC mechanism
The SSC mechanism of pressure vessel steels might involve the following chemical reactions under the combined action of H2S corrosion and a tensile stress. The cathodic reaction was:
The SSC occurrence was directly related to a critical hydrogen concentration (CH-critical). During the SSC test atomic H penetrated into the specimen and tended to diffuse to those sites with some microstructural defects such as the coarsening carbides, the inclusions, the segregations, and the banded structures. The penetrated hydrogen concentration (CH) of the specimens during the SSC test can be described by the following formula
18
:
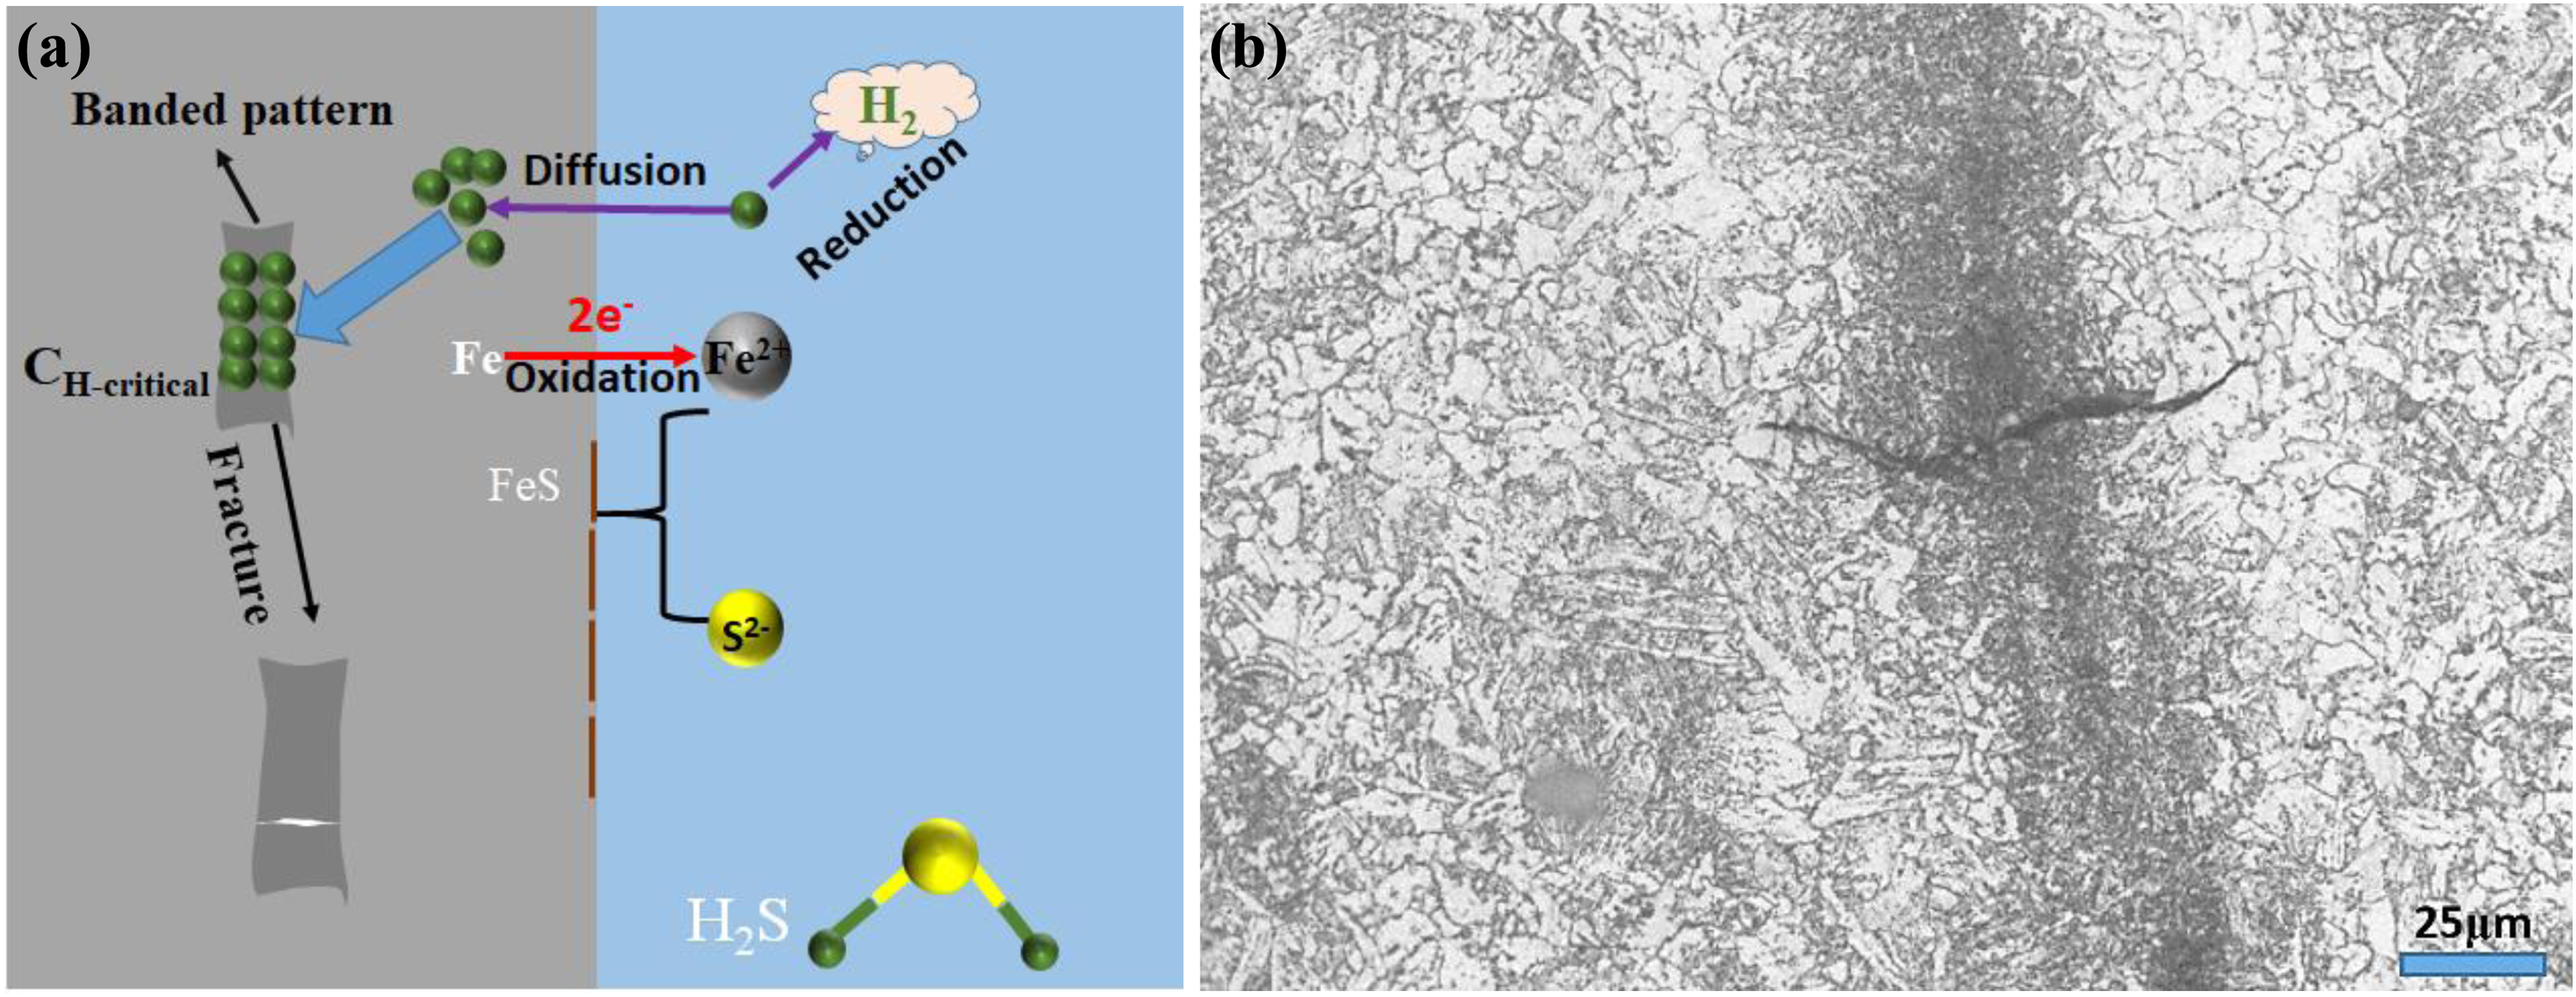
(a) Schematic diagram of SSC mechanisms; (b) cracks perpendicular to the carbon-rich banded structure.
Practice verification
Keeping in mind the above consequence, that is, the SSC preferentially occurred at the carbon-rich banded structure, the elimination of the carbon-rich banded structure is necessary to improve the SSC resistance of Q345 pressure vessel steel. Generally, cooling rate route in rolling schedule is targeted to produce the desired microstructure, which is much preferred because of its effectiveness in controlling the microstructure and its economical nature. As aforementioned, 21 different cooling rate after the final rolling caused different phase transition, resulting in different microstructure. The cooling rate decided the level of the banded structure. As the cooling rate increased, the banded structure became relatively slight and even disappeared. In view of this, the hot-rolled plate of the Q345 steel under the same production conditions but only cooling rate of 15 °C/s rather than 5 °C/s was trial-manufactured as the controls. At this case, the obtained microstructure had an irregular various-sized polygonal-like ferrite grains and a complete elimination of banded structure, as shown in Figure 9. The SSC evaluation was performed through a set of three test specimens that were loaded to the selected applied stress to measure the failure time. None of the three specimens cracked within the fixed time of 720 h. The steel passed the SSC test. Through verification in practice, the elimination of the carbon-rich banded structure is necessary to improve the SSC resistance of the Q345 pressure vessel steel.
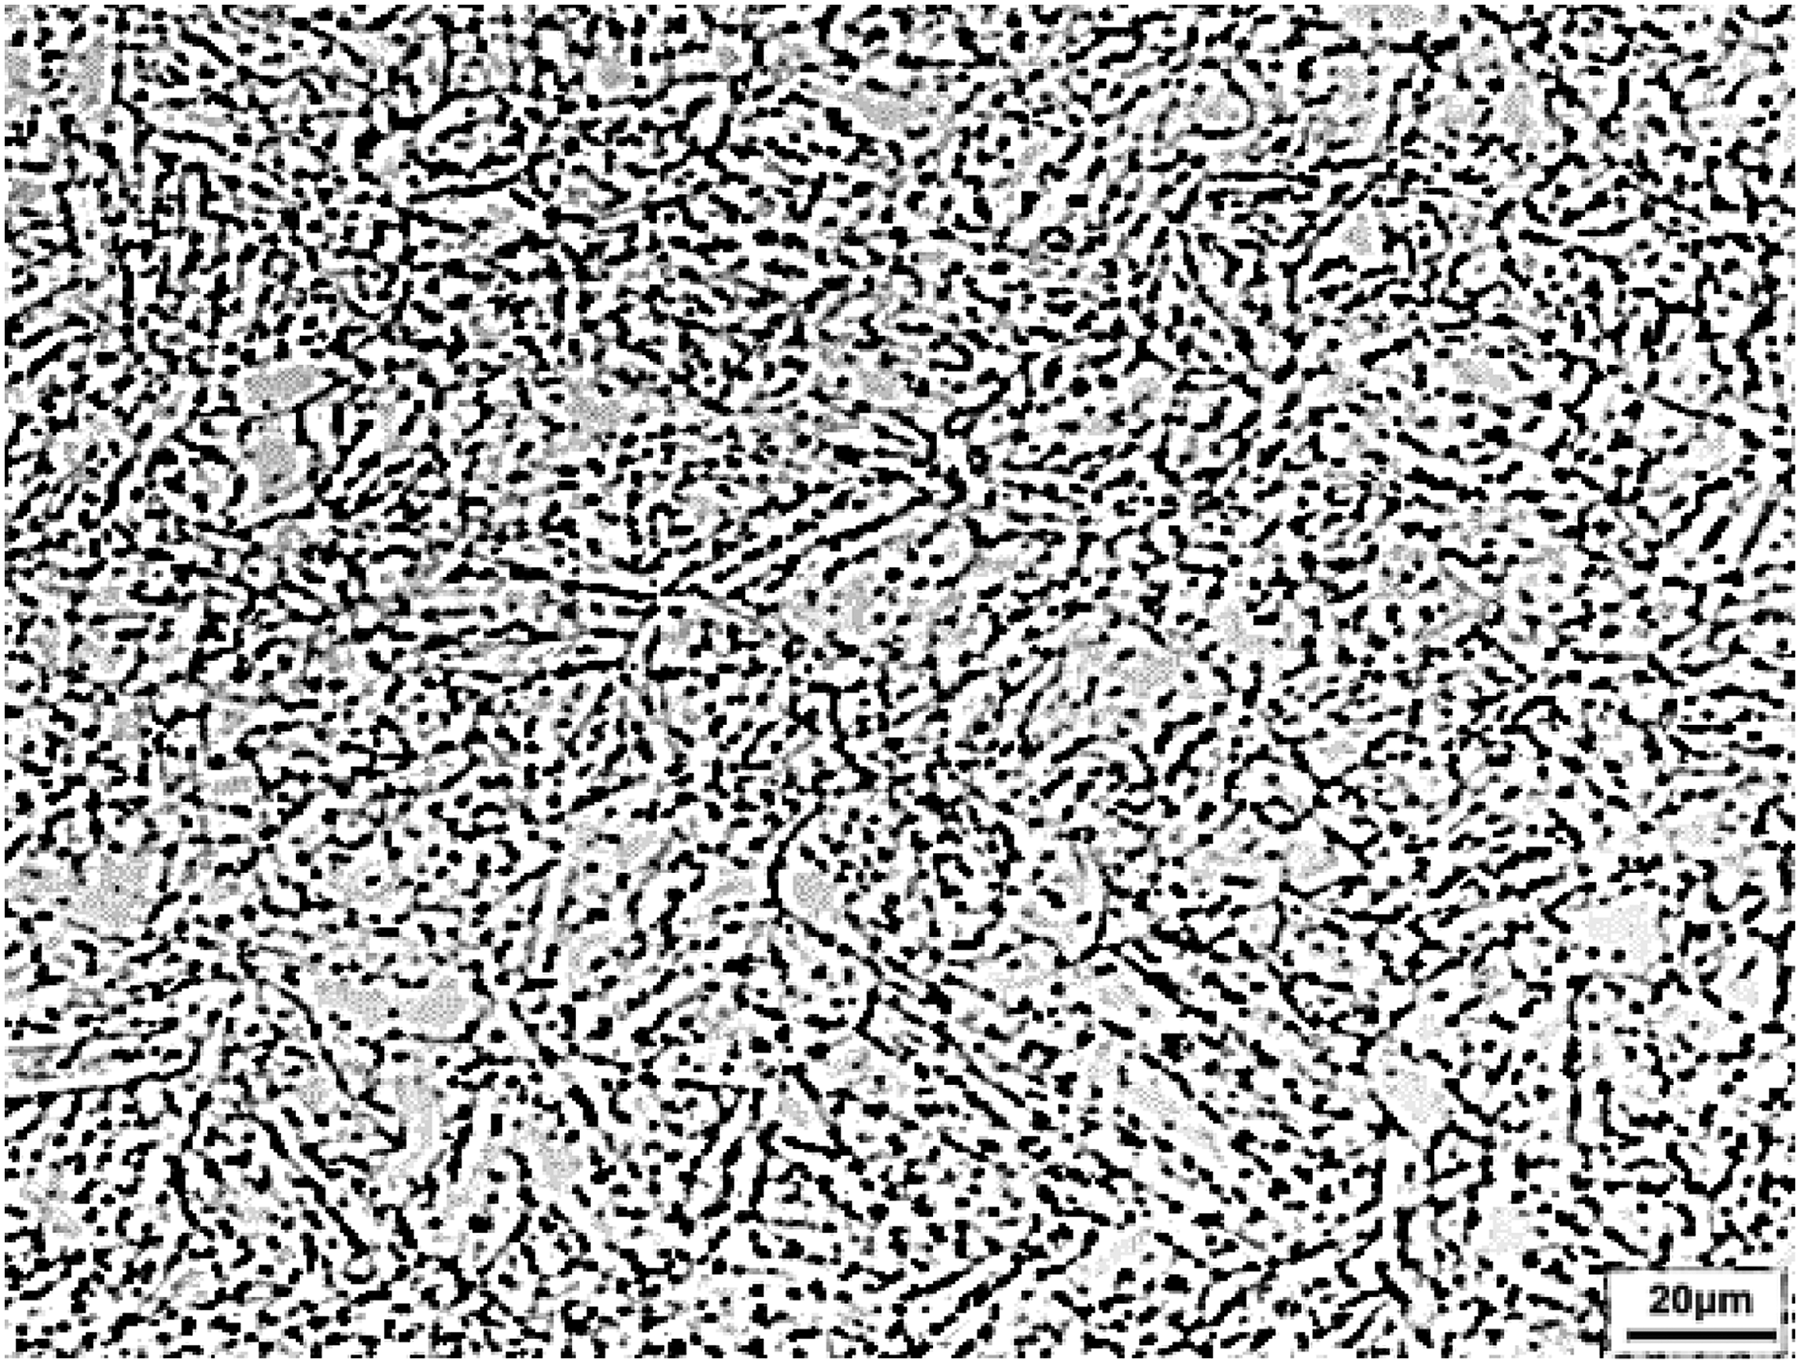
Contrasting optical micrograph at 15 °C/s, with a complete elimination of banded structure.
Conclusions
The Q345 had high ductility but failed the SSC tests. There presented hydrogen blisters on the outside surface of the SSC test specimens, and secondary cracks and predominant quasi-cleavage on the fracture surface of the cracked SSC test specimens. The SSC was related to the hydrogen penetration and enrichment.
The SSC preferentially occurred at the carbon-rich degenerate pearlite banded structure. The elimination of the carbon-rich degenerate pearlite banded structure is necessary to improve the SSC resistance of Q345 pressure vessel steel.
Footnotes
Acknowledgements
This study was financially supported by the Natural Science Foundation of Shandong Province (no. ZR2023ME181) and Xiangtan Iron & Steel Co., Ltd of Hunan Valin (contract no. 519112465).
Data availability statement
All data included in this study are available upon request by contact with the corresponding author.
Declaration of conflicting interests
The authors declared no potential conflicts of interest with respect to the research, authorship, and/or publication of this article.
Funding
The authors received no financial support for the research, authorship, and/or publication of this article.