
Abstract
This study thoroughly examines the influence of conventional and selective laser melting (SLM) routes and surface mechanical attrition treatment (SMAT) on the microstructural and electrochemical properties of 316L steel. Compared to wrought specimens, the SLM specimens exhibit significantly smaller grains (∼41 vs. ∼83 µm) and higher dislocation density (∼7.2 × 10¹³ vs. ∼3.7 × 10¹² m−2). Both specimens show nearly doubled surface hardness after SMAT, with the SLM surface displaying a ∼30 nm grain size and minimal α’ phase. The microstructure significantly influences passivation and corrosion behaviour. The SLM specimens exhibit superior electrochemical characteristics to wrought counterparts in SMATed (0.00299 mmpy) and non-SMATed (0.00771 mmpy) conditions. SMAT effectively eliminates surface porosity, enhancing the passivation and corrosion resistance of SLM steel.
Introduction
Among the austenitic stainless steels, 316L is widely known for its exceptional resistance to corrosion and superior mechanical properties. It has diverse applications in various sectors, including automotive, mining, petrochemicals and biomedical implants.1–3 Traditionally, stainless steel components are produced through the steelmaking route, including rolling, casting and machining. Still, these methods have limitations regarding achieving precise geometrical shapes and sizes. 4 In the last decade, selective laser melting (SLM), which is a metal 3D printing's laser powder-bed-fusion approach, has gained considerable attention across industries for producing engineering components. SLM involves the layer-by-layer fusion of metal powder using a focused laser beam. It offers greater flexibility in rapidly creating complex geometries with insignificant material wastage due to its layer-wise construction.5,6
The manufacturing method has an essential role in controlling the microstructural features of the alloys. Therefore, SLM and wrought 316L stainless steel exhibit distinct microstructures.5–9 One significant difference is the presence of porosity in SLM 316L stainless steel, resulting from gas inclusion or inadequate fusion of powder in the SLM process. 10 During the molten pool's solidification in this process, the concentration of alloying elements in the liquid near the solid/liquid interface could trigger dendritic growth and the formation of fine subgrains and irregular grain shapes.11,12 Consequently, the interface structures in SLM 316L steel exhibit greater complexity than wrought 316L stainless steel. Additionally, the SLM process boasts significantly higher cooling rates (ranging from 105 to 107 K/s), inducing dense dislocations and elevated residual stresses, particularly along grain and subgrain boundaries.13–16 Eliminating inclusions is challenging in the conventional steel production route. The inclusions (containing elements such as Cr, Si and Mn) could be smaller in SLM 316L than in wrought stainless steel.17,18 Variation in the composition, shape, distribution and size of inclusions impacts the material's corrosion.10,19 Composition disparities induce galvanic coupling, accelerating corrosion and shape influences stress concentration, promoting localised corrosion. Further, inclusion distribution affects corrosion initiation sites. Large inclusions disrupt passive film, heightening susceptibility. Understanding and managing these factors are critical for enhancing material durability in a corrosive environment. In essence, the main microstructural disparities distinguishing SLM 316L stainless steel from its wrought counterpart encompass porosity, fine inclusions, subgrains, dense dislocations and uneven grain shapes.
The metallic materials’ corrosion performance is intricately linked to their microstructures, underscoring the importance of comprehending how the typical microstructural features impact the passive layer formation and susceptibility to pitting corrosion in 3D-printed 316L stainless steel.20–22 A complex connection between dislocation density, electrochemical conditions and material morphology significantly influences stainless steel's passive film characteristics, especially in the context of the additive manufacturing route. The influence of solute segregations and dislocation networks along the cellular boundaries on corrosion resistance has been documented in the literature. 23 Over recent years, substantial research endeavours have been directed towards optimising processing parameters, elucidating microstructural evolution and enhancing the mechanical properties of components made from SLM 316L stainless steel. Despite its creditable corrosion resistance, 316L stainless steel faces challenges in harsh environments.14,24 Consequently, recent initiatives have focused on investigating the corrosion characteristics by considering factors such as heat treatment, defects, microstructure and their interplay.13,14,24,25 A few studies also focused on understanding the role of inhibitors in controlling the corrosion behaviour of 3D-printed 316L steel. 26
The choice of scanning strategy and building orientation in SLM significantly impacts the final printed components’ microstructure and mechanical properties.14,20,21 This behaviour is particularly evident in the cellular formations on the upper surface and the columnar structures on the side, which arise from the layer-wise manufacturing process and influence the performance of SLM parts in various orientations. The dependency of microstructure and proportion of defects on the 3D printing approach could be linked to the tribological performance of the steel.
27
Studies have demonstrated that different scanning strategies can disturb the 316L stainless steel's corrosion performance.14,28,29 Zhao et al.
14
investigated an interplay between the 316L steel's scanning strategy and its pitting corrosion resistance. Specifically, they explored the impact of scanning strategies involving rotations of 0°, 67.5° and 90° on corrosion behaviour. The samples produced with a 67.5° rotation exhibited the lowest corrosion resistance. Additionally, planes vertical to the building direction established higher corrosion resistance, while the boundaries of molten pools proved more susceptible to corrosion. In another study, scanning at 90° relative to the build direction yielded improved corrosion resistance.
29
The defects generated during the SLM process, such as melt pool boundaries, non-equilibrium microstructure, porosity and uneven solute distribution, can compromise corrosion resistance.13,29,30 Some studies have demonstrated that pre-existing defects like porosity in the sample lead to reduced corrosion resistance.13,29,30 However, conflicting observations exist in the literature regarding the influence of porosity on the corrosion parameters. For example, Sander et al.
31
found that corrosion potential (
Earlier studies illustrated that severe deformation of a metal surface through surface mechanical attrition (SMAT) modifies microstructure near the treated surface, mitigating corrosion susceptibility.29,33–35 SMAT involves subjecting the specimen's surface to the multiple impacts (in random directions) of moving hardened steel balls, resulting in high strain and strain rates (103–105 s−1).35–39 Material's response to the SMAT could depend on the initial microstructure, which varies based on the manufacturing process route. Some researchers40,41 studied the effects of laser shock peening (LSP) on microstructure, surface morphology, residual stress and chemical composition of the surface. The significant compressive residual stress and grain refinement on the surface of austenitic stainless steel treated by massive LSP impacts are attributed to the enhancement of pitting corrosion resistance, as the former helps minimise microcracks between the intermetallic and metallic matrix and the latter allows forming a thicker Cr2O3 inner layer in the passive film.
Considering the broader applications of 316L steel, this research thoroughly examines how manufacturing methods impact the microstructural and electrochemical behaviour of 316L steel specimens undergoing severe deformation through SMAT. Before and following severe surface deformation, SLM and wrought steel's microstructure is meticulously characterised. Further, electrochemical tests are conducted to achieve a profound discernment of the corrosion behaviour of the specimens. Analysis of microstructure, electrochemical results and the corroded surface helps expound the corrosion mechanisms and correlate them with the manufacturing routes.
Experimental
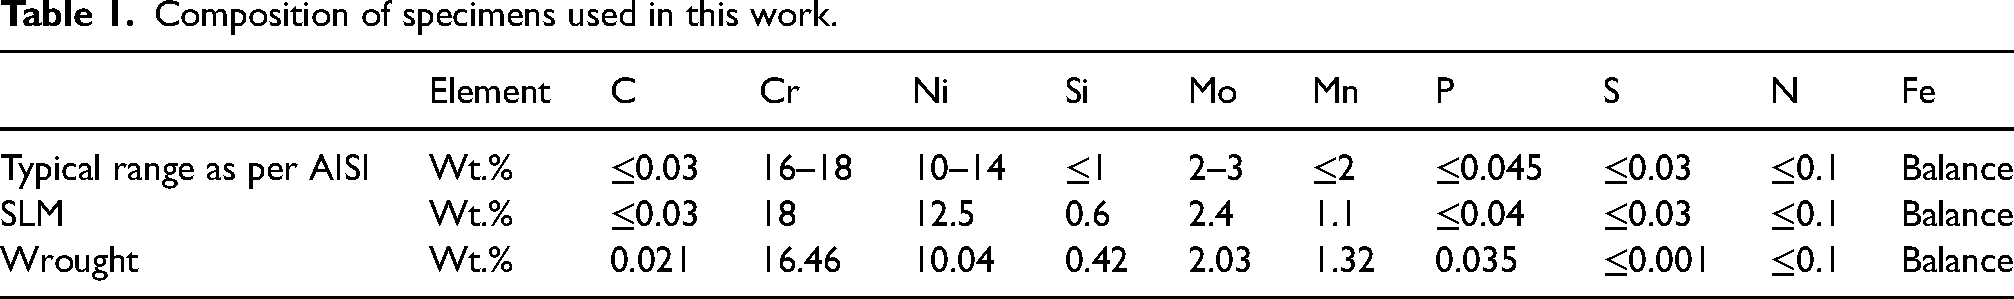
Layer-by-layer scanning was employed to construct ∼50 mm diameter and ∼5 mm thick discs using the SLM process. The parameters for additive manufacturing were specified in our prior study. 27 In this study, the SLM sample was built at 45° with respect to their build direction (schematically shown in Supplemental Figure S1). This study compares the SLM 316L steel with its wrought counterpart. For a comparative analysis of the results under equivalent conditions, the wrought and SLM specimens underwent the same annealing treatment (i.e., 0.5 h holding duration at 1050°C). The specimens’ compositions (wt. %) are detailed in Table 1. In the SMAT, hardened steel balls with a diameter of ∼5 mm and a velocity of ∼10 m/s were utilised to induce significant surface deformation on the chosen specimens for a duration of 600 s. 38 In the subsequent text, non-SMATed and SMATed specimens are designated ‘NS’ and ‘S’.
Composition of specimens used in this work.
For the microscopic examination, the specimens underwent a preparation process involving grinding (up to 3000 grades of emery paper), followed by polishing (up to 0.1 µm diamond paste) and etching in a solution containing 10 ml HNO3 and 30 ml HCl. The microstructure of the etched specimens was assessed using optical microscopy and scanning electron microscopy (SEM) (FESEM, JEOL-7610F Plus). An electron backscatter diffraction (EBSD) study was conducted on electro-polished specimens to analyse microstructural variations in the specimens. The electropolishing procedure used Struers Lectropol-5 equipment, employing a perchloric electrolyte and methanol mixture in a 20:80 ratio. The process was accomplished at ∼273 K and a DC voltage of ∼18 V. The EBSD results were obtained from the samples using an accelerating voltage of ∼20 kV, ∼10 mA current and a 0.5 µm step size. Data collection was facilitated by Oxford Instruments’ AZtec software. The acquired data were exported in ‘.cpr’ and ‘.ctf’ formats for subsequent analysis. Further, HKL channel 5 and ATEX software enabled data processing.
The manifestation of phases in the samples was ascertained by X-ray diffraction (XRD), with 2θ (here, θ is the Bragg angle) in the range of 30–80°. X-ray photoelectron spectroscopy (XPS) with Al Kα X-ray was utilised to gain insights into the specimens’ passivation behaviour. Microstructural examination of the SMATed surface was conducted using a high-resolution transmission electron microscope (HR-TEM) operating at 300 kV (Model: Tecnai G2, F30). Thin samples with ∼3 mm diameter and less than ∼50 μm thickness were made for TEM by ion-beam milling. The obtained TEM data were analysed using Image-J software. The Vickers microhardness study was conducted on the SMATed samples’ polished cross-sections using a 0.1 kg load and a 20 s dwell time.
The corrosion response of all specimens was evaluated at room temperature through electrochemical impedance spectroscopy (EIS), linear polarisation tests and open circuit potential (OCP). These tests used flat corrosion cells in a 0.6 M (3.5 wt.%) NaCl electrolyte. The flat cell employed a three-electrode system. The steel specimen was used as the working electrode. A saturated calomel electrode (SCE) was helpful as the reference electrode. Further, platinum was chosen as the counter electrode. The OCP measurements were undergone for 3600 s duration in the selected electrolyte. EIS experiments were accomplished with a 10 mV excitation voltage and a frequency was varied from 0.05 to 105 Hz. Furthermore, using an AC signal of 10 mV, the Mott–Schottky (MS) measurements were conducted at 103 Hz. Linear polarisation tests were executed within −0.8 to 0.6 V, employing a 10 mV/min scanning. All the electrochemical tests were recurred thrice to assure reliability.
Result and discussion
Study of microstructure
A detailed insight into the microstructural features of wrought and as-printed SLM specimens is provided in Figure 1. The microstructure of the wrought specimen showcases the characteristic austenitic grains, along with annealing twinned boundaries (Figure 1(a)). A distinct semi-circular solidified melt pools, indicating the layer-by-layer additive manufacturing process, are evident in the SLM specimen's SEM micrograph (Figure 1(b)). Elongated columnar structures grow perpendicular to these pools’ boundaries (Figure 2(a) and inset in Figure 1(b)). Additionally, certain pools exhibit a fine cellular network with a cell size of ∼0.5 µm (Figure 1(c)). Such hierarchical microstructure arises due to the significant thermal gradient (∼105–107 K/s) inherent in the SLM process.15,16,42 EDS results displayed in Figure 1(d) affirm the even distribution of the elements within the microstructure of the SLM specimen.

The microstructure of (a) wrought and (b) SLM (as printed) specimens. (c) An enlarged view of the region is indicated in (b). (d)–(i) EDS map of the SLM specimen's cross-section. (j) EDS spectrum corresponding to the SLM specimen.
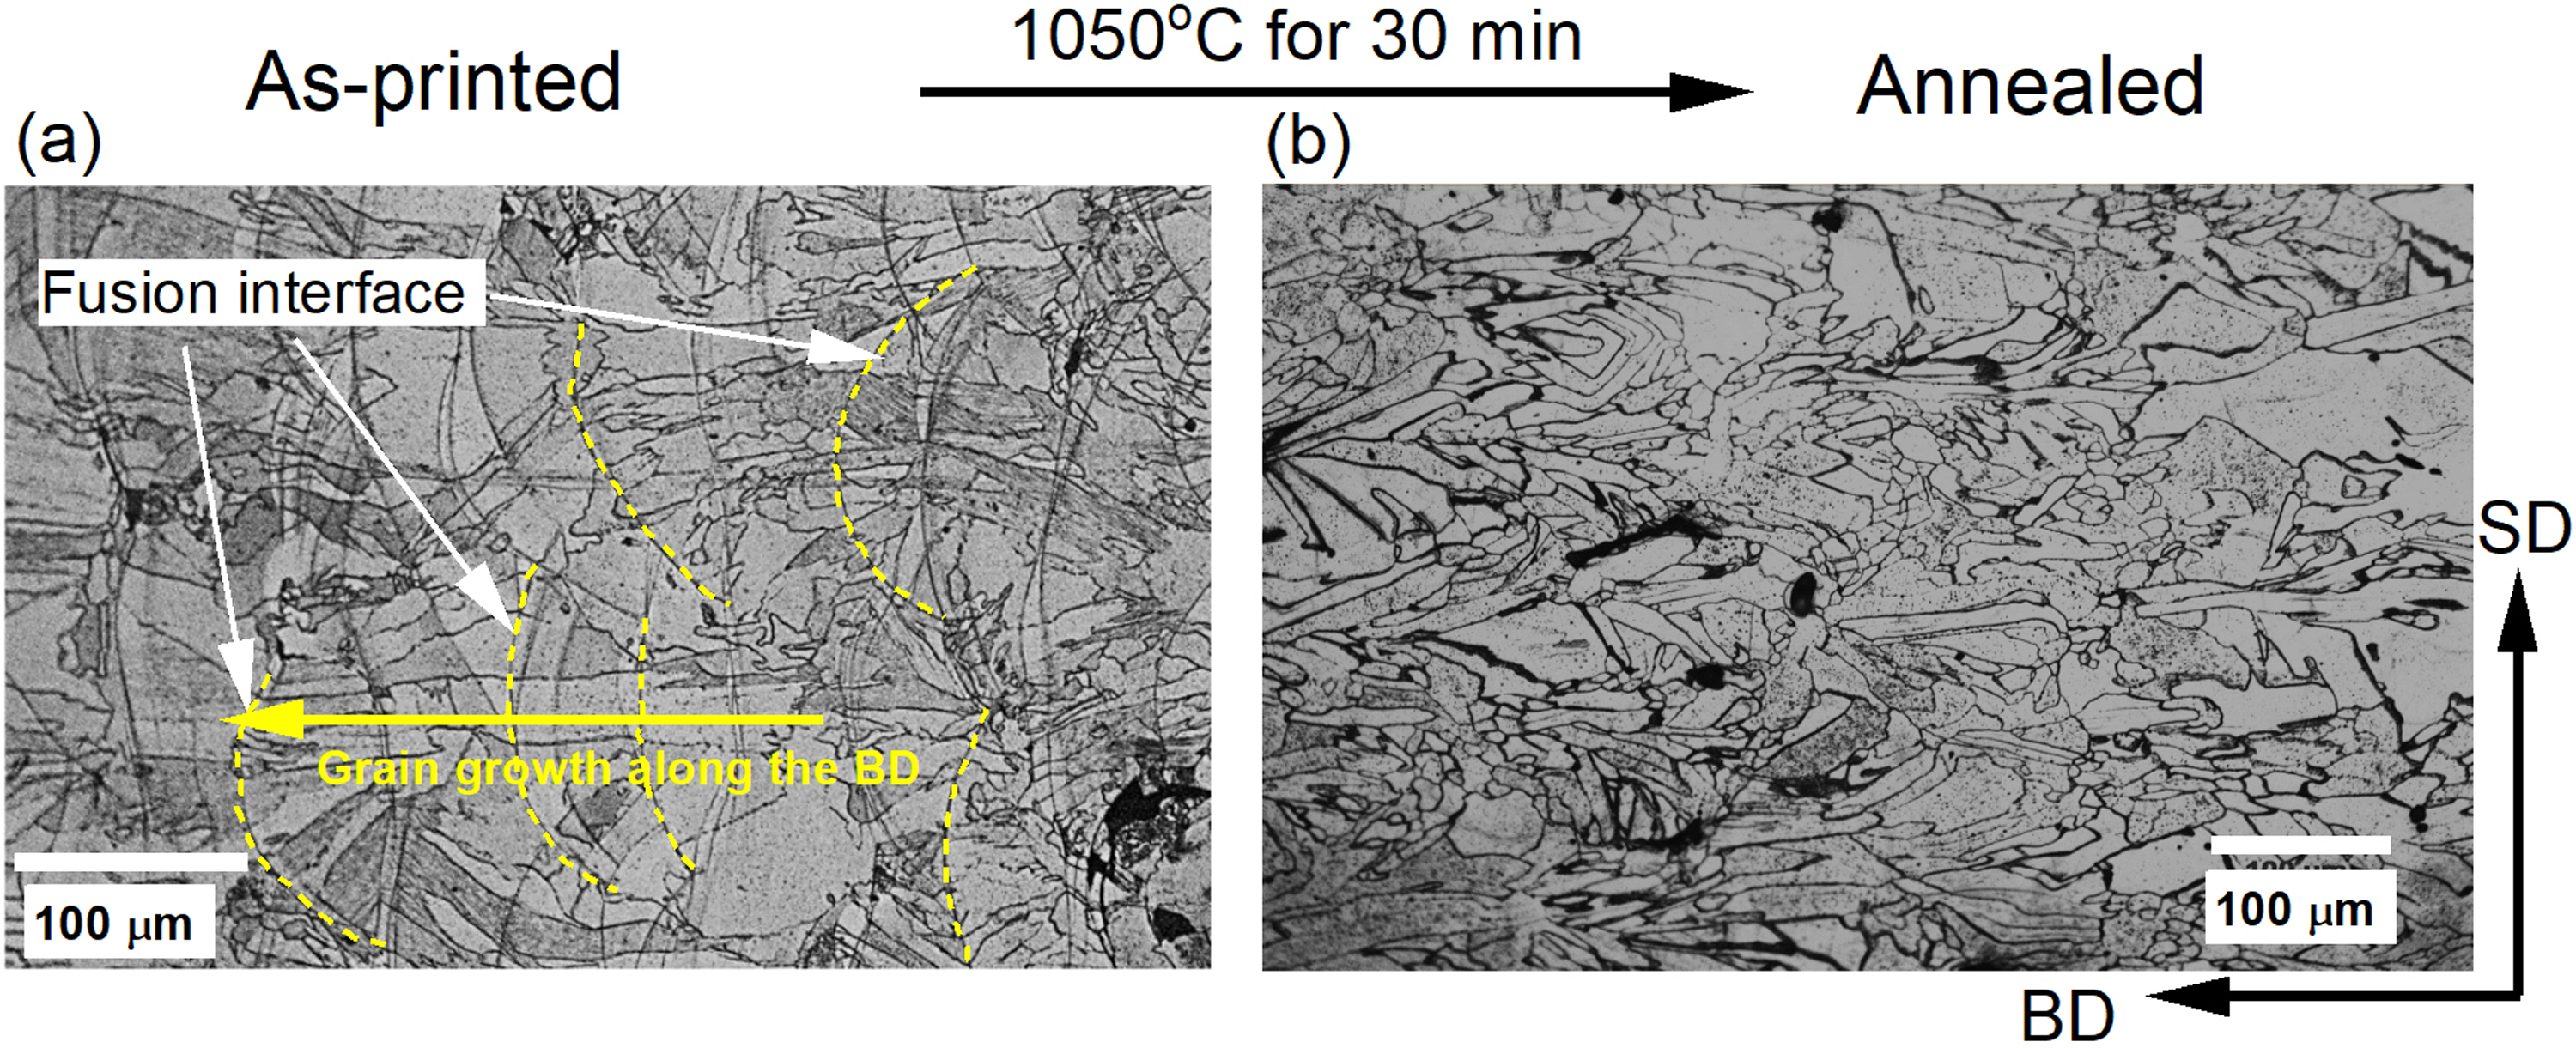
Optical micrographs of (a) as printed and (b) annealed SLM specimen.
The SLM specimen's as-printed and annealed micrographs are presented in Figure 2. Figure 2(a) illustrates the molten pool and hierarchical microstructure of the as-printed SLM specimen, as discussed above. However, the molten pool boundaries and the associated hierarchical substructure vanish after annealing (Figure 2(b)) and the recrystallised discrete elongated grains, ranging from 10 to 100 µm size, emerge. A similar microstructure was reported in the literature.22,43
The EBSD orientation image maps and grain boundary maps (Figure 3(a)–(d)) represent the grain distribution characteristics. In the case of the annealed SLM specimen, a non-uniform and randomly distributed grain pattern is evident (Figure 3(c)). Conversely, the wrought specimen displays equiaxed and uniformly distributed grains (Figure 3(a) vs. (c)). Figure 3(e) provides the average grain size, calculated based on high-angle grain boundaries (HAGBs) (i.e., grain boundaries with a misorientation of more than 15°). Due to the higher solidification rate associated with the SLM route, a substantially smaller grain size of ∼40 µm is possible, in contrast to the wrought specimen with a grain size of ∼83 µm. Moreover, the SLM specimen has a higher dislocation density (∼7.2 × 10¹³ m−2) than the wrought specimen (∼3.7 × 10¹² m−2) (Supplemental Figure S2). In the grain boundary maps (Figure 3(b) and (d)), the SLM specimens exhibit a substantially higher density (∼33%) of low-angle grain boundaries (LAGBs with misorientation of less than 15°), compared to the wrought specimen (∼5%) (see also Supplemental Figure S3(a) and (b)). This distinctive grain boundary distribution further underscores the microstructural differences between the wrought and SLM specimens.

(a and c) EBSD orientation image maps and corresponding (b and d) grain boundary maps of (a)–(b) wrought and (b)–(d) SLM specimens. (e) The average grain size of these specimens.
Figure 4(a)–(b) provides the orientation image maps of SMATed specimens. SMAT, as a severe plastic deformation process, induces high strain rates and substantial strain in the vicinity of the SMATed surface.36,37 High strain near the SMATed surface leads to the development of an intense network of shear/deformation bands in both specimens. Due to a high strain and intersection of high-density shear/deformation bands (Figure 5(a)), Kikuchi pattern formation and indexing are challenging at the surface region. The higher density of unindexed dark spots in orientation image maps (caused by the intersection of shear/deformation bands) confirms the same (Figure 4(a)–(b)). Moreover, the orientation image maps demonstrate a change in colour contrast, indicating the presence of a strain gradient within the grains after the SAMT. The LAGBs are significantly increased in the wrought (∼97%) and SLM (∼95%) specimens after SMAT (Figure 4(c) and (d)). In support of Figure 4, Supplemental Figure S3(c) and (d) compare the misorientation angle distribution of SMATed wrought and SLM specimens, confirming the presence of a higher fraction of LAGBs after the SMAT process in conventional and SLM specimens. The average dislocation density of SMAT-processed specimens is ∼1.8 × 10¹⁴ m−2 for wrought specimens and ∼2 × 10¹⁴ m−2 for SLM specimens (Supplemental Figure S4). The grain boundary maps depicted in Figure 4(c) and (d) and the GND maps in Supplemental Figure S4 exemplify a discernible gradient in strain accumulation with increasing depth. Typically, a material manufactured using the SLM technique contains porosity (see non-SMATed core region of Figure 5(b)). Such porosity is eliminated at the surface region (Figure 5(b)) owing to the intense material flow in the SMAT process.

Orientation image maps of SMATed (a) wrought and (b) SLM specimens (acquired by EBSD). (c) and (d) grain boundary maps corresponding to (a) and (b), respectively.
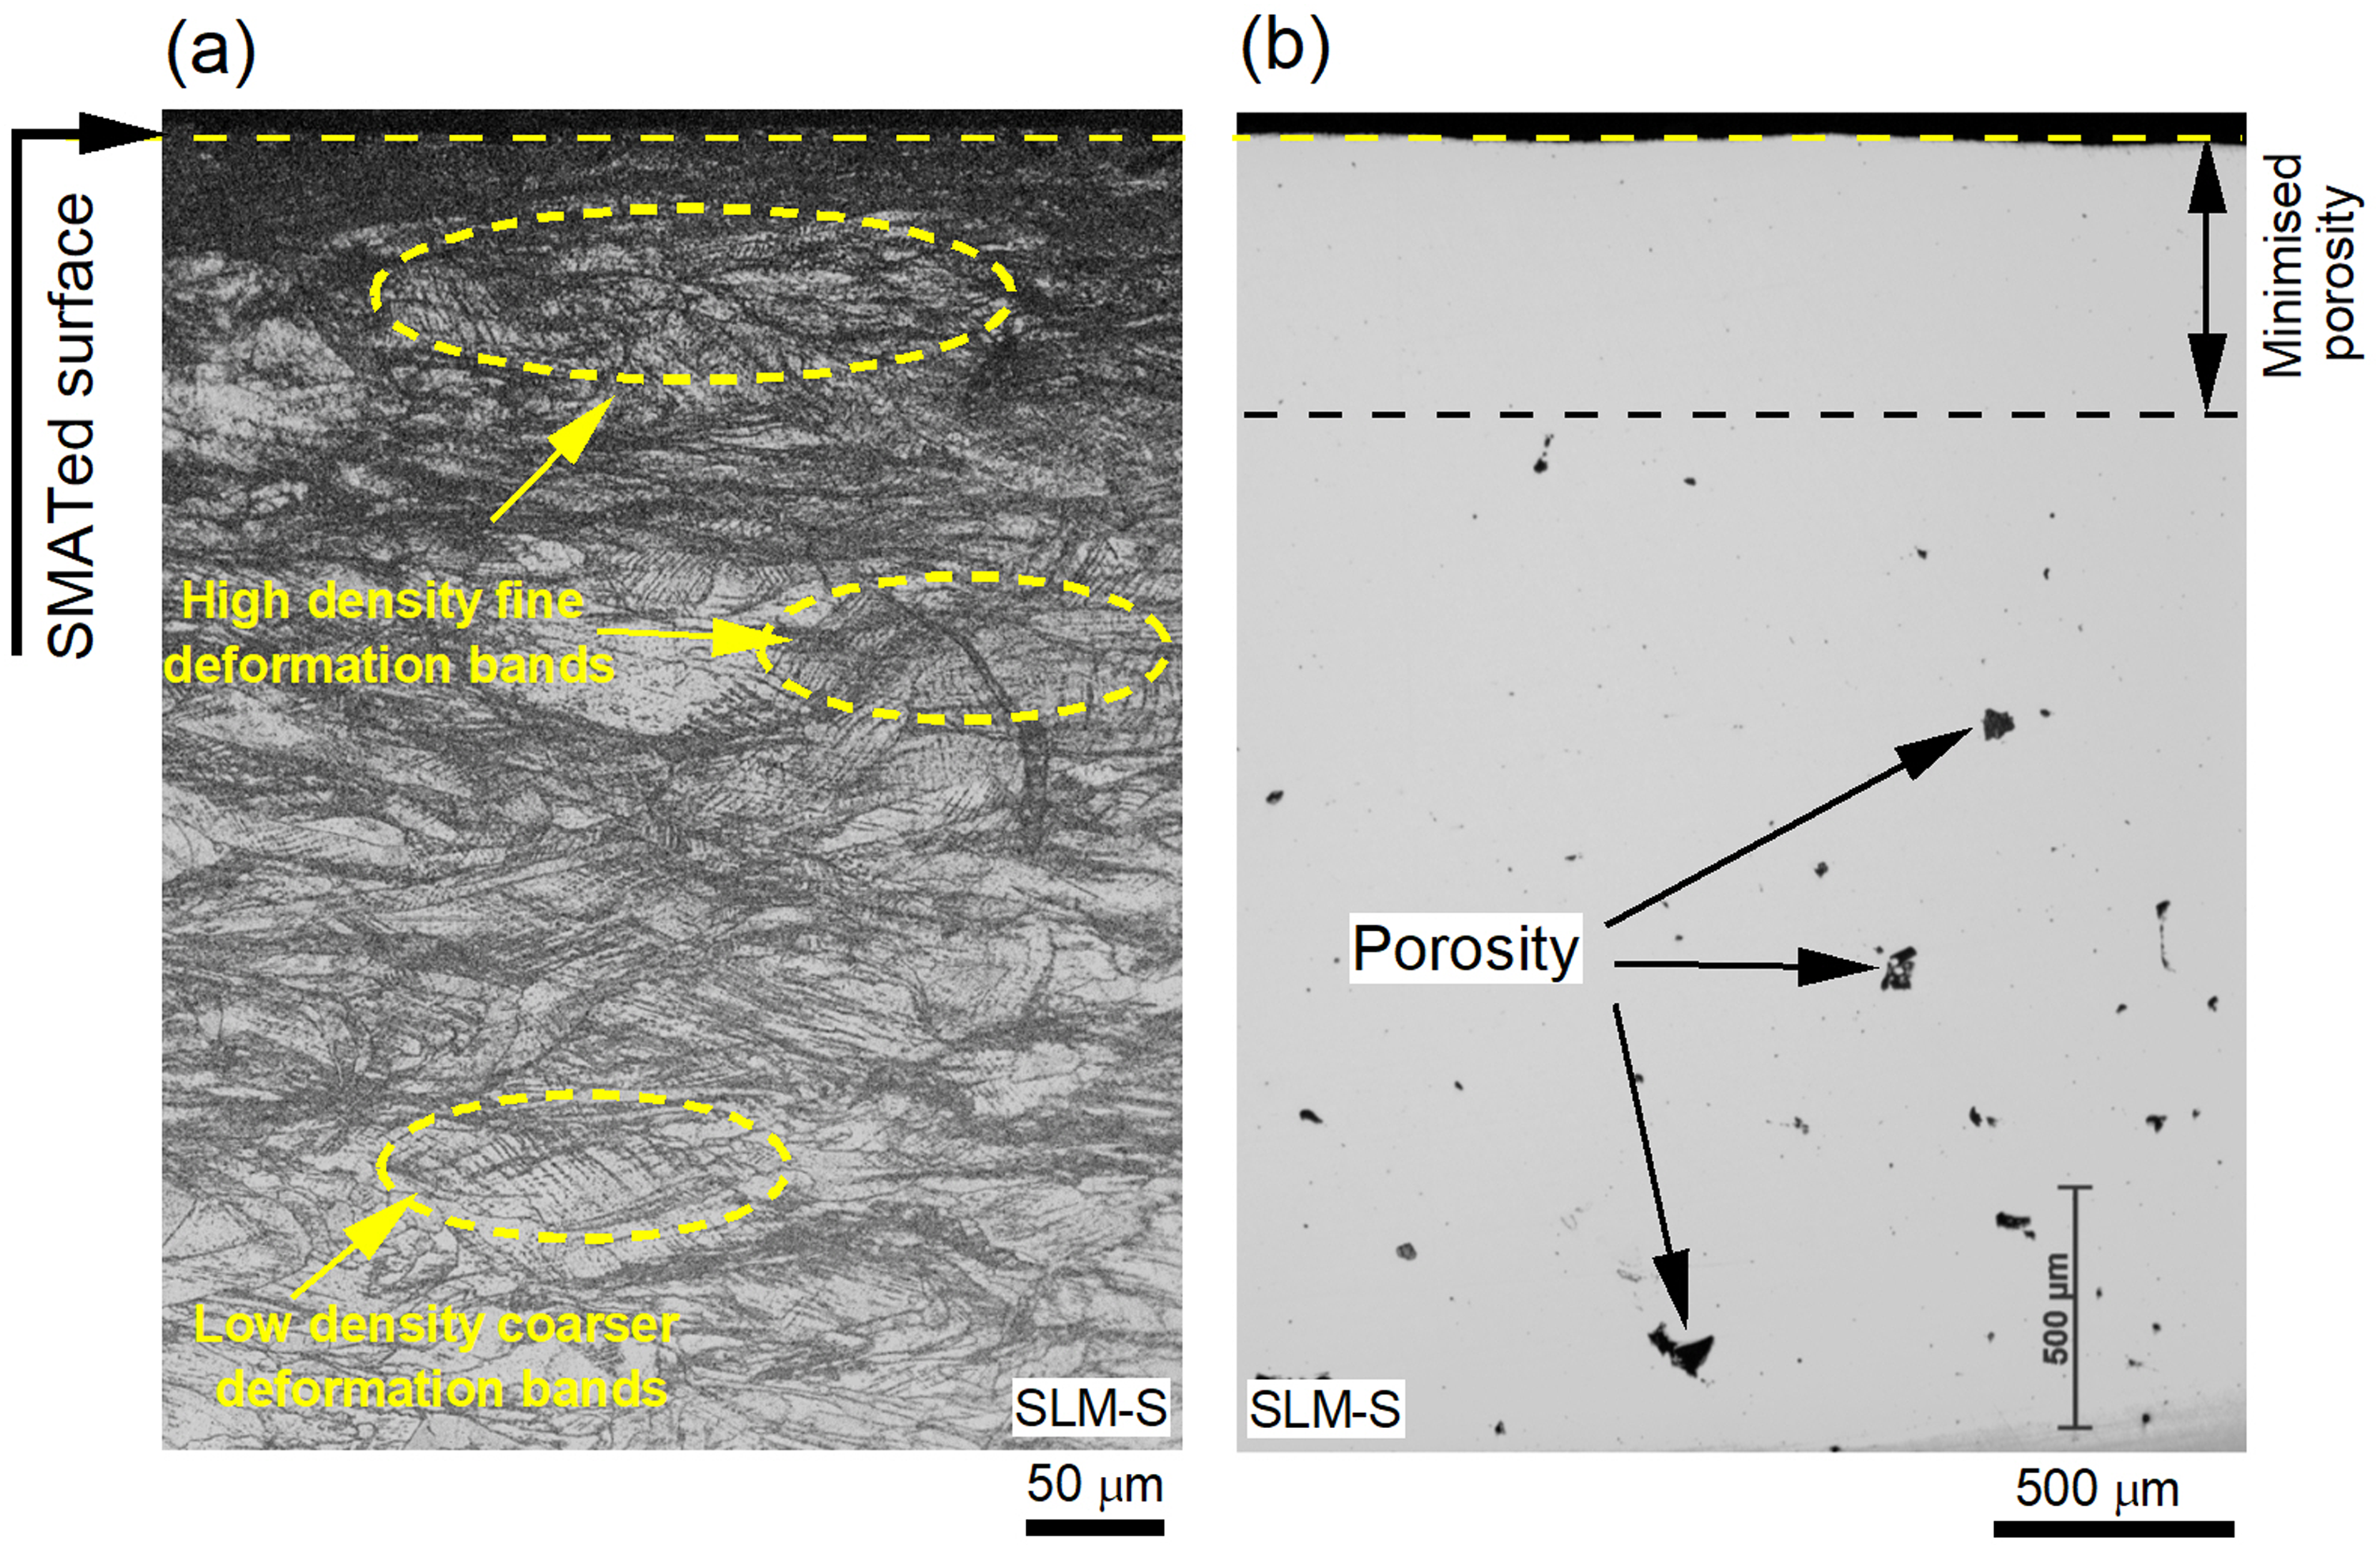
Optical micrographs of the SMATed SLM specimen's cross-section in (a) etched and (b) unetched conditions.
The TEM enables investigating the uppermost surface region of the wrought and SLM specimens. The bright field (BF) TEM micrographs and their consequent selected area electron diffraction (SAED) patterns of the SMATed specimens’ near-surface regions are presented in Figure 6. The micrographs (Figure 6(a) and (c)) and continuous rings in SAED patterns (Figure 6(b) and (d)) confirm the evenly distributed nanocrystalline equiaxed grains. The average grain size following the SMAT process is ∼42 and ∼32 nm for the wrought (Figure 6(a)) and SLM (Figure 6(c)) specimens, respectively. The SLM specimen comprises a higher dislocation density (Supplemental Figure S4) and grain boundary area (Figure 3) before the SMAT operation. Therefore, high strain and the additional dislocations generated during SMAT provide a higher driving force for grain refinement, leading to the smaller grain size of the SLM specimen's SMATed surface. In addition to the austenitic nanograins, the α’-martensite is noticed in the SMATed wrought specimen's SAED pattern (Figure 6(b)). The continuous rings of α’ phase reveal its fine dispersion in the surface region. In contrast, the SMATed SLM specimen shows an insignificant presence of α’ phase (Figure 6(d)). These results suggest a difference in the response of both specimens to the SMAT process.
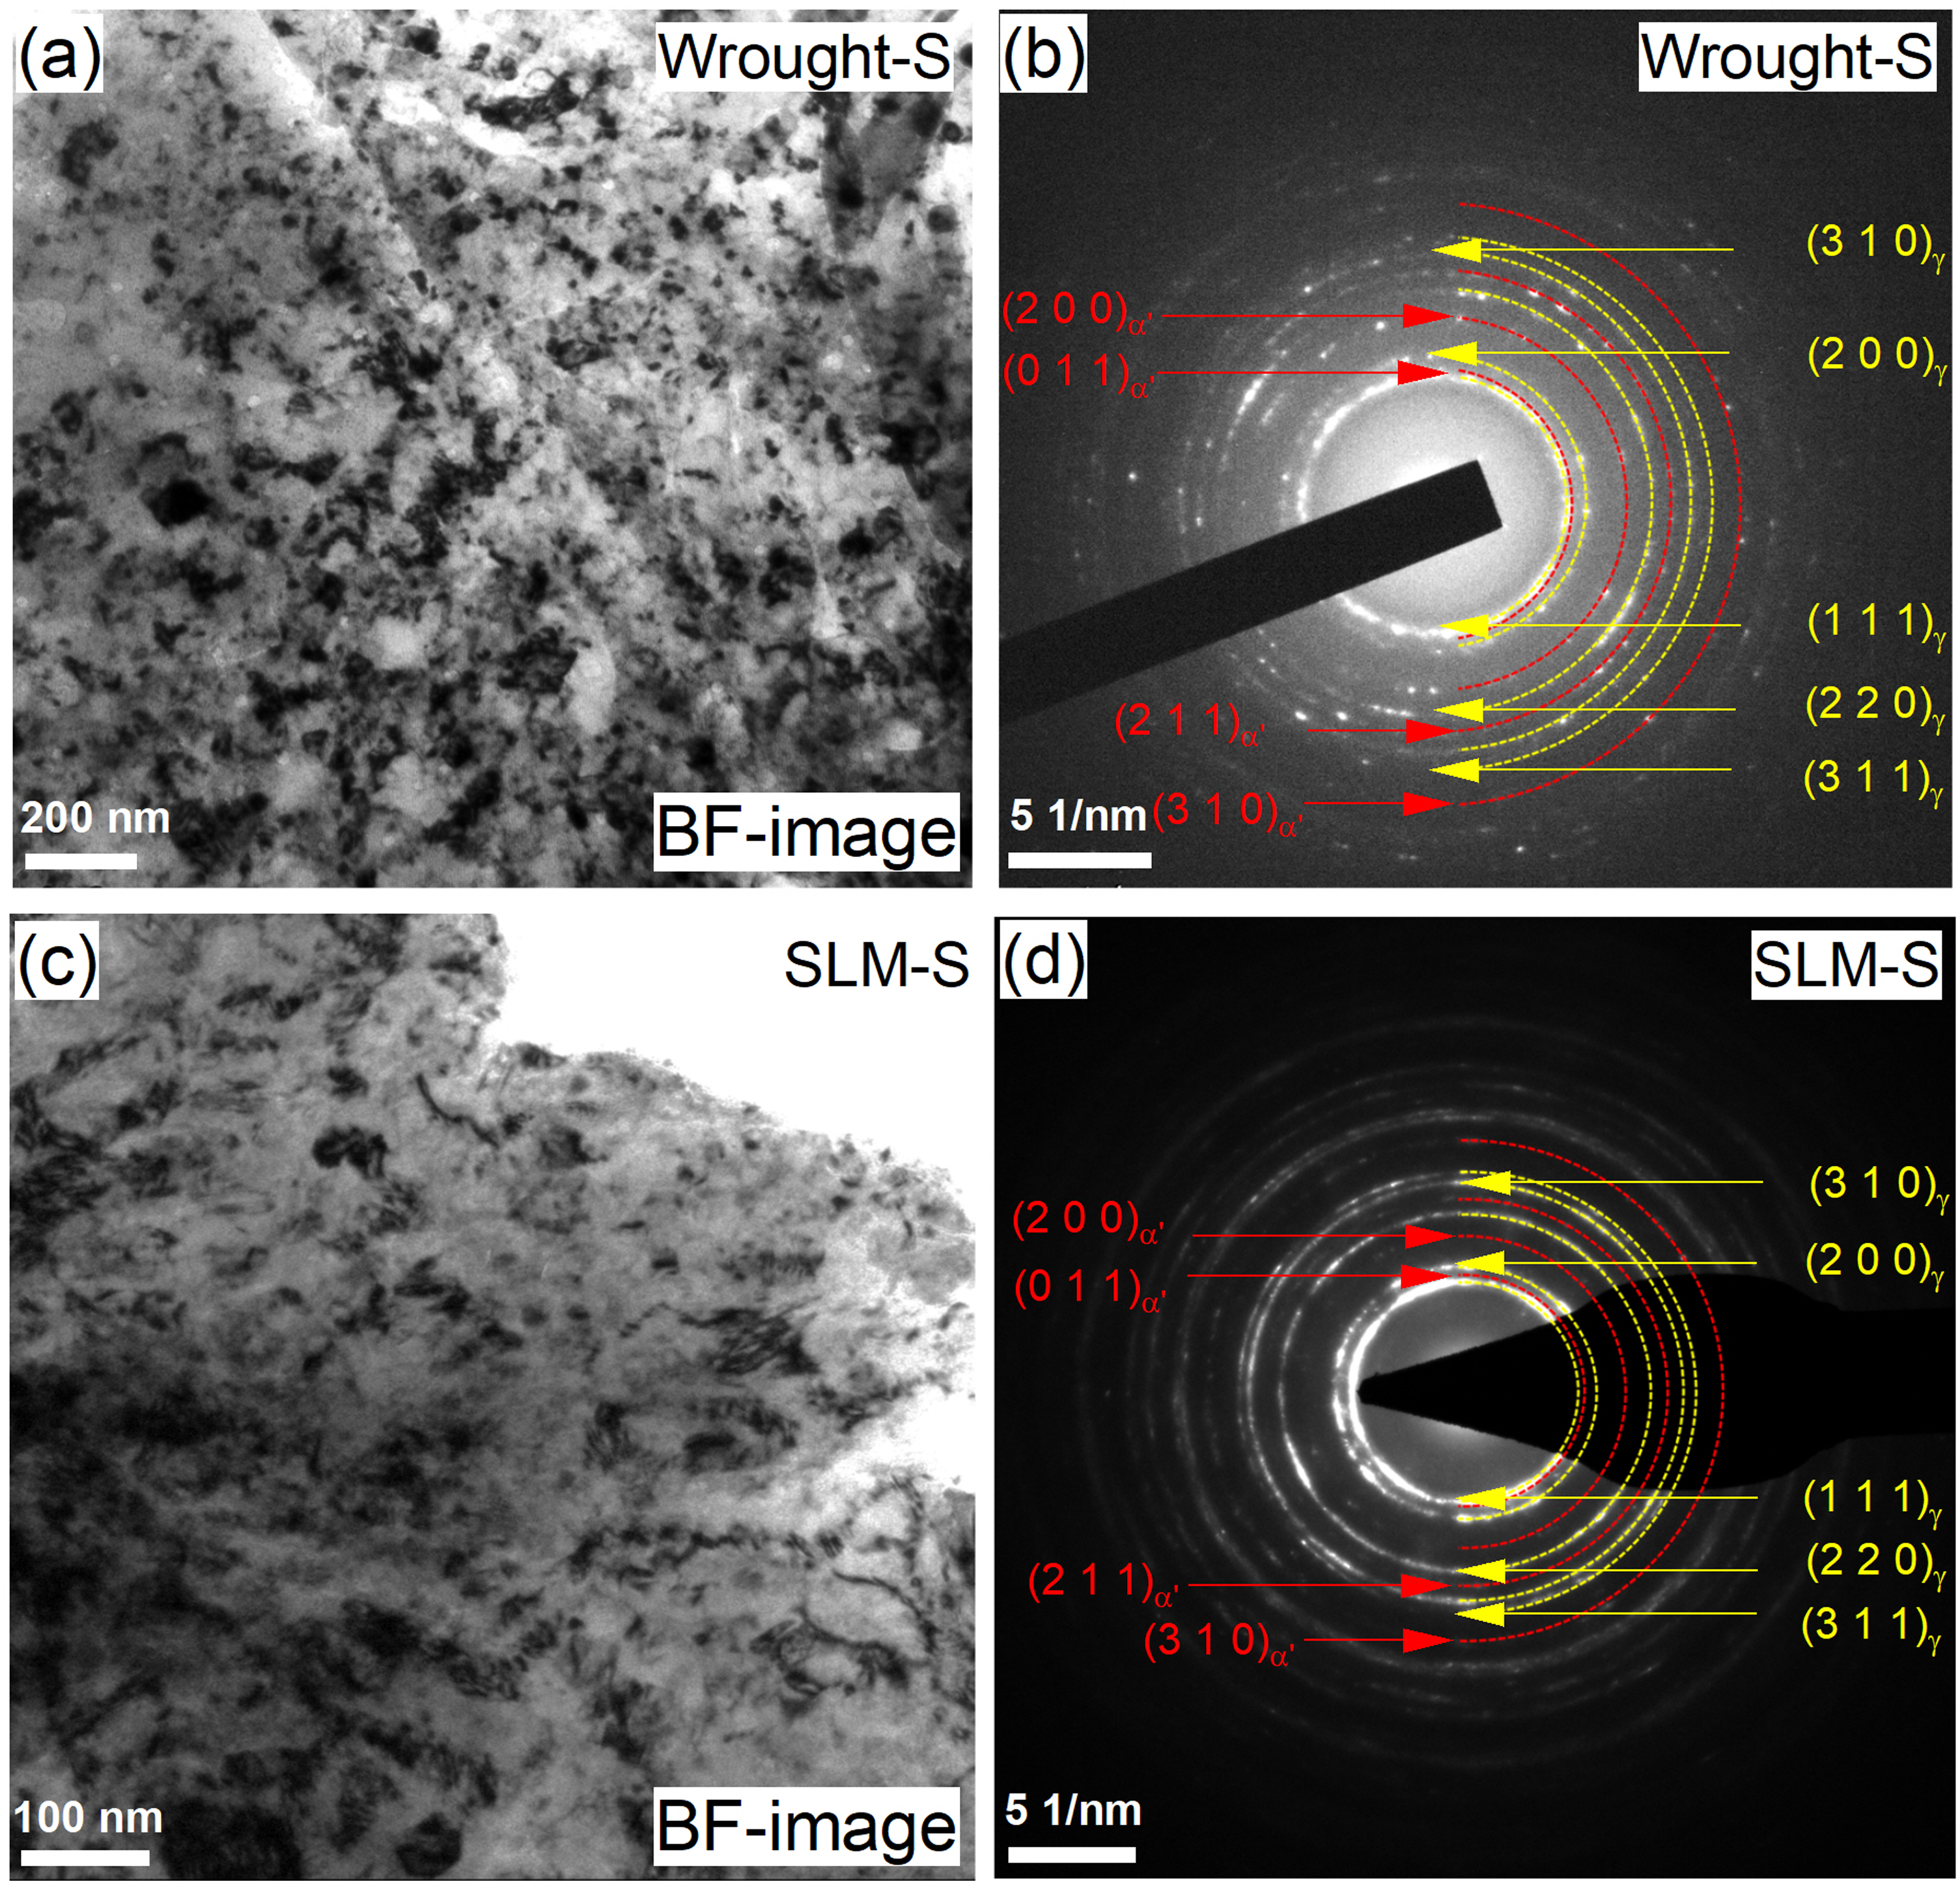
TEM brightfield image of the SMATed (a) wrought and (c) SLM specimens' surface and thecorresponding (b)–(d) SAED patterns.
The specimens’ XRD patterns are presented in Figure 7(a). Austenite peaks are observed in all specimens. Under non-SMATed conditions, only γ-Fe (Reference code, COD:96-901-5072) is present in the SLM specimens. Nevertheless, ∼6% ferrite phase is visible in the non-SMATed wrought specimen, which is likely to be present in the as-received condition (due to the former metal working operation) and retained even after annealing or formed during mechanical polishing. Following the SMAT process, the wrought specimen exhibits ∼26% α’ phase (Reference code, COD:96-901-3476) (which is also called deformation-induced martensite (DIM)). Conversely, XRD results of the SMATed SLM specimen do not reveal such phase transformation, consistent with prior literature22,29,44 and the SAED pattern shown in Figure 6(d).
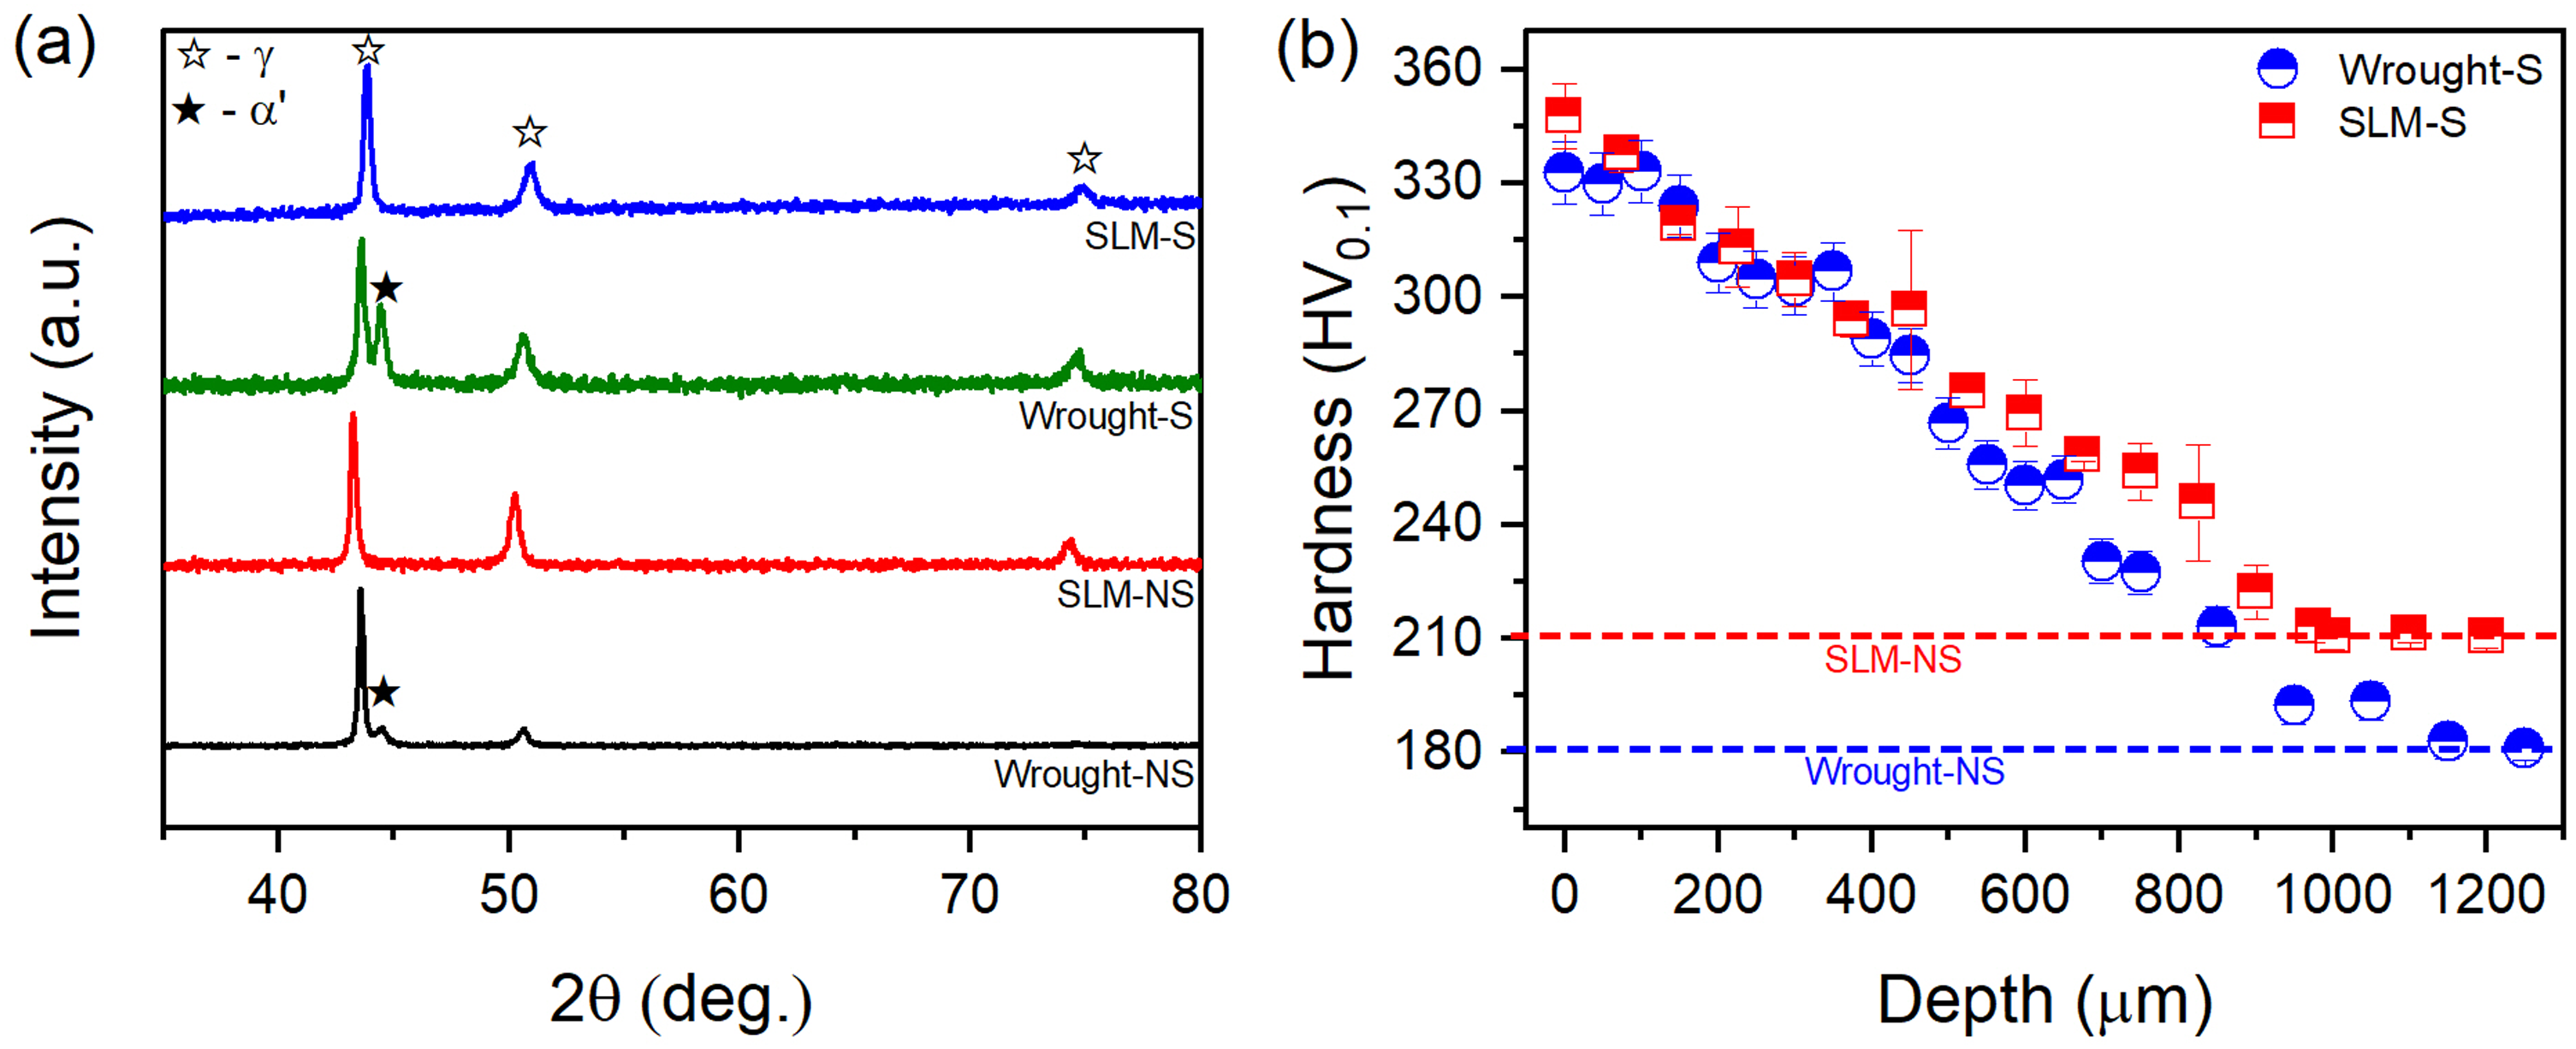
(a) XRD spectra of non-SMATed and SMATed specimens. (b) Hardness-depth profiles of SMATed specimens.
Significant peak broadening is noted after the SMAT process. The Scherrer equation (equation (1)) is utilised to calculate the average crystallite size of the SMATed wrought and SLM specimens, which is ∼26 nm and ∼18 nm, respectively.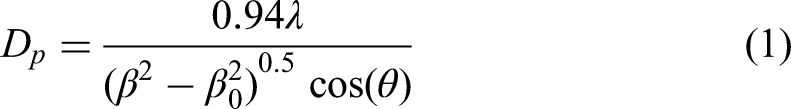
Figure 7(b) exhibits the SLM specimen's higher hardness (∼210 HV0.1) than the wrought specimen (∼180 HV0.1) in the non-SMATed condition due to the smaller grain size (Figure 3(e)) and higher GND (Supplemental Figure S2). Following the SMAT process, both specimens display a gradient in hardness up to a ∼1000 µm depth. A gradient in the property is associated with the microstructural gradient, as seen in Figure 4(c)–(d), Supplemental Figure S4 and Figure 5(a). The maximum hardness of ∼332 and ∼347 HV0.1 is observed near the deformed surface of wrought and SLM specimens, respectively, which is about 1.7–1.8 times the non-SMATed specimens’ hardness.
Passivation behaviour
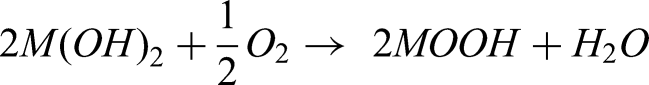
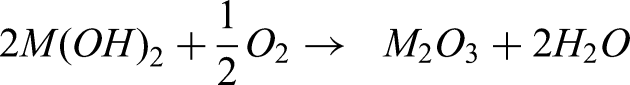
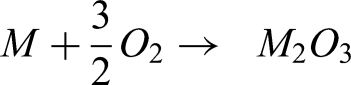
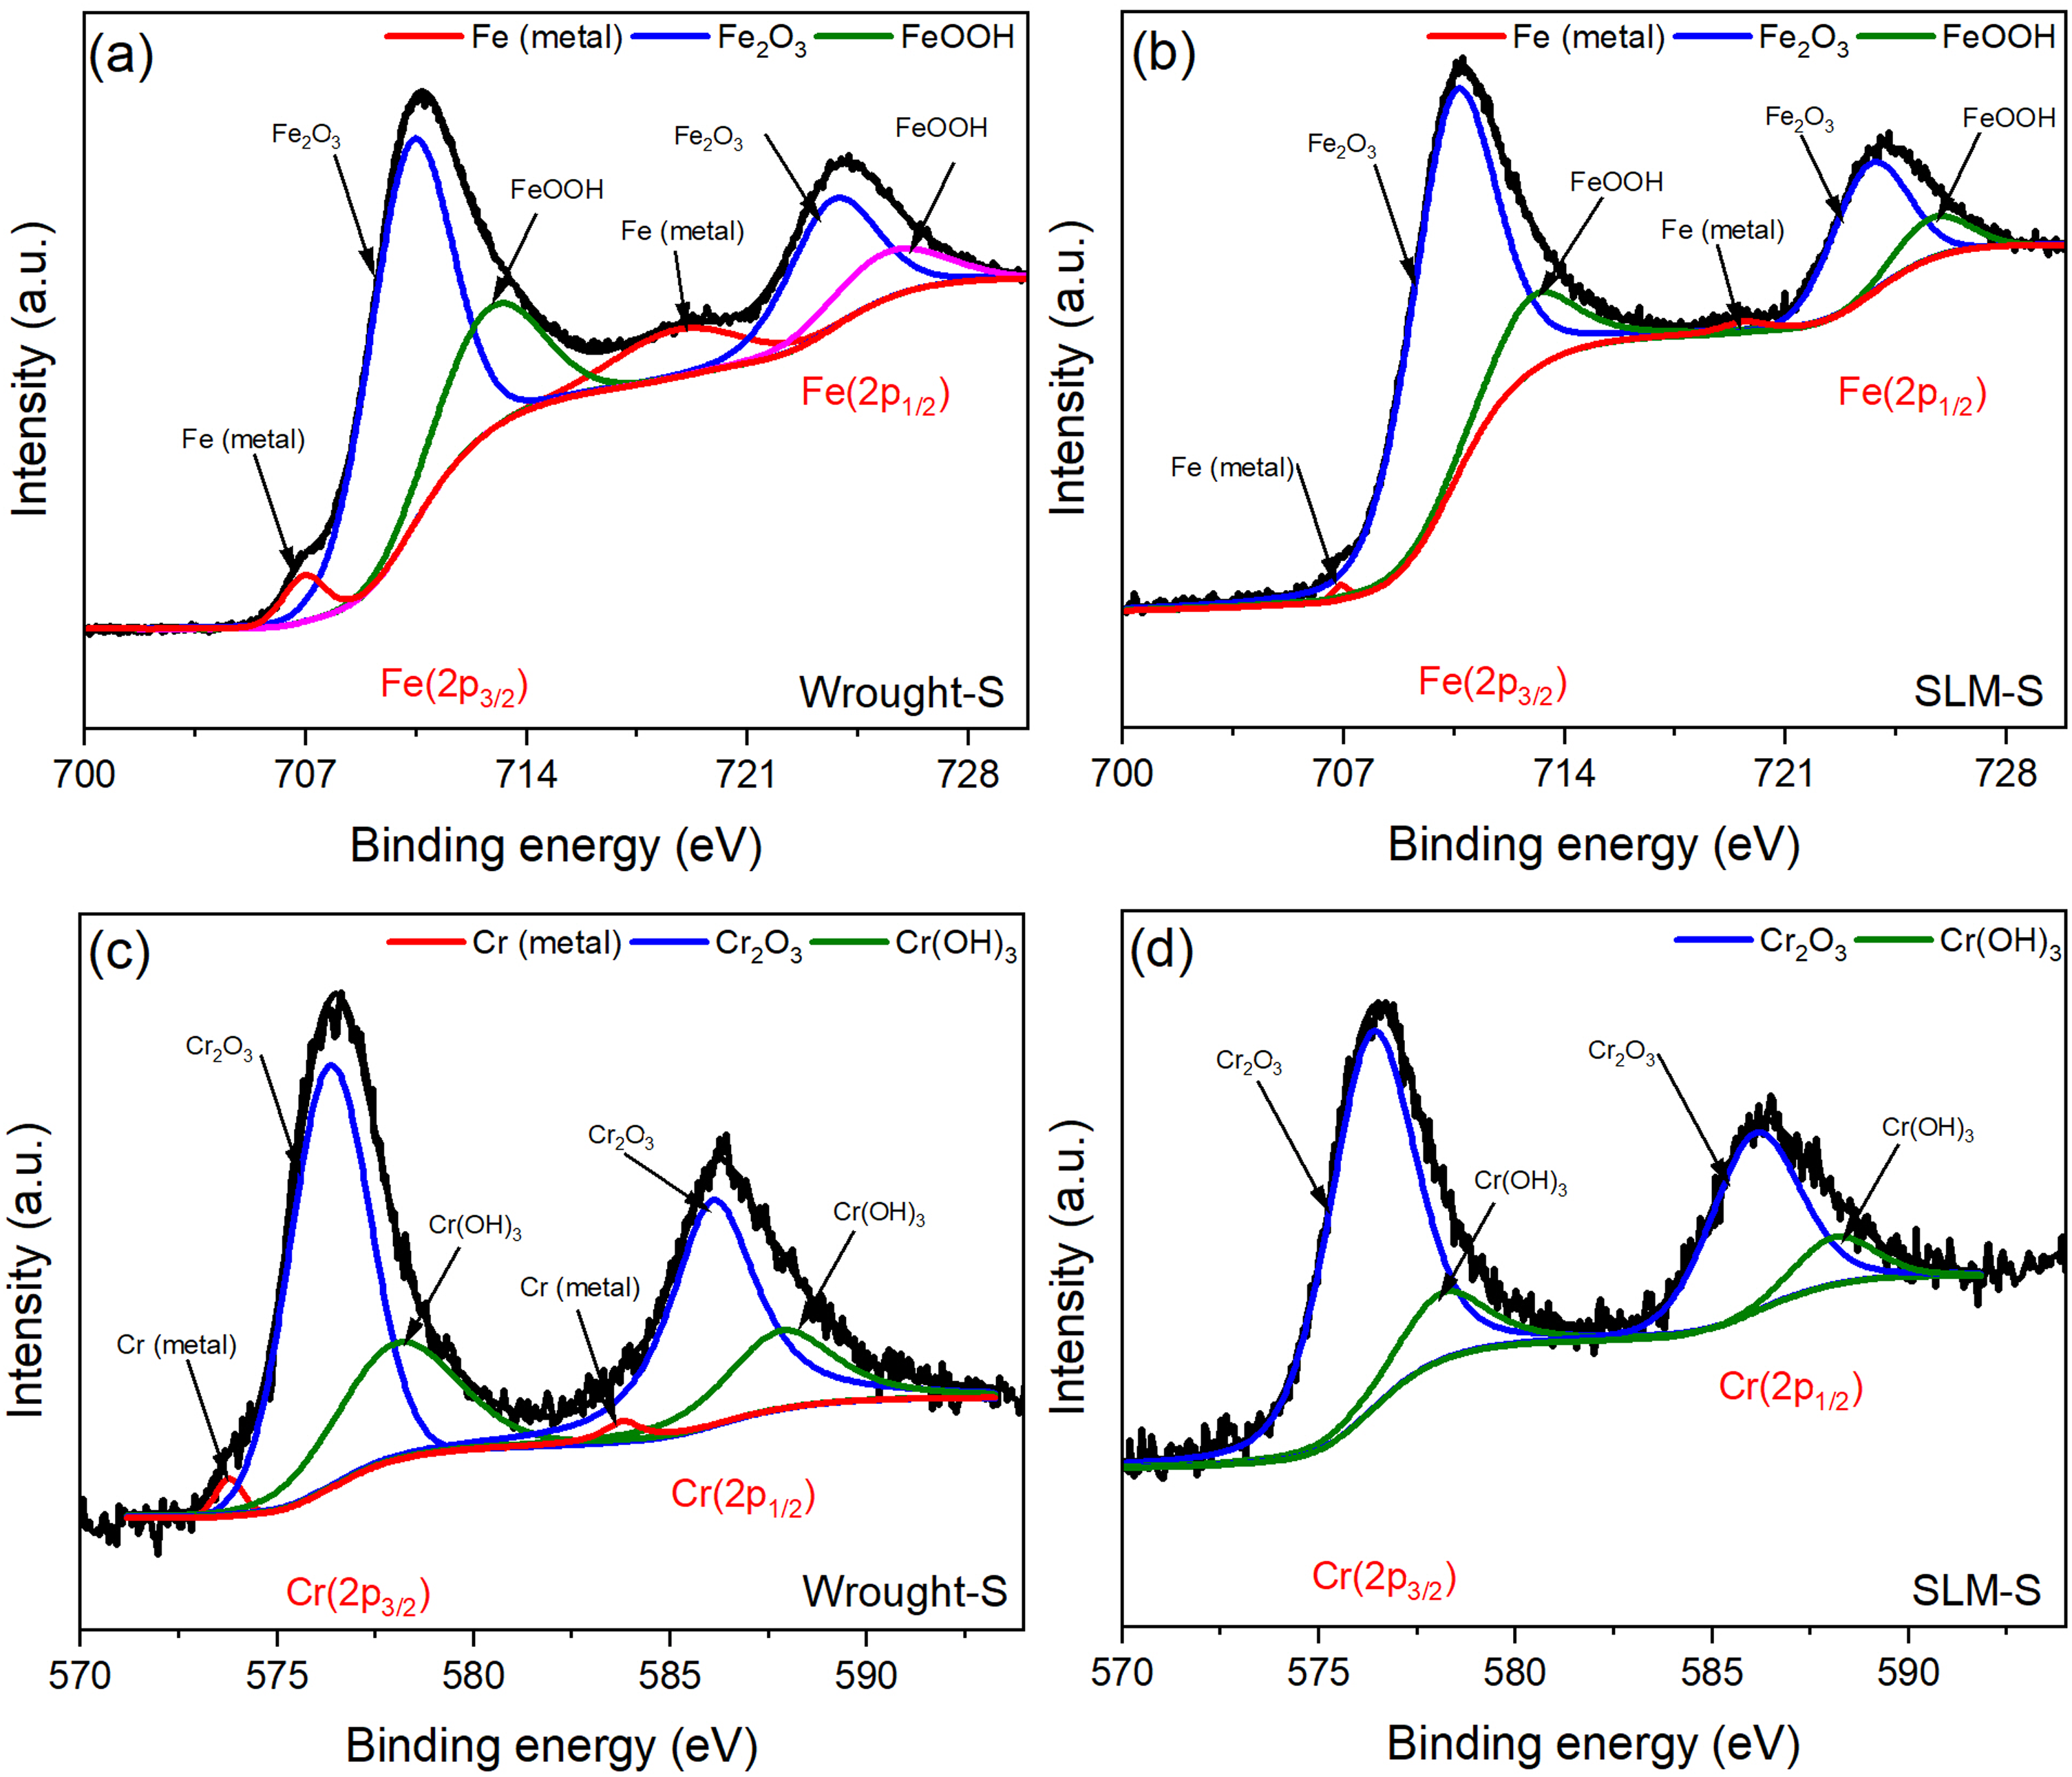
Microstructure is vital in controlling the passive layer formation. Since the microstructure of the examined specimens is different from each other (Refer to “study of microstructure” section), alteration in the passivation behaviour is possible. Therefore, the XPS analysis of these specimens is helpful. The deconvoluted XPS spectra (2p3/2 and 2p1/2) of Cr and Fe for the non-deformed and deformed specimens are shown in Figures 8 and 9, respectively. Typically, the films that form on the material's surface due to Fe and Cr in it consist of either Fe2+ or Fe3+ ions and Cr2+ or Cr3+ ions, respectively. These films form through a series of chemical reactions. Initially, the material undergoes oxidation, oxidising metal atoms ( Oxidation of M to M2+: Formation of metal hydroxide (M(OH)2): Hydroxylation to M(OH)3: Dissociation of M(OH)3 into metal oxyhydroxide (MOOH): Formation of metal oxyhydroxide (MOOH): Formation of metal oxide (M2O3): Direct oxidation of M to metal oxide (M2O3):


XPS results (Fe and Cr spectra) of the non-SMATed specimens.
XPS results (Fe and Cr spectra) of the SMATed samples.
These reactions illustrate the various pathways through which the passive layer comprises metal ions and metal oxides/hydroxides and the oxidation states of Fe and Cr present in the material influence it.
Cr 2p3/2 and 2p1/2 spectra show three distinguished peaks corresponding to Cr0 (metal), Cr2O3 (Cr3+) and Cr(OH)3 (Cr3+). Likewise, the Fe 2p3/2 and 2p1/2 spectra show the peaks corresponding to Fe0 (metal), Fe2+/3+ in FeOOH and Fe3+ in Fe2O3. The relative amounts (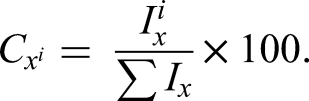
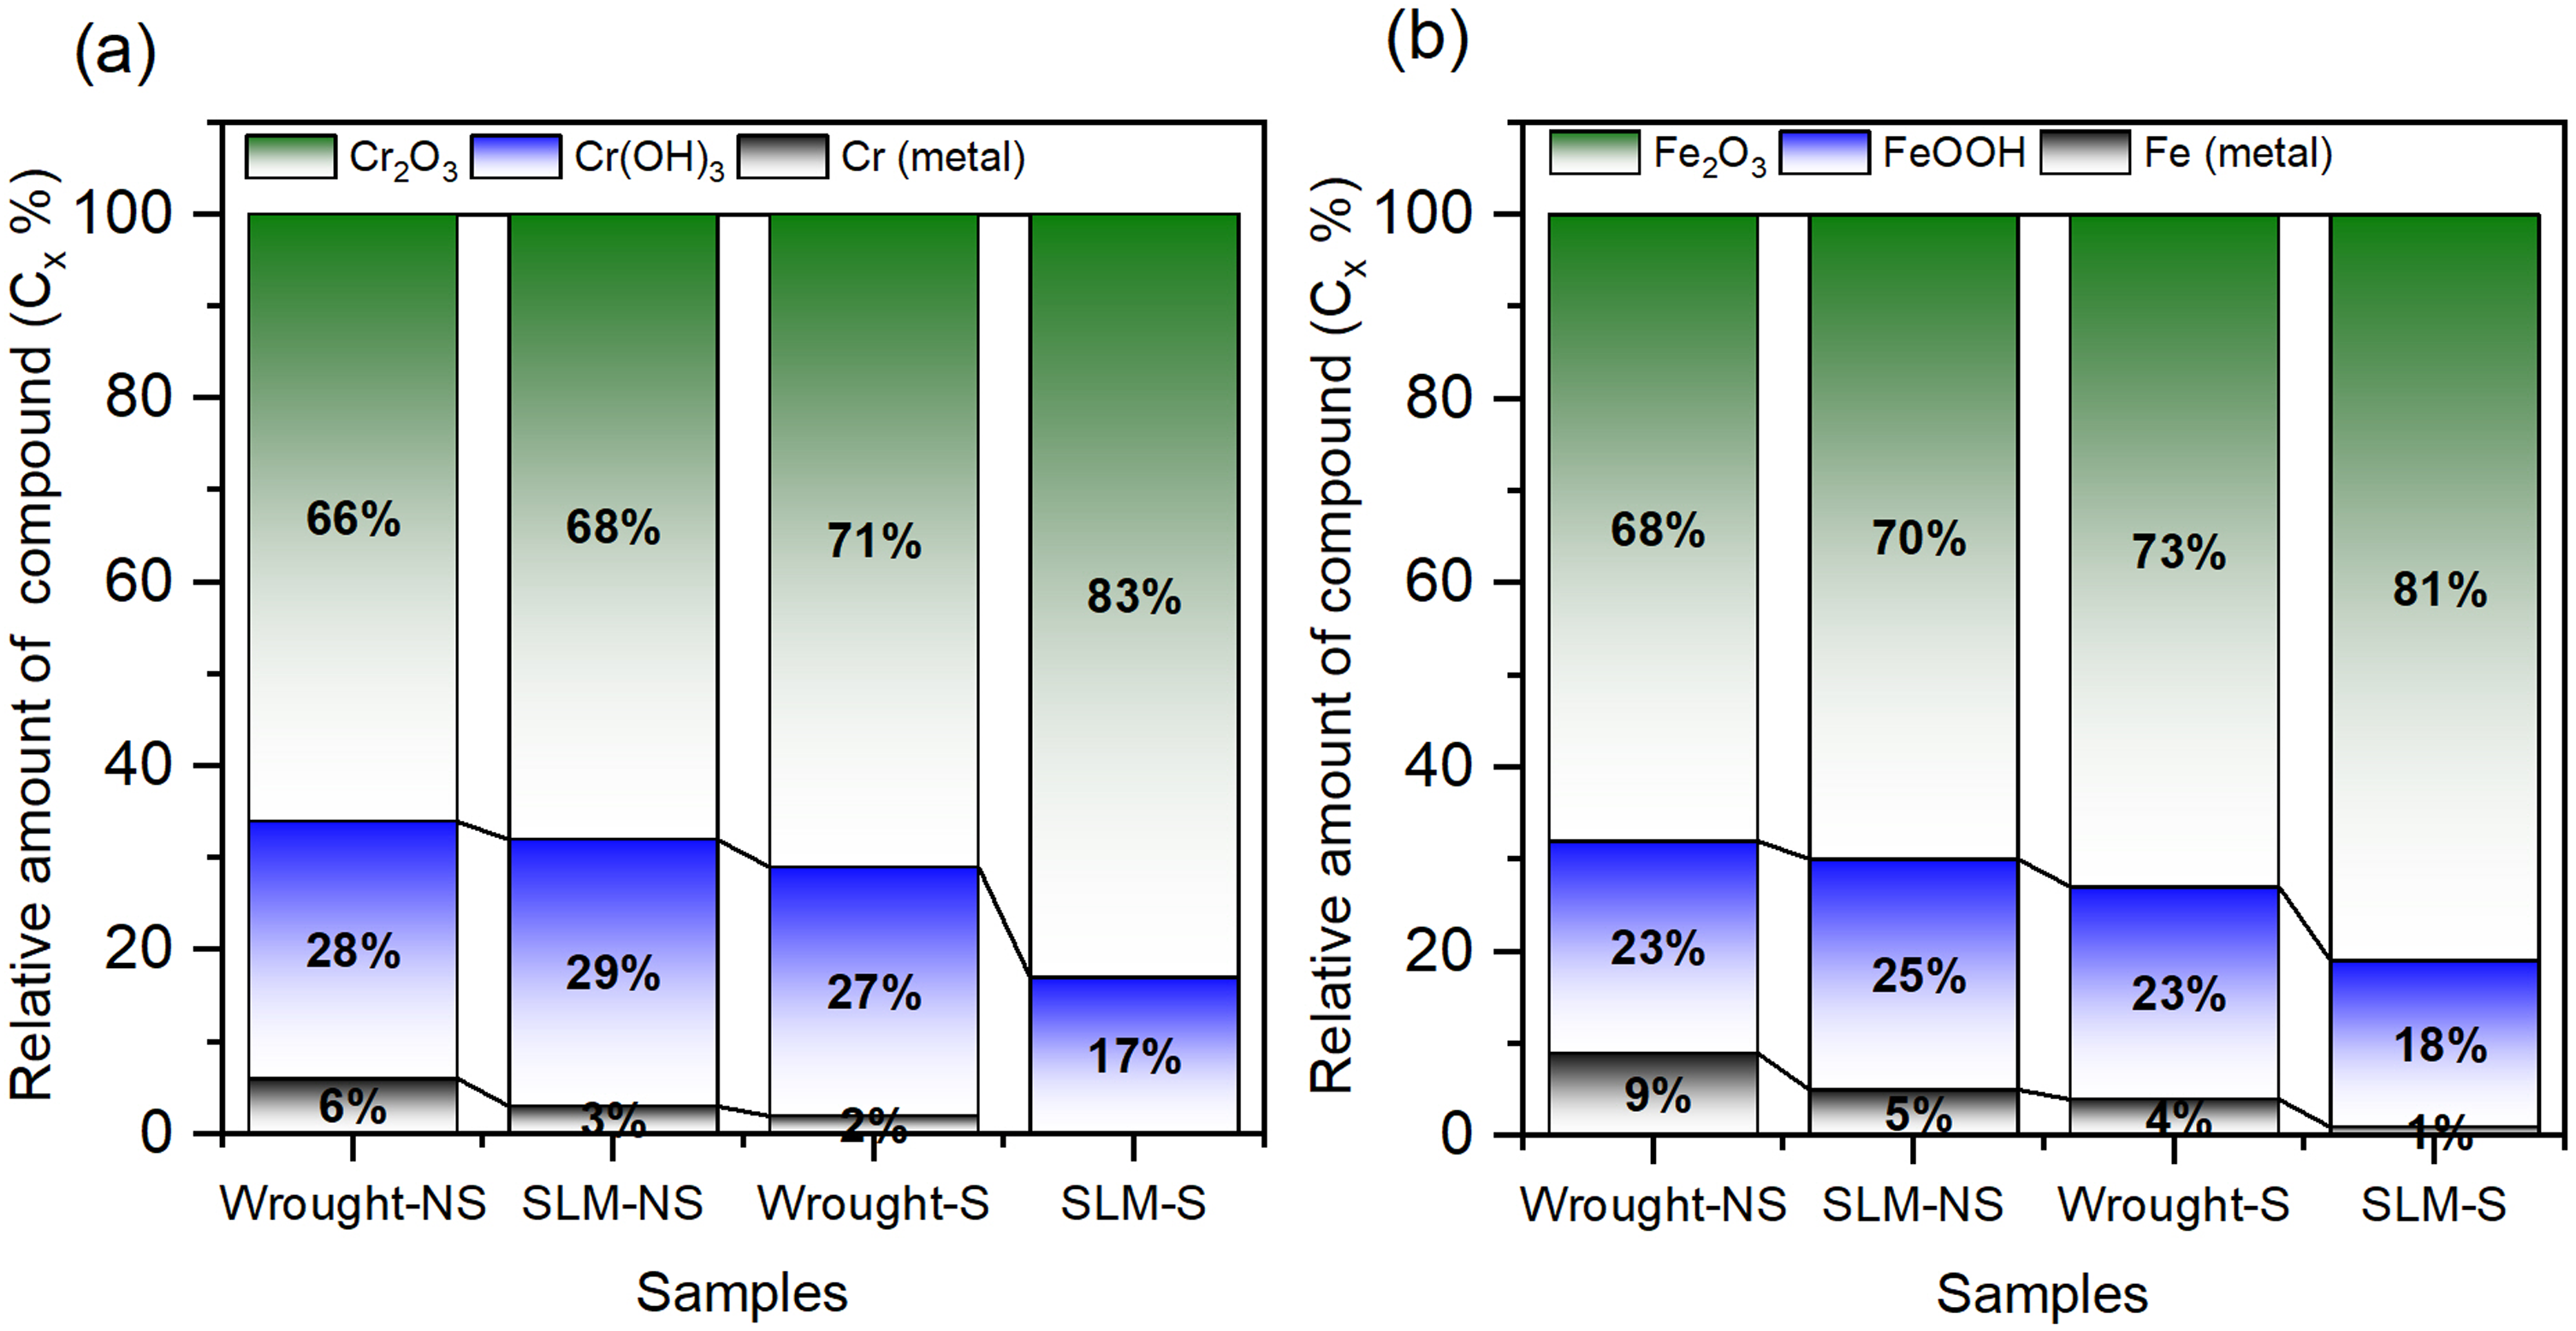
The amounts of compounds (
After the SMAT process, a decrease in the intensity of Cr0 and Fe0 peaks is observed for wrought and SLM specimens (Figures 9 and 10). Moreover, the proportion of stable oxides is increased due to the SMAT (Figure 10). The SMATed SLM specimen shows the smallest proportion of Cr0 and Fe0 and the largest proportion of the stable oxides (Cr2O3 and Fe2O3) among all specimens. During SMAT, the grain size near the surface reduces (Figure 6) and the average dislocation density increases (Supplemental Figures S2 vs. S4),37,48 which contributes to supplementary sites for nucleating the passive layer and enhances the outward Cr diffusion and inward oxygen migration,29,33,34,47 leading to an improved passivation ability of the SMATed specimens. Further, the finer grains (Figure 6) at the surface enable the superior passivation behaviour of the severely deformed SLM specimen than the wrought counterpart.
Corrosion behaviour
In the literature, different methods/tests were used to study/compare the corrosion behaviour of the materials. However, the current study has focused on electrochemical tests, which are widely recognised and accepted methods for evaluating corrosion resistance in a relatively shorter time frame. These tests provide valuable quantitative data on crucial corrosion parameters, such as corrosion rate and passivation behaviour, allowing eloquent comparisons between different materials and conditions. Moreover, electrochemical tests provide insights into the mechanisms underlying corrosion behaviour, such as the formation and breakdown of passive films.
The passive film developed on the specimens can influence the corrosion characteristics; therefore, the corrosion behaviour of the specimens is deliberated using electrochemical tests (involving OCP, linear polarisation, EIS and MS analysis) in a 0.6 M NaCl electrolyte. OCP represents a potential developed after the specimen achieves equilibrium with the electrolyte and it is calculated using a reference electrode. Figure 11(a) illustrates the OCP distribution over time for the investigated specimens. The steady-state OCP values over the 3600 s immersion period affirm the passive film's establishment on all specimens. Notably, among all specimens, the wrought-NS specimen exhibits the lowermost OCP of −317 mV, which increases to −234 mV for the SLM specimen (Figure 11(a)). This positive shift in OCP is accredited to a stable and thicker passive film formation on the SLM specimen (Refer to the “passivation behaviour” section). The OCP shifts further towards the positive potential after SMAT processing (Figure 11(a)), implying an enhanced passivation behaviour of the stainless steel. The SMATed SLM specimen reveals the highest OCP among all specimens. These observations align well with the findings from the XPS study (Refer to the “passivation behaviour” section).
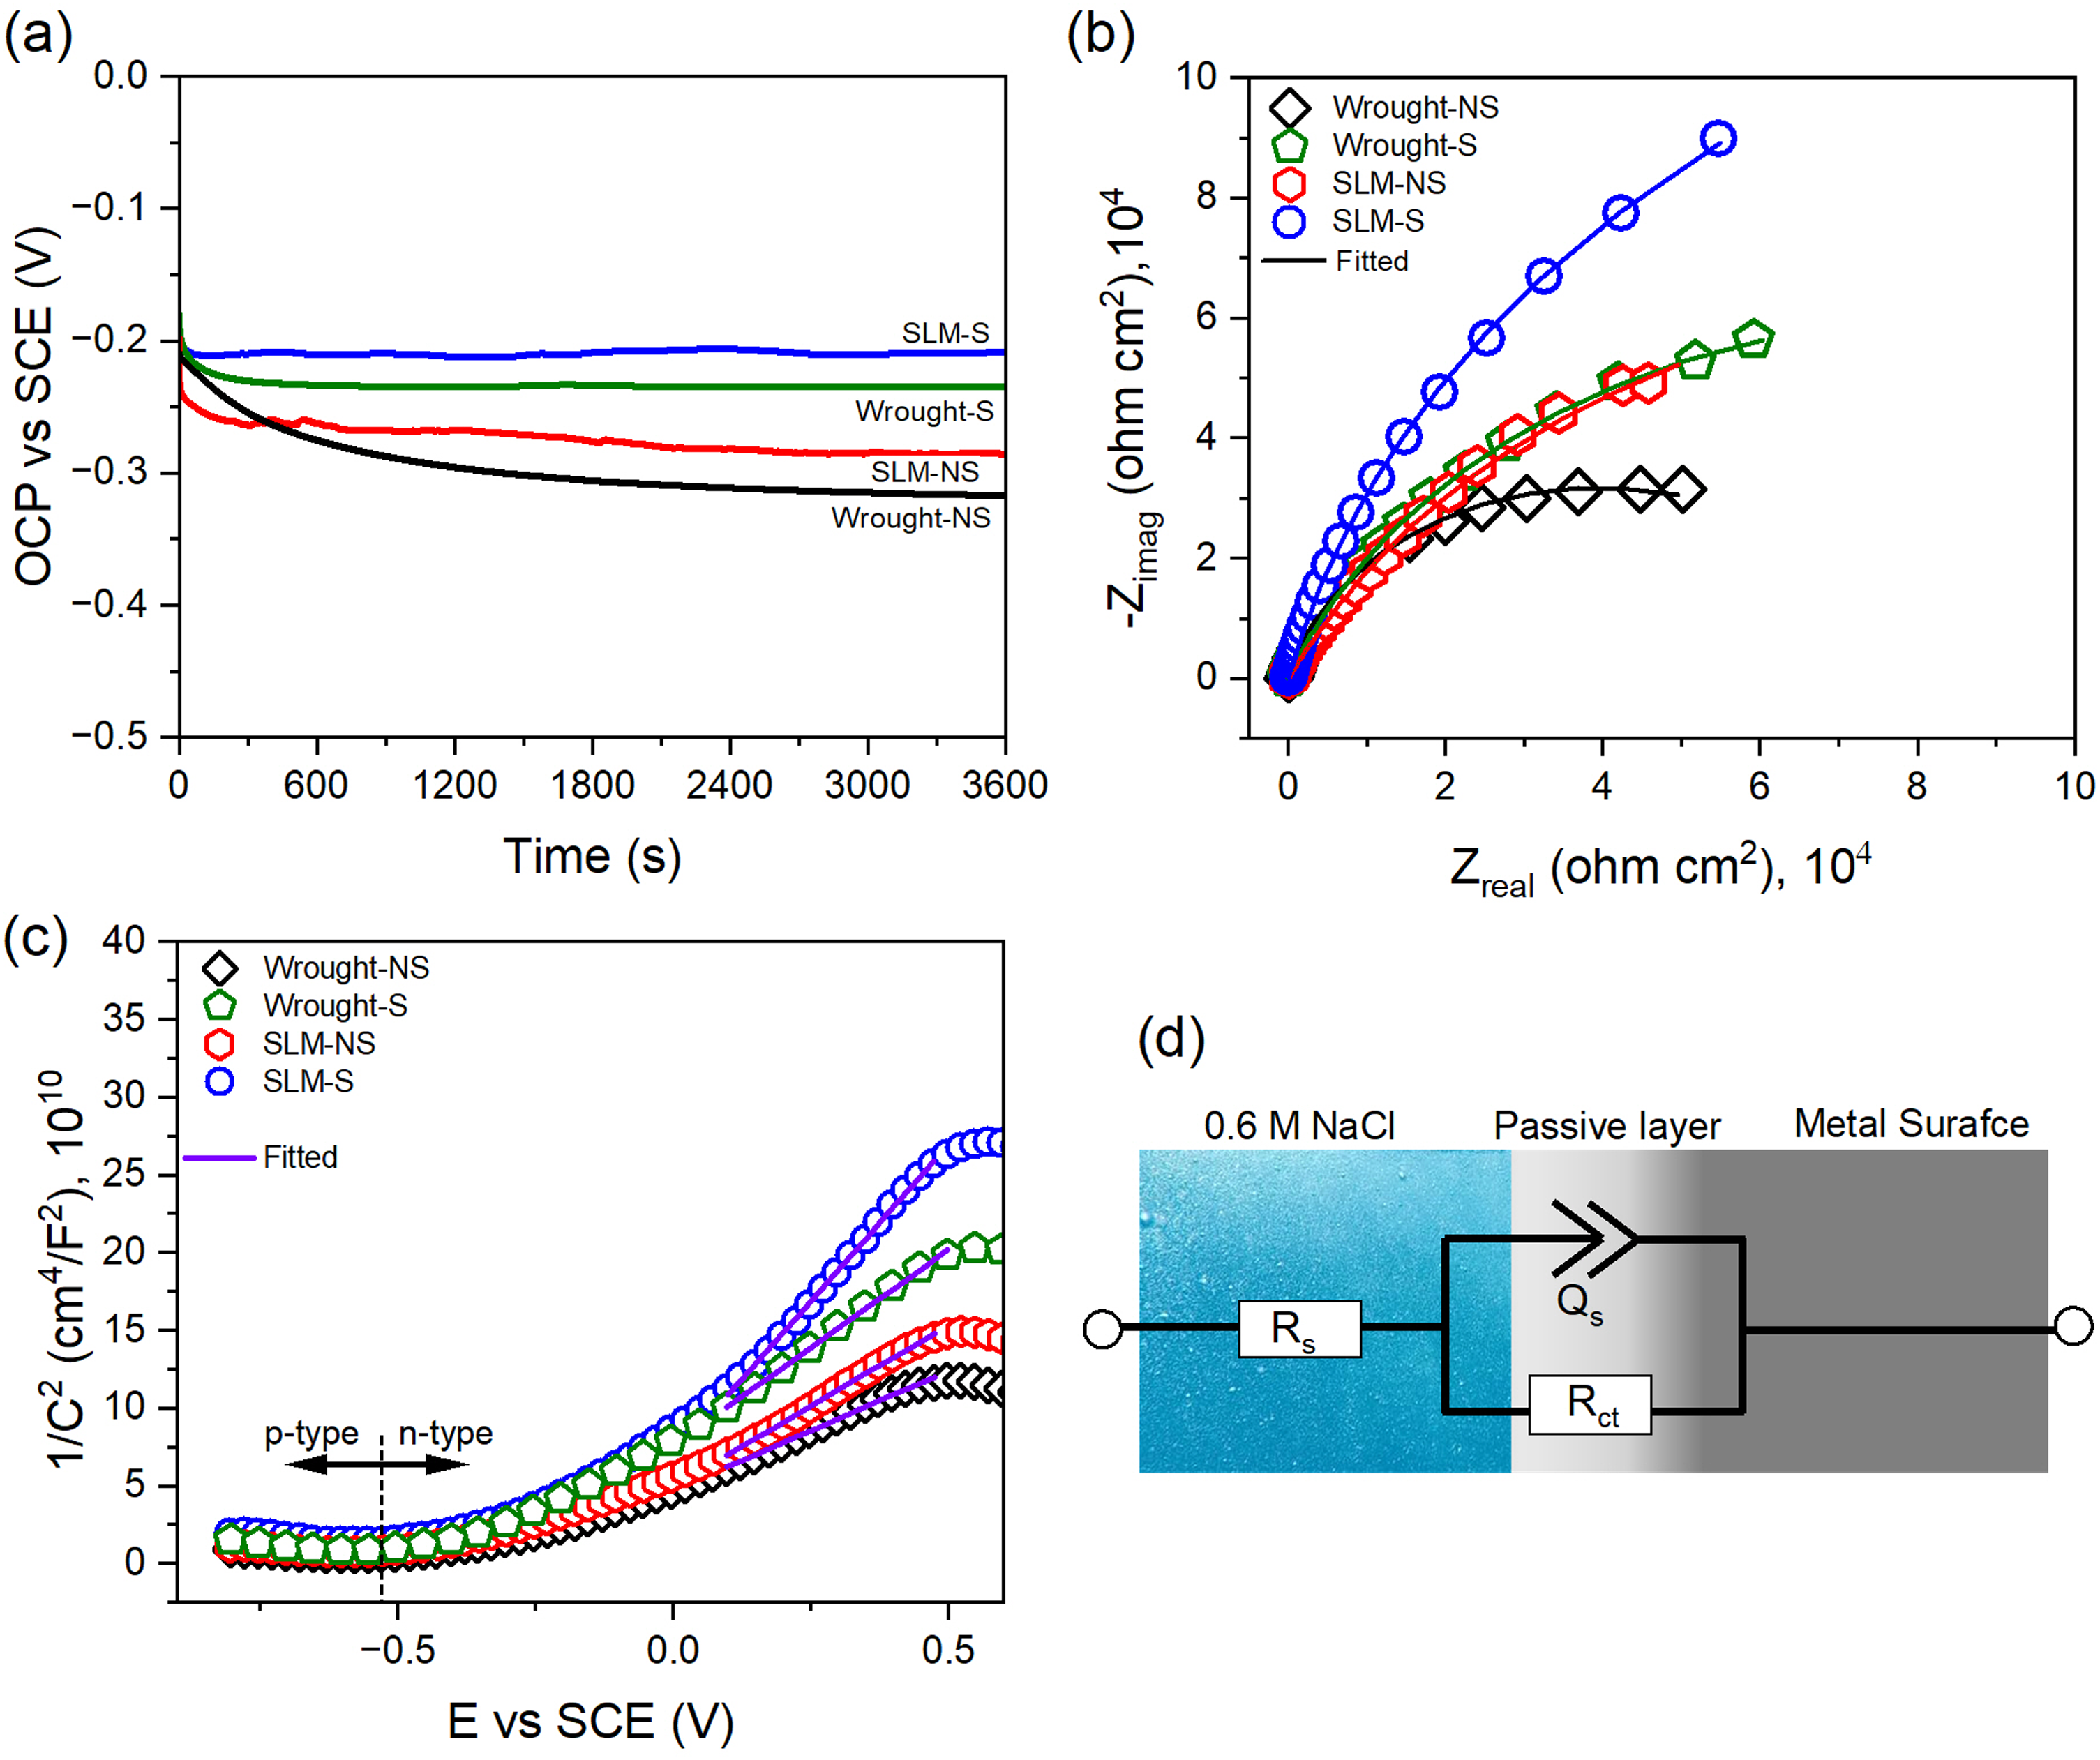
Electrochemical results of different specimens: (a) variation of OCP with time, (b) Nyquist plots, (c) MS profiles and (d) the fitted equivalent circuit to the EIS results (presented in (b)).
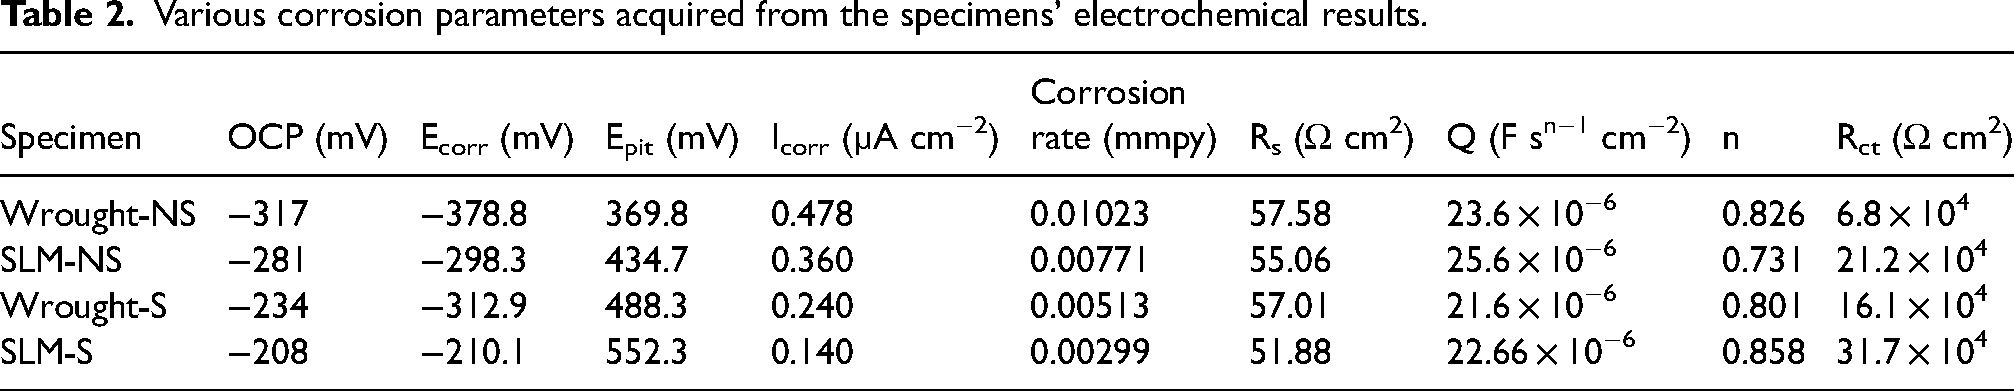
Figure 11(b) shows the Nyquist plots, illustrating the progression of impedance with frequency for each sample. For further analysis, an equivalent electrical circuit, as shown in Figure 11(d), is applied to the EIS results (Figure 11(b)), enabling the prediction of various corrosion performance parameters detailed in Table 2. All impedance spectra exhibit a constant phase element (CPE) behaviour, characterised by an incomplete semicircle. A high impedance and charge transfer resistance (Rct) values (as indicated by a larger semicircle radius) of the passive layer signifies a heightened resistance of the material to corrosion. Compared to the non-SMATed wrought specimen, the non-SMATed SLM specimen displays a larger capacitive semicircle radius. Following the SMAT, a notable increase in the radius is observed; here, the SMATed SLM specimen shows the maximum radius. The EIS results corroborate well with the OCP data (Figure 11(a)) and passivation response (Refer to the “passivation behaviour” section).
Various corrosion parameters acquired from the specimens’ electrochemical results.
MS measurements conducted after the OCP measurements assess the passive film's semiconducting properties. These measurements provide crucial insights into the film's corrosion resistance ability (by analysing capacitance curves concerning electrode potential) and indicate the charge distribution within the passive film. As per the M-S theory, the n-type and p-type semiconductors’ space charge capacitance is determined by Eqs. (2) and (3), respectively.
49
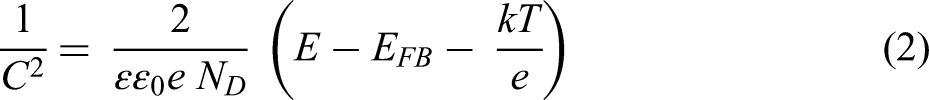
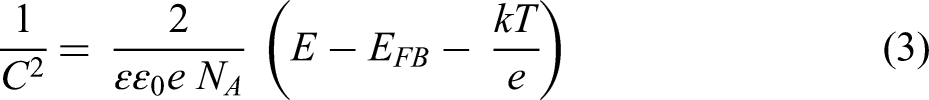
Figure 11(c) displays the M-S results for the passive film on the specimens. These were attained by scanning the potential from −0.8 to 0.6 V at 1 kHz. The curves exhibit p-type and n-type semiconductor behaviour within the applied voltage range. Negative and positive slopes of the M-S plots are observed for 316L stainless steel in the relatively lower and higher applied potentials, respectively. The positive slope of the M-S plots signifies the passive films’ n-type semiconducting behaviour, while a negative slope indicates p-type semiconducting behaviour. By analysing the slope using equation (2), the donor concentration (ND) can be derived. It is evident that the slope is higher for the SLM specimen than the wrought counterpart and after SMAT, it further increases. This trend indicates a lower donor concentration for the SLM specimen (∼5.65 × 10¹⁹ 1/cm³) than the wrought specimen (∼7.64 × 10¹⁹ 1/cm³). Following SMAT, the donor concentration is further reduced (∼4.67 × 10¹⁹ 1/cm³ for the wrought and ∼2.94 × 10¹⁹ 1/cm³ for SLM). Additionally, by utilising the slope and equation (3), the acceptor concentration (NA) can be derived, which suggests a lesser hole concentration for the SLM specimen (∼3.72 × 10²⁰ 1/cm³) compared to the wrought specimen (∼4.46 × 10²⁰ 1/cm³). The hole concentration is further reduced after SMAT (∼2.48 × 10²⁰ 1/cm³ for the wrought and ∼2.29 × 10²⁰ 1/cm³ for SLM). This reduction in donor density and hole concentration in the semiconducting passive film increases the charge transfer resistance (Table 2), thereby reducing the corrosion tendency of the SMATed SLM alloy.
The linear polarisation results, illustrated in Figure 12, depict the current-potential relationship in the electrochemical cell. Fitting of the Tafel plots provides different corrosion parameters, which are presented in Table 2. The corrosion rate for all specimens is further calculated using Icorr, as equation (4) described.
Comparison of linear polarisation curves of different specimens.
In Figure 12(a), the non-SMATed wrought specimen exhibits higher Icorr and lower Ecorr and Epit than the SLM counterpart. Following the SMAT process, both specimens display a reduction in Icorr and an increase in Ecorr and Epit values (Figure 12(b) and (c)). Typically, a higher Ecorr value indicates superior corrosion resistance, while a higher Icorr value implies a higher corrosion rate. Further, a higher Epit value indicates superior pitting corrosion resistance. Hence, a combination of high Epit and Ecorr and low Icorr signifies the relatively robust corrosion behaviour of the alloy. The SMATed SLM sample reveals the lowest corrosion rate of ∼2.99 × 10⁻³ mmpy among all specimens. This behaviour is closely tied to the specimens’ microstructure (Refer to “study of microstructure” section) and passivation (Refer to the “passivation behaviour” section and Figure 11(b) and (c)).
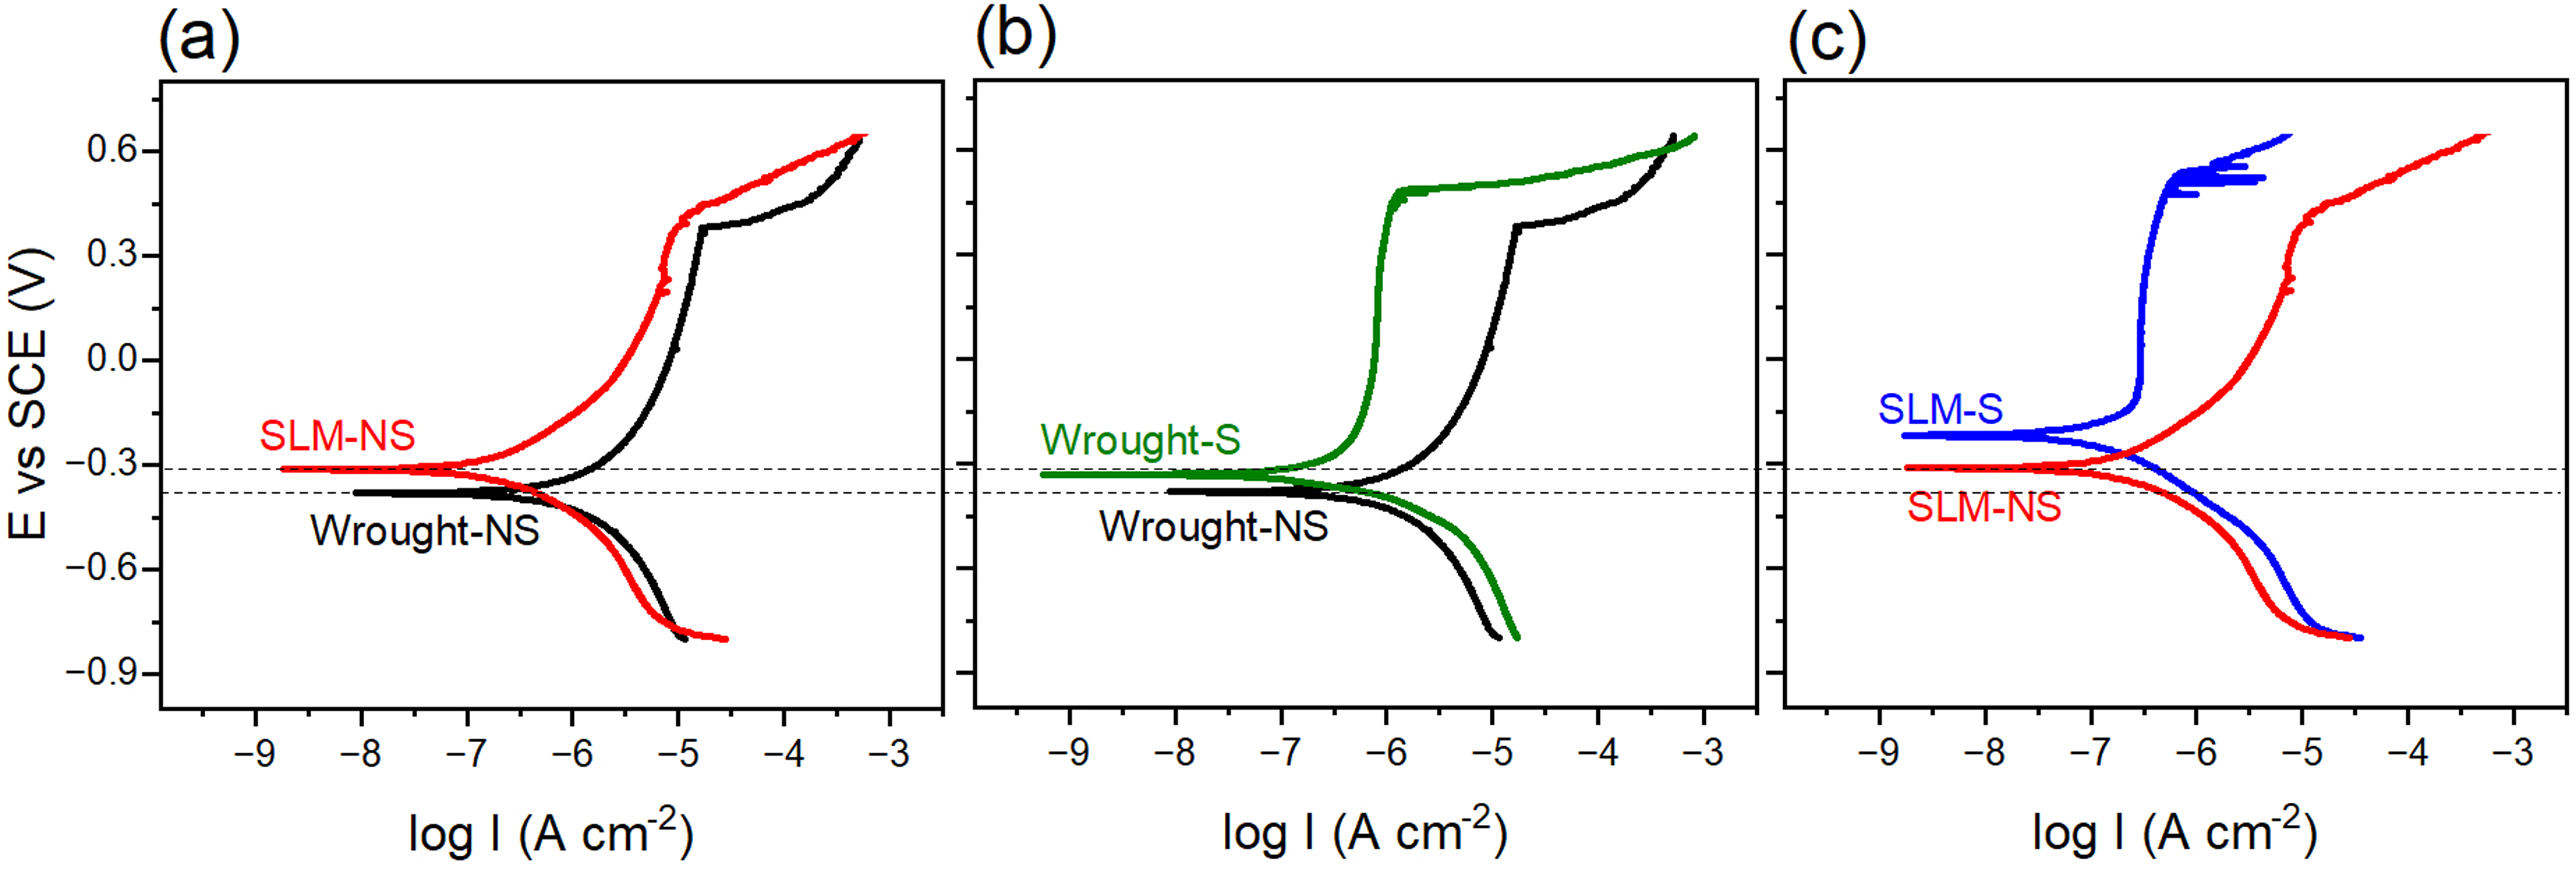
Figure 13 depicts SEM micrographs of the specimens after the corrosion test, revealing localised pitting of the specimens. Wrought specimens show considerably larger pits than the SLM specimens (Figure 13(a) and (c) vs. Figure 13(b) and (d)), suggesting a vital role of microstructure and passivation. A comparative analysis between conventional 316L and SLM 316L reveals a stable and thicker passive film (Figures 8–10) and, consequently, superior corrosion resistance for the SLM sample (Table 2). This comportment is attributed to the higher dislocation density in SLM 316L steel (Supplemental Figure S2). The increased dislocation density facilitates the migration of elements, promotes passivation and lowers the energy barrier for electrochemical reactions. However, in non-SMATed SLM samples, pitting occurs near pre-existing porosity (Figure 13(b)) that developed during solidification (see the core region in Figure 5(b)). This revelation suggests that pre-existing porosity significantly contributes to an increased pit formation in its vicinity, likely due to the passive film breakdown at the porosity region. The SMATed specimens exhibit reduced susceptibility to pitting, as suggested by a higher pitting potential than the non-SMATed sample (Figure 12 and Table 2). Additionally, the corresponding current value is significantly lower in the case of SMATed samples (Figure 12(c)), indicating improved passivation behaviour. Following severe surface deformation, forming a high density of LAGBs (Supplemental Figure S4) leads to a thicker passive film (Figures 8–10). Moreover, the proportion of stable oxides in the passive layer (Figure 10) and its semiconductor behaviour (Figure 11(c)) are altered due to the SMAT. Therefore, the SMATed wrought specimen shows relatively minor signs of pitting (Figure 13(c)) and the SMATed SLM specimen exhibits almost no signs of pitting after the corrosion test (Figure 13(d)), which are attributed to its superior passive layer characteristics (Figures 9–12).
SEM micrographs illustrating the corroded specimens’ surface morphology after linear polarisation study.
Mechanism
The passivation behaviour of the steel is altered due to the influence of microstructural features like grain size and dislocation density (Refer to “study of microstructure” and “passivation behaviour” section). Microstructure and passivation affect the pitting resistance of the steel. SLM specimens have better electrochemical characteristics than their wrought counterparts in the SMATed or non-SMATed conditions (Refer to the “corrosion behaviour” section). However, apart from the nature of the passive film, defects like pre-existing porosity in the SLM specimen have a crucial role in its corrosion behaviour. The possible mechanism of corrosion is elaborated schematically in Figure 14.
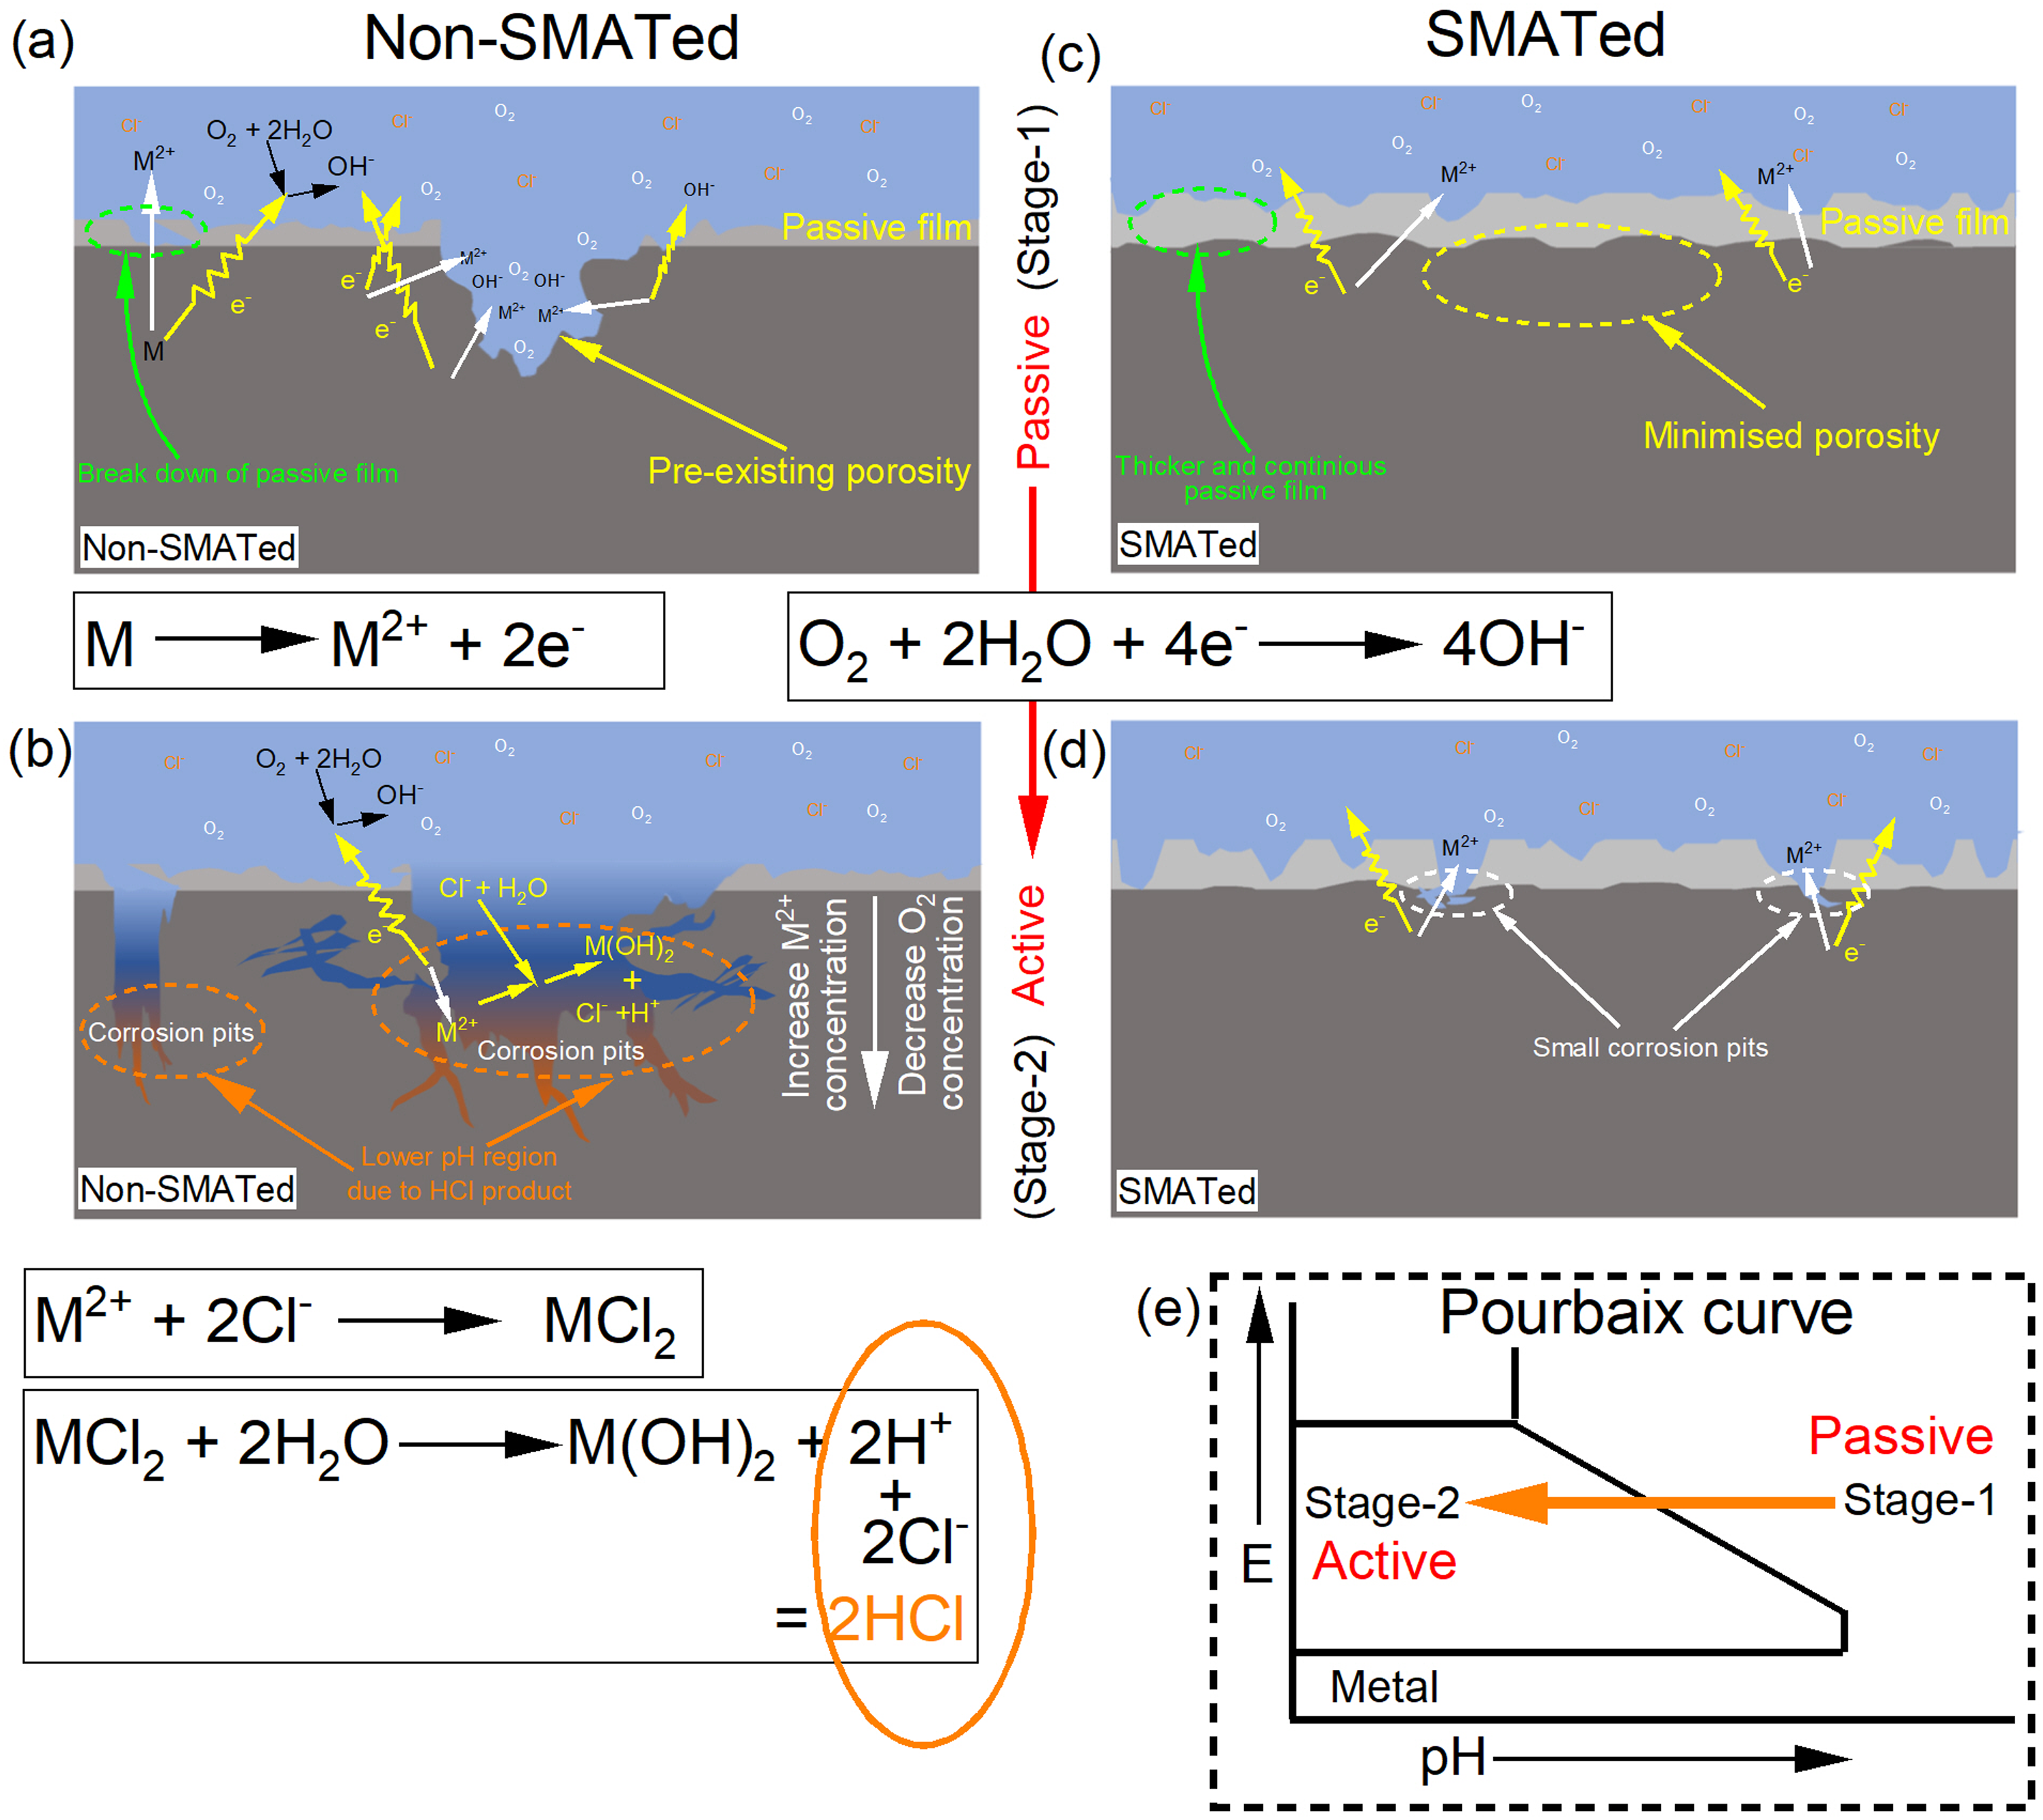
Schematic depiction of non-SMATed and SMATed steel's corrosion mechanism.
Initially, due to discontinuous and thinner passive film on non-SMATed specimens (Figures 8 and 10), the breakdown of the passive layer at the porosity (for SLM specimen) and thinner region of the passive layer (for wrought and SLM specimens) occurs (Figure 14(a)), leading to an anodic reaction. Here, metal atoms dissolve and create large pits on the wrought specimen (having a thinner passive layer) and, conversely, small size pits in the case of the SLM specimen (having a relatively thick passive layer). Such a dissolution of metal releases electrons (

The consequence of SMAT on corrosion behaviour is illustrated in Figure 14(c) and (d). As discussed above, SMAT reduces grain size (Figure 6) and develops a high density of dislocations (Supplemental Figure S4) near the surface. This response increases the passive film's stability and thickness (Figures 9 and 10), slowing the diffusion of corrosive substances towards the metal surface. Moreover, Figure 5(b) demonstrates that the severe plastic deformation during the SMAT process minimises pre-existing porosity, facilitating a continuous passive layer's formation on the surface (Figure 14(c) vs. 14(a)). A decrease in donor/acceptor density (ND/NA) within the passive film (Refer to the “corrosion behaviour” section) boosts charge transfer resistance (Table 2), thereby reducing the overall anodic reaction. In the second stage, small pits develop when the passive film undergoes dissolution (Figure 14(d)). However, due to the nanostructured surface's enhanced passivation tendency (i.e., pronounced self-healing properties of the passive layer, caused by faster nucleation of the film), these pits’ growth is constrained on SMATed specimens (Figure 13). As compared to the SMATed wrought specimen, the SMATed SLM specimen has a higher proportion of stable oxides (Figure 10), lower donor/acceptor concentrations (Figure 11(c)) and higher charge transfer resistance (Table 2). Therefore, the SMATed SLM specimen with smaller grains (Figure 6) outperforms the SMATed wrought specimen (Figure 13(d) vs. 13(c)).
Conclusions
An investigation into the microstructural characteristics and electrochemical behaviour of conventionally manufactured (wrought) and selective laser melted (SLM) 316L steel, with and without SMAT (which is one of the severe surface-deformation techniques), has yielded several notable conclusions in this research:
The microstructural differences exist between the SLM and wrought specimens. SLM specimen has substantially smaller grains (∼40 µm) than the wrought specimen (∼83 µm). Further, a higher dislocation density is observed in the SLM specimen (∼7.2 × 10¹³ m−2) than in the wrought specimen (∼3.7 × 10¹² m−2). The SLM specimens reveal a substantially higher density (∼33%) of LAGBs than the wrought specimen (∼6%). The wrought and SLM specimens respond differently to the SMAT. The average grain size following the SMAT process is ∼42 and ∼32 nm for the wrought and SLM specimens, respectively. The wrought specimen exhibits ∼26% α’-phase (deformation-induced martensite) following the SMAT process. However, the SMATed SLM specimen shows an insignificant presence of the α’ phase. The maximum hardness of ∼332 and ∼347 HV0.1 is observed near the SMAT-processed surface of wrought and SLM specimens, respectively, which is about 1.7–1.8 times the non-SMATed specimens’ hardness. A larger density of grain boundaries and dislocations causes the thicker passive film with a higher share of Cr2O3 and Fe2O3 (stable oxides), causing an improved passivation capability of the SLM specimen than the wrought specimen. Further, the proportion of stable oxides is increased due to the SMAT. MS measurements reveal a reduction in donor density and hole concentration in the semiconducting passive layer, thereby escalating the charge transfer resistance and reducing the corrosion tendency of the SMATed SLM alloy. The SMATed SLM specimen shows the lowest corrosion rate (∼2.99 × 10⁻³ mmpy) among all specimens. Notably, the SMATed SLM specimen shows almost no signs of pitting after the corrosion study. Overall, the passivation behaviour and corrosion resistance of the 316L steel are influenced by microstructure. SLM specimens have better electrochemical characteristics than the wrought counterparts in the SMATed and non-SMATed conditions. However, apart from the nature of the passive film, pre-existing porosity in the SLM specimen has a crucial role in its corrosion behaviour. SMAT is a helpful process in eliminating porosity in the surface region and forming more stable oxides in a thicker passive layer on SLM steel.
Supplemental Material
sj-docx-1-mst-10.1177_02670836241245811 - Supplemental material for Microstructural and electrochemical behaviour of severely surface-deformed 316L steel manufactured by conventional and selective laser melting routes
Supplemental material, sj-docx-1-mst-10.1177_02670836241245811 for Microstructural and electrochemical behaviour of severely surface-deformed 316L steel manufactured by conventional and selective laser melting routes by Vikesh Kumar, Nilesh K. Kumbhar, Manoj D. Joshi, Yuan-Ron Ma, Indrasen Singh and Santosh S. Hosmani in Materials Science and Technology
Footnotes
Acknowledgements
The authors acknowledge Incredible Additive Manufacturing Pvt. Ltd, Pune, for providing the steel samples and the SAIF facility, IIT Bombay (Mumbai), for conducting TEM experiments. VK appreciates Mr Mayur Dhake for his cooperation in EBSD and XRD measurements. The authors thank Prof. Rupesh S. Devan and his group for experimentation and discussion.
Declaration of conflicting interests
The authors declared no potential conflicts of interest with respect to the research, authorship, and/or publication of this article.
Funding
The authors received no financial support for the research, authorship, and/or publication of this article.
Supplemental material
Supplemental material for this article is available online.
References
Supplementary Material
Please find the following supplemental material available below.
For Open Access articles published under a Creative Commons License, all supplemental material carries the same license as the article it is associated with.
For non-Open Access articles published, all supplemental material carries a non-exclusive license, and permission requests for re-use of supplemental material or any part of supplemental material shall be sent directly to the copyright owner as specified in the copyright notice associated with the article.