
Abstract
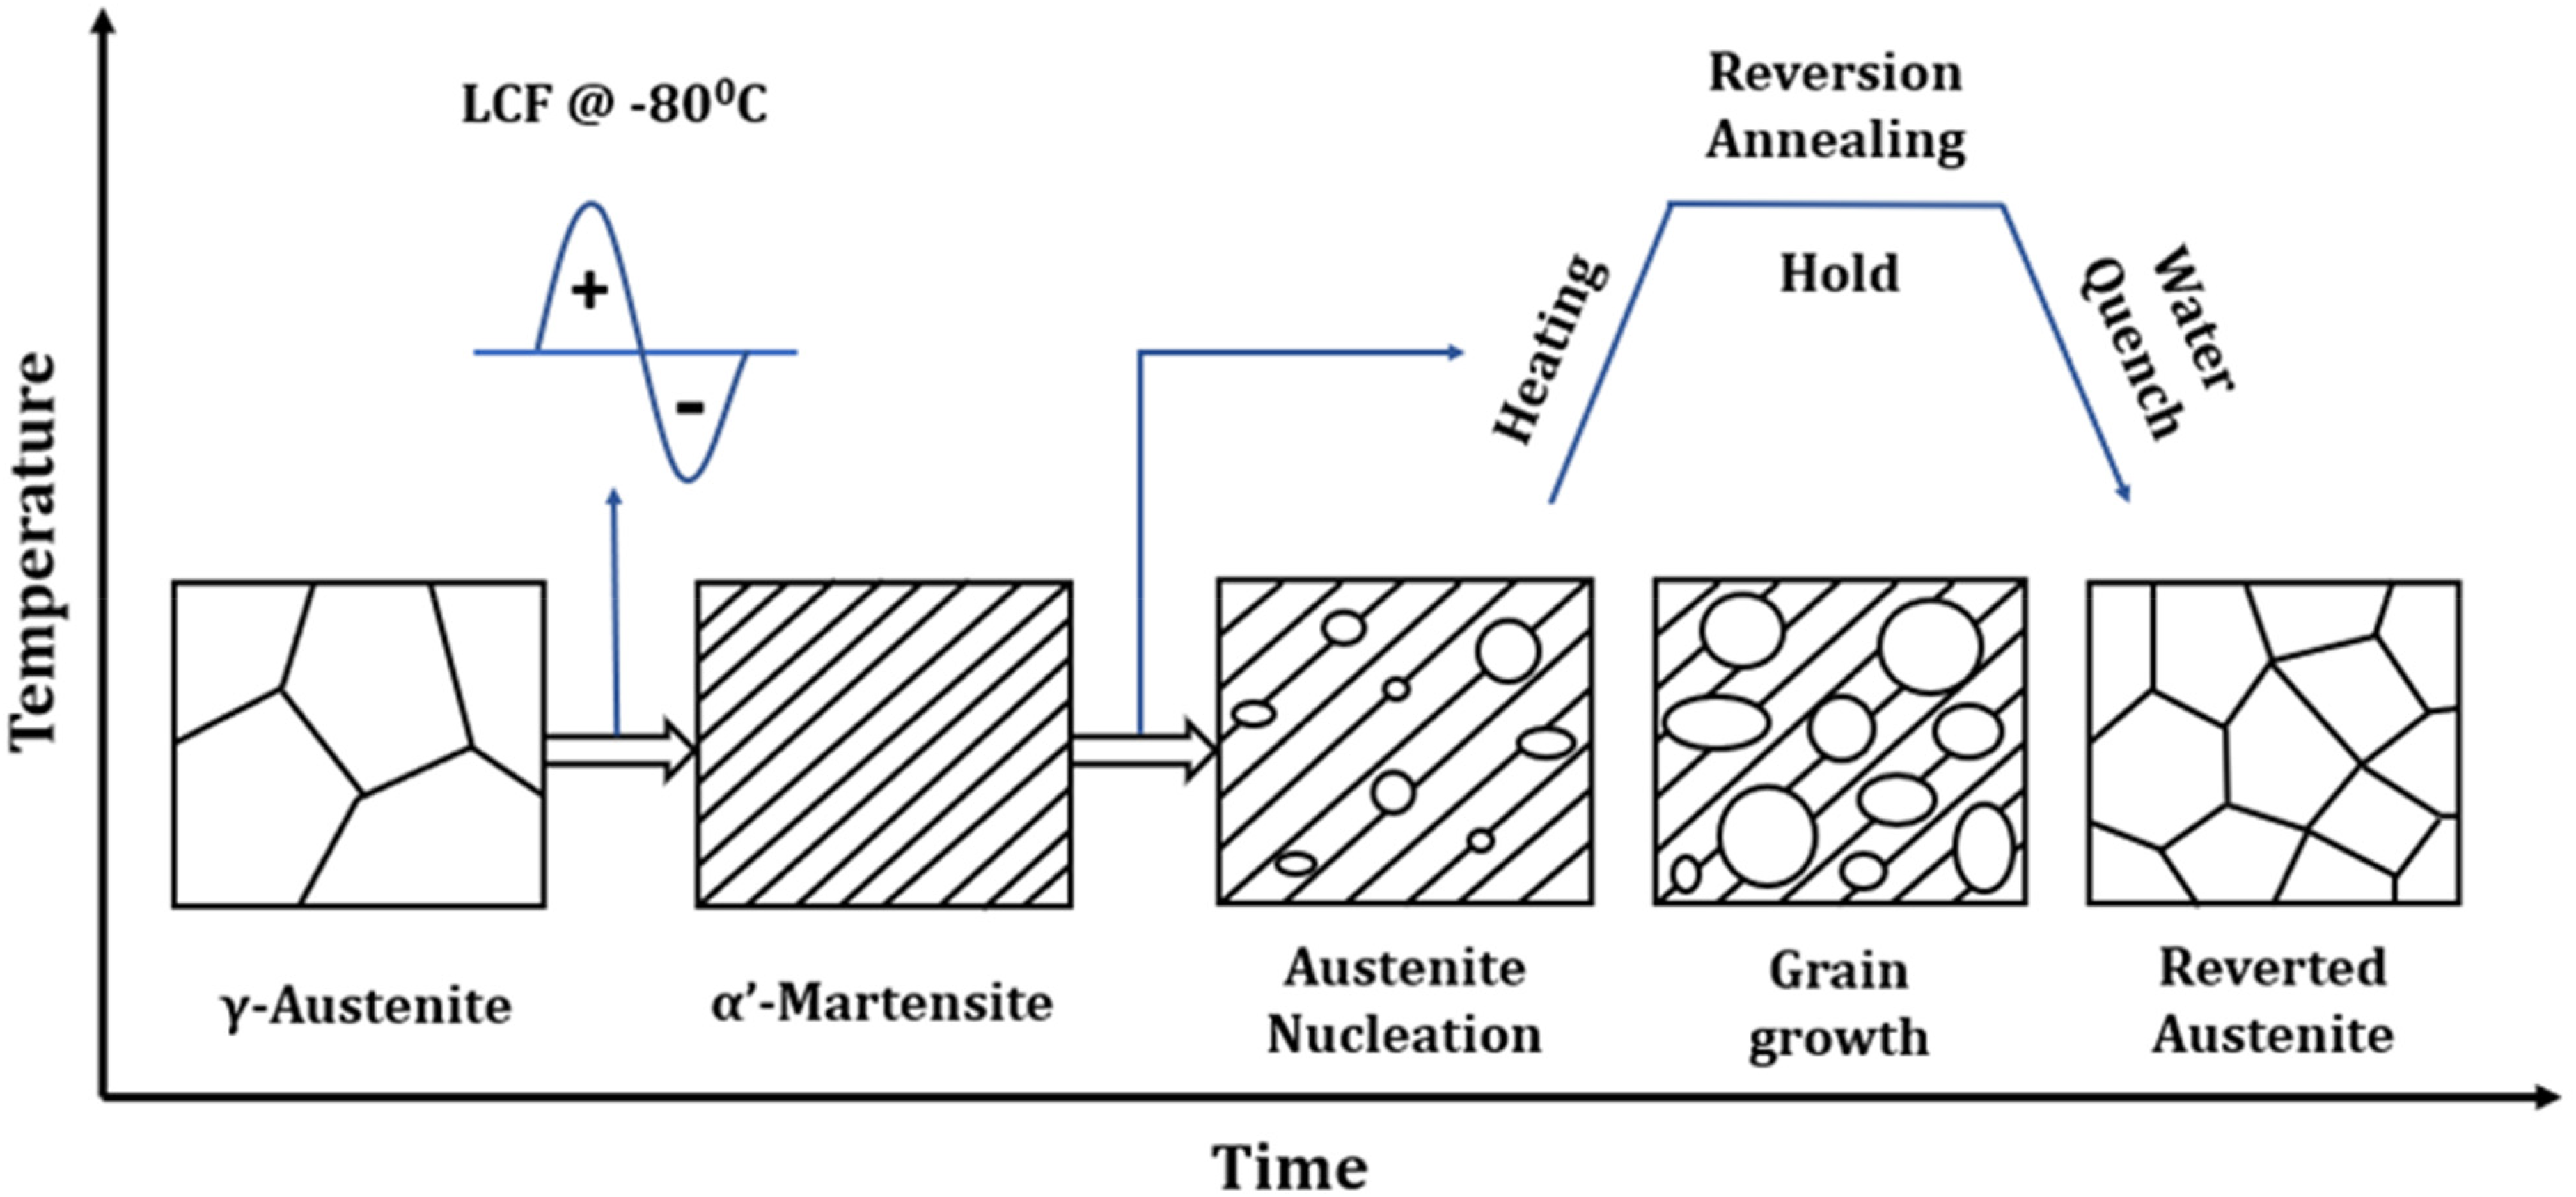
The present study investigates the phase transformation processes in SS316L during Low Cycle Fatigue (LCF) and reversion heat treatment. The LCF tests were carried out at different strain amplitudes (0.6%, 0.8%, 1%, and 1.2%) at −80°C and 10−3 s−1 strain rate, which transforms γ-austenite phase to deformation induced martensite (DIM). Subsequently, all the deformed samples were annealed at 700°C for an hour to retransform DIM to the γ-austenite phase. Extensive microstructure analysis was performed using Electron Backscatter Diffraction (EBSD) and X-ray Diffraction (XRD) techniques to understand the phase transformation and reversion processes. Molecular dynamics simulated the DIM formation during LCF, revealing fcc to hcp (ε-martensite) and bcc (α’-martensite) phases in compression but no phase transformation during the tensile cycle.
Keywords
Introduction
Austenitic stainless steel is widely used for its favourable mechanical properties at both room and low temperatures. 1 However, the relatively low strength of these materials acts as a hindrance to their numerous potential applications. Several methods like solid solution strengthening,2,3 grain refinement,4,5 and cold working combined with strain-induced martensitic transformation6–8 have been employed to enhance the strength of these alloys. Deformation induced martensite (DIM) transformation of fcc austenite into bcc α´- martensite offers a unique possibility to significantly enhance the yield stress and the tensile strength of the material. 9 This is the reason for considerable research interests in metastable austenitic steels.10–14
Different manufacturing processes have been investigated for deformation induced hardening of metastable austenitic steels like cold rolling and abrasive ball blasting.15–17 Another process for martensitic hardening of metastable austenitic steels is cryogenic laser shot peening, in which the energy necessary for the austenite-martensite transformation is provided by a powerful laser. 18 Wang et al. 19 highlighted the effect of martensitic phase transformation on the behaviour of 304 austenitic stainless steel under tension and pointed out critical elements that needed to be incorporated into crystallographic phase transformation models to accurately describe the internal strain evolution during phase transformation. DIM formation in austenitic steels has been extensively studied 20 and modelled 21 for monotonic loading at both room and lower temperatures. It allows the formation of α´-martensite in a temperature range Ms ≤ T ≤ Md, where Ms and Md are the martensitic start temperature and the maximum temperature, respectively.22–26 Vogt 27 and Botshekan et al. 28 have documented the occurrence of ε-martensite, twin, and α´-martensite formation in 316LN steel subject to fatigue at extremely low temperatures. It has been acknowledged that a considerable amount of α’- martensite can have a positive impact on the mechanical properties of stainless steels in the 300 series. 29 Most of the existing literature on low temperature focus on phase transformation through cryo-rolling followed by reversion heat treatment,30,31 and there are also studies based upon monotonic loading.32,33 Recently, the strain induced martensitic transformation behaviour of SS 304 subject to LCF tests was studied by Farias et al. 34 Botshekan et al. 35 revealed a primary hardening phenomenon followed by saturation at 300 K and a secondary hardening phenomenon in the cyclic stress response at 77 K in 316LN SS due to the formation of strain-induced martensite transformation during the cyclic straining. The effect of transformation induced plasticity (TRIP) on the LCF behaviour of austenitic stainless steels was investigated by Paul et al. 36 Ding et al. 37 proposed a tensile stress–strain relation to characterize the strain induced martensitic flow behaviour of S30408 austenitic stainless steel at cryogenic temperatures ranging from 77 K to 293 K.
Although there is existing literature available on DIM formation in different series of austenitic stainless steel (ASS) under cyclic loading at room temperature,38–44 there is a scarcity of research on cyclic loading at lower temperatures, except for some exceptions. 45 The phase transformation from γ-austenite to α’-martensite induces a substantial alteration in the fatigue behaviour, which is attributed to the enhanced strength of the martensitic phase.46–48 Several researchers have also demonstrated the potential of heat treatments to enhance the strength and ductility of metastable austenitic steels simultaneously.49–52 These treatments have been applied to previously cold-worked steels with the primary objective of achieving recrystallization of the pre-deformed austenite while simultaneously reverting the strain-induced martensite. During annealing of a cold-worked 304 ASS, three distinct stages have been observed: martensite reversion, recrystallization of the retained austenite, and grain growth. 53 Careful control of these stages is essential to form different microstructures during thermomechanical treatment. Other researchers have also discussed these effects.54,55 M. Naghizadeh 56 conducted a quantitative analysis and demonstrated that the presence of approximately 2 wt.% Mo in AISI 316 stainless steel can significantly impede the phenomena of grain growth and recrystallization processes, which are highly dependent on temperature. These studies motivated us to understand the DIM formation in 316L ASS under LCF loading as well as some reversion of the martensitic phase to the austenitic phase after the heat treatment. Our work primarily fills the existing gap in literature to explore the phase transition process during the reverse transformation.
The DIM transformation process is accompanied by changes in the lattice structure and it follows three known paths of transformation. 57 The fcc austenite (γ) can directly transform into hcp martensite (ε) or bcc martensite (α’). Another possible transformation path is the consecutive transformation from γ-austenite to ε-martensite and then to α’-martensite (γ-ε-α’). However, due to the difficulty in directly observing atomic-scale microstructural features, the underlying atomic processes responsible for the structural transformation have remained unclear. MD simulations provide unique perspectives into the process of phase transformations at atomic scales. The simulations can explore all possible crystal structures, interface geometries and defects.
Our present work aims to study the behaviour of the phase transformation in SS316L under LCF at low temperature (−80°C) and different strain amplitudes and its subsequent reversion at 700°C using a combination of experiments and MD simulations. The experimental details for the LCF and the microstructural characterization have been provided in section “Experimental section”. We also discuss the MD set-up in this section. The results from physical and numerical experiments are discussed in Section “Results and discussion”. We conclude in Section “Conclusion” with a summary of the work.
Experimental section
To study the phase transformation process in SS316L, the LCF tests were carried out for different strain amplitudes (0.6%, 0.8%, 1% and 1.2%) up to failure. We also performed LCF on samples up to 80% of the maximum stress achieved at failure i.e., the peak stress that the material reached just before failing during the LCF test for the strain amplitude of 1.2%. This test is referred to as intermediate test in our work (INT-intermediate test). All the tests were conducted at −80°C and 10−3 s−1 strain rate. For phase reversion study, the samples were annealed at 700°C with a holding time of 1 h and then water quenched. The detailed experimental procedures are given in the sections below.
Material and testing method
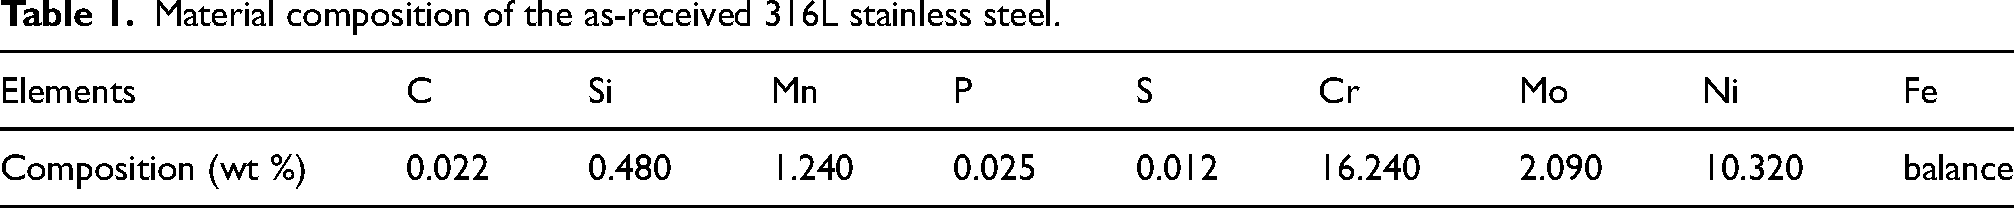
A commercially available cold-drawn AISI SS316L rod was procured with a 12.7 mm diameter. The chemical composition of the material was measured using wet chemical analysis and the results are given in Table 1.
Material composition of the as-received 316L stainless steel.
The Dogbone specimens used for strain controlled LCF tests were prepared from the as-received (ASR) material, according to the ASTM E-606 standard, with a gauge length of 12 mm and a diameter of 6 mm, respectively, as shown in Figure 1. Strain-controlled LCF tests were conducted at −80°C using a sinusoidal waveform with a constant strain rate of 10−3 s−1 and various strain amplitudes using the 809 axial torsion testing system with a load cell of 250 kN. An MTS 651-06E-03 environment chamber was used to maintain the desired temperature with an accuracy of ±1°C. All the tests were conducted in strain control mode using an MTS 634.31F-25 extensometer with the gauge length of 10 mm. A minimum of 200 data points per cycle was acquired and each test was repeated for a minimum of three times for the repeatability of the data. The engineering strain (e) is obtained directly using the extensometer attached to test specimen during the test. Then, the true strain (ε) is obtained with the help of engineering strain using the relation:
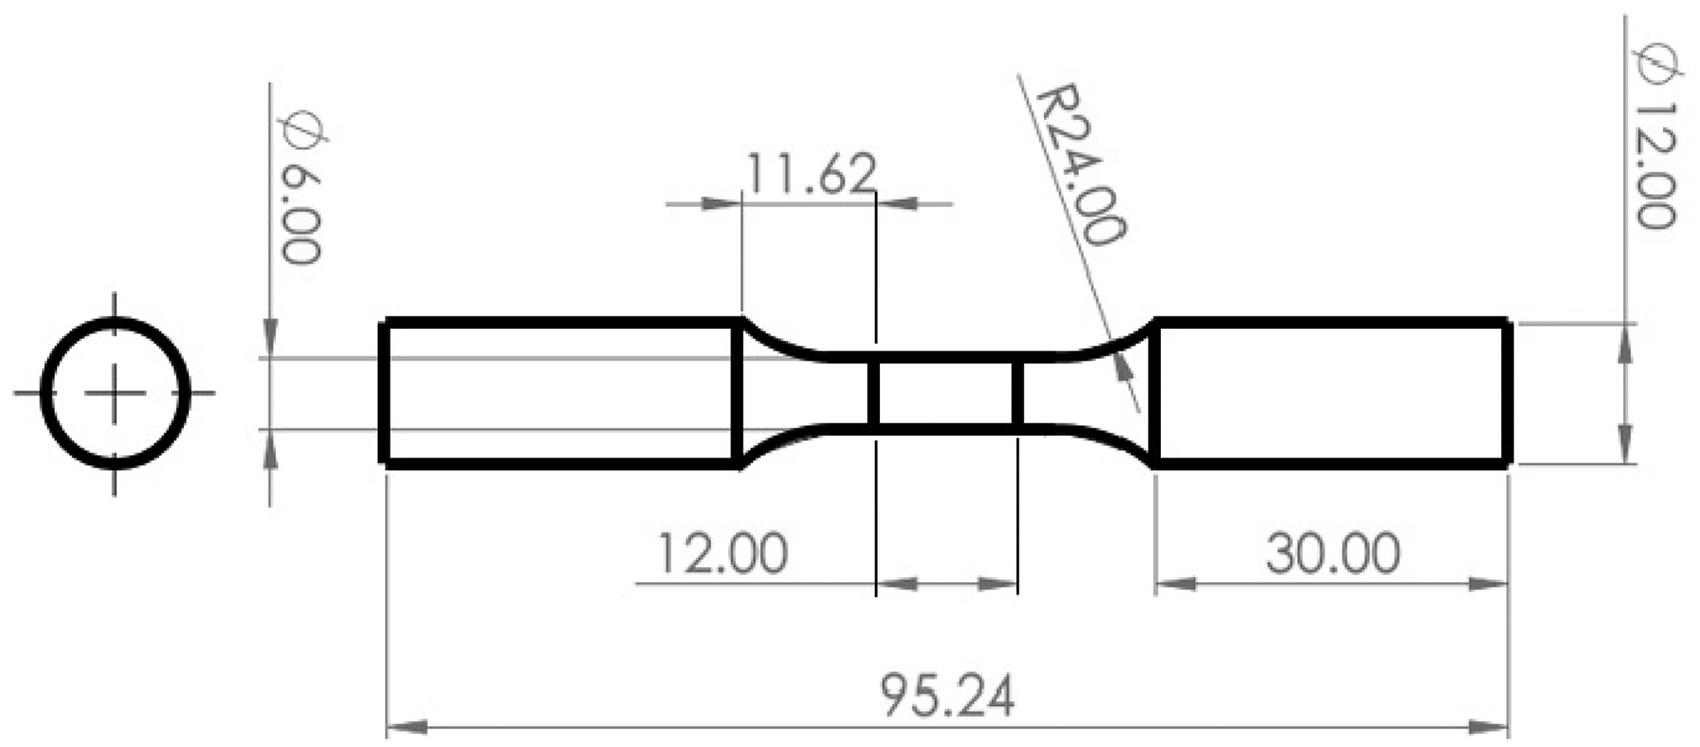
The sample dimensions (in mm) used for the Low cycle fatigue test according to ASTM E-606 standard
The Load data obtained from the machine is used to calculate the engineering stress (

Microstructural characterization
Microstructure analysis was performed on the low temperature LCF test sample with the help of EBSD and the data analysis was done using the TSL-OIM software. Samples were sectioned along the loading axis, and the sectioned surface was prepared for microstructure characterization through mechanical polishing up to 2500 grit grade with SiC paper and then electro-polished with 70% Methanol + 20% per chloric acid + 10% butanol solution at 20 V for 20 s. EBSD data were acquired using an OXFORD fast charge coupled device (CCD) detector mounted on ZEISS Gemini 300 Field Emission Scanning Electron Microscope (FE-SEM). XRD study was carried out using Empyrean Malvern Panalytical XRD machine using a Bragg-Brentano High- Definition detector with a line source. Further, Rietveld analysis was performed using High score plus software for phase quantification to determine the amount of DIM produced after LCF and the amount of DIM left in the material after the reversion process.
Molecular dynamics (MD) simulation
In order to support our experimental results, we performed MD simulations at two different temperatures 0°C and −80°C. We performed the cyclic loading process at both temperatures; however, the heat treatment process similar to the experiments was done only on the samples deformed at −80°C after the cyclic loading process. The MD simulation system utilizes a cubic box with 10 × 10 × 10 fcc unit cells and 3.571 Å lattice constant with an initial arrangement of all the 4000 γ-fcc atoms. The LAMMPS 59 software was used to carry out the simulations. The interatomic interactions were modelled, by Meyer-Entel potential. 60 Periodic boundary conditions along the x, y and z axes were imposed on the MD box for all our simulations and the MD time step was taken as 2 fs.
Initially, energy minimization using the conjugate gradient algorithm was performed. This was followed by giving an initial velocity profile to the atoms from a Maxwell-Boltzmann distribution corresponding to the equilibrium temperature θ0 = 0°C or −80°C. This was followed by three steps. In the first step, an equilibrium MD simulation under NPT ensemble at θ0 temperature and 0.001 bar pressure for 5 × 10⁴ timesteps equivalent to 100 ps was performed. The Nose-Hoover chain thermostat and barostat (chain-length = 3) were used for maintaining the temperature and pressure. This relaxes the system to the required temperature and relieves the residual stresses. In the second step, the simulation was performed under NVT conditions at θ0 temperature for another 5 × 10⁴ timesteps. In the third step, the system was deformed for 5 × 10⁴ MD time steps with cyclic loading under tension-compression conditions along x-axis using a sinusoidal waveform for the strain with an amplitude of either 0.2% or 2% and time-period 100 ps, equivalent to a frequency of 1010 Hz or a strain-rate of 1010 per second. We observed phase transformation during the compression cycle only.
To simulate the reversion heat treatment process, the system was then allowed to equilibrate for 105 timesteps under NPT conditions with pressure at 0.01 bar along both x and y axes and temperature at −80°C. The system was then heated up to 700°C with a linear increase in temperature while keeping the same pressure. This step was performed within 2 × 10⁵ MD time steps. Then the temperature of the system was maintained at 700°C for another 105 timesteps for equilibration under the same pressure conditions achieved by the NPT algorithm. Then the temperature was linearly reduced from 700°C to the room temperature in 105 timesteps with the same pressure. Finally, the system was equilibrated at room temperature for another 105 timesteps under NVT conditions using the Nose-Hoover algorithm. The OVITO software 61 was used for visualization and the common neighbour analysis (CNA) method 62 was employed to characterize different phases during the structural phase transformation happening under LCF and reversion heat treatment processes. In Section “MD Simulation Results”, we analyse the cyclic deformation mechanisms at the atomic level, and discuss in detail the effects of temperature and strain amplitude on these mechanisms and phase transformation by reversion heat treatment.
Results and discussion
Low cycle fatigue behaviour
Cyclic stress response
A prominent secondary hardening behaviour has already been observed in SS 316L at −80°C 63 at different strain amplitudes (SAs), therefore, we also carried out LCF tests at the same temperature and different SAs.
Figure 2(a) shows the cyclic stress response curve at different SAs (0.6%, 0.8%, 1%, 1.2% and INT). Cyclic softening is observed for the initial few cycles and as the SA increases the number of cycles to cyclic softening decreases. With further increase in cycles, a strong cyclic hardening is observed for all the SAs. However, the degree of cyclic hardening increases with increase in SA. Generally, cyclic hardening is caused by dislocation multiplication and their interaction as well as due to the formation of DIM at low temperatures, whereas cyclic softening occurs due to rearrangement of mobile dislocations into their lower energy configurations. Figure 2(b) presents the cumulative plastic strain accumulated when the material is deformed at different SAs till failure and also for the case when the material is deformed at 1.2% SA till 80% of its failure (INT). The initiation of cyclic hardening after the initial softening was found to occur at a reduced number of cycles as the accumulated plastic strain becomes higher for higher SA. In other words, the degree of accumulated plastic strain dictates the onset of cyclic hardening after the initial softening phase. Thus, higher SAs lead to earlier onset of martensitic transformation during the material's life cycle. The half-life hysteresis loops were plotted to study the behaviour of a material under cyclic loading and unloading conditions at different SAs as shown in Figure 3. The given data depicts the correlation between the applied SA and the material's corresponding stress response. Notably, the half-life hysteresis loop illustrates that as the strain amplitude increases, the area enclosed by the half-life hysteresis loop also increases.
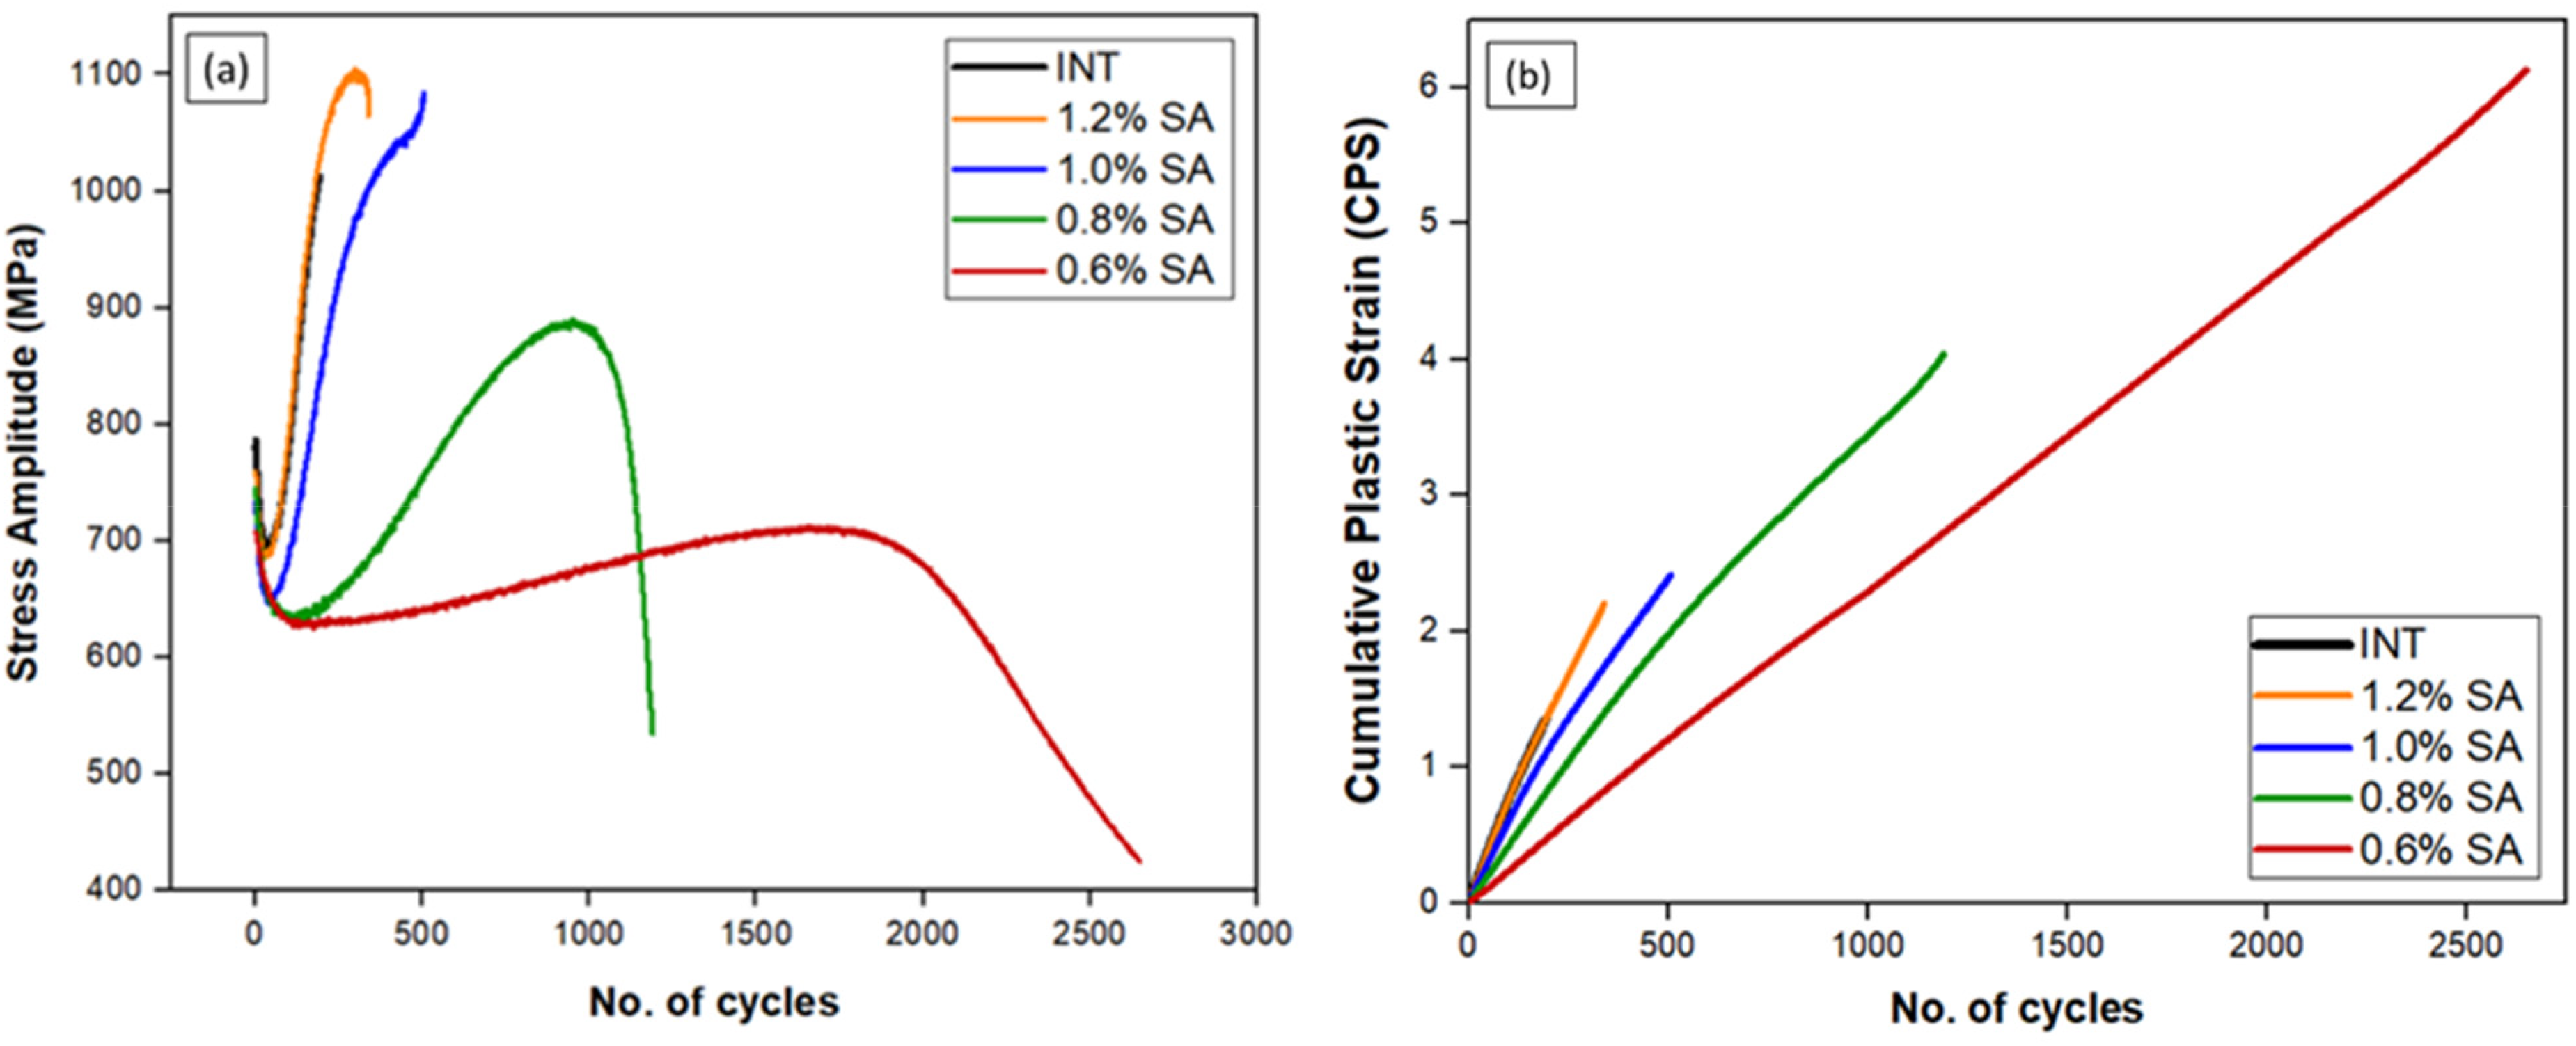
(a) shows the cyclic stress response curve and (b) shows the cumulative plastic strain accumulated when the material is deformed at 0.6%, 0.8%, 1% and 1.2% strain amplitude till failure and 80% to the failure at 1.2% SA (INT) and −80°C respectively

The half-life hysteresis loop under constant strain amplitude of 0.6%, 0.8%, 1% and 1.2% strain amplitude at −80°C
Phase transformation at different strain amplitudes
The microstructural analysis of all the specimens was done with the help of EBSD technique. Figure 4 shows the phase fraction and inverse pole figure (IPF) maps of the as-received (ASR) SS 316L specimen. The IPF map of the ASR specimen exhibits a colour gradient across the grains, indicating initial misorientation of the grains 64 due to its processing condition (Figure 4(b)). Additionally, the ASR specimen shows only the γ-austenite phase (Figure 4(a)), which has been confirmed through the XRD analysis as well (Figure 6).
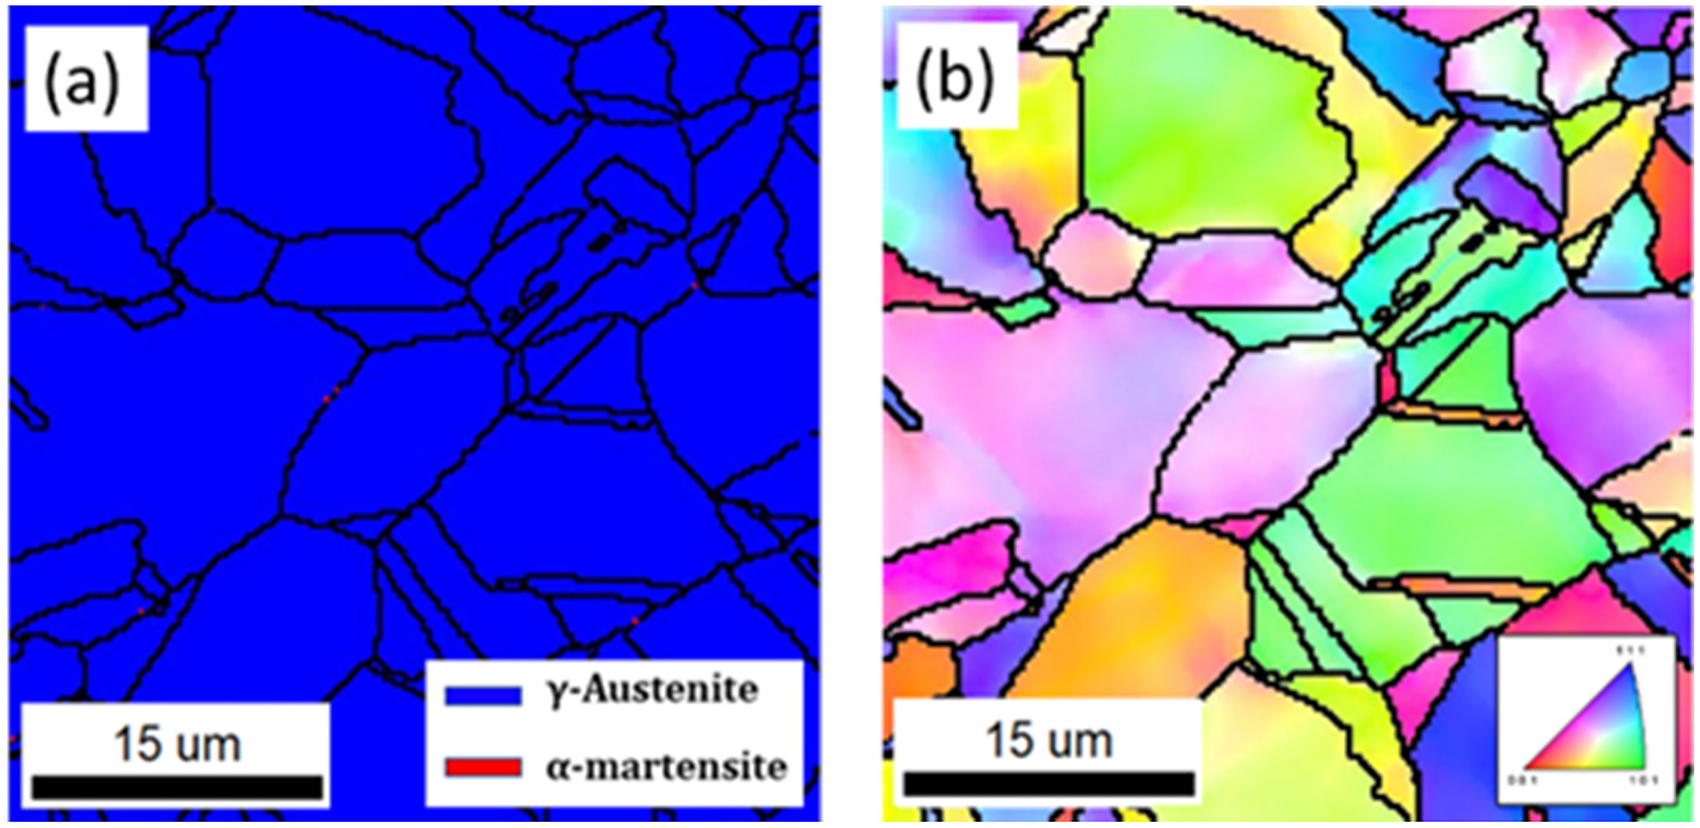
As-received SS316L specimen: (a) Phase map and (b) Inverse pole figure (IPF) map. EBSD was performed on the longitudinal section of the specimen and the IPF maps were taken along the deformation axis

EBSD phase distribution and IPF micrographs of sample deformed at −80°C after LCF and after reversion at 700°C for (a) 0.6% (b) 0.8% (c) 1% (d) 1.2% SA and (e) Interrupted (INT) test respectively

The XRD patterns showing the evolution of martensite after the low cycle fatigue test at 0.6%, 0.8%, 1% and 1.2% strain amplitude till failure as well as for the interrupted test at −80°C and reverted at 700°C. XRD was performed on the longitudinal section of the specimen, away from the fractured surface
Secondary hardening is observed during the LCF tests at −80°C which was positively correlated with the DIM formation. 63 To gain a deeper understanding of this behaviour, EBSD analysis was conducted on all the specimens. Figure 5 shows the EBSD phase distribution and IPF micrographs of all the samples. The red phase denotes α’-martensite, the blue phase indicates γ-austenite, and the black region shows the un-indexed points due to strain localization during the deformation. The austenitic phase undergoes a process of recovery i.e., dislocation annihilation and rearrangement, which becomes evident from the initial cycles of the cyclic stress response curve as depicted in Figure 2(a). When the material is deformed till failure, the γ-austenite gets transformed into the α’-martensite phase as shown in Figure 5(a-d). Cyclic straining leads to the formation of sub-grain boundaries, and their proportion increases with the strain amplitude. For 0.6% SA, there is a formation of deformed coarser grains within the material along with some amount of retained austenite. The amount of α’-martensite increases due to the transformation of retained austenite after LCF at 0.8% SA. The coarser grains undergo further deformation to a finer and softer martensitic phase at 1% and 1.2% SAs. This is attributed to the increased plastic strain within the material, leading to the formation of a highly deformed α’-martensite microstructure. There is a formation of ε-martensite in the material at intermediate strain level. For the interrupted (INT) specimen, the presence of a yellow phase indicates the presence of ε-martensite in the material as shown in Figure 5(e).
The ε-martensite does not transform entirely into α’-martensite but remains in the material due to insufficient accumulation of plastic strain. When the deformation reaches failure, nearly all of the ε-martensite produced at intermediate strain gets consumed and gets transformed into α’-martensite. The austenitic grains which undergo more deformation get transformed into finer α’-martensite phase, however, they still remain coarser compared to the sample deformed until failure at 1.2% SA. The deformed α’-martensite grains get re-transformed to γ-austenite after reversion at 700°C. The reversion process leads to the transformation of the deformed α’-martensite grains into coarser γ-austenite grains, primarily due to grain growth as shown in Figure 5. These reverted γ-austenite grains are characterized by the presence of a substantial number of annealing twins across the material. The results obtained from EBSD analysis are also quantified using XRD as shown in Table 2.
Deformation induced martensite percentage after LCF at different strain amplitudes and after reversion at 700°C.
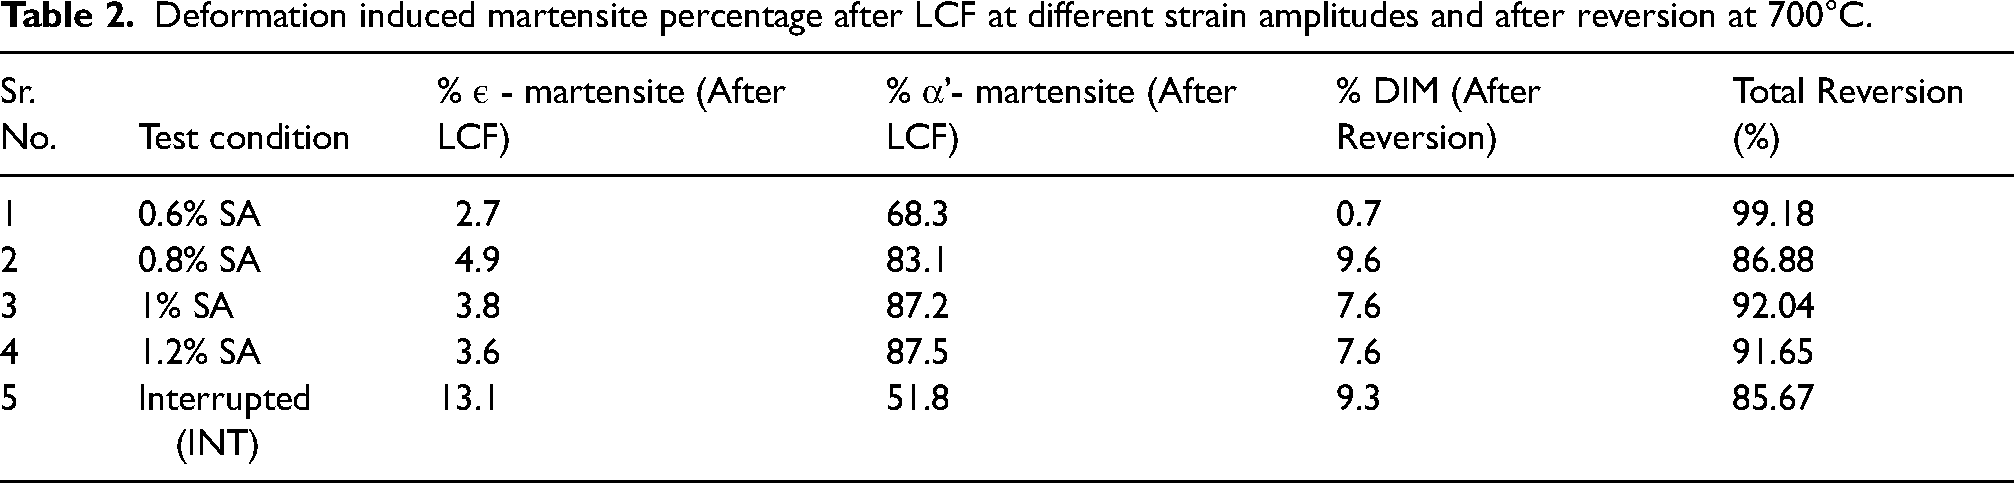
The XRD study was carried out on all the samples to quantify the phase transformation phenomenon at different SAs. Figure 6 shows the XRD 2θ-patterns depicting the martensitic evolution in the samples deformed at −80°C and reverted to austenite at 700°C. The 2θ peaks of the as-received material show nearly 100% γ-austenitic phase. After the LCF, formation of DIM is observed in the material which can be seen by the ε-martensite and α’-martensite peaks for all the SAs. The fraction of α’-martensite increases at the cost of γ-austenite and ε-martensite phases following the transformation sequence: γ → ε → α’. This is shown by the formation of α’-martensite peaks on (110), (200) and (211) planes and reduction in the γ-austenite peaks after LCF. Previous studies have also supported this mechanism where the strain-induced transformation from γ-austenite to ε-martensite occurs before the formation of α′-martensite.65,66 For the INT specimen after LCF, the presence of γ-austenite peaks at (111) and (200) remains notable with significant peak intensity. This is attributed to the lower cumulative plastic strain at the intermediate level which does not lead to significant DIM transformation.
After the reversion heat treatment, the DIM reverts back to γ-austenite which is indicated by the disappearance of ε and α’ peaks as shown in Figure 6. This is evident by the formation of γ-austenite peaks on (111), (200), (220) and (311) planes and reduction in the ε-martensite and α’-martensite peaks after the reversion for all SAs. Also, nearly fully austenitic microstructure with a small trace of DIM is obtained in all samples after the reversion at 700°C, which is quantified in Table 2.
The reversion process is influenced by two distinct mechanisms: shear transformation and diffusion-controlled transformation. Shear transformation during reversion typically results in the formation of fine γ grains and a high dislocation structure through recovery and recrystallization. On the other hand, diffusionally reversed γ is characterized by the nucleation of equiaxed austenite grains within the α′ matrix, and these γ grains gradually grow during annealing. Our analysis shows that the reversion of DIM occurs at significantly lower temperatures compared to the recrystallization temperature. The annealing of the deformed material leads to recovery of highly distorted austenite grains, which causes stress relief around the deformed martensitic phase, leading to subsequent grain growth. Thus, the reversion of DIM to austenite takes place through a diffusion-controlled process in our material as shown in Figure 7.
Schematic showing the mechanisms of reversion of Deformation induced Martensite back to Austenite
Vicker's Micro-hardness tests were conducted on all the samples and the results are shown in Figure 8. The initial hardness of the as-received material was measured to be 265 HV. After LCF at 0.6% SA, the hardness increases to 331 HV and this indicates the formation of α’-martensite in the material. Upon reversion to γ-Austenite, the hardness decreases to 271 HV. The hardness values exhibit an upward trend with increasing SA. However, the increase in hardness is not substantial from 0.6% to 1.2% SA. The hardness decreases after reversion but it is still higher than the hardness of the ASR sample. The hardness value increases from 271 HV (0.6% SA) to 331 HV (1.2% SA) after reversion. For the interrupted (INT) specimen, the hardness was measured to be 327 HV after the LCF, which is less as compared to all the samples deformed till failure after the LCF. After reversion the hardness of the INT sample was measured as 300 HV. It should be noted that after reversion martensite is not fully transformed to austenite as seen in Table 2. The higher hardness after reversion compared to the ASR sample can be attributed to the retained DIM.

Vickers Micro Hardness Plot after the LCF test at −80°C and 0.6, 0.8, 1 and 1.2% strain amplitude and after reversion at 700°C
MD simulation results
As discussed in Section “Molecular Dynamics (MD) simulation”, we performed MD simulations with cyclic loading on 10 × 10 × 10 fcc unit cells at 0°C under 0.02 strain amplitude (SA) condition and at −80°C under 0.2 SA condition. Just before the start of the cyclic loading process, we showed the initial configuration of atoms in Figures 9(a) and 10(a) for 0°C and −80°C, respectively. The blue, yellow, red and white colours of atoms denote fcc, hcp, bcc and other phases respectively for all our MD figures.

Arrangement of atoms in a) initial simulation box and when the material is deformed at 0°C and 0.02 SA in b) tension and c) compression, respectively. The blue colour denotes fcc phase
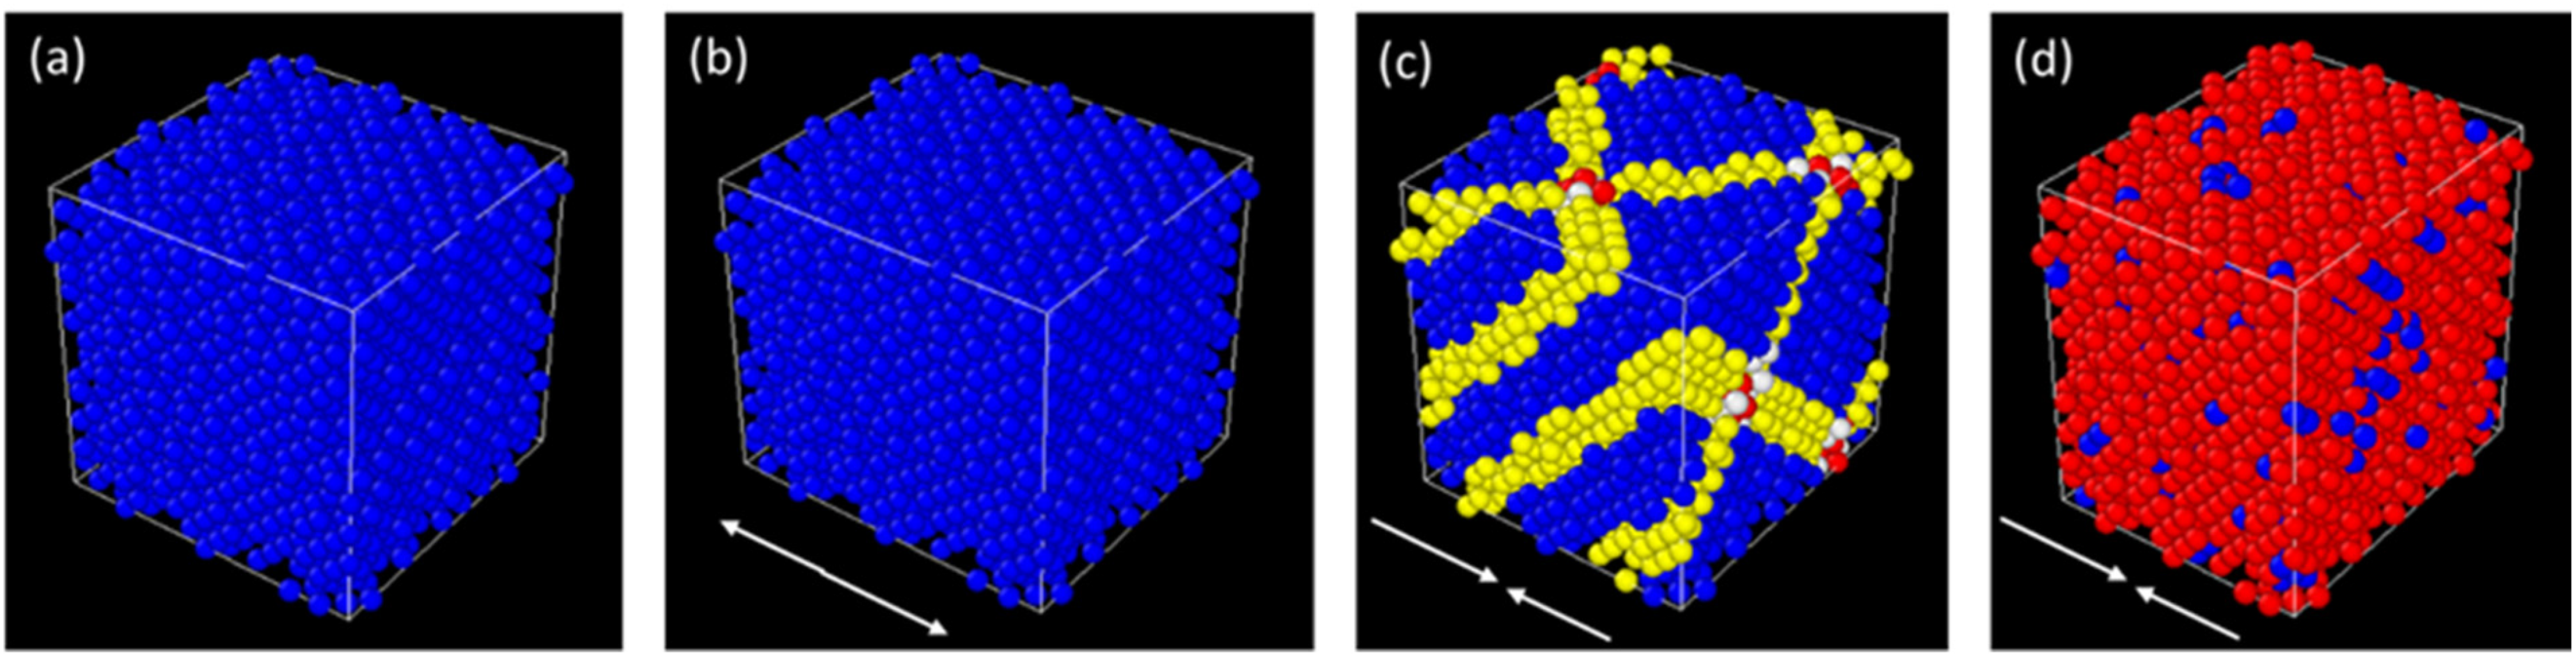
Arrangement of atoms in a) initial simulation box, and when the material is deformed at −80°C and 0.2 SA in tension at b) N = 20000 MD step and compression at c) N = 33000 step and d) N = 38000 step, respectively. The blue, yellow and red colours denote fcc, hcp and bcc phases respectively
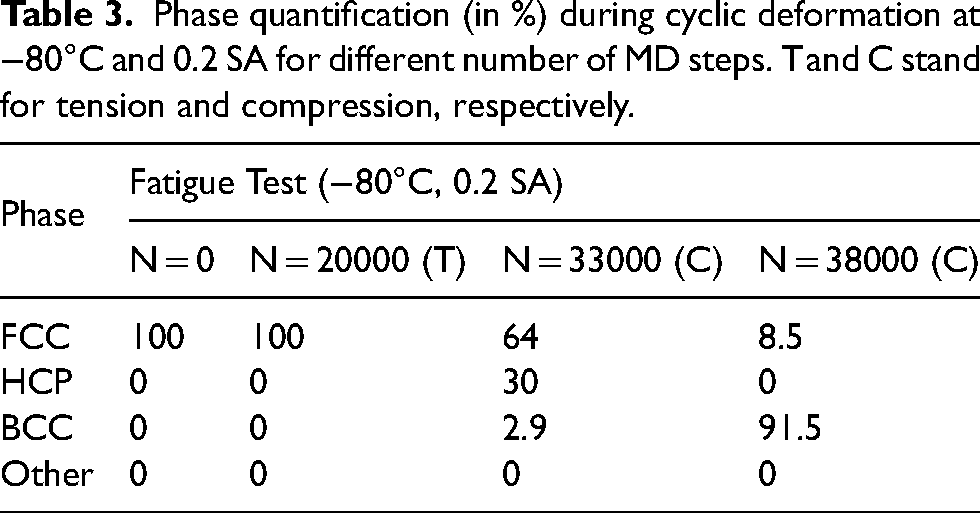
The cyclic loading deformation step has a complete tension-compression cycle for N = 0 to N = 5 × 10⁴ MD time-steps. This means the system is under tension for the first 25000 timesteps and then under compression for the next 25000 timesteps. At 0°C, we do not observe any phase transformation in the entire tension-compression cycle as shown in Figure 9(b) and (c) under 0.02 SA. At −80°C with 0.2 SA, again there is no transformation during the tension half-cycle. As a representative of this half-cycle, Figure 10(b) shows the entire system under tension with fcc phase at N = 20000 MD steps. During the compression half-cycle, however, significant phase transformation happens and we obtain a maximum fraction of ε-martensite (30%) at N = 33000 steps. The fraction of α’-martensite was 2.9%, as shown in Figure 10(c). When the material undergoes further compression at N = 38000 steps, we observe maximum formation of α’-martensite (91.5%) with some fraction of retained γ-austenite (8.5%) as shown in Figure 10(d). The fraction of α’-martensite (bcc) increases at the cost of γ-austenite (fcc) and ε-martensite (hcp) phases following the transformation sequence, γ → ε → α’, which was also observed in our experimental results.
Figure 11(a) shows the potential energy (PE) curve during the cyclic deformation process at 0°C and 0.02 SA. The symmetric sinusoidal curves for the tensile and the compressive parts of the cycle show the expected sinusoidal behaviour for the PE since the strain applied was also sinusoidal and there were not any phase transformations in either tension or compression. This symmetric behaviour for both tensile and compressive parts of the cycle are expected for any temperature under any strain amplitudes, provided there are no phase transformations during the whole cycle. However, we observe a substantial change in the red PE curve with red filled circles in the compression part when the material is deformed at −80°C with 0.2 SA, as shown in Figure 11(b).

Potential energy change during cyclic loading for 10 × 10 × 10 simulation box at (a) 0°C, 0.02 SA, (b) −80°C, 0.2 SA and (c) Difference between actual and hypothetical potential energy change per atom during compression at −80°C and 0.2 SA
No phase transformation has occurred during the tensile half-cycle from N = 0 to N = 25000 MD steps, therefore, we expect a symmetrical PE curve for N = 25000 to N = 50000 steps during the compressive half-cycle if no phase transformation happens in this half-cycle either. We artificially create a black symmetric curve with black filled squares to represent this hypothetical scenario of no phase transformation during the compressive half-cycle. It can be concluded that the difference in the black (hypothetical symmetric curve during tension and compression) and the red (real asymmetric curve at −80°C with 0.2 SA) curves arises solely due to the phase transformation in the material from fcc to hcp to bcc. We also calculate the change in the PE because of the phase transformation processes by calculating the difference of the PE values represented by the red and the black curves in Figure 11(c). With increase in the MD steps, the change in PE varies from 0 eV/atom at N = 25000 to a maximum of 0.15 eV/atom eV at N = 37000 and then decreases and reaches to almost 0 eV/atom at N = 50000 MD steps. With the help of more MD simulations, we also observed that the degree of phase transformation increases with increase in the strain amplitude. These findings align with the experimental behaviour and provide solid confirmation of the phase transitions within the material by cyclic deformation process. The phase fractions for different time steps during tension and compression parts of the cycle at −80°C with 0.2 SA are quantified in Table 3.
Phase quantification (in %) during cyclic deformation at −80°C and 0.2 SA for different number of MD steps. T and C stand for tension and compression, respectively.
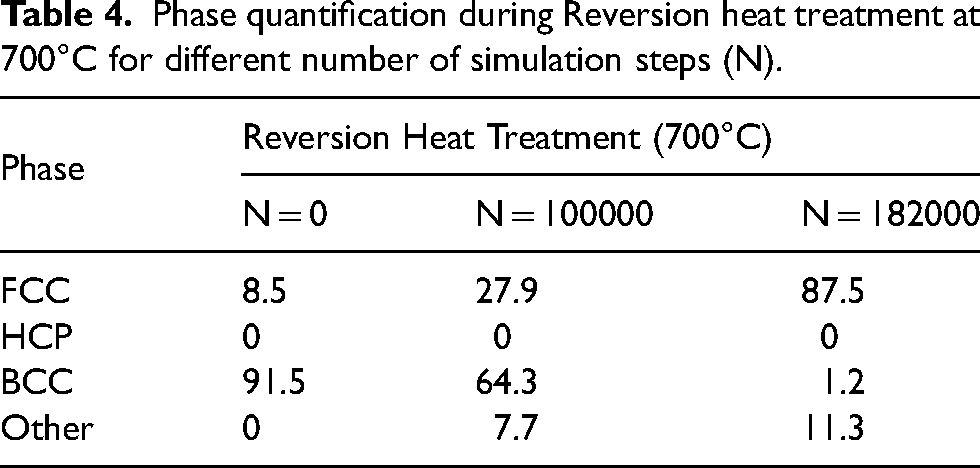
The system deformed under cyclic loading process at −80°C goes through a reversion heat treatment process. The atomic configurations during this heat treatment process have been shown in Figure 12 at different MD time steps. Figure 12(a) shows the initial arrangement of atoms prior to the reversion heat treatment process. Initially, 91.5% of the material shows bcc phase and 8.5% fcc phase. During the reversion process at 700°C, the fraction of the fcc phase starts showing an increasing trend, reaching 27.9% after N = 105 timesteps. There is no transformation from bcc to hcp phase throughout the heat treatment simulation. The bcc phase fraction initially dominated at 91.5% but gradually decreased, reaching 64.3% at N = 105 timesteps, and finally a very small trace of 1.2% was obtained at N = 1.82 × 10⁵ timesteps. These observations during the reversion heat treatment process emphasize the dynamic nature of phase transformations within the material as it undergoes heat treatment, with a significant shift from bcc to fcc phase. These results have been quantified for different simulation steps in Table 4.
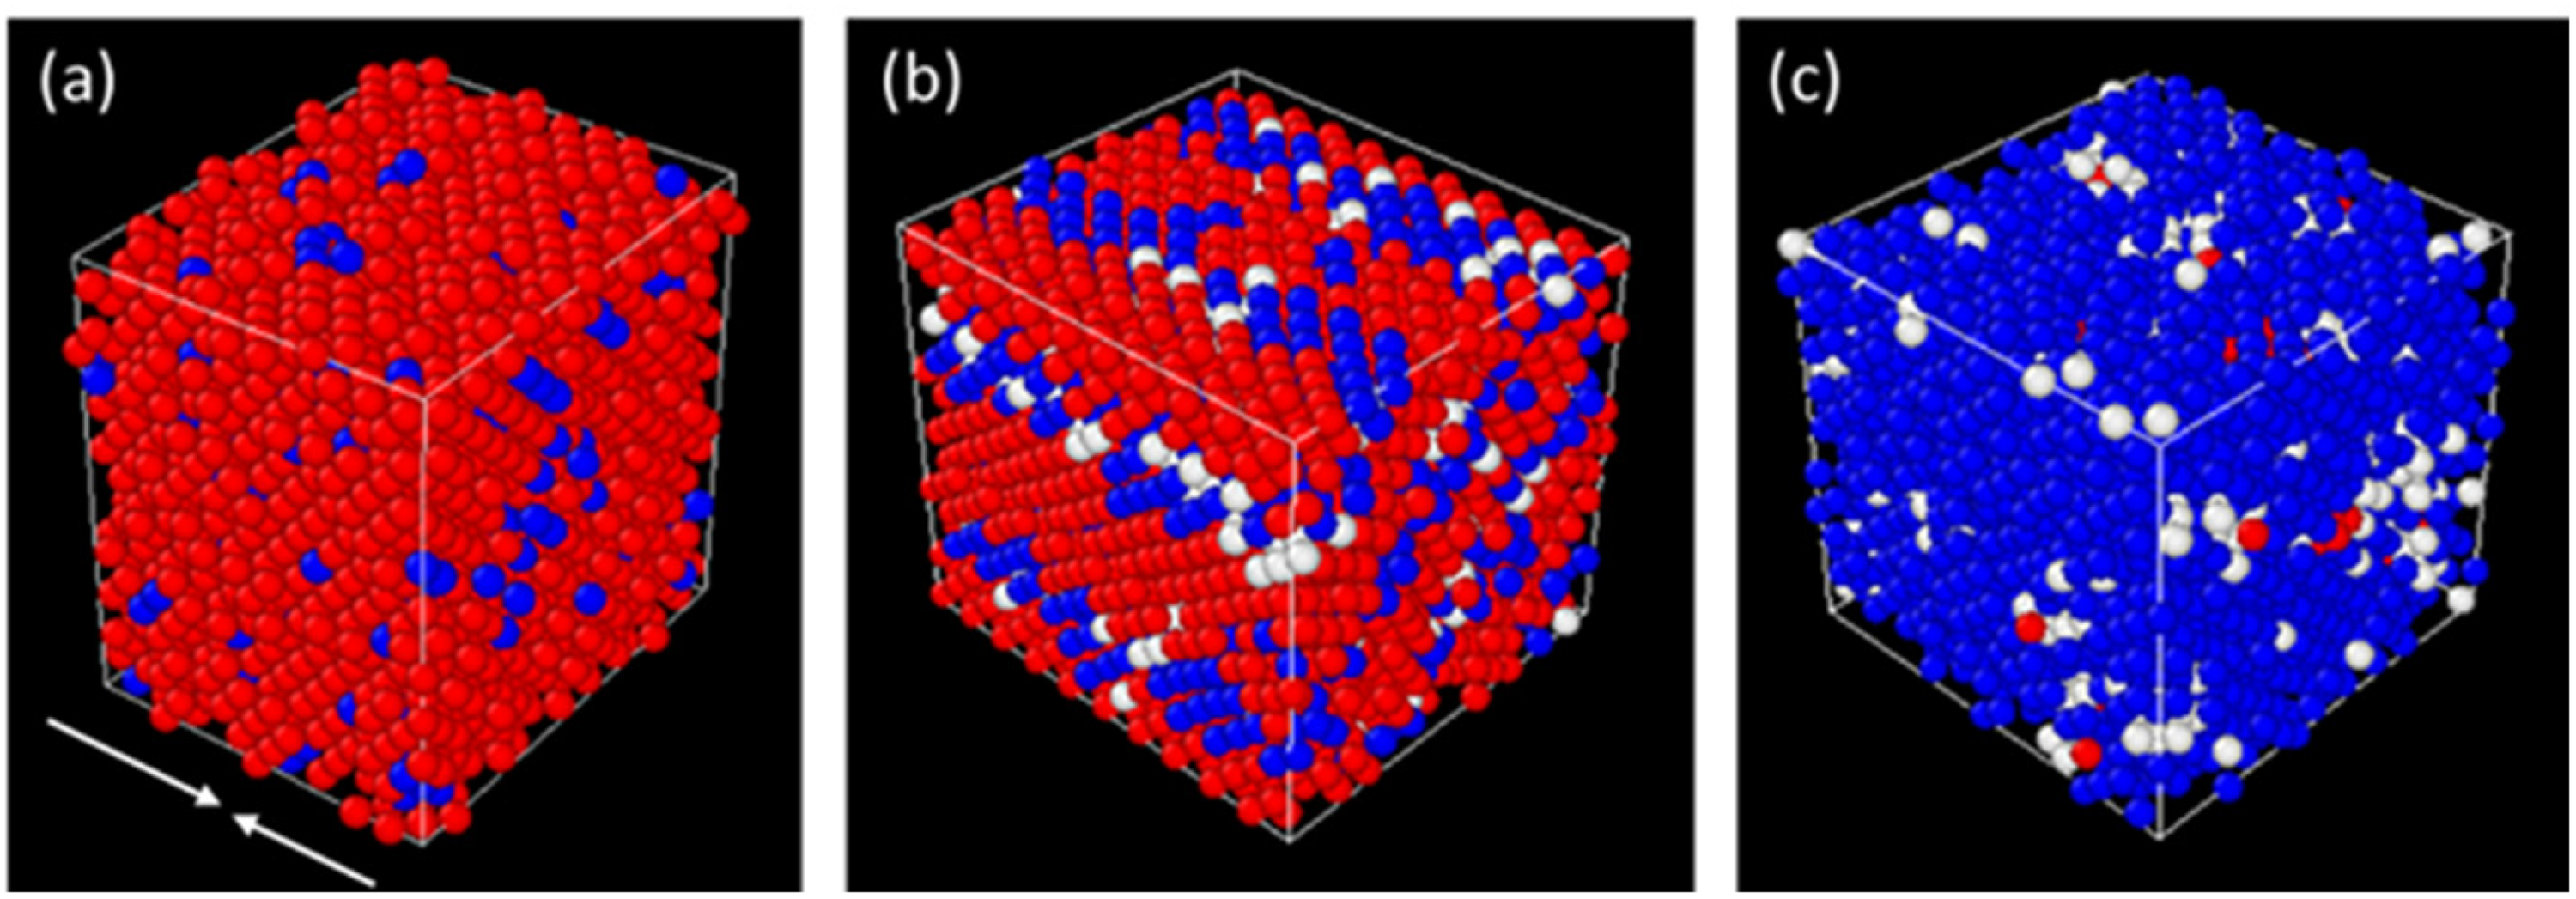
Arrangement of atoms in a) initial simulation box and when the material undergoes reversion at 700°C in b) tension and c) compression, respectively. The blue, red and white atom colours refer to fcc, bcc and other phases, respectively
Phase quantification during Reversion heat treatment at 700°C for different number of simulation steps (N).
As discussed in Section “Molecular Dynamics (MD) simulation”, we provide the evolution of the potential energy (PE) behaviour with respect to temperature during the heating and cooling phase of the heat treatment cycle in Figure 13. Notably, we observe almost linear increase in the PE as we increase the system temperature linearly from −80°C to 700°C and then linear decrease in the PE as we decrease the temperature linearly from 700°C to room temperature. Since the two curves are not coinciding, we conclude that the phase transformation process during the heating phase is different from that in the cooling phase.
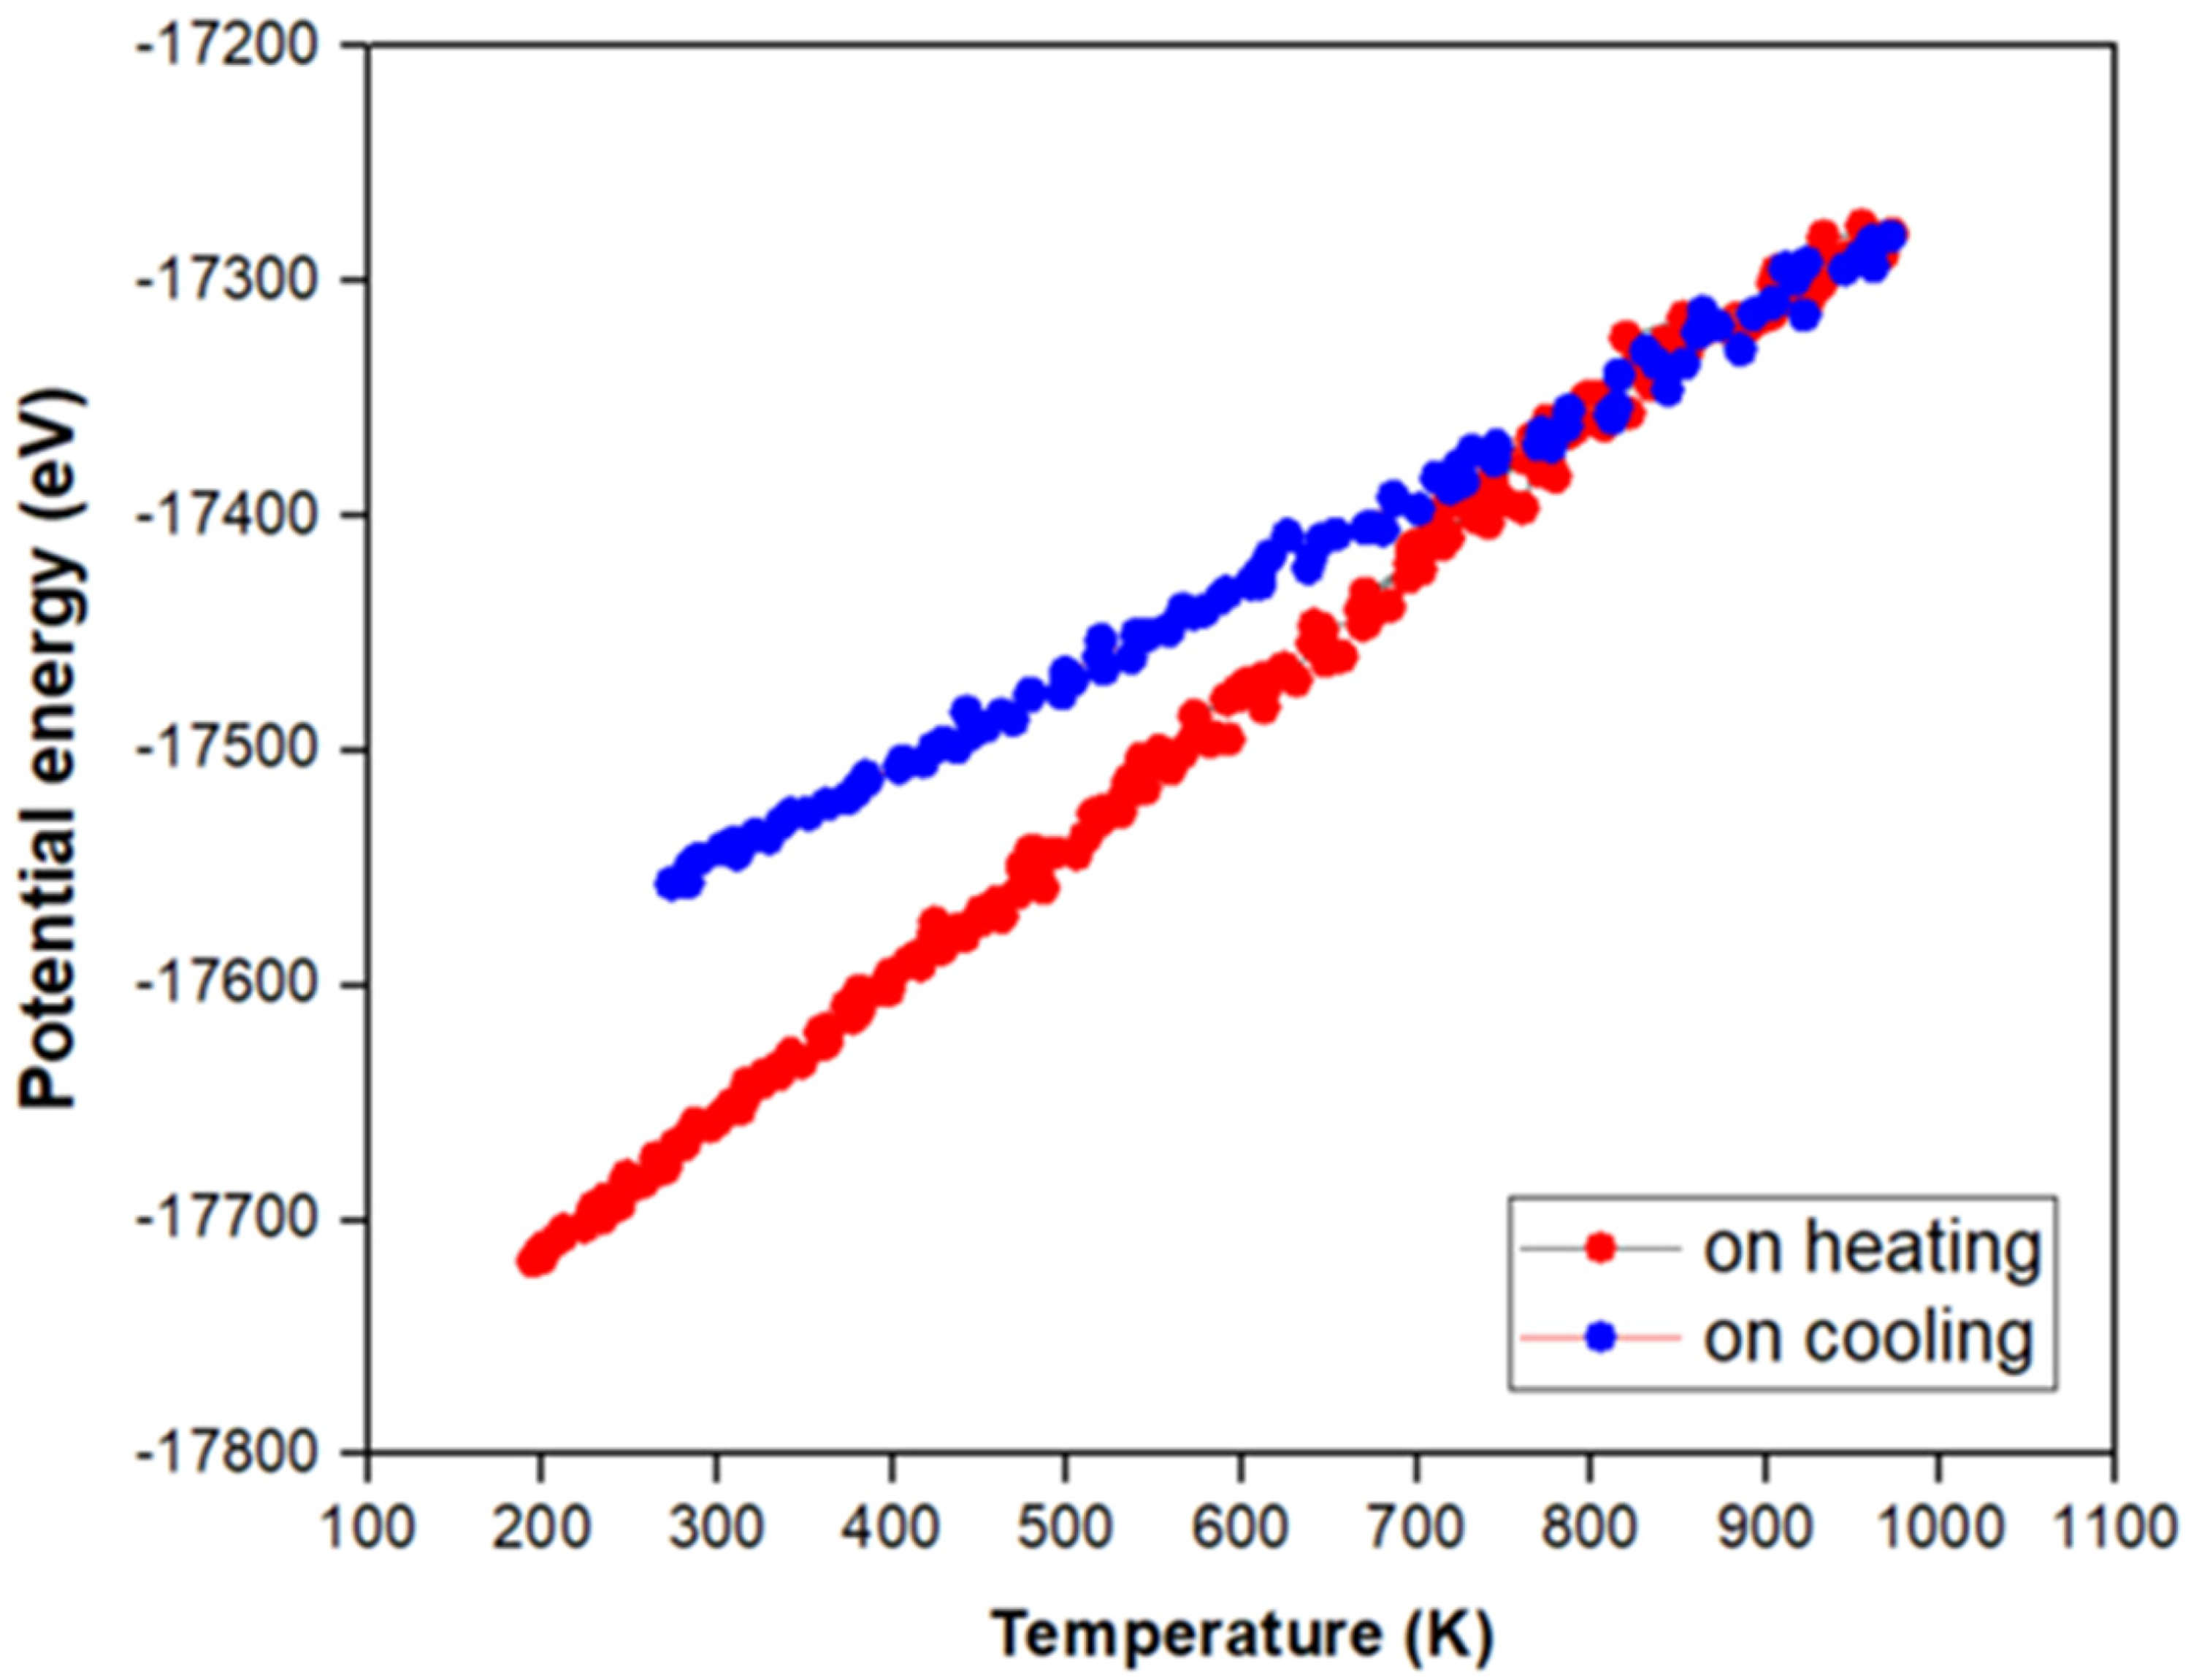
Potential energy change for different simulation steps when the material undergoes reversion heat treatment at 700°C at different temperatures
When the material is subjected to stress or deformation, the dislocations tend to move along the {111} plane within the fcc crystal lattice. As the deformation continues, more fcc atoms within the material undergo phase transformation, effectively changing their atomic arrangement to align with the hcp phase with some amount of the austenite phase (fcc) still remaining within the material as shown in the Figure 14(c). With more deformation, the hcp and fcc phases further transform to bcc phase as shown in Figure 14(d).
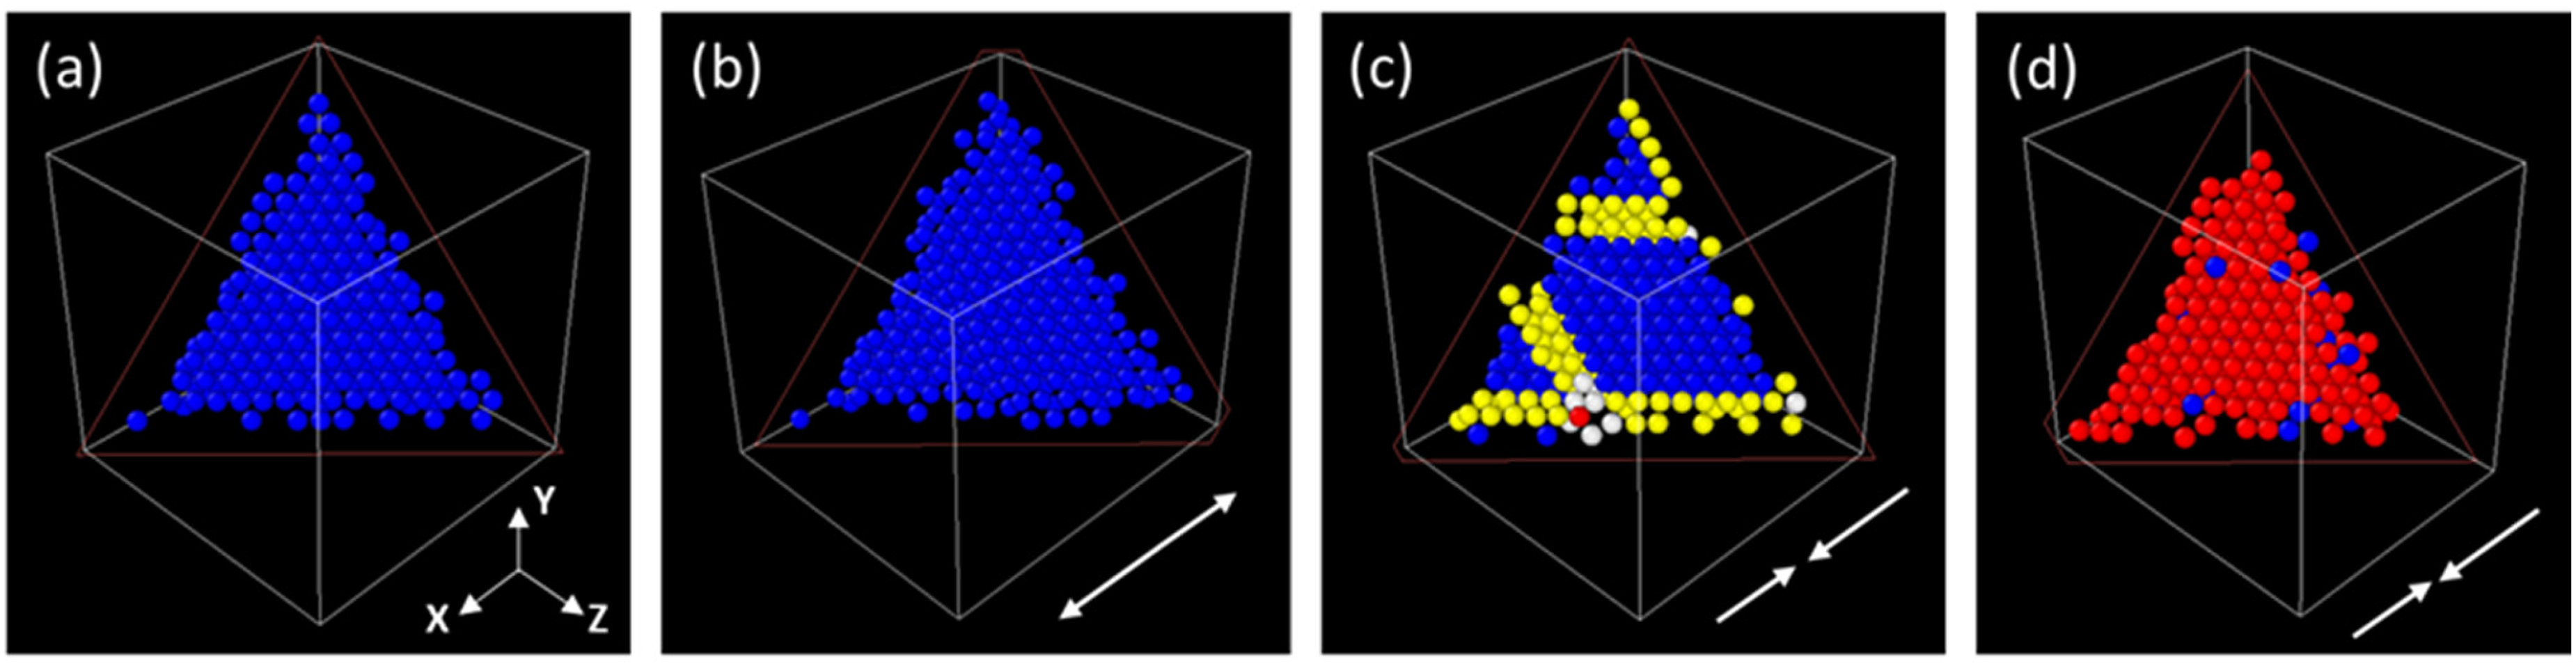
Change in the arrangement of atoms along {111} slip plane when the material is deformed by LCF at −80°C. a) fcc atoms in the initial simulation box, b) No nucleation of hcp or bcc atoms during tension (c) fcc and hcp phase with a nucleated bcc atom (d)final transformed material having bcc crystal structure with some retained austenite. The blue, yellow, red and white atom colours refer to fcc, hcp, bcc and other phases, respectively
Although we have shown some remarkable similarities between experimental and MD simulation results, however, some care must be taken while interpreting the MD results. The MD simulations have been performed under very high strain rate (1010/s) with 2 to 20% strain amplitudes, whereas the experiments were performed at 10−3/s with 0.6 to 1.2% strain amplitudes. The MD simulations cannot be performed at these experimental strain rates due to the limited inherent time scale. The strain amplitudes were kept high to observe significant phase changes in the first cycle itself. Even though high strain rates can lead to some quantitative discrepancies, the qualitative nature of the results obtained from the MD simulations remain relevant. The research carried out by Luis A. Zepeda-Ruiz et al. through MD simulations shows good qualitative agreement with the experimental results, despite an astonishing 10 orders of magnitude difference in strain rates. 67 Despite these differences, the quantified phase transformation results indicate similarities in material behaviour between simulations and experiments under cyclic loading and reversion heat treatment processes. Moreover, MD results show that the phase transformation does not occur during the tension half-cycle, which cannot be observed so clearly in experiments.
Conclusion
In our present work, comprehensive research has been carried out on DIM formation, reversion of DIM to austenite, phase transformation and microstructure evolution processes. The following results can be drawn from this investigation:
An experimental combination of LCF, at −80°C and different SAs, and reversion heat treatment at 700°C, was used to study the phase transformation behaviour in SS316L. The results were supported by MD simulations. XRD phase quantification results obtained through Rietveld analysis show the formation of DIM in all the samples after LCF. The fraction of DIM formed is more at higher SAs for a lesser number of cycles. After reversion, more than 86% DIM gets reverted back to the austenite phase. These results were cross-validated with phase distribution maps obtained with the EBSD and the micro-hardness measurements. During the reversion heat treatment, the diffusion-controlled mechanism dominated the DIM reversion process at 700°C for SS316L. This was attributed to the nucleation of γ-grains within the α’-matrix, followed by gradual growth of the γ-grains during annealing. The increase in micro-hardness value of commercial SS316L indicated the presence of DIM after the LCF test. Conversely, the corresponding decrease in micro-hardness values validated the reversion of α’-martensite to γ-austenite. MD simulations revealed a structural phase transformation during cyclic loading at −80°C and 0.2 SA. No phase transformation was observed during the tension half-cycle. However, when the material undergoes compression, there is a formation of intermediate ε-martensite (hcp) and α’-martensite (bcc). Also, the DIM formed during cyclic loading reverted back to γ-austenite after reversion heat treatment at 700°C. Interesting changes in potential energy of the atoms during the cyclic loading and the heat treatment process were also observed.
The experimental approach combined with the analysis of α’-martensite and phase transformation processes have provided valuable insights into the material behaviour under different loading and heat treatment conditions. The incorporation of MD simulations enhanced our understanding of structural changes during cyclic loading. These findings contribute to the broader knowledge of phase transformations in austenitic SS316L and offer potential implications for the design and performance of such materials in various engineering applications.
Footnotes
Declaration of conflicting interests
The authors declared no potential conflicts of interest with respect to the research, authorship, and/or publication of this article.
Funding
The authors received no financial support for the research, authorship, and/or publication of this article.
Data Availability Statement
The data will be made available on request.