
Abstract
Al-Ce alloys (2–7 wt.%) and Al-Ni alloys (2–6 wt.%) were cast, investigating the effect of the alloying element content on the microstructural evolution and concomitantly on the properties. The microstructure of hypoeutectic Al-Ce alloys consists of α-Al and lamellar Al11Ce3 eutectic phase, and that of Al-Ni alloys consists of α-Al and rod-like Al3Ni eutectic phase. There is an increase in the volume fraction of the eutectic phase with increasing composition, which leads to an increase in the strength of the alloy and a decrease in electrical conductivity. Al-Al3Ni eutectic performs better than Al-Al11Ce3 eutectic in balancing the strength and conductivity, which is associated with the fiber morphology of the eutectic Al3Ni phase and its excellent coherence with the matrix.
Introduction
As 5G communication and new energy vehicle sectors develop rapidly, demand for lightweight, heat-resistant, and highly conductive structural materials is rapidly growing. 1 For example, the shells used in 5G communication base stations require excellent room-temperature and high-temperature mechanical properties and conductivity simultaneously. 2 Due to the excellent specific strength, thermal conductivity, and ductility of aluminum, aluminum-based alloys are undoubtedly a suitable candidate.3–5 Currently, the aluminum-silicon eutectic system is the most widely commercialized cast aluminum alloy system, which are suitable for casting due to its good castability and flowability, which prevents hot tearing.6,7 However, the strength of Al-Si alloys lost more than 40% above 200 °C, which is attributable to the coarsening of the strengthening phases resulting from the high solid-state diffusivity of Si in the Al matrix.8–10 Therefore, the key issue is to find proper systems that can synergistically improve heat resistance, electrical conductivity and strength.
Adding obstacles to impede dislocation motion in microstructure design is important for the development of heat-resistant aluminum alloys. 11 One class of heat-resistant aluminum alloys is solid solution strengthened. 12 It has been discovered that elements with low diffusion coefficients, such as Mn or Fe, improve the mechanical properties and creep resistance of the alloys.13–15 The second class of alloys relies on thermally stabilized intermetallic particles.16,17 These include i) high number density nano-precipitates during aging, such as L12 Al3(Sc,Zr,Er) precipitates18–21 and α-Al-(Fe,Mo)-Si dispersoids22,23; and ii) second phases with high volume fractions formed during eutectic solidification, for example, the novel near eutectic ternary systems Al-Cu-(Ce,Ni,Er,Y,Yb,Gb).24–28 Regardless of which high-temperature strengthening phase is used, for the elements it is necessary to possess low diffusivity and low solubility.16,29
In the theory proposed by Drude in 1900, electrons follow the Maxwell-Boltzmann statistics and Newton's laws of motion and move freely through the lattice. 30 The lattice distortion leads to electron scattering and, thus, to a decrease in conductivity; the solid solution elements are the largest source of scattering for the movement of electrons. 31 The current main principle for generating conductive alloys is the low-alloyed composition,32–34 which refers to the inclusion of a low content of alloying components. Whether in heat-resistant phase-enhanced aluminum alloys or conductive aluminum alloys, low-alloying with transition elements of Ni, Fe and Co or with rare earth elements of Ce and Yb, is frequently employed and has received much attention.35–37 Therefore, eutectic systems with slow diffusion rates and low solid solubility such as the Al–Ce and Al-Ni alloys, are recognized as promising candidates for heat-resistant high-conductivity aluminum alloys.
The solid solubility of cerium and nickel in aluminum (SCe/Al < 0.001 at% at 642 °C, 38 SNi/Al < 0.11 at% at 640 °C 16 and the diffusion coefficients (DCe/Al = 4.65 × 10⁻¹⁹ m2/s at 400 °C, 38 DNi/Al = 2.05×10⁻¹⁵ m2/s at 400 °C 16 are extremely low. According to the Ostwald ripening theory, the coarsening of the strengthening phase is inhibited by low solid solubility and low diffusion coefficients. 39 At the same time, the low solid solubility of the two elements favors the reduction of the probability of electron scattering, while intermetallic compounds improve mechanical properties. Among them, the eutectic temperature of Al–Ce alloys is 642 °C, and Al-Al11Ce3 eutectic exhibits favorable castability. 40 The microstructure of hypoeutectic Al-Ce alloys contains only primary α-Al dendrites and interdendritic eutectic Al-Al11Ce3.39,41 The eutectic Al11Ce3 is platelet-like and has a submicron width, with a strong resistance to coarsening, as evidenced by its ability to maintain about 70% hardness after 100 h at 500 °C. 42 The eutectic Al-Ni alloys with a high eutectic temperature of 640°C form a reinforcing Al3Ni intermetallic phase during solidification43,44 and have a low tendency to hot tearing. 45 The presence of fibrous Al3Ni intermetallic compounds in the eutectic phase inhibits dislocation displacement and results in the strengthening of the alloy.46,47
In this study, the effect of the alloy composition on the microstructure, and hence on their electrical conductivity, heat resistance and strength were observed by using electrical conductivity measurements, microstructure analysis, and mechanical testing. The role of the Al-Al11Ce3 and Al-Al3Ni eutectic structures in the changing strength and electrical conductivity of the alloys were quantitatively analyzed and compared. The present study was to verify the effects of different intermetallic compound content, size and morphology on various properties of Al-Ce and Al-Ni alloys, and based on this, a strategic approach to modulate the strength and electrical conductivity of Al-based alloys according to their compositions was proposed, which provides a reference for the selection of alloying elements and content of new heat-resistant and conductive eutectic aluminum alloys.
Experimental procedures
Material processing
The chemical compositions of the studied alloys are Al-xCe (x=2, 4, 6, 7 wt.%, mass percentage, the same below) and Al-xNi (x=2, 4, 6 wt.%). All alloys were prepared from pure Al (99.9 wt.%), Al-10 wt.%Ni and Al-10 wt.%Ce master alloys in an arc melting furnace under an argon atmosphere. After melting, the liquid alloy was held at 810 °C for 20 min to adjust the chemical composition. Next, it was poured from the crucible into a mold with an inner diameter of 22 mm, an outer diameter of 65 mm and a height of 100 mm. After the cooling of the ingots, they were annealed and recrystallized by heat treatment at 450 °C for 180 min and then cooled in air. The heat treatment is used to further relieve residual stresses in the casting.
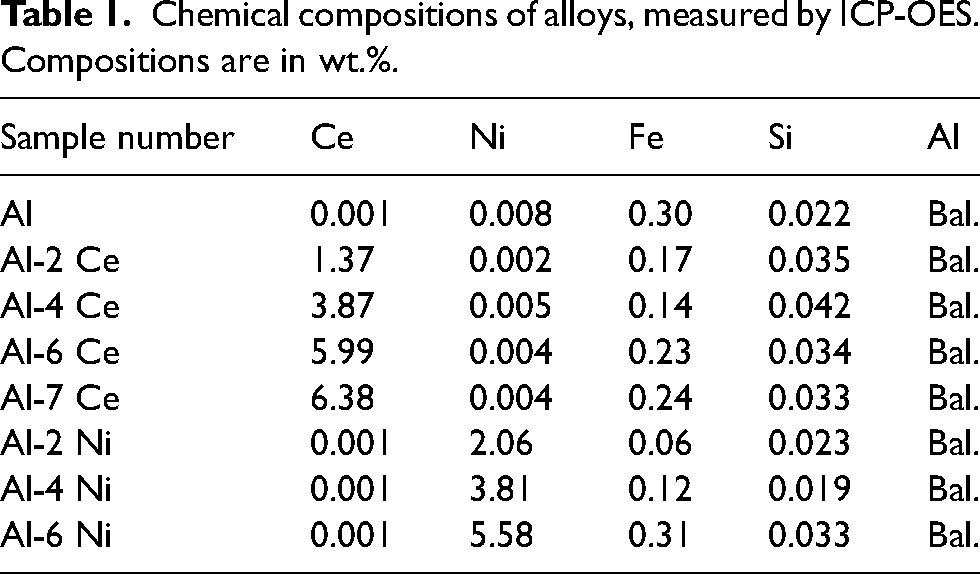
The elemental content was determined by inductively coupled plasma optical emission spectrometry (ICP-OES). The detailed chemical compositions of all samples are listed in Table 1. The melting loss makes it difficult to accurately control the composition of the alloys, however, this does not affect the study of changes in their properties.
Chemical compositions of alloys, measured by ICP-OES. Compositions are in wt.%.
Microstructural characterization
For phase identification and calculation of lattice constant, the specimens were analyzed by X-ray diffraction (XRD) using a Bruker Advance D8 Discover 2500 machine along with Cu-Kα1, with a scanning rate at 2 °/min in continuous mode. The microstructure and distribution of the matrix and eutectic phases were recognized using scanning electron microscopy (SEM) equipped with energy disperse spectroscopy (EDS). To further characterize the eutectic phase of the alloy, the microstructure and phase composition were analyzed by transmission electron microscopy (TEM).
Microhardness and mechanical testing
The Vickers microhardness test of the samples was carried out at room temperature, preceded by grinding and polishing. More than five tests were made for each specimen with a load of 50 g and a dwell time of 15 s.
The samples were first cut into dog-bone-shaped tensile specimens of 15 mm in gauge length and 4 mm in width and then mechanically polished to determine cross-section more accurately. Tensile tests were conducted by using an Instron 3369 mechanical with a nominal strain rate of 0.001 s−1 at room temperature.
Alloys were machined into cylindrical tensile specimens for high-temperature tensile testing, with a gauge length of 35 mm and a diameter of 4 mm. Tensile tests were carried out at 200 °C using an Instron 3369 mechanical testing machine. Prior to tensile, the specimens were hold at a predetermined temperature for at least 15 min to ensure that the temperatures in the specimen and in the testing machine were consistent. Each sample was tested three times to ensure the reproducibility of the data.
Electrical conductivity measurements
The electrical conductivity was collected by a digital conductivity meter (D60 K) at room temperature, and at least five points were measured for each sample.
Results
Microstructure
The XRD patterns of Al-xCe and Al-xNi alloys are shown in Figure 1, respectively. According to the indexed results, there are Al (PDF: 03–065–2869) with a face-centered cubic structure, and Al11Ce3 (PDF: 04-003-2729) with an orthorhombic crystal structure in Al-xCe alloys, and the Al-xNi alloys consisting of Al and Al3Ni(PDF: 04-007-0382) with an orthorhombic crystal structure. The intensity of diffraction peaks can correspond to the content of phases in the case that the diffraction peaks are not affected by the texture. As the element content increases, the diffraction peaks of the Al11Ce3/Al3Ni phase rise, indicating an increase in the volume proportion of intermetallic compounds. Meanwhile, the volume fraction of the Al11Ce3/Al3Ni phase was calculated by the Rietveld refinement; the values of Al11Ce3 phase in Al-7Ce alloy and Al3Ni phase in Al-6Ni alloy reached 7.7 vol.% and 8.9 vol.%, respectively. The lattice parameters of α-Al phase did not produce regular changes with the increase in elemental content, indicating a low solid solubility of Ce/Ni elements in the Al matrix.
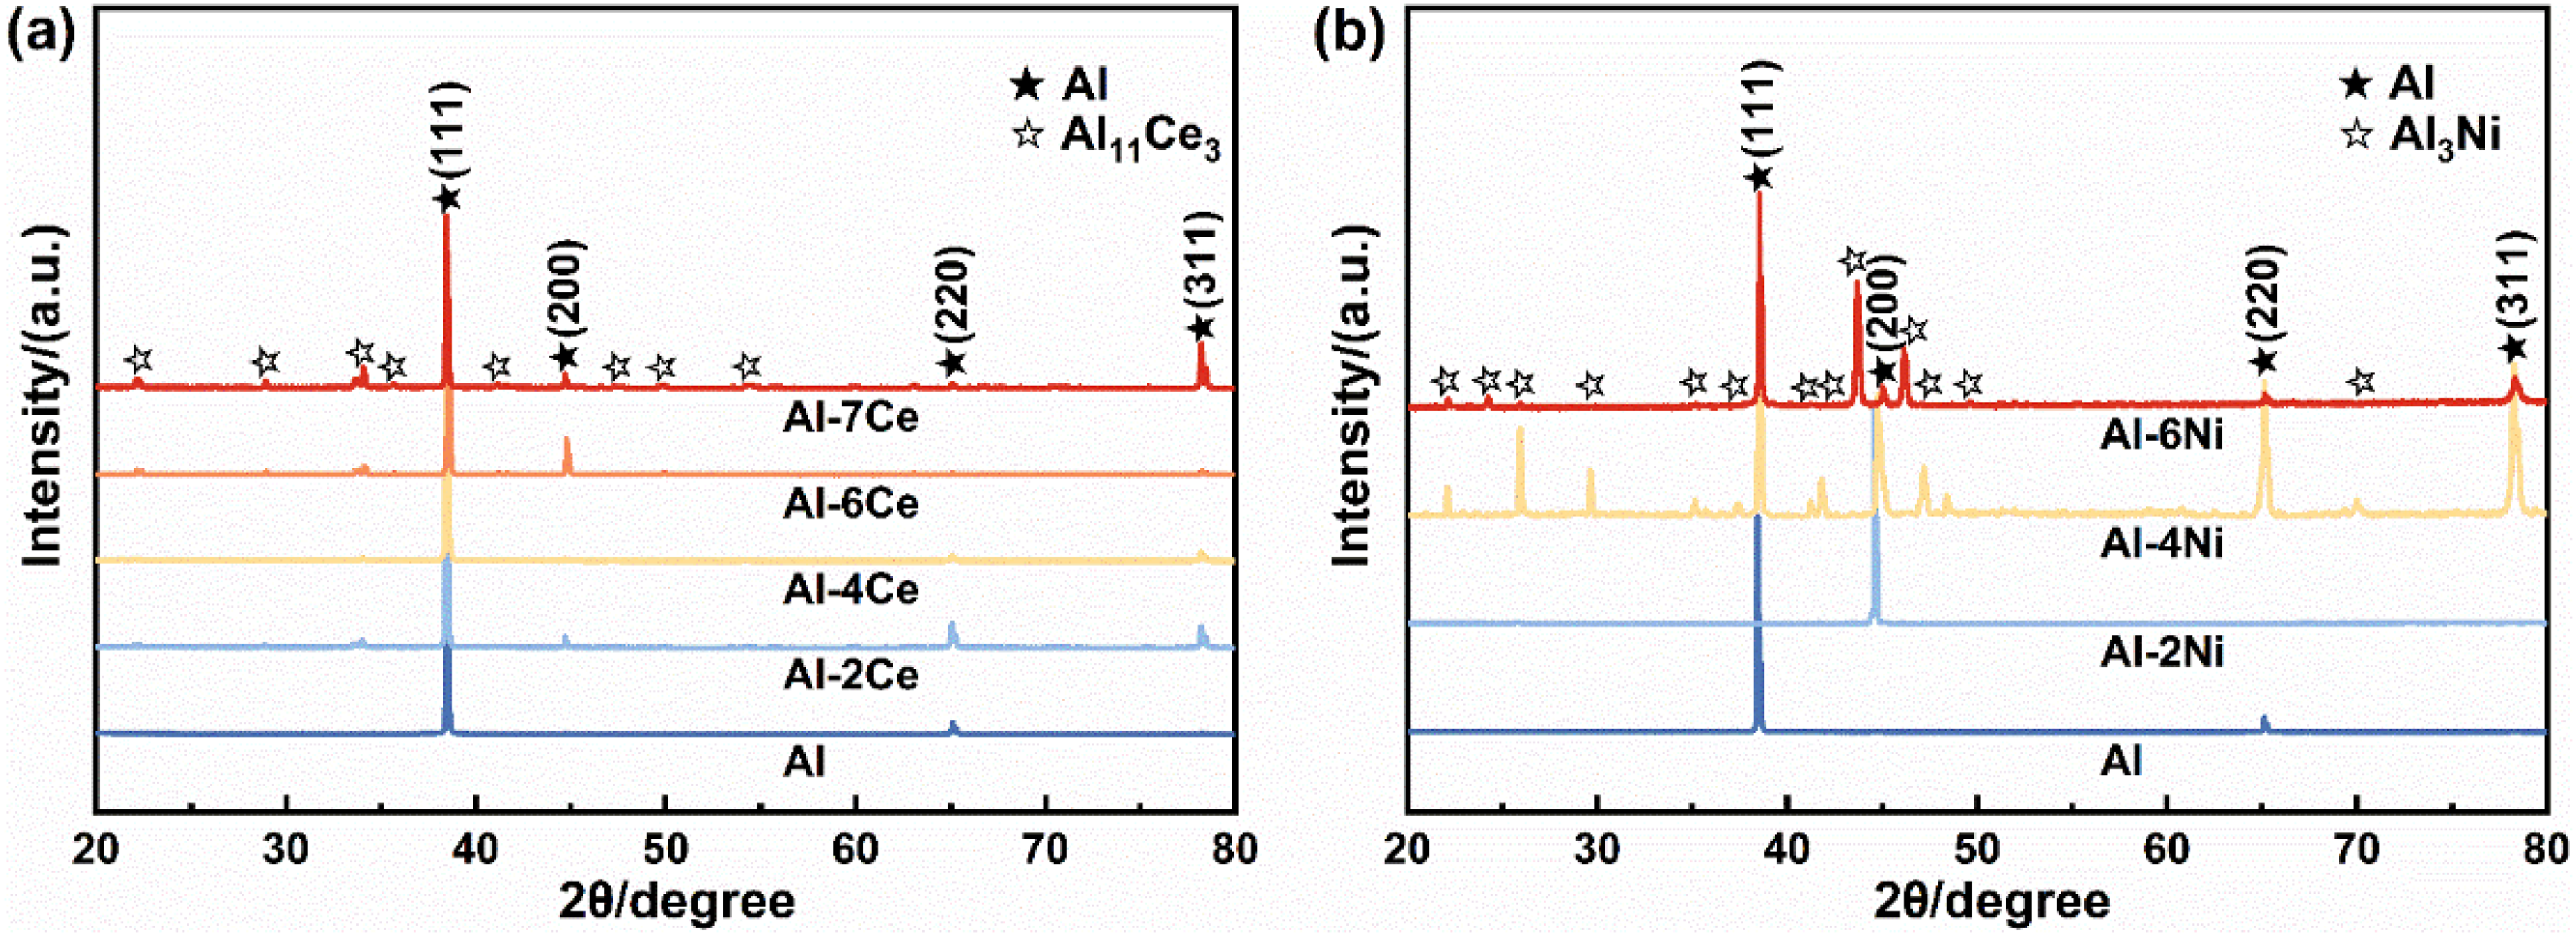
X-ray diffraction patterns of the Al-xCe and Al-xNi alloys.
Typical microstructures of seven alloys are shown in Figure 2. The dark gray regions in the figure are primary α-Al, and the brighter regions are eutectic phases. The Al-xCe alloys have a typical hypoeutectic microstructure, with α-Al solidifying first to form dendrites, and eutectic crystals are present in the inter-dendritic regions (Figure 2(a)-(d)). Slightly coarser Al11Ce3 lamellae are distributed at the edge of dendritic. The microstructure shifts towards a fully eutectic structure when the content of Ce is gradually increased to 7 wt.%, which is in agreement with the results obtained from the phase diagrams. 48 It shows that with the addition of Ce, the volume fraction of Al-Al11Ce3 eutectic structure increases from 12±2% to 59±3%, showing a continuous distribution with reticulation morphology. Al-xNi alloys microstructure change rule is basically consistent with Al-xCe alloys and the volume fraction of Al-Al3Ni eutectic structure increases from 21±2% to 60±4% and finally to 100%. The content of the eutectic structure shows a positive correlation with the compositional content but not a linear correlation, which is in agreement with the results obtained from the stoichiometric calculations. 9 The microstructure of the Al-6Ni alloy is fully eutectic. As shown in Figure 2(g), eutectic lamellar colonies with different orientations intersect the polished section.
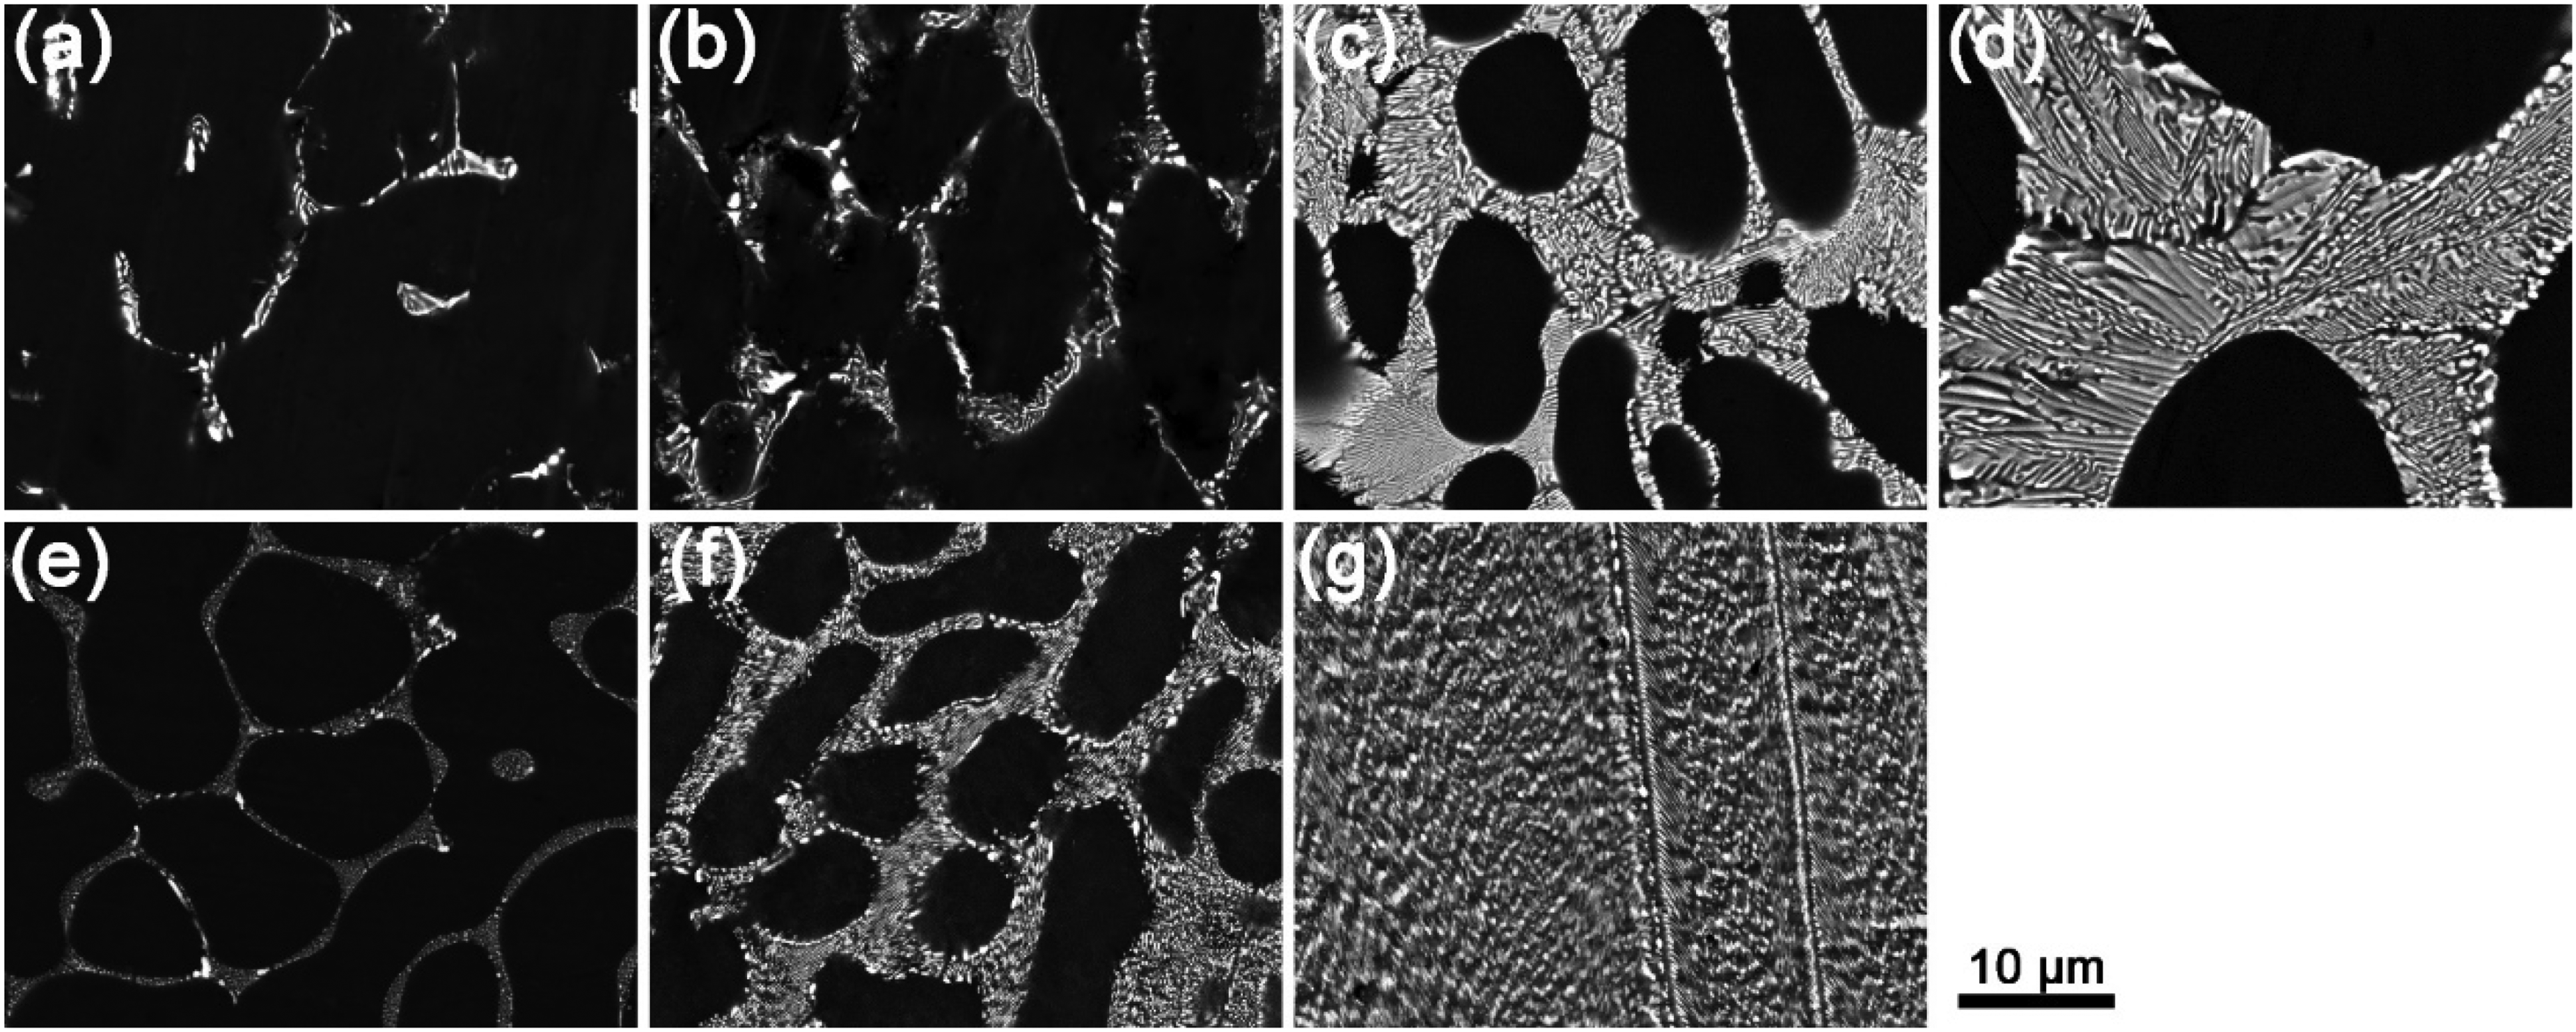
SEM images of the (a) Al-2Ce, (b) Al-4Ce, (c) Al-6Ce, (d) Al-7Ce, (e) Al-2Ni, (f) Al-4Ni and (g) Al-6Ni alloys.
In Figure 3, the morphology of Al11Ce3 phase and Al3Ni phase is further characterized. For hypoeutectic alloys, the solidified eutectic consists of regularly arranged Al and Al11Ce3 lamellae(Figure 3(a)-(d)), in agreement with what has been reported in the literature. 49 The Al11Ce3 phase in the as-cast Al-2Ce alloy exhibits a coarse layered morphology, as seen in Figure 3(a). It is found that the addition of Ce has no noteworthy effect on the lamellar shape and size of the Al11Ce3 phase, as shown in Figure 3(b)-(d). The eutectic Al3Ni phase of Al-Ni alloys is in the form of fine rods in Figure 3(e)-(g) and previous study has characterized the Al3Ni phase as a short rod shape. 45 There is also no obvious effect on the shape, size or arrangement of Al3Ni fibers with the increase of Ni content. The microstructures and EDS analysis of Al-7Ce alloy and Al-4Ni alloy are shown in Figure 4. Combined with the EDS analysis in Figure 4 for points A and C and the XRD pattern in Figure 1, the Ce-containing phase is further identified as the Al11Ce3 eutectic phase, and the Ni-bearing phase as the Al3Ni eutectic phase. For the EDS analysis of points B and D in Figure 4, the extremely low solid solubility of Ce and Ni in Al is further verified, which would attenuate the adverse effect of the solid solution on conductivity. The contents of Ce and Ni are higher than the theoretical values for room-temperature solid solubility, probably due to the larger spot diameters of the SEM spectra.
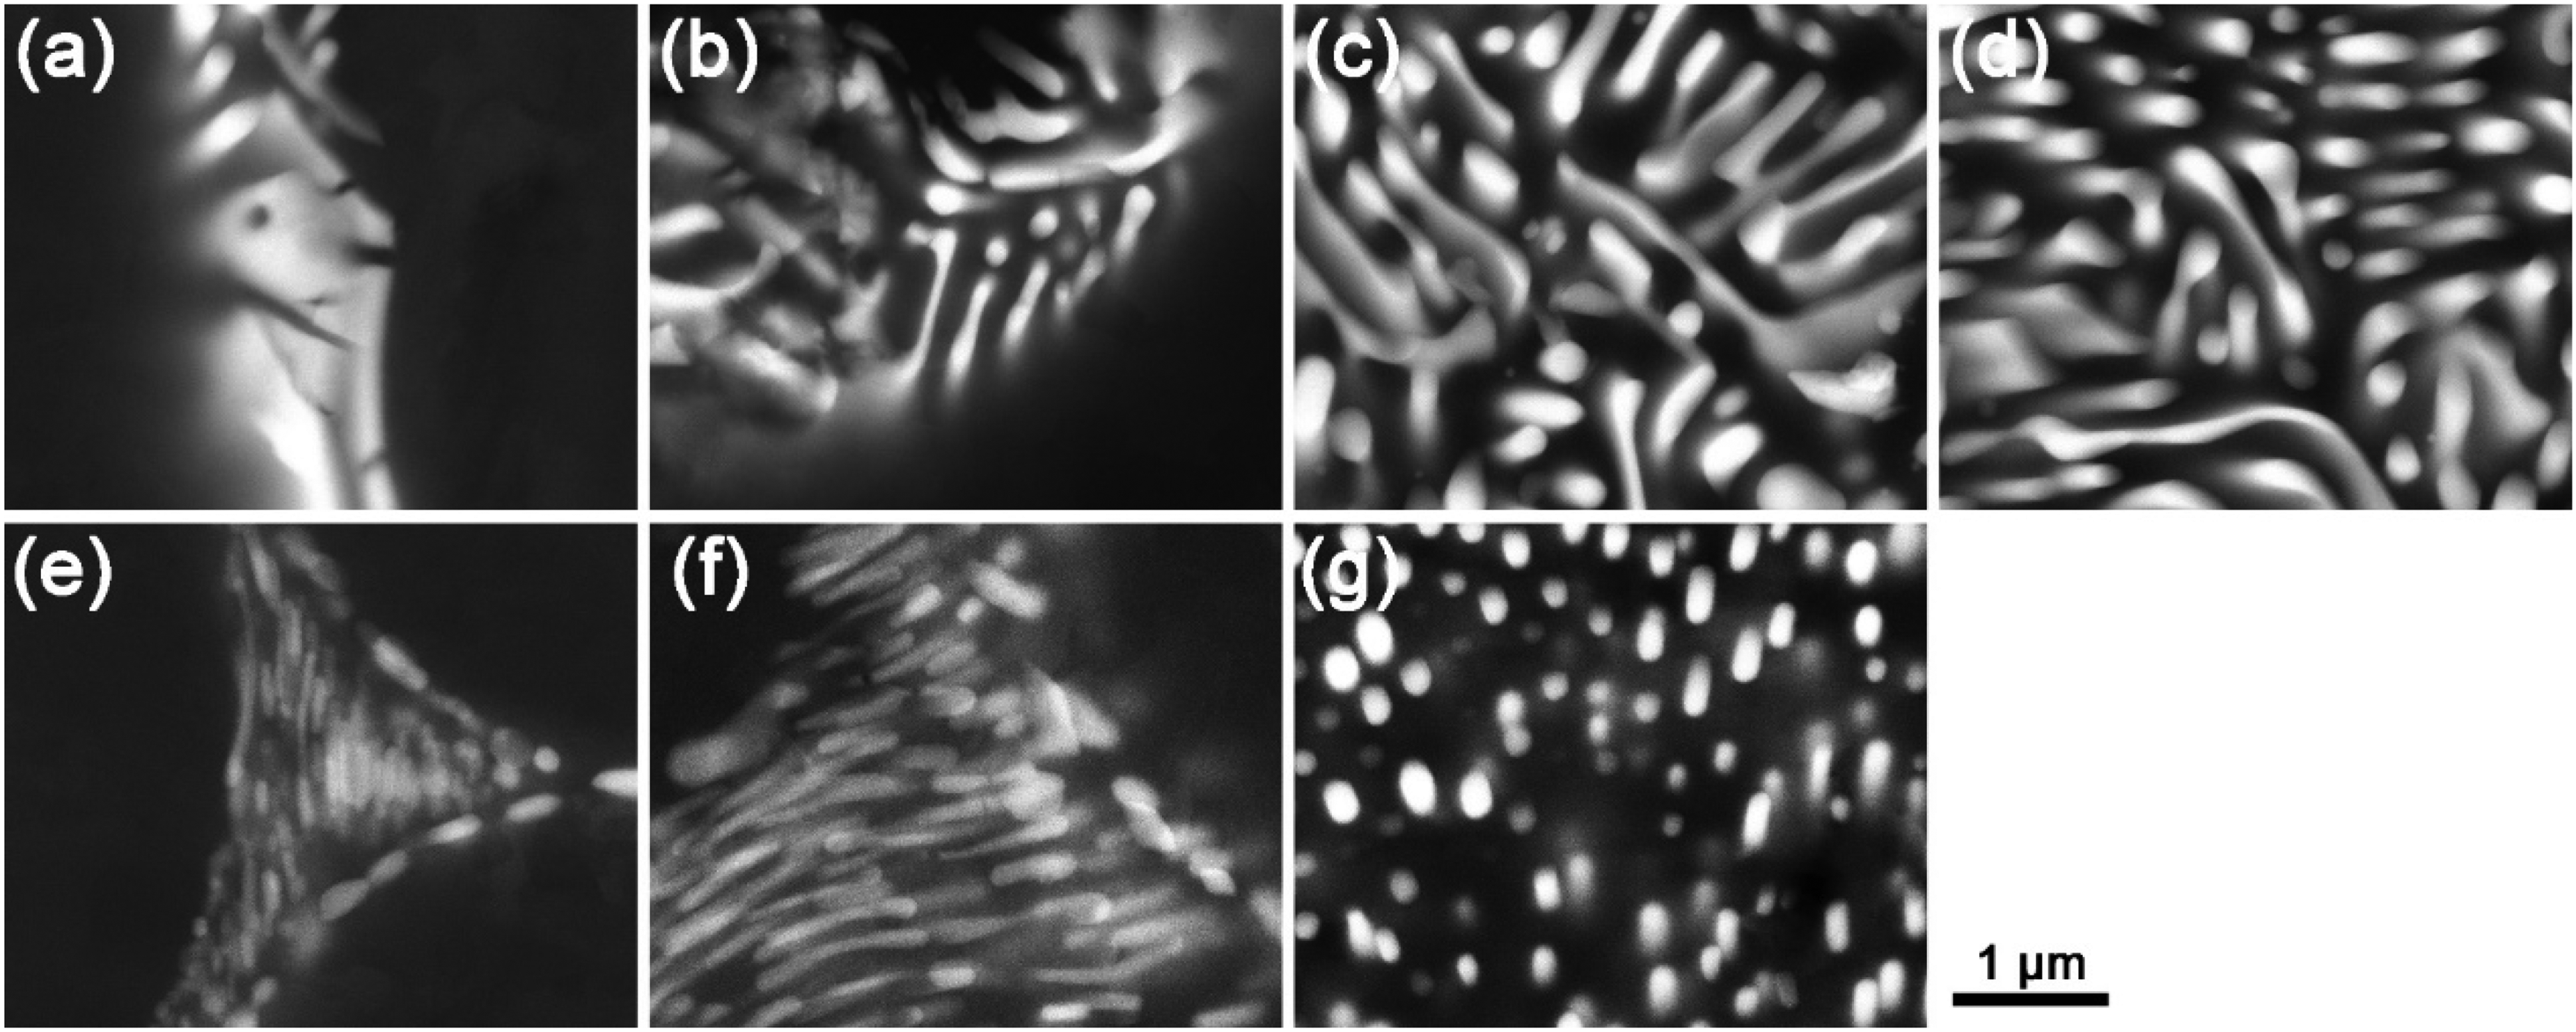
Eutectic microstructures in as-cast (a) Al-2Ce, (b) Al-4Ce, (c) Al-6Ce, (d) Al-7Ce, (e) Al-2Ni, (f) Al-4Ni and (g) Al-6Ni alloys.
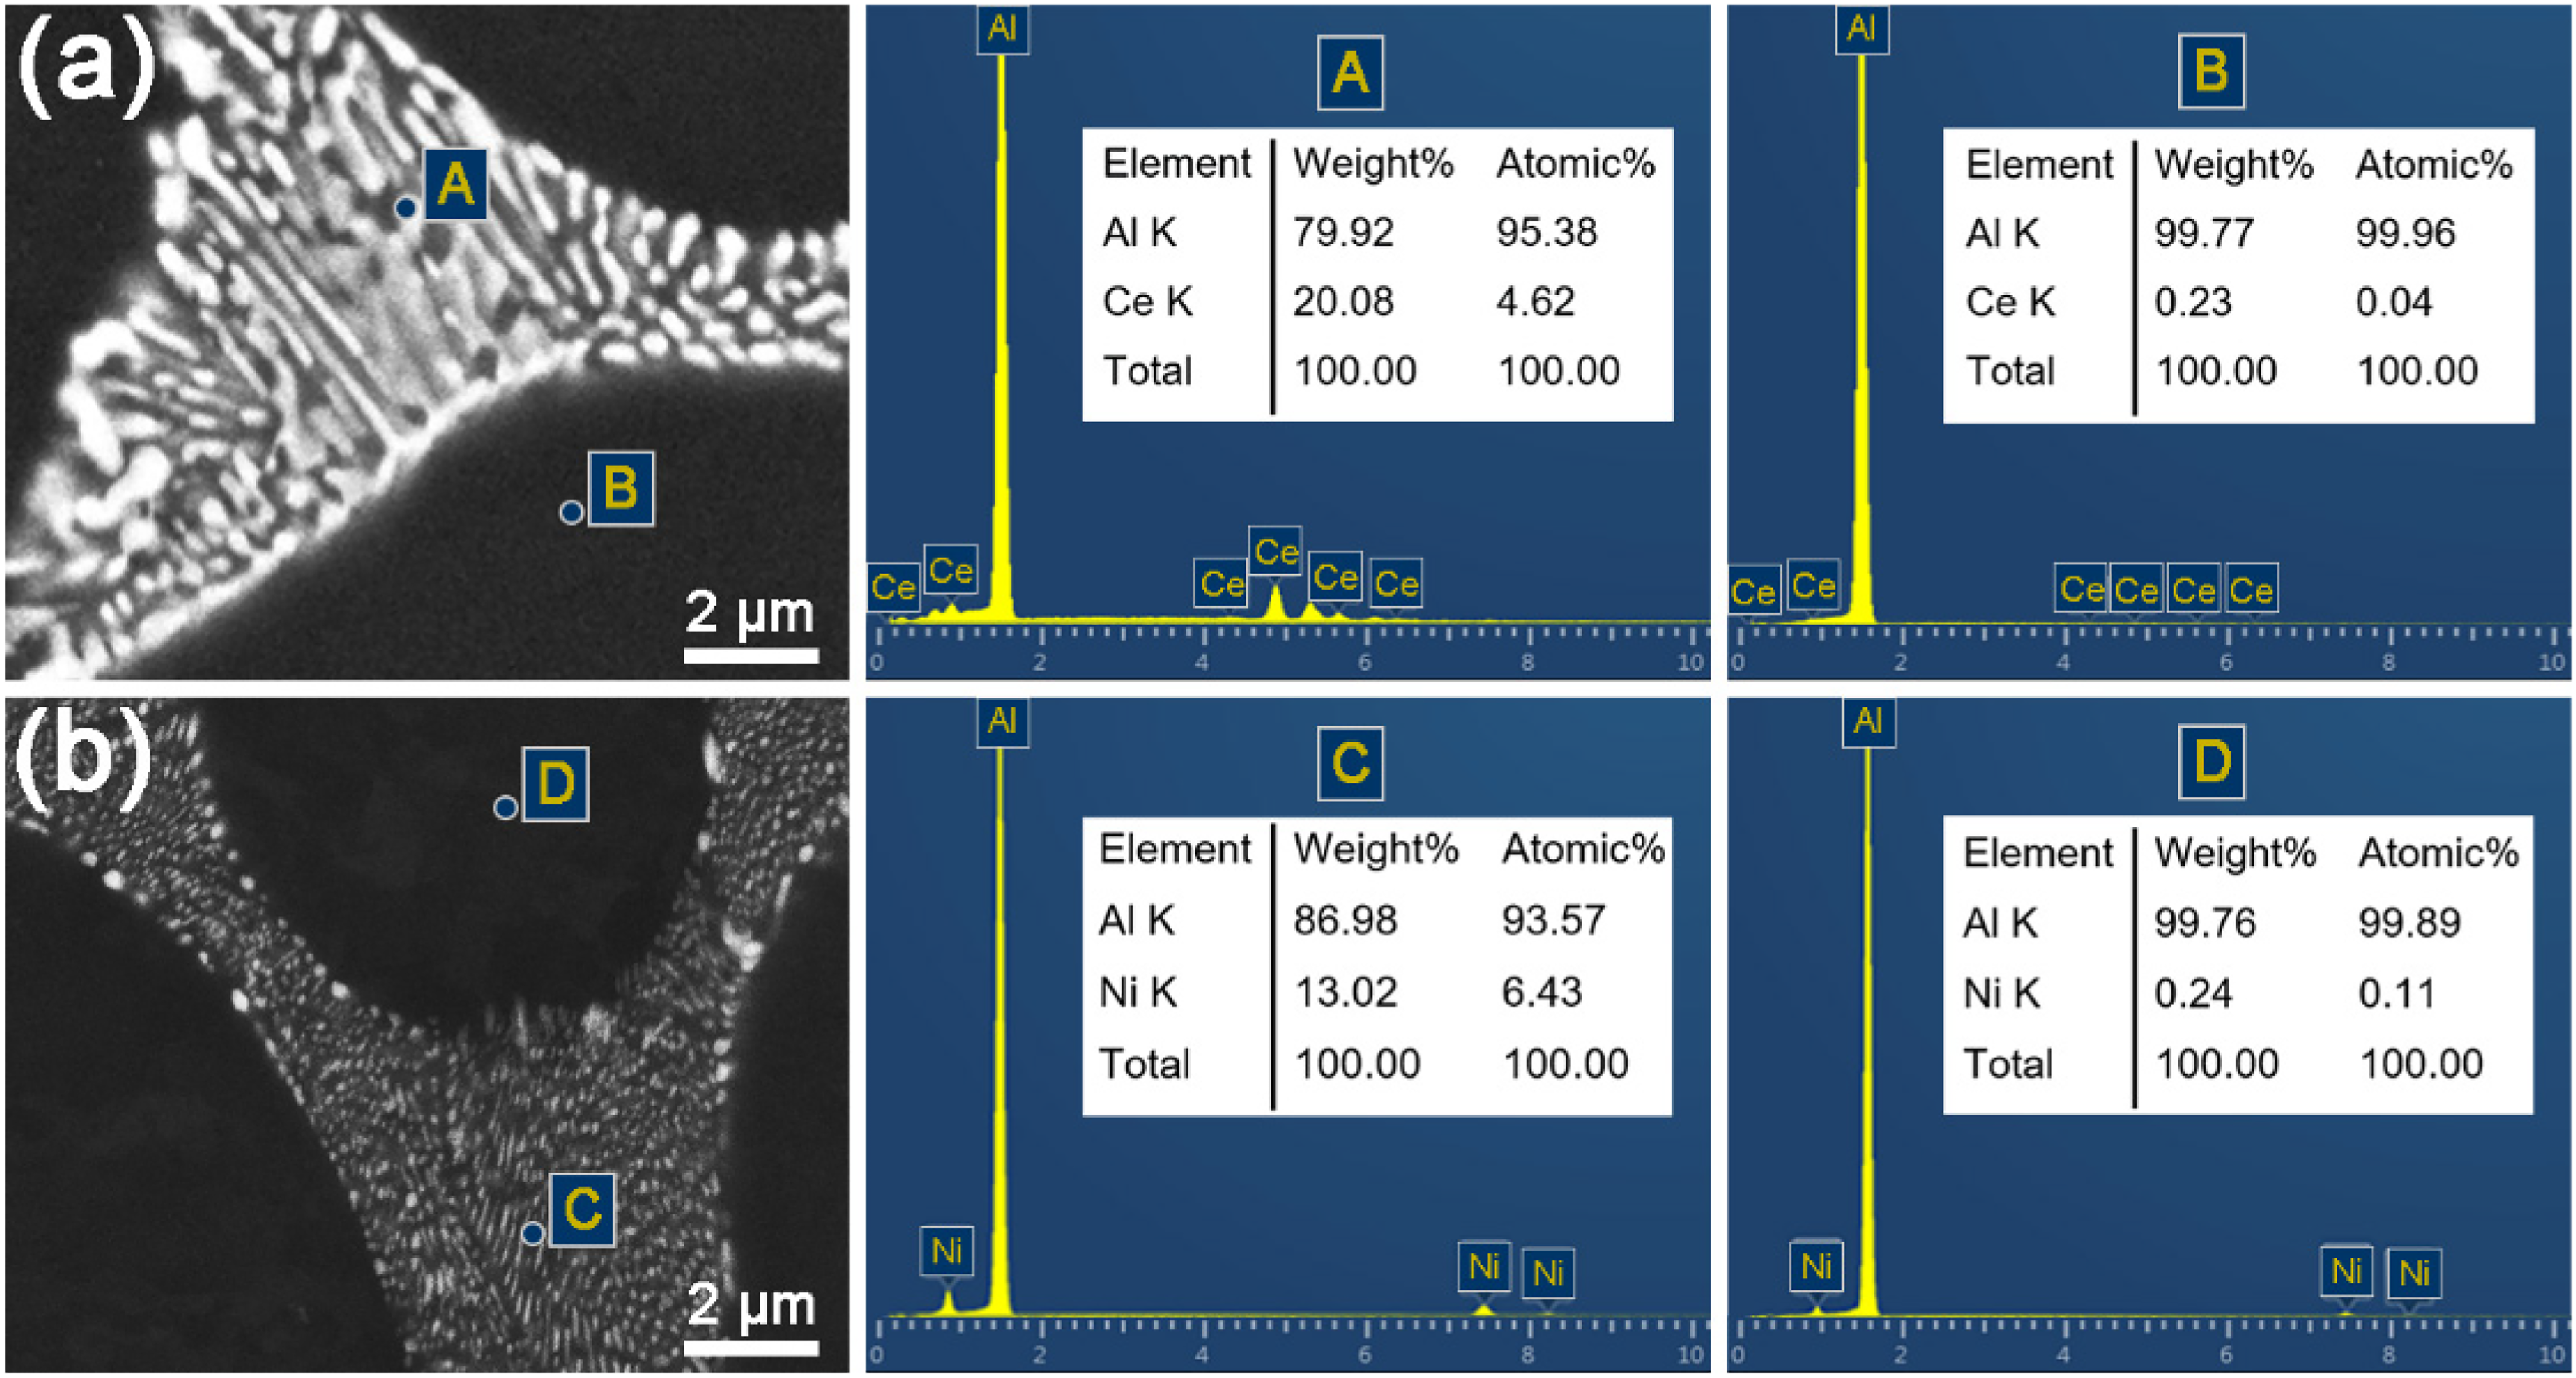
Microstructures and EDS analysis of (a) Al-7Ce alloy and (b) Al-4Ni alloy.
TEM micrographs of the two intermetallic phases, Al11Ce3 and Al3Ni, are given in Figure 5(a) and (b), respectively. The average thickness of Al11Ce3 lamellar and the average diameter of the Al3Ni fibers are 196±36 nm and 83±18 nm, respectively. Figure 5(c)-(e) shows SAED patterns along [011]Al direction corresponding to the regions marked with different dotted circles in Figure 5(a) and (b). The crystal structures of both Al11Ce3 and Al3Ni are orthorhombic. The orientation relations (OR) between α-Al matrix and Al11Ce3 phase were observed:
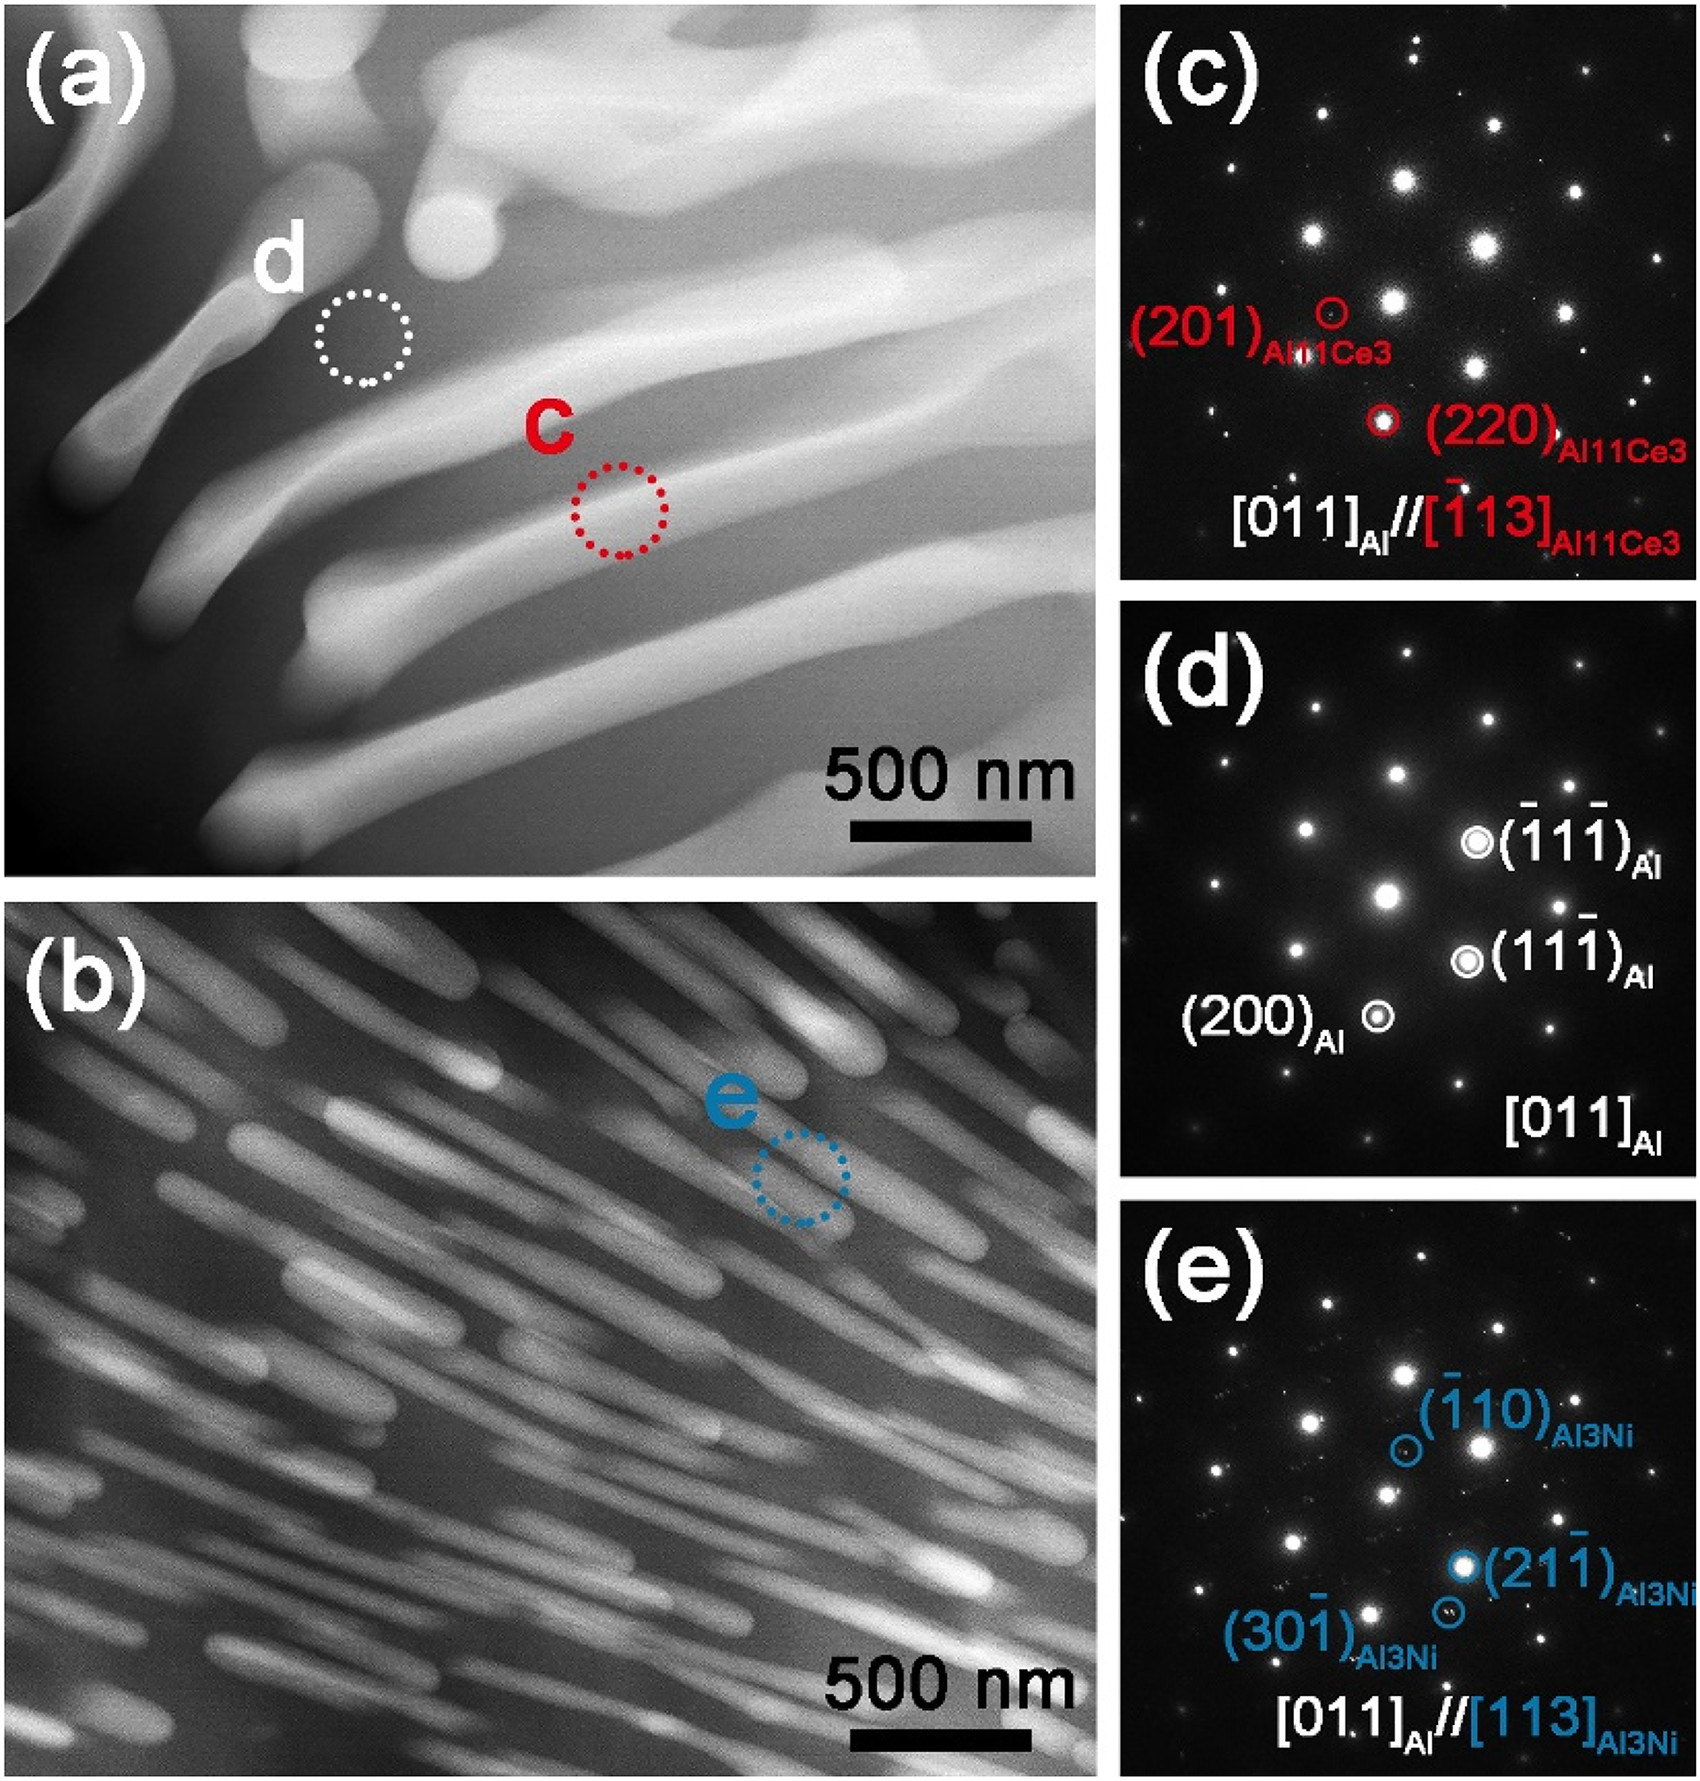
STEM-HAADF images showing the size and spacing of eutectic phase in (a) Al-7Ce alloy and (b) Al-6Ni alloy. SAED patterns along [011]Al direction of (c) the region marked by dotted circle in (a), (d) the region marked by dotted circle in (a) and (e) the region marked by dotted circle in (b).
Electrical conductivity and microhardness
Figure 6 reveals the trend of microhardness and electrical conductivity of the samples with variations in elemental content. The hardness of pure Al is 20.3±0.7 HV. The hardness of the castings slightly increases to 33±3 HV and 33±1 HV when Ce and Ni reach 2 wt.%, respectively. When the Ce content was further increased to 4 wt.%, 6 wt.%, and 7 wt.%, the hardness values improved significantly to 45±5 HV, 51±3 HV and 59±5 HV, respectively. The macrohardness values of Al-4Ni and Al-6Ni have also been increased by 23±1 HV and 46±2 HV, respectively. The improvement in hardness is due to the introduction of a higher volume fraction of the second phase by increasing the elemental content. The electrical conductivities of Al-Ce alloys and Al-Ni alloys decrease from 63.1 ±0.3% IACS to 51.3±0.4% IACS and 54.2±0.2% IACS, respectively. The Ce/Ni content in the matrix remains essentially unchanged as the added elemental content is increased, and the increase in the second phase content results in a small decrease in electrical conductivity.
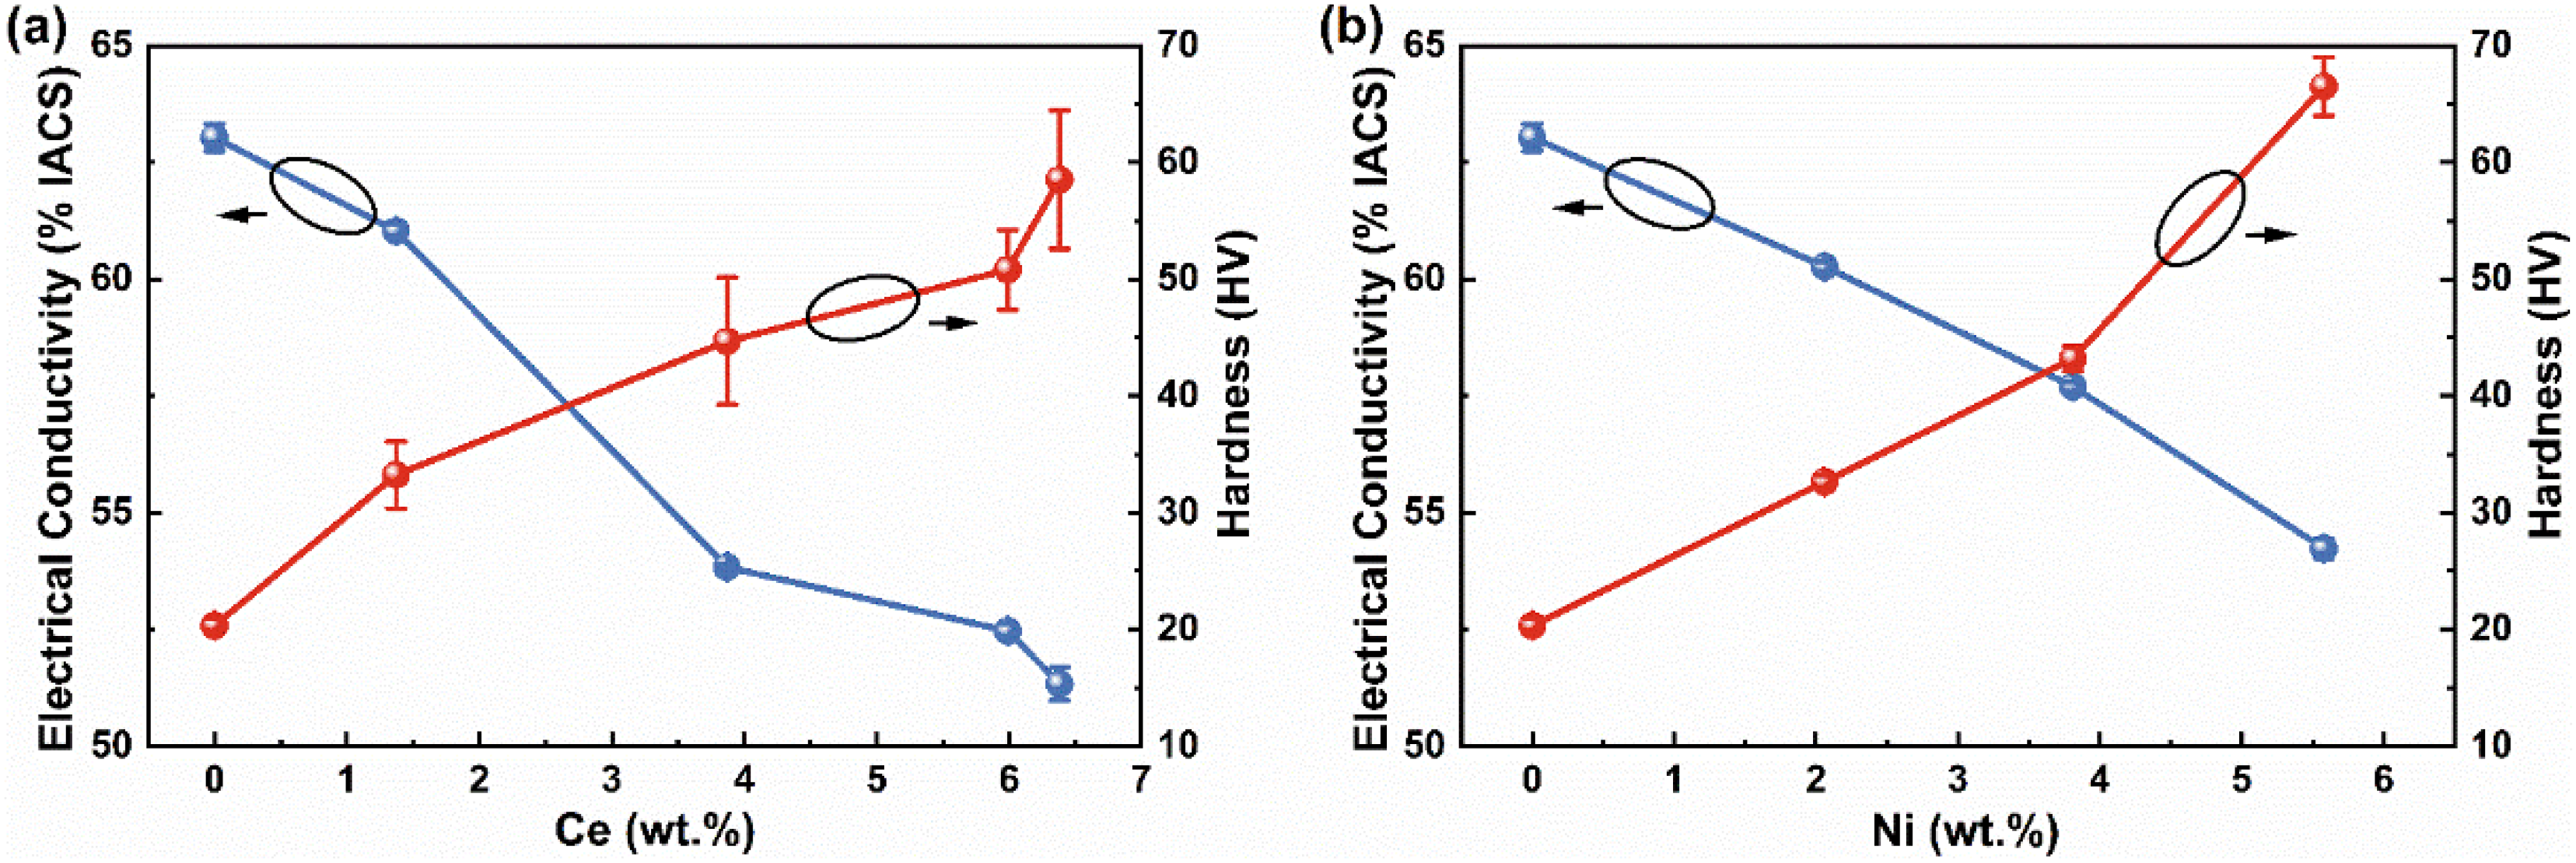
Electrical conductivities and microhardness of (a) Al-xCe, (b) Al-xNi alloys.
Room- and high-temperature mechanical properties
The typical engineering stress-strain curves testing at room temperature are shown in Figure 7, and cast pure Al was also tested for comparison. The tensile properties of these seven alloys are significantly improved compared to pure Al. With the increase of Ce/Ni content, the yield strength increases from 22±1 MPa to 112±7 MPa, and the plasticity decreases from 77±2% to 17±1%. The ultimate tensile strength (UTS) values of Al–7Ce and Al–6Ni alloys were 126±5 MPa and 173±9 MPa, respectively. The average values of YS, UTS and elongation (EI) for all samples are summarized in Table 2. The resulting tensile properties correlate well with the measured hardness values.
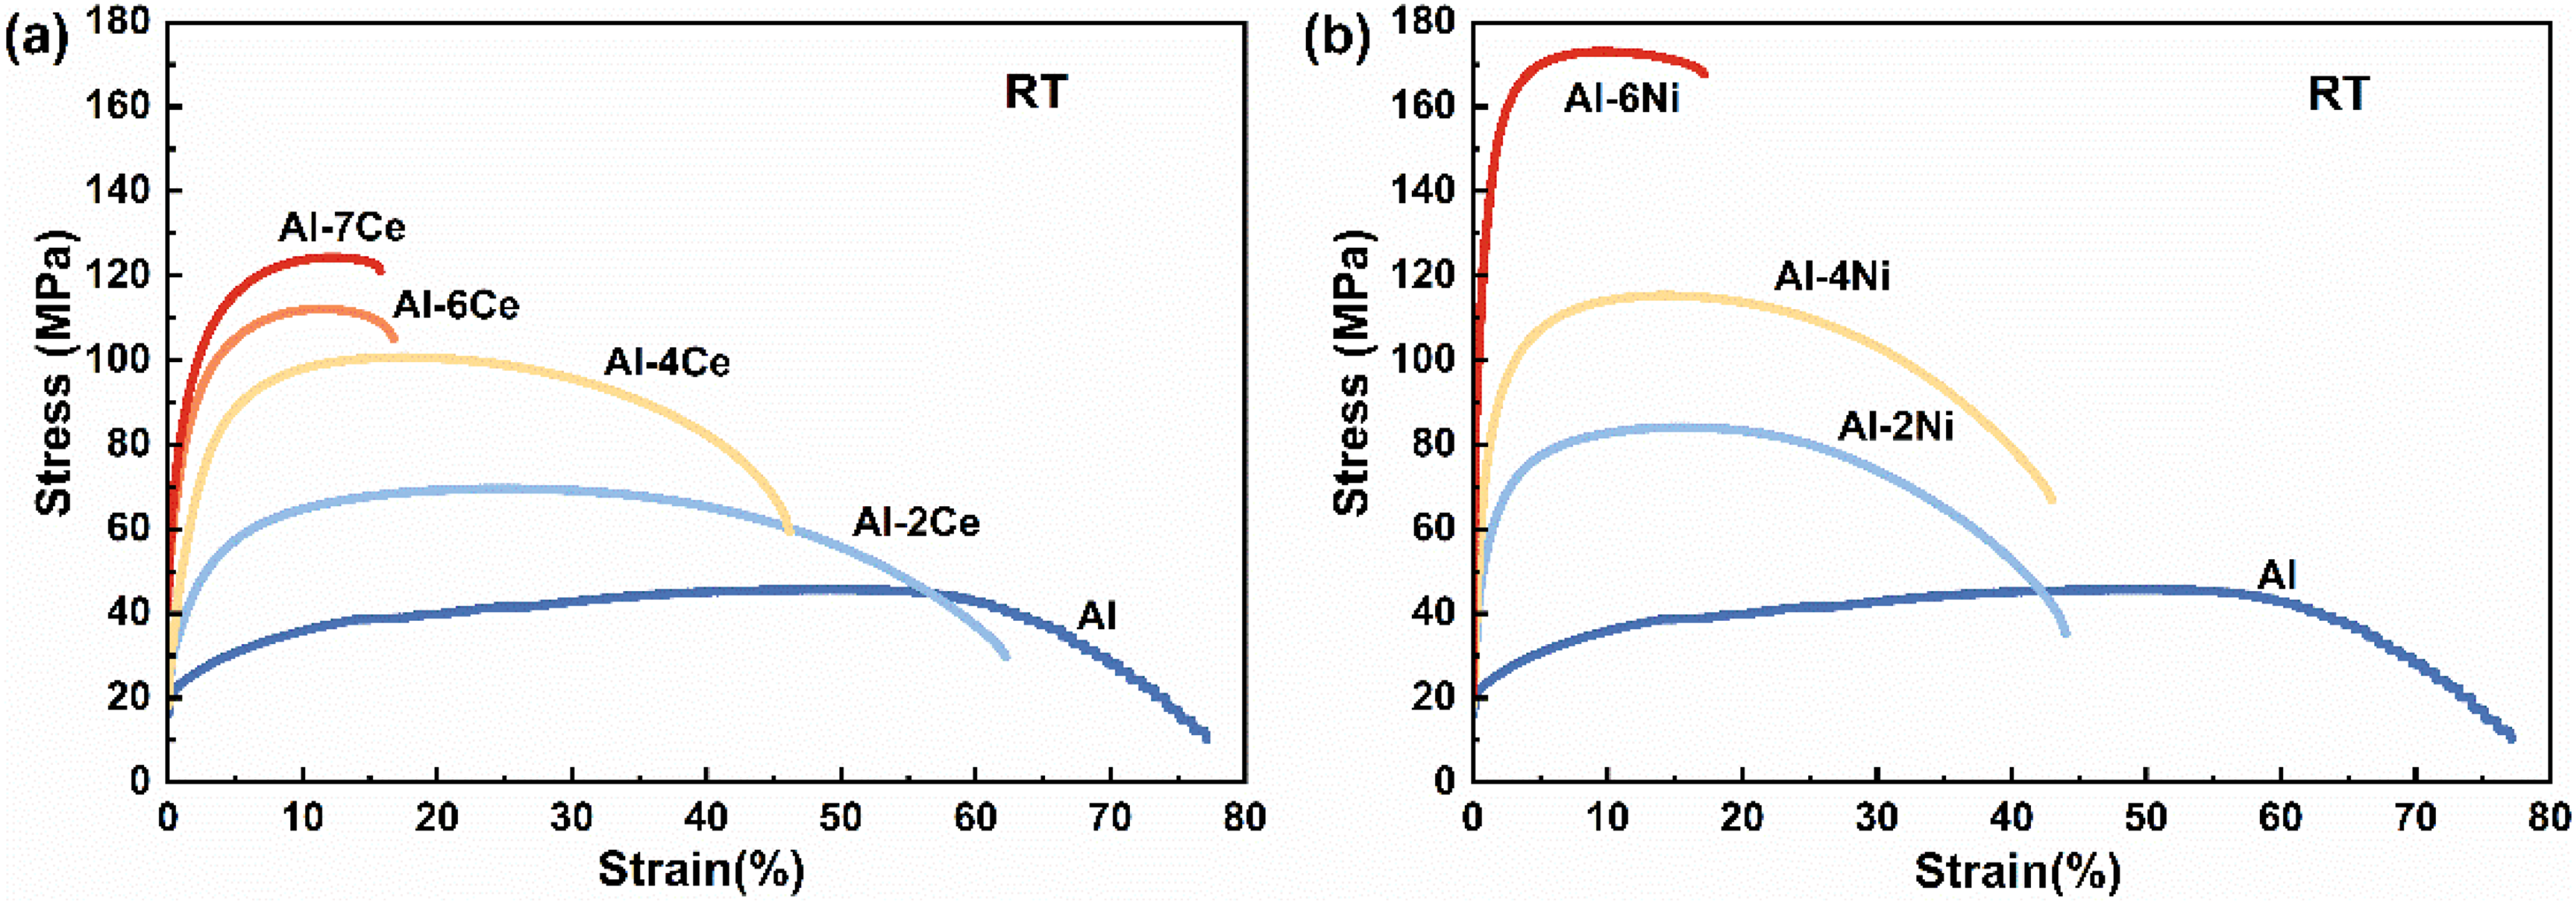
Tensile engineering stress-strain curves at room temperature of (a) Al-xCe, (b) Al-xNi alloys.
The mechanical properties (at RT) and yield stress retention ratio of Al-xCe and Al-xNi alloys.
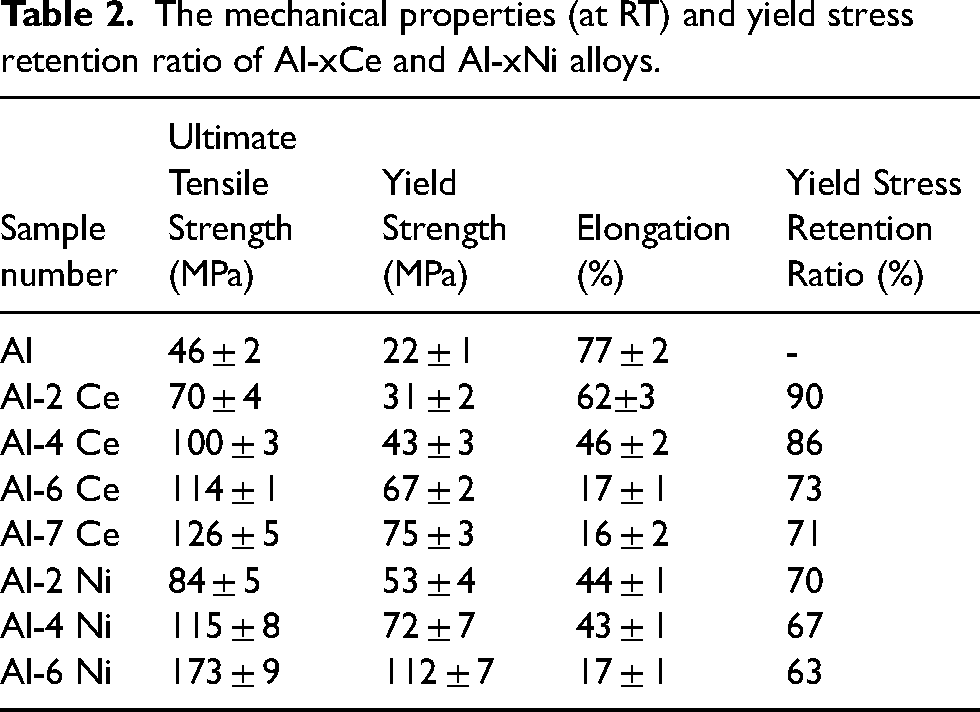
The stress-strain diagrams obtained from tensile testing at 200 °C are shown in Figure 8, with a decrease in mechanical properties. For the Al-2Ce, Al-4Ce, Al-6Ce, Al-7Ce, Al-2Ni, Al-4Ni and Al-6Ni alloys, the UTS decreases to 38±2 MPa, 59±3 MPa, 74±2 MPa, 78±4 MPa, 50±3 MPa, 65±3 MPa and 81±4 MPa, the YS decreases to 28±1 MPa, 37±3 MPa, 49±2 MPa, 53±4 MPa, 37±2 MPa, 48±2 MPa and 71±4 MPa at 200 °C, respectively. To further evaluate the effect of temperature on the strengthening of alloys, YS retention ratios were calculated by dividing the yield stress at elevated temperatures by the yield stress at RT (Table 2). The YS retention ratio of both Al-Ce and Al-Ni alloys are high and not very different, with the maximum retention of 90% and the maximum scattering of no more than 30%, which is intimately related to the resistance to coarsening of the eutectic phase in both compositions. High strength retention values are generally considered a measure of high thermal stability of metal alloys.
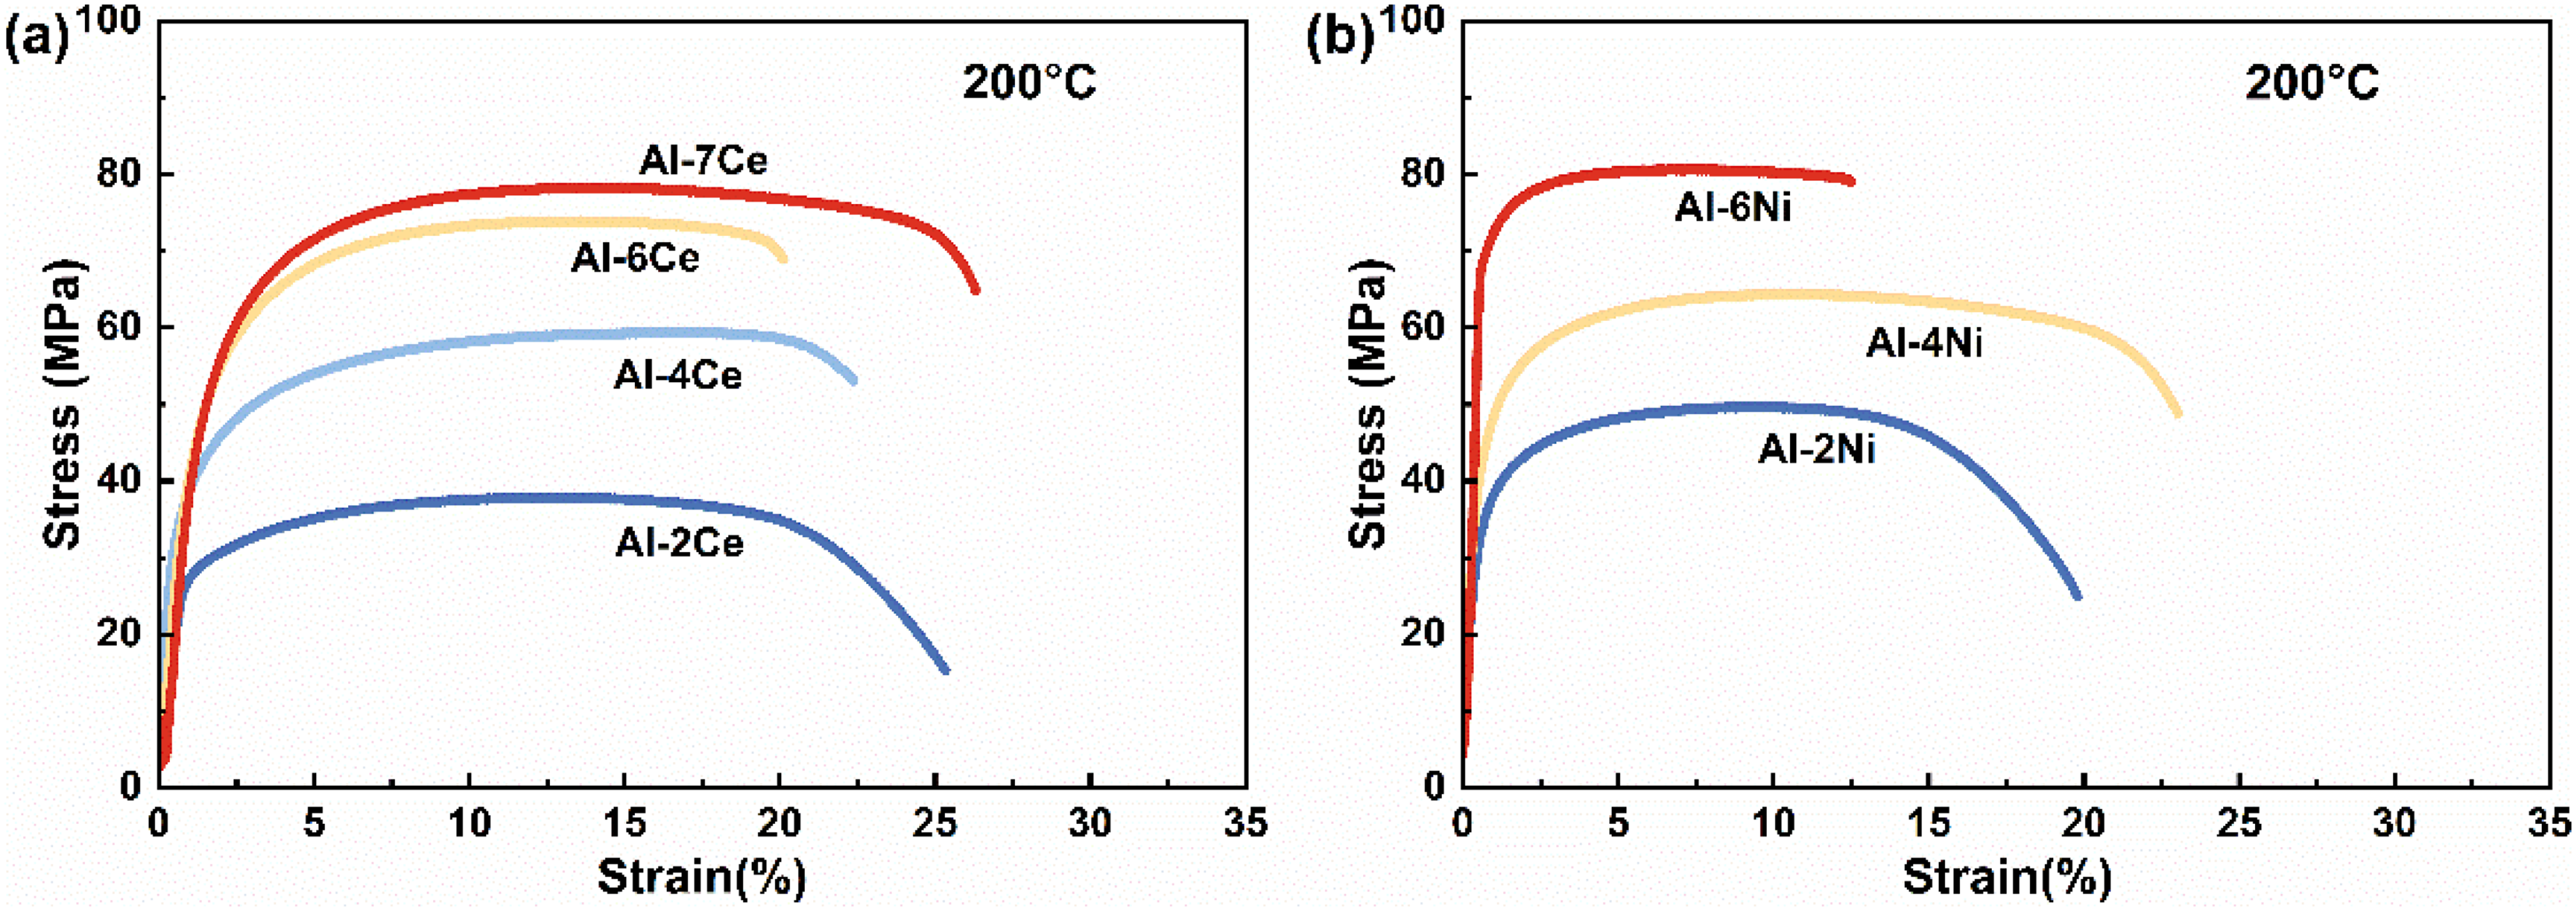
Tensile engineering stress-strain curves at 200°C of (a) Al-xCe, (b) Al-xNi alloys.
Discussion
Microstructure evolution
Since precipitation strengthening cannot be achieved in Al-Ce and Al-Ni alloys, the solidification organization of the two eutectic crystals plays a crucial role in their properties. The microstructure of hypoeutectic alloys exhibits two phases, the primary α-Al and binary eutectic phase. The primary Al phase grows in a coarse equiaxed dendritic manner and the eutectic phases evenly distribute in the interdendritic regions. The morphology of eutectic Al11Ce3 is a periodic arrangement of lamellae with a mean thickness of about 196±36 nm, and the morphology of Al3Ni eutectic is a fiber with an average diameter of about 83±18 nm, both similar to previous studies.43,51–53 Both nanoscale lamellar and fiber structures are key factors in strengthening alloys. As expected, there is no notable variation in eutectic size and spacing at the same cooling rate. 54 The volume fraction of the eutectic structure increases with elemental content. It is implied that the volume fraction, as the most significant variable, is the key factor affecting the properties of hypoeutectic alloys, i.e., strength, hardness and electrical conductivity.
Strengthening mechanisms
The relationship between YS values and the volume fraction of eutectic structure is shown in Figure 9. In this study, the relationship appears to be linear, which is consistent with previous findings for cast Al-Ni alloys.
55
Although grain size affects mechanical properties, the grain size interval in this study is 400–900 µm, and the large grain size results in negligibly low Hall-Petch strengthening contributing values at room temperature.56,57 The yield stress of the alloy is assumed to be the linear sum of the strengthening increments of aluminum matrix and eutectic structure.
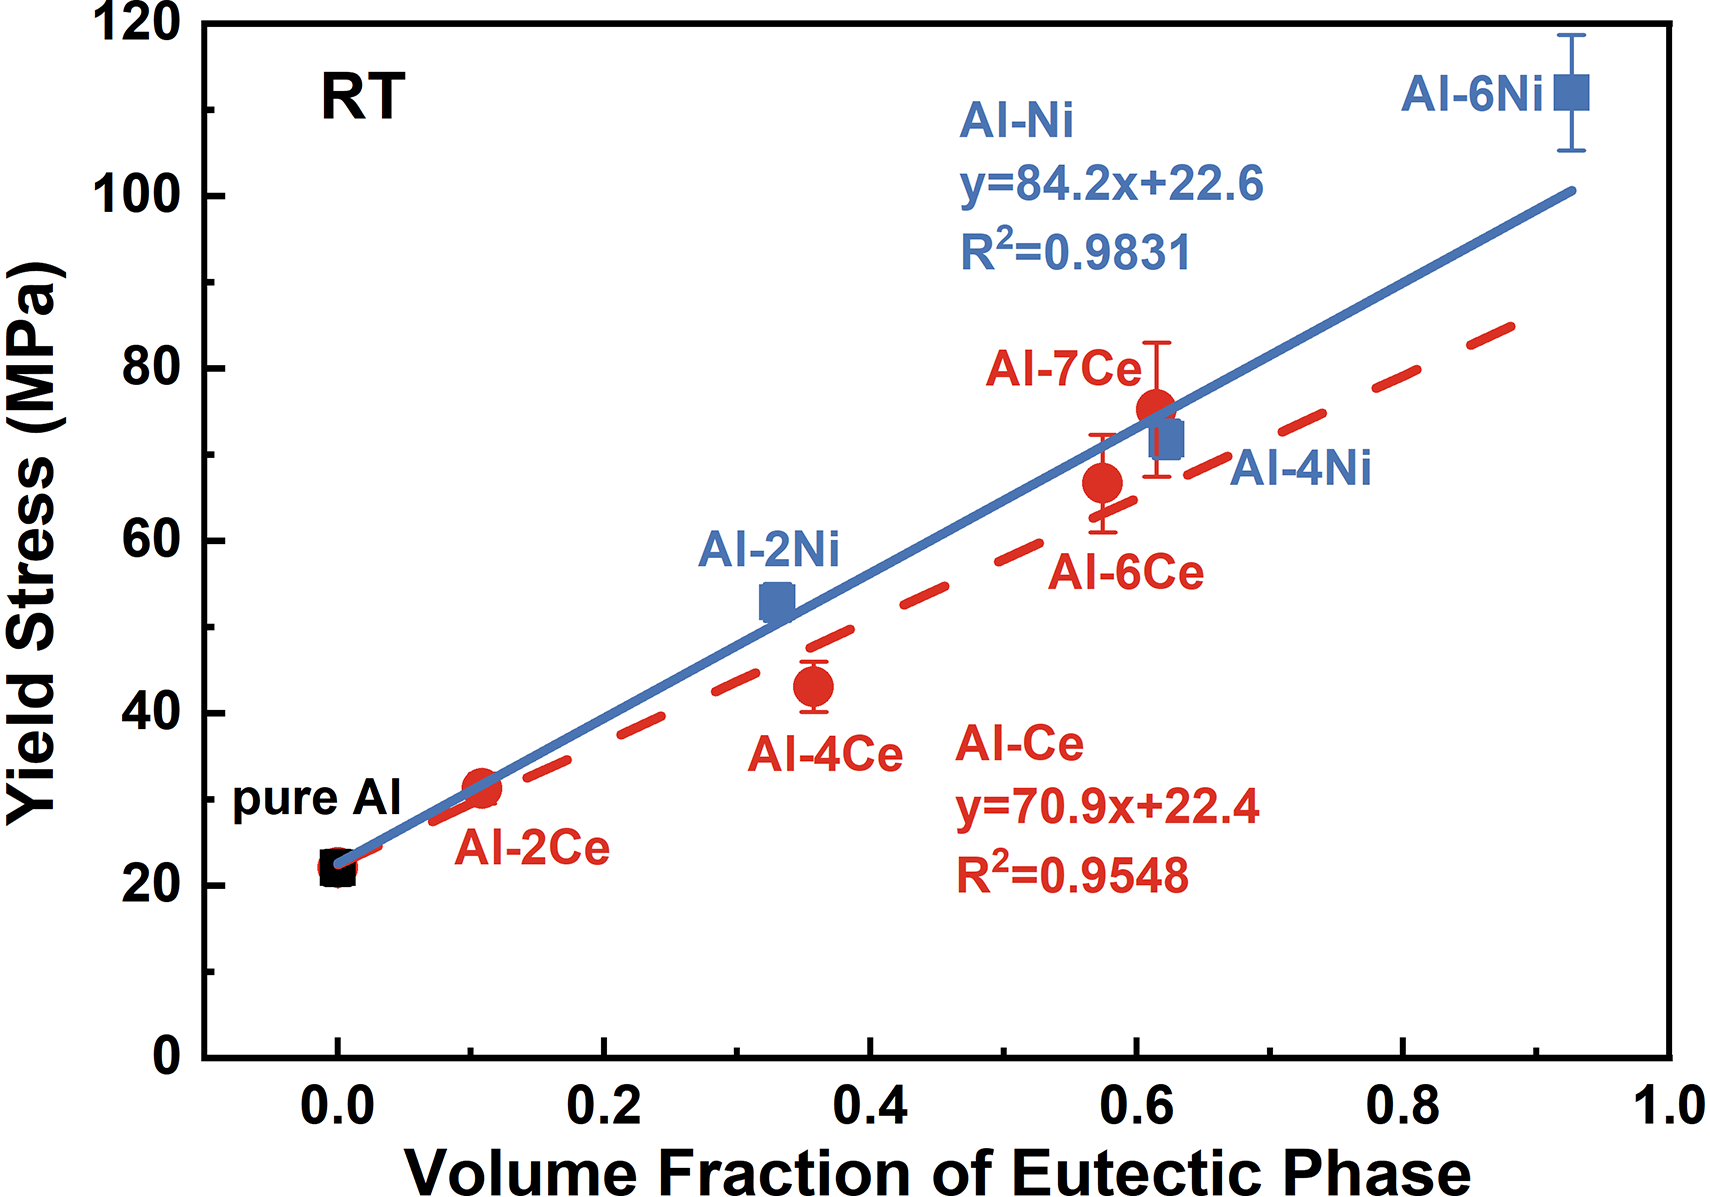
Yield stress values versus volume fraction of eutectic structure at room temperature.
Where
The load transfer strengthening mechanism is applied to calculate the strengthening effect of eutectic. For Al-Ce alloys and Al-Ni alloys, the strength contribution equations for eutectic are as follows.


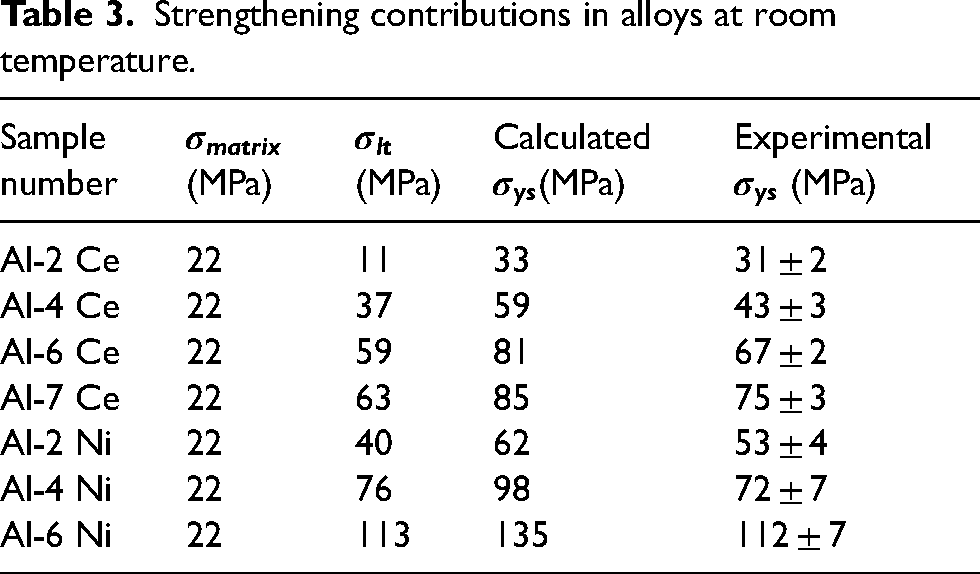
A summary of the calculated values of the strengthening contributions is presented in Table 3, which also lists the experimental values. Calculations show that in terms of the strengthening mechanism, the strength comes mainly from load transfer strengthening of the second phase. Because the rate of dislocation climb and glide is effectively reduced by load shedding to the stiffer Al11Ce3 platelets or Al3Ni fibers. 60 The calculated values are higher than the experimental values because the shear lag theory is based on all fibers or platelets being parallel to the loading axis. Actually, they are normally oriented at an angle to the loading direction and therefore have a lower load transfer efficiency than fully aligned fibers or platelets. 61 The errors introduced by particle size parameters taken in a two-dimensional plane should also be considered.
Strengthening contributions in alloys at room temperature.
Combining the results of the linear fits in Figure 9 and the above analysis, the different slopes of the fitted straight lines for the two alloys are due to the differences in the strengthening effects of the two eutectic phases. According to Eq. (3) and Eq. (4), the enhancement effect of the fibrous eutectic phase is better when the parameters are similar. The load-transfer strengthening contribution brought by the Al3Ni phase is higher than that of the Al11Ce3 phase. On the other hand, the coherence between eutectic phase and matrix improves the strength and effectively slows down the coarsening of eutectic phase. 9 In Al-Ce alloys, the coherent relationship exists only in the nucleation and initial stages of growth. 52 In contrast, the interface between the α-Al shell layer and the Al3Ni fiber is coherent. 62 Therefore, the strength of Al-Ce alloy is lower than that of Al-Ni alloy when the same volume fraction of the eutectic phase is contained in the matrix.
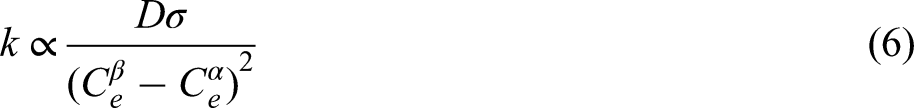
The eutectic coarsening kinetics
Figure 10 shows the results of fitting the YS values to the volume fraction of eutectic structure at 200°C. The slope of the fitted straight line of Al-Ce alloy decreases from 70.9 at room temperature to 45.1, while the slope of Al-Ni alloy decreases from 84.2 at room temperature to 49.8. The retention rates for both exceed 60, indicating that the two alloys are promising candidates for heat-resistant alloys. Among them, Al-Ce alloy has a higher retention rate, which means that the Al11Ce3 phase has a better resistance to coarsening.
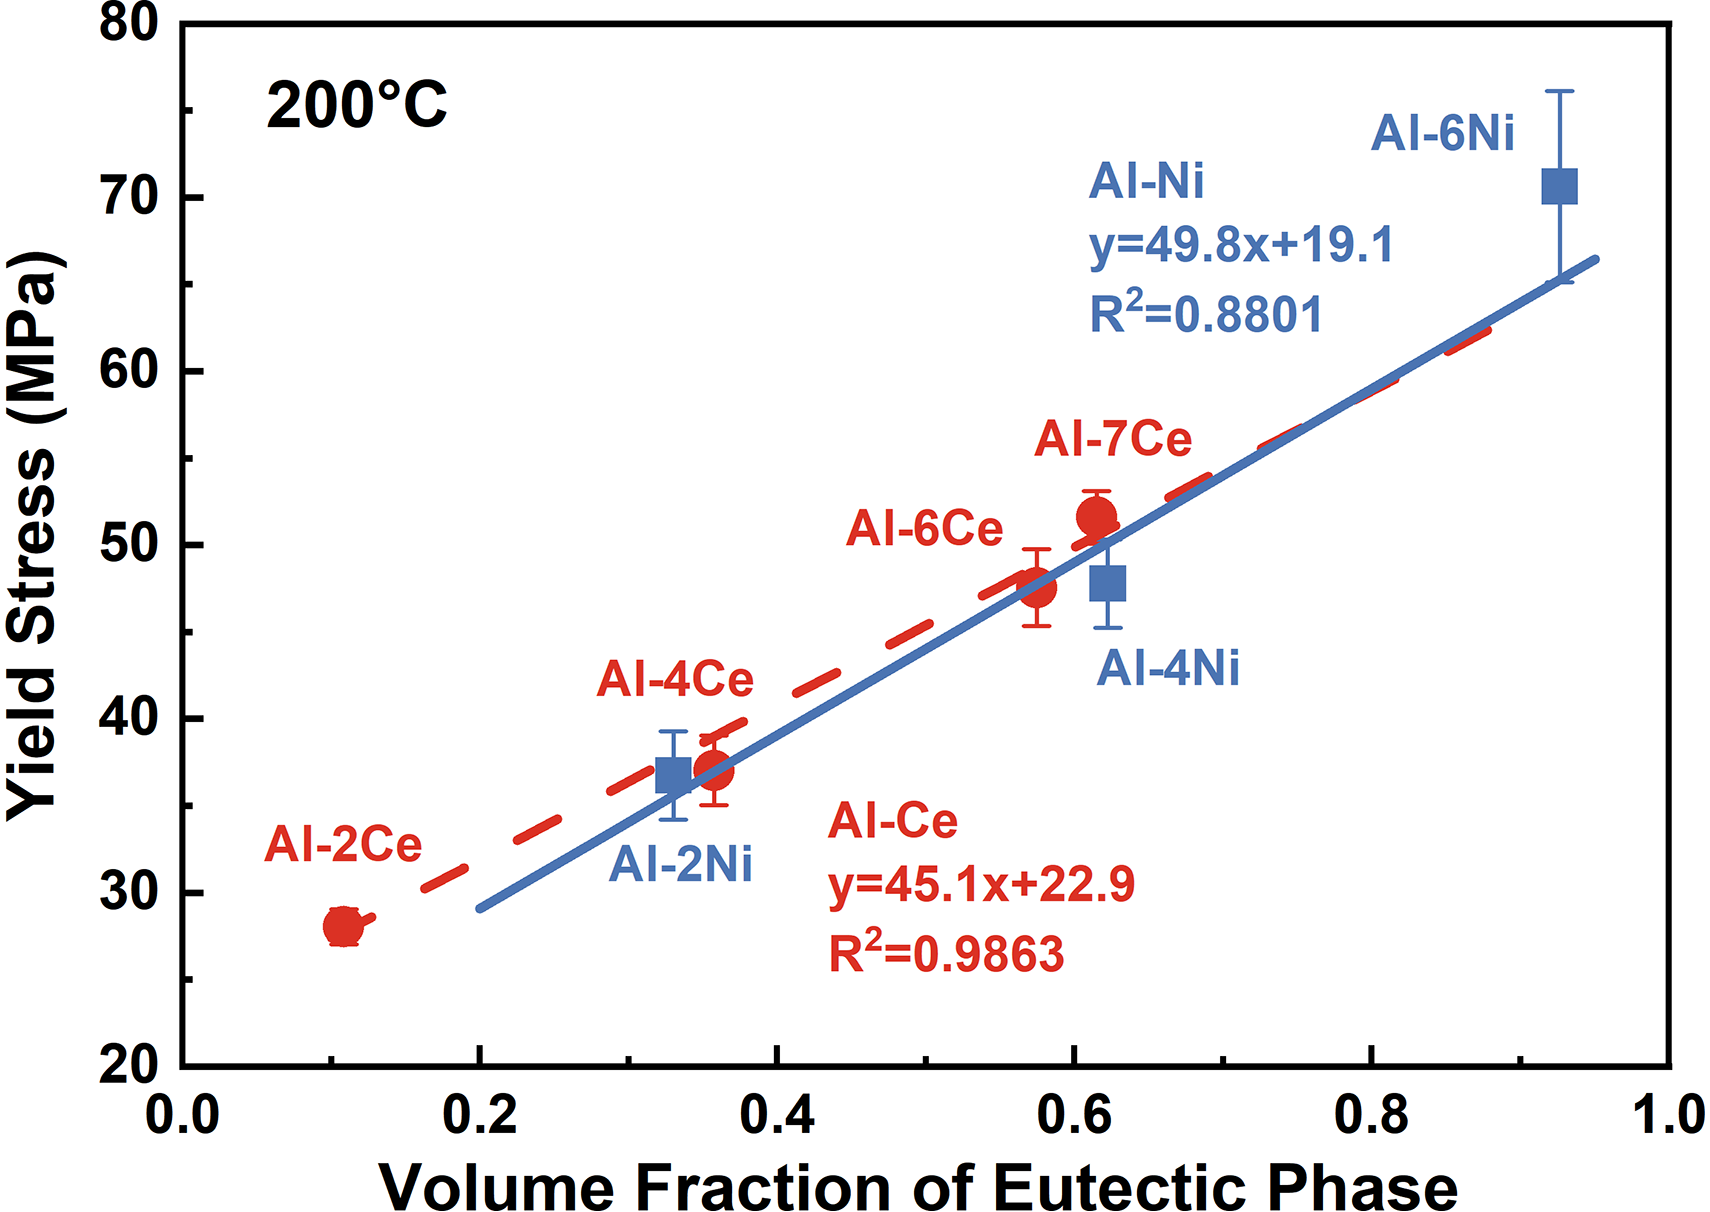
Yield stress values versus volume fraction of eutectic structure at 200°C.
For all heat-resistant alloys, the resistance of the second phase to Ostwald coarsening is critical during prolonged exposure at high service temperatures.
63
Ostwald coarsening refers to the dissolution of smaller particles while larger particles continue to grow, thus increasing the average particle size. The mechanism relies on volume diffusion, with atoms diffusing through the matrix from small to large particles. Based on the studies of Lifshitz, Slyozov and Wagner,
64
the coarsened model is as follows:
Electrical conductivity
As known, lattice defects can act as scattering centers for electrons, including dislocations, vacancies and grain boundaries. To further investigate the correlation between microstructure and conductivity, and identify the difference in electrical conductivity between Al-Al11Ce3 and Al-Al3Ni, it is necessary to evaluate the resistivity of the samples. Based on the Mattissenfv-Flemming rule,
66
the total electrical resistivity 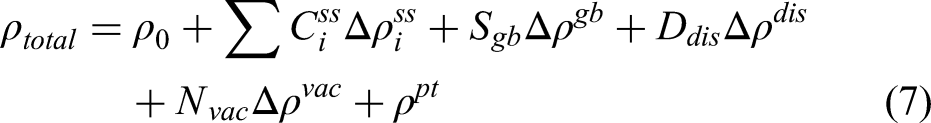
The contribution of cerium and nickel solute atoms to the electrical resistivity can be ignored at room temperature. It is worth noting that trace amounts of impurity elements, such as Fe and Si, are inevitably present in all samples, as shown in Table 1. According to the results presented by Mulazimoglu et al.
69
and Cooper et al.,
70
We now turn to quantitatively analyze the effect of eutectic phase on total conductivity. According to the Wiedemann-Franz (WF) law,
71
a relation exists between electrical and thermal conductivities in most metals as follows.
The thermal conductivity of the binary alloy can be estimated by Maxwell's model, combined with the thermal conductivity and volume fraction of the eutectic structure. Based on the Maxwell model, a continuous phase with a thermal conductivity of 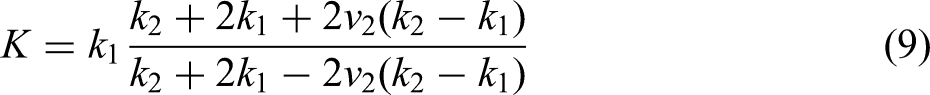
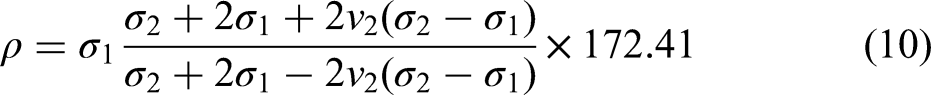
Using the experimental electrical conductivity of Al-xCe and Al-xNi alloys, the experimental and model fitting results are given in Figure 11, and the electrical conductivities of pure Al and eutectic structures are obtained after fitting. According to Al-Ce alloys, the electrical conductivities of ɑ-Al phase and Al-Al11Ce3 eutectic structure are 3.67×10⁷ S/m and 2.79×10⁷ S/m, respectively. According to Al-Ni alloys, the electrical conductivities of ɑ-Al phase and Al-Al3Ni eutectic structure are 3.64×10⁷ S/m and 3.25×10⁷ S/m, respectively. The conductivity of single-crystalline defect-free Al is equal to 3.7×10⁷ S/m, 73 the conductivity of eutectic Al-Ni alloy is equal to 3.26×10⁷ S/m, 74 the simulated values are almost consistent with the experiments.
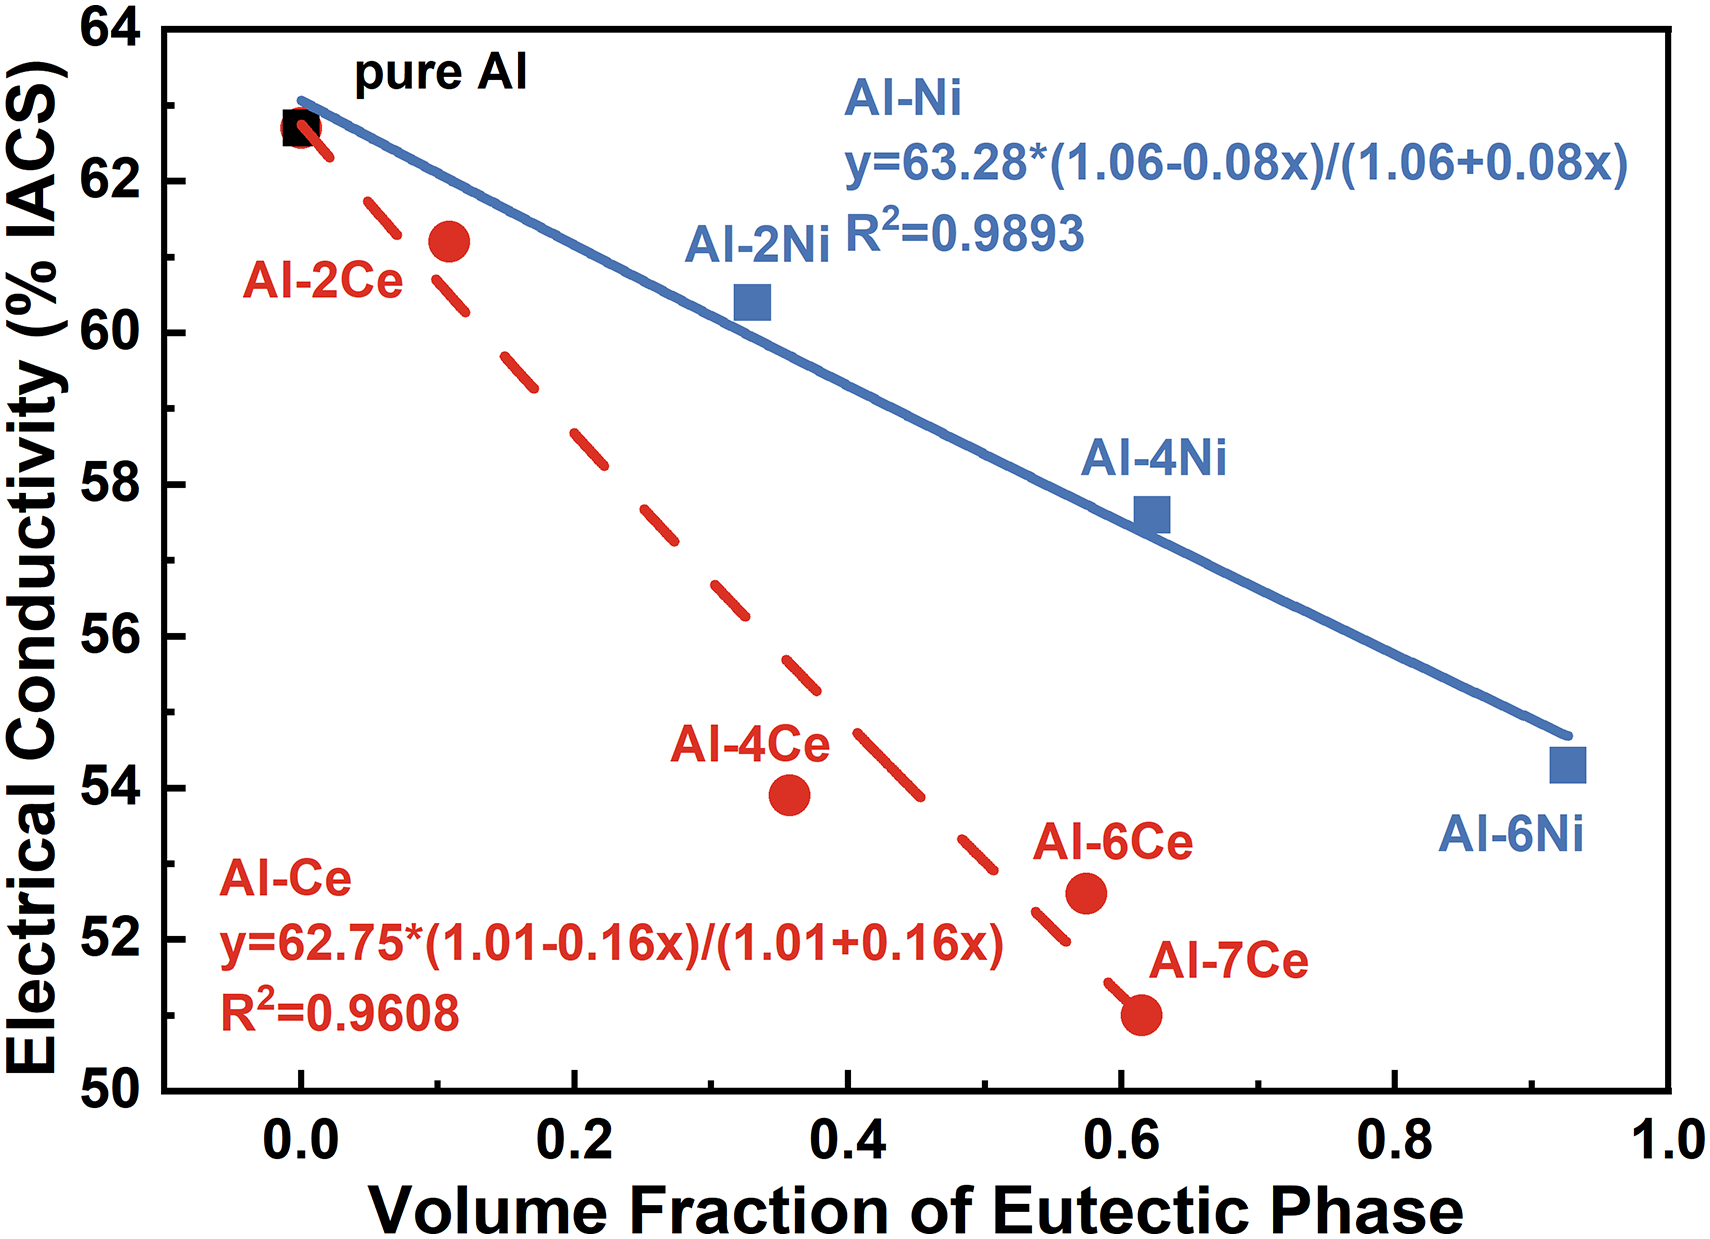
The experimental and model fitting results for the total electrical conductivity.
The obvious difference in conductivity between the two eutectic structures may be due to the effect of structural differences in the eutectic phase on the rate of electron collisions. The structural differences between the lamellar Al11Ce3 phase and the fibrous Al3Ni phase can be easily seen in Figure 3. Mulazimoglu et al. 75 demonstrated that the slat is more detrimental to the relative conductivity compared to the bar because of its effective blocking of electron flow. Since there is less projected area between the Al3Ni fiber and the aluminum matrix, electron flow passes through more easily. Therefore, when a two-phase alloy contains the same volume fraction of eutectic Al11Ce3 phase and Al3Ni phase, respectively, the latter has a higher electrical conductivity.
Strength-conductivity relationship
An increase in conductivity is accompanied by a reduction in strength, and the converse also holds true, which is widely known as the strength-conductivity trade-off correlation.76,77 The UTS and YS data from this study were fitted to the electrical conductivity, respectively, as shown in Figure 12. The two curves follow the same trend, indicating that a strong inverse strength-conductivity correlation can be observed in this study. S-type alloys have high strength and low conductivity, and C-type alloys have low strength and high conductivity. The strength and electrical conductivity can be tailored within a wide range in both Al-Ce and Al-Ni alloys. The mechanical and electrical properties of conductive materials are closely related to the evolution of their microstructure. 30 Thus, in combination with the previous analysis on the effect of microstructure, the most suitable strength-conductivity combination can be selected by controlling the content of the eutectic structure in different cases.
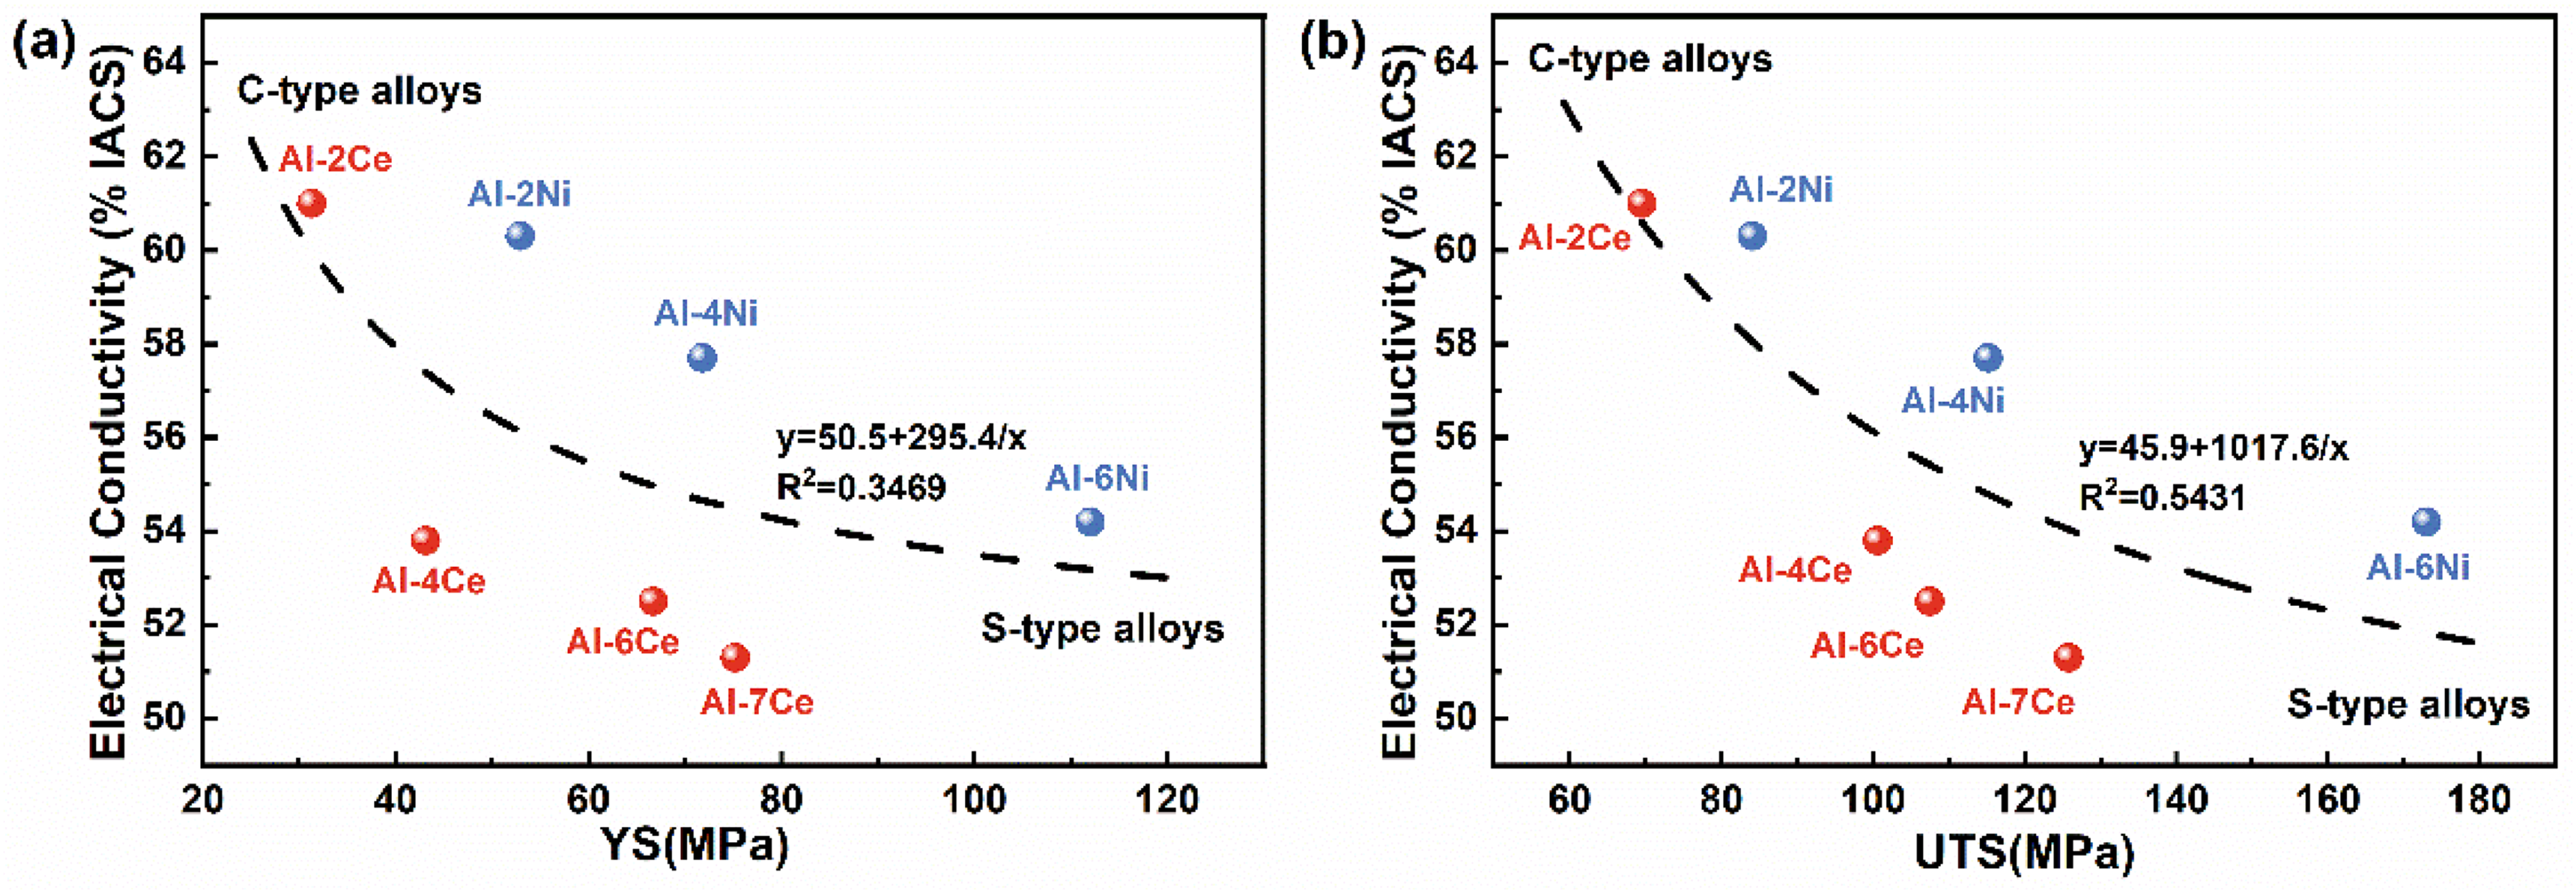
(a) YS-electrical conductivity correlation and (b) UTS-electrical conductivity correlation of al-ce and al-Ni alloys.
The inverse strength-conductivity relationship leads to unsatisfactory strength of present Al-Ce and Al-Ni alloys. We believe that Al-Ni alloys have better strength-conductivity combinations due to the morphology, size, and coherence with the matrix of the Al3Ni eutectic phase. Of these the best is the Al-6Ni alloy as it achieves a strength of 173±9 MPa and still has a conductivity of 54.2±0.2% IACS. Strengthening often leads to lattice distortions and conductivity degradation. In further work, nanoscale precipitation strengthening of elements with low solid solubility and low diffusion rates should be adopted for the alloys, which may lead to superior strength-conductivity combinations. Relevant experiments are now being conducted on our Al-Ce and Al-Ni alloys in particular the Al-6Ni alloy.
Conclusions
The present study aims to investigate the content of added elements on the impact of microstructure, electrical conductivity, heat resistance and mechanical properties of Al-Ce and Al-Ni alloys, and to compare the divergence in properties due to the intrinsic qualities of Al-Al11Ce3 and Al-Al3Ni eutectic. Specifically, the strengthening mechanisms and the conductivity change mechanism are investigated based on the eutectic structure volume fraction, which makes it possible to control the properties by modulating the content of the added elements according to different situations.
The following are the findings and conclusions:
The microstructures of alloys consist of primary α-Al and eutectic phases. The volume fraction of eutectic structure increases with increasing Ce/Ni content, and the morphology and size of Al11Ce3 lamellae and Al3Ni fibers do not change with the content. The binary alloys are strengthened by the Al11Ce3 or Al3Ni eutectic phases, reaching the yield stress of 31–112 MPa at room temperature, being higher than pure Al. The volume fraction of eutectic structure is linearly related to the strength of the alloy, and the main strengthening mechanism is load transfer strengthening. The morphology and size of the Al3Ni eutectic phase led to a preferable strengthening result. During high-temperature stretching, the yield strength of alloys decreases only slightly with increasing temperature. The heat-resistant property of Al-Ce alloy is better. Based on theoretical and experimental results, the relation between microstructure and conductivity is quantified, and the model can predict the conductivity of Al-Ce and Al-Ni alloys more accurately. The conductivity of Al-Ni alloys decreases at a slower rate with increasing content, which is attributed to the morphology of the Al-Al3Ni eutectic that facilitates the passage of free electrons.
Footnotes
Acknowledgments
The authors would like to acknowledge the financial supports from the Natural Science Foundation of China (No. 52271046), Natural Science Foundation of Hunan Province, China (No. 2022JJ20061), and the fund of State Key Laboratory of Powder Metallurgy, Central South University.
Author Contribution(s)
Data and code availability
Data supporting the results of this study are available from the corresponding author upon reasonable request.
Declaration of conflicting interests
The authors declared no potential conflicts of interest with respect to the research, authorship, and/or publication of this article.
Funding
The authors disclosed receipt of the following financial support for the research, authorship, and/or publication of this article: This work was supported by the Natural Science Foundation of Hunan Province, the Natural Science Foundation of China, (grant number No. 2022JJ20061, No. 52271046).
Ethical approval
Not applicable.