
Abstract
As a lightweight protective structure, auxetic honeycombs have a broad application in engineering. In this study, gradient characteristics was introduced into a novel enhanced auxetic honeycomb (NEH). Positive, negative, symmetric positive and symmetric negative gradient NEH (P-NEH, N-NEH, SP-NEH and SN-NEH) were constructed by varying the wall thicknesses, and the relative densities were deduced. The dynamic responses of NEH and reentrant honeycomb (RH) were compared by numerical methods, and it was found that NEH has superior mechanical properties. Subsequently, the in-plane impact dynamics of the NEH were disclosed, and the distortion modes, dynamic response curves, platform stresses, Poisson's ratio distributions, and energy-absorbing effects were examined for various gradient distributions and impact velocities. It was found that the gradient distribution and impact velocity significantly affected the impact resistance of gradient NEHs. The platform stress increased with increasing velocity, and there was a significant difference between the platform stresses of the gradient NEHs at the same impact velocity. Among these, the N-NEH exhibits the highest plateau stress, suggesting that it can effectively enhance the energy absorption capability. When impacted at low speed, the specific energy absorption (SEA) of then N-NEH was 148.2% and 108.1% higher than that of the P-NEH and SN-NEH, respectively. At medium-velocity impact, the SEA of the N-NEH was 124.6%, 28.9%, and 112.9% higher than that of the others, respectively. At high-speed impact, the gradient honeycomb is more susceptible to speed influence, and the N-NEH shows extremely outstanding impact resistance.
Introduction
Honeycomb structures are frequently employed in airplanes, automobiles, and ships due to their high specific strength, stiffness, and energy absorption capabilities.1–5 Auxetic honeycombs differ from conventional honeycombs as they possess a distinctive mechanical property, which results in the auxetic honeycomb demonstrating high specific stiffness and strength, 6 significant indentation resistance, 7 superior energy absorption, 8 and excellent impact resistance. 9 These outstanding mechanical attributes of the auxetic honeycombs are crucial for their practical application.
The mechanical behaviour and impact resistance of auxetic honeycombs have been researched in various ways, including simulation,10–12 experiment,13–15 and theory.16–18 Mustahsan et al. 19 established an analytical methodology for forecasting the mechanical properties of improved reentrant honeycombs. Qi et al. 20 examined the in-plane impact behaviour of a tetra-chiral honeycomb under different impact conditions by combining numerical and theoretical methods. Shen et al. 21 proposed a variable-arc honeycomb structure with a negative Poisson's ratio (NPR) effect and studied and investigated its in-plane impact resistance using numerical analysis. Xu et al. 22 examined the optimization of NPR sinusoidal honeycomb structures. It was shown that the optimized honeycomb had excellent absorbing energy performance. Cong et al. 23 examined the dynamic response of eccentrically stiffened circular cylindrical shells with NPR under blast loading. Jiang et al. 24 constructed an auxetic construction with improved specific stiffness and analyzed its impact resistance. Madke et al. 25 studied the validity of sandwich structure consisting of 3D reentrant dot matrix core and semi-auxetic braided composite face sheets when subjected to high-velocity impact. It was shown that the structure demonstrated decreased weight, enhanced absorbed energy, and greater stiffness in the both in-plane and out-of-plane. Airoldi et al. 26 introduced a novel idea of absorbed energy under localized collisions, performed research, and used the obtained information to enhance the geometrical mechanism of the honeycomb. The results showed that the application of foam filler had a substantial positive impact on the specific absorption energy and load uniformity.
In addition to studying the mechanical properties of auxetic honeycomb structure, its optimal design has been extensively studied by many scholars to enhance the impact resistance of honeycomb structures. Hybrid design is an efficient approach for creating innovative honeycomb structures. 27 Fu et al. 28 proposed a novel honeycomb with a rhombic structure embedded in a re-entrant shape, which was shown to have significantly improved mechanical properties compared to RH. He et al. 29 developed a novel enhanced auxetic honeycomb structure (NEH) that combines re-entrant and star shapes, embedded with a rhombic structure, and it was found that the NEH has excellent bending resistance. Additionally, gradient design is also one of the methods for the optimal design of honeycomb topology. Functional gradient honeycombs (FGH) are honeycombs that exhibit a gradient distribution of structural features including cell angle, wall thickness, relative density, and cell size, along a given direction.30–34 FGHs possess outstanding characteristics, including exceptional crashworthiness and high energy absorption. 35
Therefore, the gradient design of auxetic honeycombs properties has attracted great interest.36–38 First, Lim et al. 39 proposed the concept of gradient and combined the gradient design method with auxetic honeycomb to change the distortion pattern and further improve the mechanical property of auxetic honeycomb. Studies have demonstrated that the variation in the cell walls thickness significantly impacts their mechanical characteristics compared to conventional honeycombs.40–43 Ali et al. 44 analyzed the distortion process of gradient honeycombs under compressive loading conditions. Finite element analysis revealed that the thinnest honeycomb cell collapsed first, followed by thicker wall elements. Subsequently, the strain increased until the thickest wall collapsed. Hu et al. 45 analyzed the effect of gradient distribution on the impact resistance of honeycomb by performing gradient design of star-shaped honeycomb (SSH) with angle, thickness, and double gradient. It was shown that the impact resistance of SSH was significantly impacted by the thickness gradient. In conclusion, gradient distribution played an important role in improving the mechanical properties of honeycomb structures. Controlling the gradient distribution of wall thickness was a simple and effective way to optimize the design of auxetic honeycomb. However, the existing studies only explored the impact resistance of NEH under three-point bending and lacked the study of the mechanical properties of NEH under planar compression.
Therefore, the purpose of this paper is to explore the impact of gradient distribution on the mechanical characteristics of NEH. Initially, four gradient NEHs, including positive gradient (P-NEH), negative gradient(N-NEH), symmetric positive gradient (SP-NEH), and symmetric negative gradient (SN-NEH), are created based on the innovative enhanced auxetic structural unit by altering the wall thickness. Subsequently, the mechanical properties of NEH and RH are compared under various impact velocities through finite element numerical simulations. Finally, the discussion delves into the effects of gradient distribution on the deformation pattern, dynamic response curve, plateau stress, Poisson's ratio distribution, and energy absorption curve of NEH with various impact speeds. It is hoped that this study is sufficient to provide new design ideas for the application of protective structures.
Geometric configuration and FE simulation
Gradient honeycomb geometric configuration design
A novel enhanced auxetic honeycomb (NEH) is constructed by combining re-entrant and star-shaped cell elements with enhanced in-plane elasticity and energy absorption properties and introducing reinforcement through a hybrid design approach, and the geometry is shown in Figure 1. The structure has a fixed length of L = 100 mm and a fixed width of B = 25 mm, but the thickness of H is determined by the size of the individual cell. Furthermore, the NEH consists of 9 cells in the y-direction and 6 cells in the z-direction. The key geometrical parameters of the NEH cell include the horizontal cell wall length h, inclined cell wall length l, cell wall angle θ, and cell wall thickness t, as illustrated in Figure 1. In this research, the specific geometric parameters are h = 8 mm, l = 4 mm, θ = 60°, and t = 0.4 mm. Its relative density has been established.
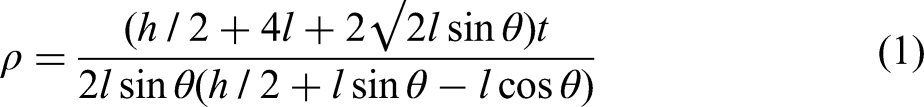
Configurations of novel enhanced cells.
Since the wall thickness significantly impacts the impact resistance of NEH,
29
this paper examines the influence of various thickness gradient distributions on the in-plane crushing response of NEH. Four NEH models with different thickness gradient distributions but the same mass is created, as illustrated in Figure 2. These include P-NEH, N-NEH, SP-NEH, and SN-NEH distributions. A gradient layer is formed by two cell layouts with the equal wall thickness, with wall thickness gradient distributions of 0.4 mm, 0.6 mm, and 0.8 mm from top to bottom, denoted as gradient layers 1, 2, and 3 (green, purple, and blue). Based on Eq. (1) and the variable cell element sizing method, the formula for the relative density of the thickness gradient honeycomb is obtained.
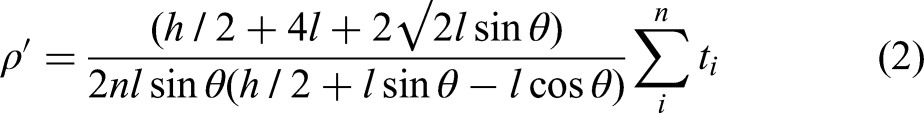
Four types of thickness gradient NEHs.
Finite element (FE) model
In this research, LS-DYNA was employed to examine the dynamic crushing behaviour and energy absorption characteristics of NEH with varying thickness gradients at various impact velocities. As depicted in Figure 3, the honeycomb was positioned between two rigid upper and lower panels, with the bottom panel fixed and the top panel moving perpendicularly in the Z-direction at a steady compression speed, with its sides unrestricted. The compression speeds were 1 m/s (low speed), 30 m/s (medium speed), and 100 m/s (high speed). Belytschko—Tsay shell cells with 5 integration points along the thickness direction were utilized. Considering the computational accuracy and time cost, the grid cell sizes of 1 mm and 2 mm were chosen for the honeycomb and panel, respectively. Assuming that the material deformation was ideal elastic-plastic deformation, the *MAT_PIECEWISE_LINEAR_ PLASTICITY was used to simulate the aluminum-based material, whose mass density
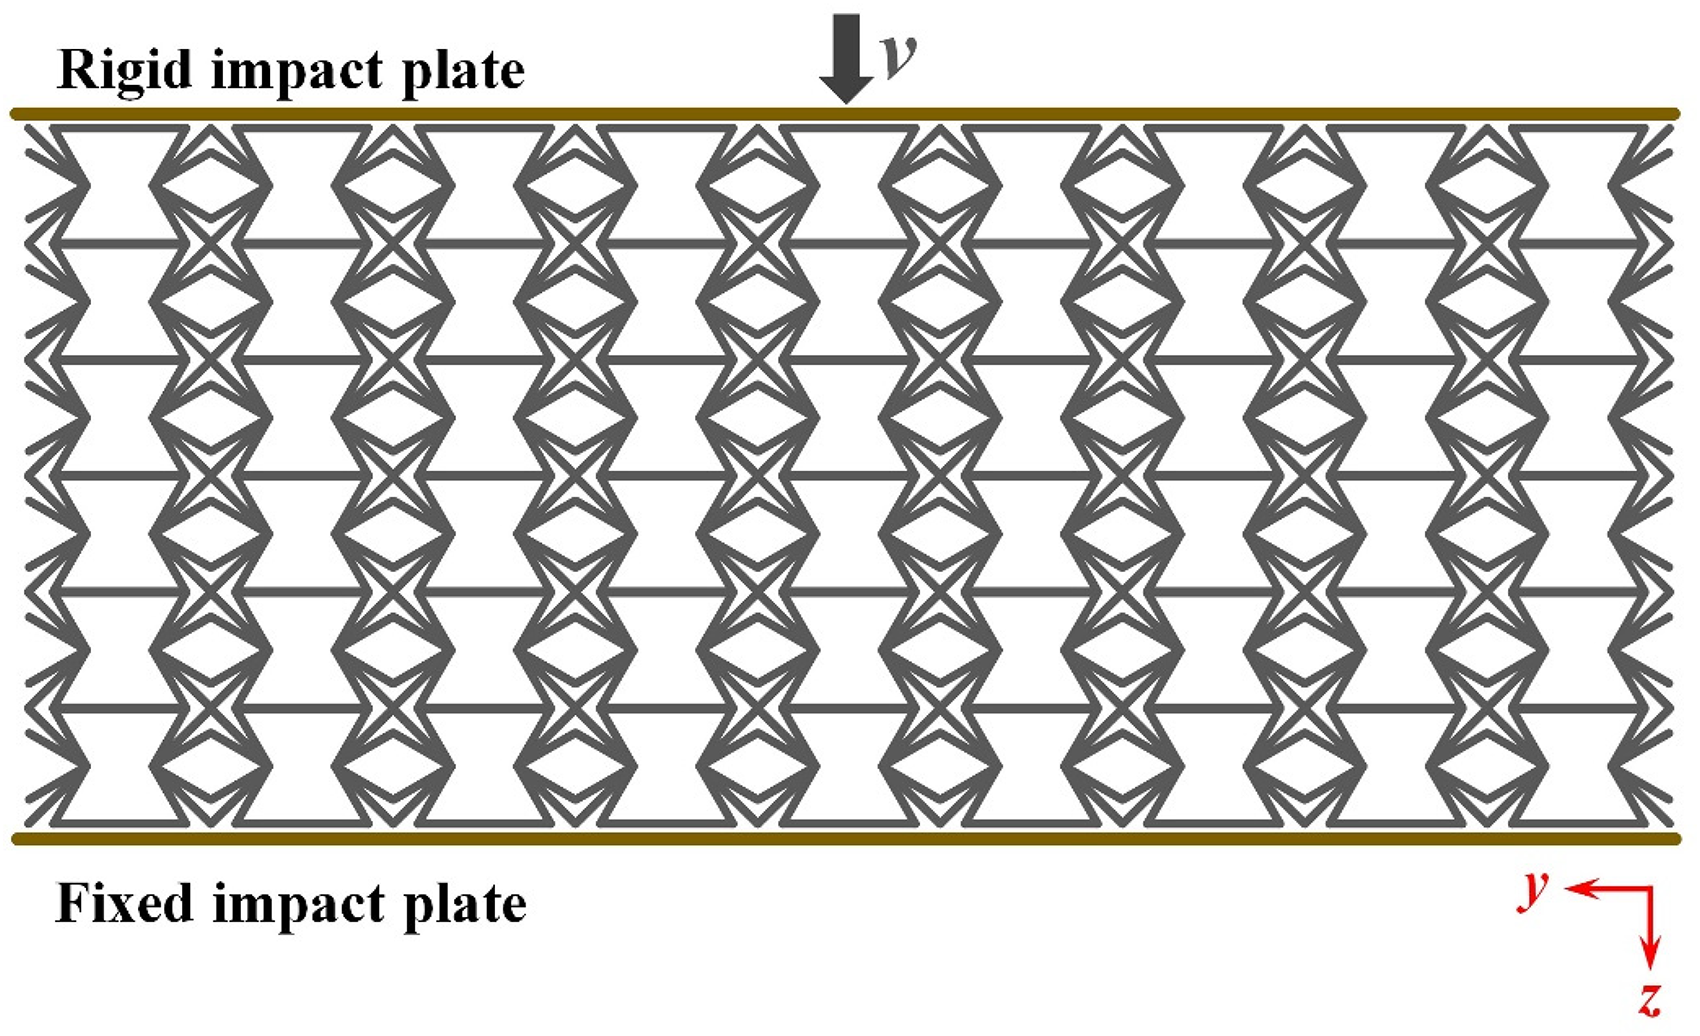
Fe models under impact loading.
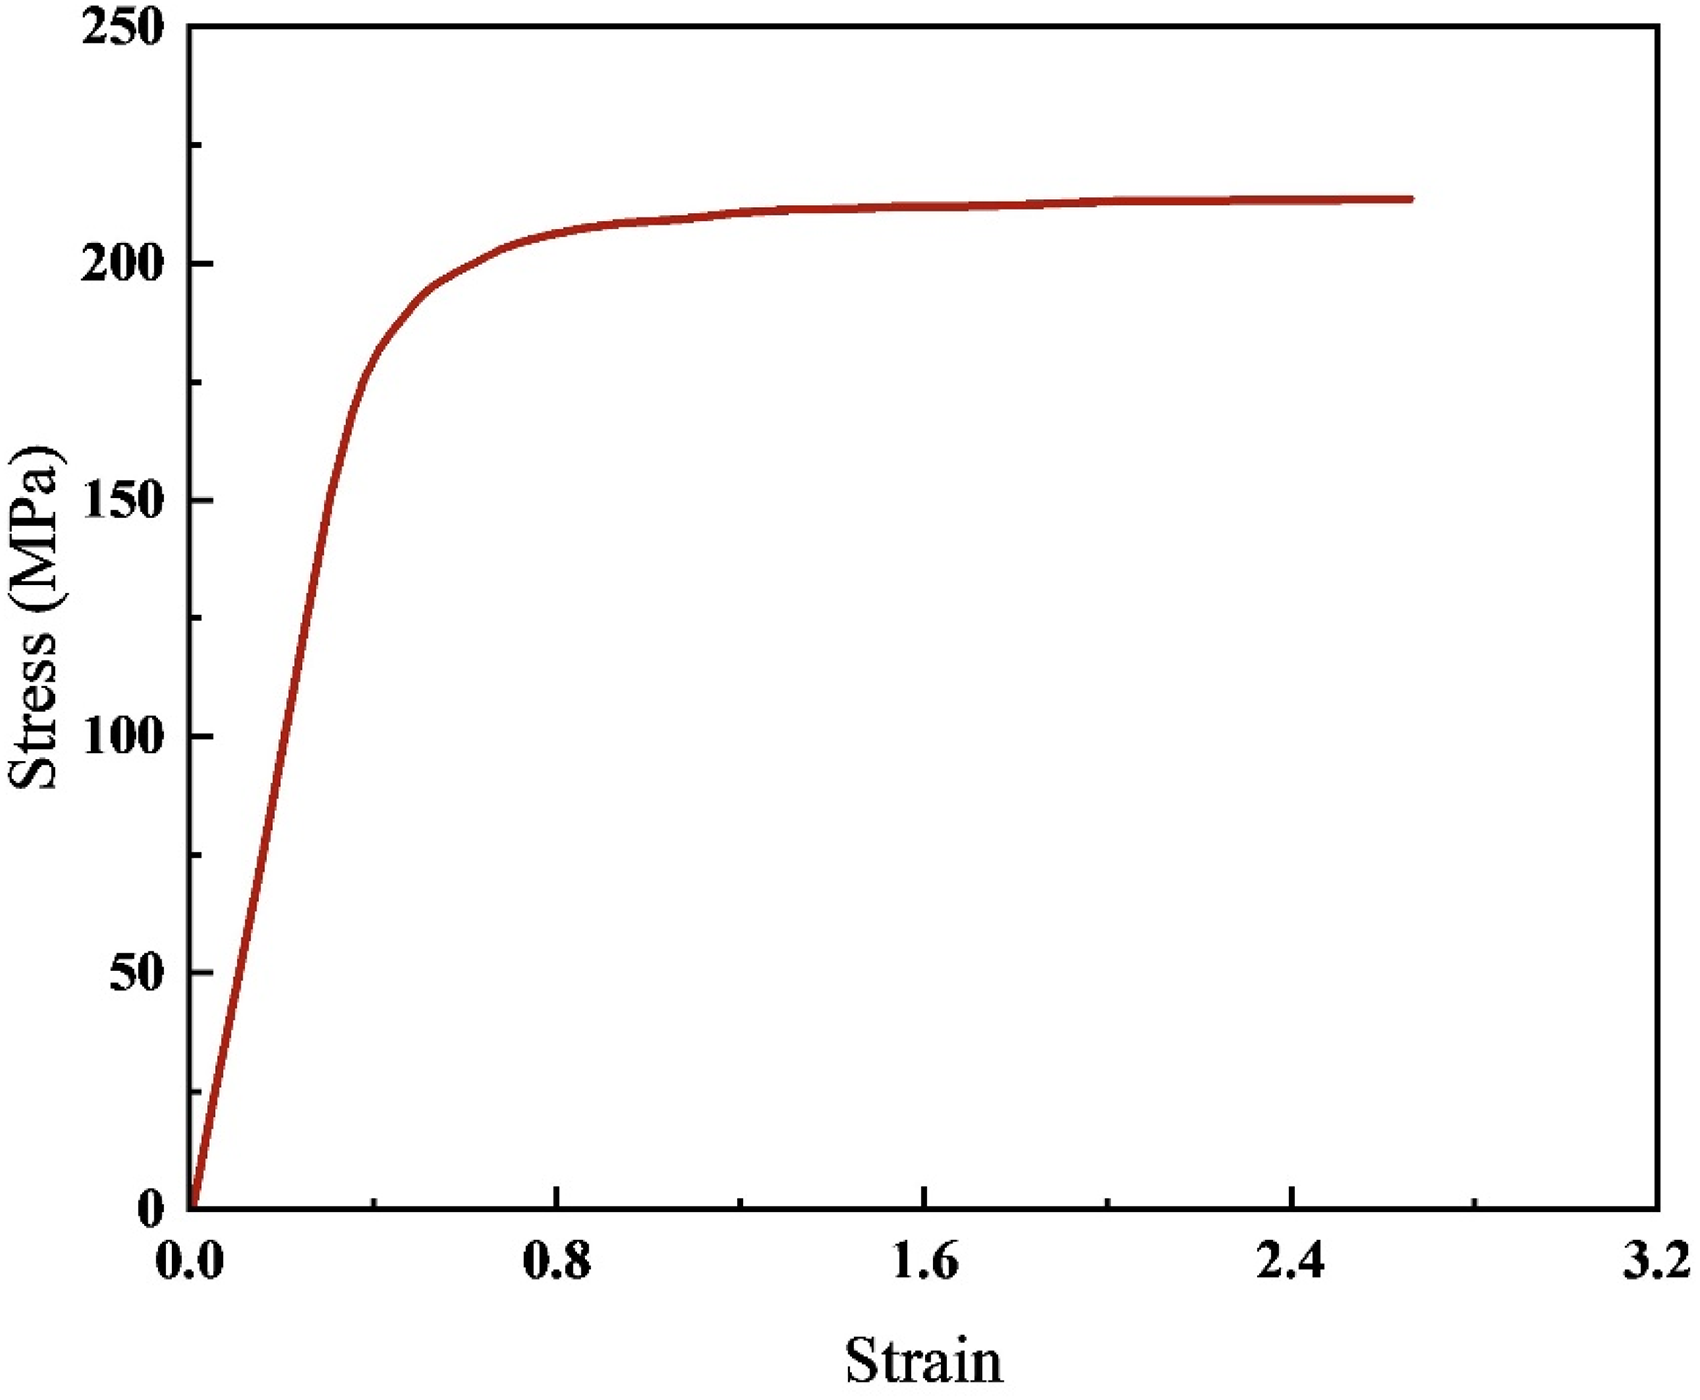
Stress-strain curves of AA1060 aluminum.
Crashworthiness assessment indicators
To assess the impact of structural parameters on the in-plane compressive behaviour of the NEH, the crashworthiness of the NEH is analyzed based on specific energy absorption (SEA) and plateau stress (σp). SEA denotes the energy absorbed unit mass of the honeycomb.
The platform stress σp indicates the average nominal stress of the platform phase, becoming an important index in assessing the honeycomb crashworthiness. The higher the platform stress and the longer the platform stage, the better the crashworthiness of the honeycomb. Therefore, σp can be defined as:
Then, using the platform stresses derived from the direct homogenization method and based on the one-dimensional shock wave theory, the empirical equations of platform stresses containing the fitting coefficients a and b and having generality are derived, i.e.,
Validation of FE models
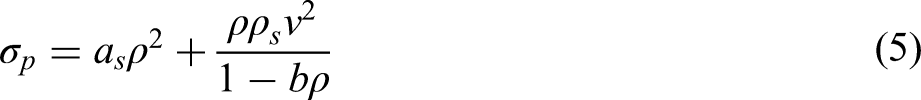
To verify the feasibility of the FE model, the simulation model is constructed according to the experimental conditions, structural parameters, and matrix materials in the literature 46 and compared with the experimental results. A crushing velocity of V = 1 m/s is used and assumed to be quasi-static. Figure 5 illustrates the experimental and numerical deformation patterns of graded re-entrant circular auxetic honeycombs (RECH) with different gradients during quasi-static extrusion. The finite element model's deformation aligns closely with the experimental results. At smaller strains, the initial deformation zones of the two distinct RECHs vary. PG-RECH-3 deforms sequentially from the upper to the lower layer in Figure 5(a), whereas the lower layer of NG-RECH-3 is deformed initially in Figure 5(b). Figure 6(a) illustrates the stress-strain curves of RECHs. It is evident that the experimental findings align well with the numerical results. The SEA-strain curves of RECHs are illustrated in Figure 6(b). As indicated by the crushing stresses in Figure 6(a), the experimental results for PG-RECH-3 and NG-RECH-3 show similarity, with the computational curves aligning with the experimental findings. Specifically, the SEA values for NG-RECH-3 are 0.106 J/g experimentally, 0.102 J/g numerically, and 0.106 J/g numerically at a strain of 0.6. The consistency between the experimental and computational findings indicates the reliability of the finite element method presented in this study.

Comparison between the FE results of compression deformation and the experimental results:(a) PG-RECH-3, (b) NG-RECH-3.
Comparison between the FE results and the experimental results:(a) stress-strain curves, (b) SEA-strain curves.
Comparative analysis of planar dynamic response
The novel enhanced auxetic honeycomb can exhibit various deformation modes with increased impact velocity. Hence, to investigate the exceptional mechanical characteristics of NEH under planar compression, the dynamic responses of NEH and RH with equal mass will be compared at impact speeds of 1 m/s, 30 m/s, and 100 m/s.
Deformation mode
As depicted in Figure 7, the distortion processes and modes of NEH and RH under various compression velocities (1 m/s, 30 m/s, and 100 m/s) are illustrated, where 1 m/s, 30 m/s, and 100 m/s correspond to low, medium, and high velocities, respectively. The graphic illustrates that the beginning distortion areas of various honeycomb structures vary at the same velocity. Additionally, the initial deformation regions of the identical honeycomb are distinct with varying speeds.

Comparison of deformation behaviors. (a) RH, (b) NEH.
For the RH structure, when V = 1 m/s is impacted, the distortion of RH first occurs in the cell elements near the striking side and the stationary side resulting from the rotation and bending of the cell wall in the initial deformation stage, forming an incomplete “X"-shaped (Figure 7(a)). As the deformation intensifies, the “necking phenomenon” becomes visible in the distortion zone at the striking side, and the overall distortion pattern of the model displays an “I” deformation. When V = 30 m/s and ε = 0.1, the cells close to the striking side deform first, and due to the NPR effect, lateral contraction occurs, resulting in a “V” deformation band. At ε = 0.2, the number of deformations in the RH cells increases, and the extent of the “V"-shaped deformation band widens. Simultaneously, the cell near the stationary end also deforms, but the level of deformation at the impact end surpasses that at the stationary end. With the rise in strain, an incomplete “X” dense band is formed by the cells near the impact and fixed ends. At V = 100 m/s, during the early phase of impact deformation, RH deforms initially at the impact end due to inertia, while the cells near the fixed end stay mostly unaffected. With the increase in offset, on account of the NPR effect, the deformation pattern of RH exhibits “I + V” deformation, and the layer-by-layer transmission causes the deformation range to expand, as illustrated in Figure 7(a).
For the NEH, when impacted at low speed, an incomplete “X"-shaped deformation zone like that of the RH appeared in the small distortion phase (Figure 7(b)). However, when the strain ε = 0.2, plastic buckling mainly occurs in the reentrant cells due to reinforcement presence. This leads to slight instability in the NEH structure due to lateral contraction induced by the NPR effect (Figure 7(b)). As the compressive displacement increases, the structure starts to lean towards a particular side, showing signs of structural instability, ultimately resulting in the gradual densification of the NEH cells. When V = 30 m/s medium velocity impacts, the tilted walls of the reentrant cells are rotated and deformed, causing NEH to exhibit an “X” deformation pattern. With the increase of ε, this deformation pattern led to the aggregation of cells toward the honeycomb core, showing the typical NPR effect. Subsequently, localized densification occurred as parts of the cell walls came into contact. When V = 100 m/s impacts at high speed, in the initial phase, the distortion of the NEH also occurs first at the striking side, while the cells close to the stationary side remain mostly unchanged. With increasing compression offset, more cell walls deform, and parts of the cell walls near the striking side start to become dense. At the same time, an “X"-shaped deformation region forms in the NEH and spreads to the fixed side, resulting in an overall “I + X” deformation pattern (Figure 7(b)).
In summary, NEH and RH show distinct deformation patterns under identical compression rates. Additionally, the deformation patterns of NEH and RH vary significantly at different loading speeds. The RH exhibits an “I” deformation pattern and an incomplete “X” deformation pattern at low- and medium-speed impacts, as well as an “I + V” deformation pattern at high-speed impacts. In addition, the NEH also exhibits an “X” deformation pattern at low and medium speeds but an “I + X” deformation pattern at high speeds. Therefore, NEH has a more stable and uniform deformation.
Stress-strain curves
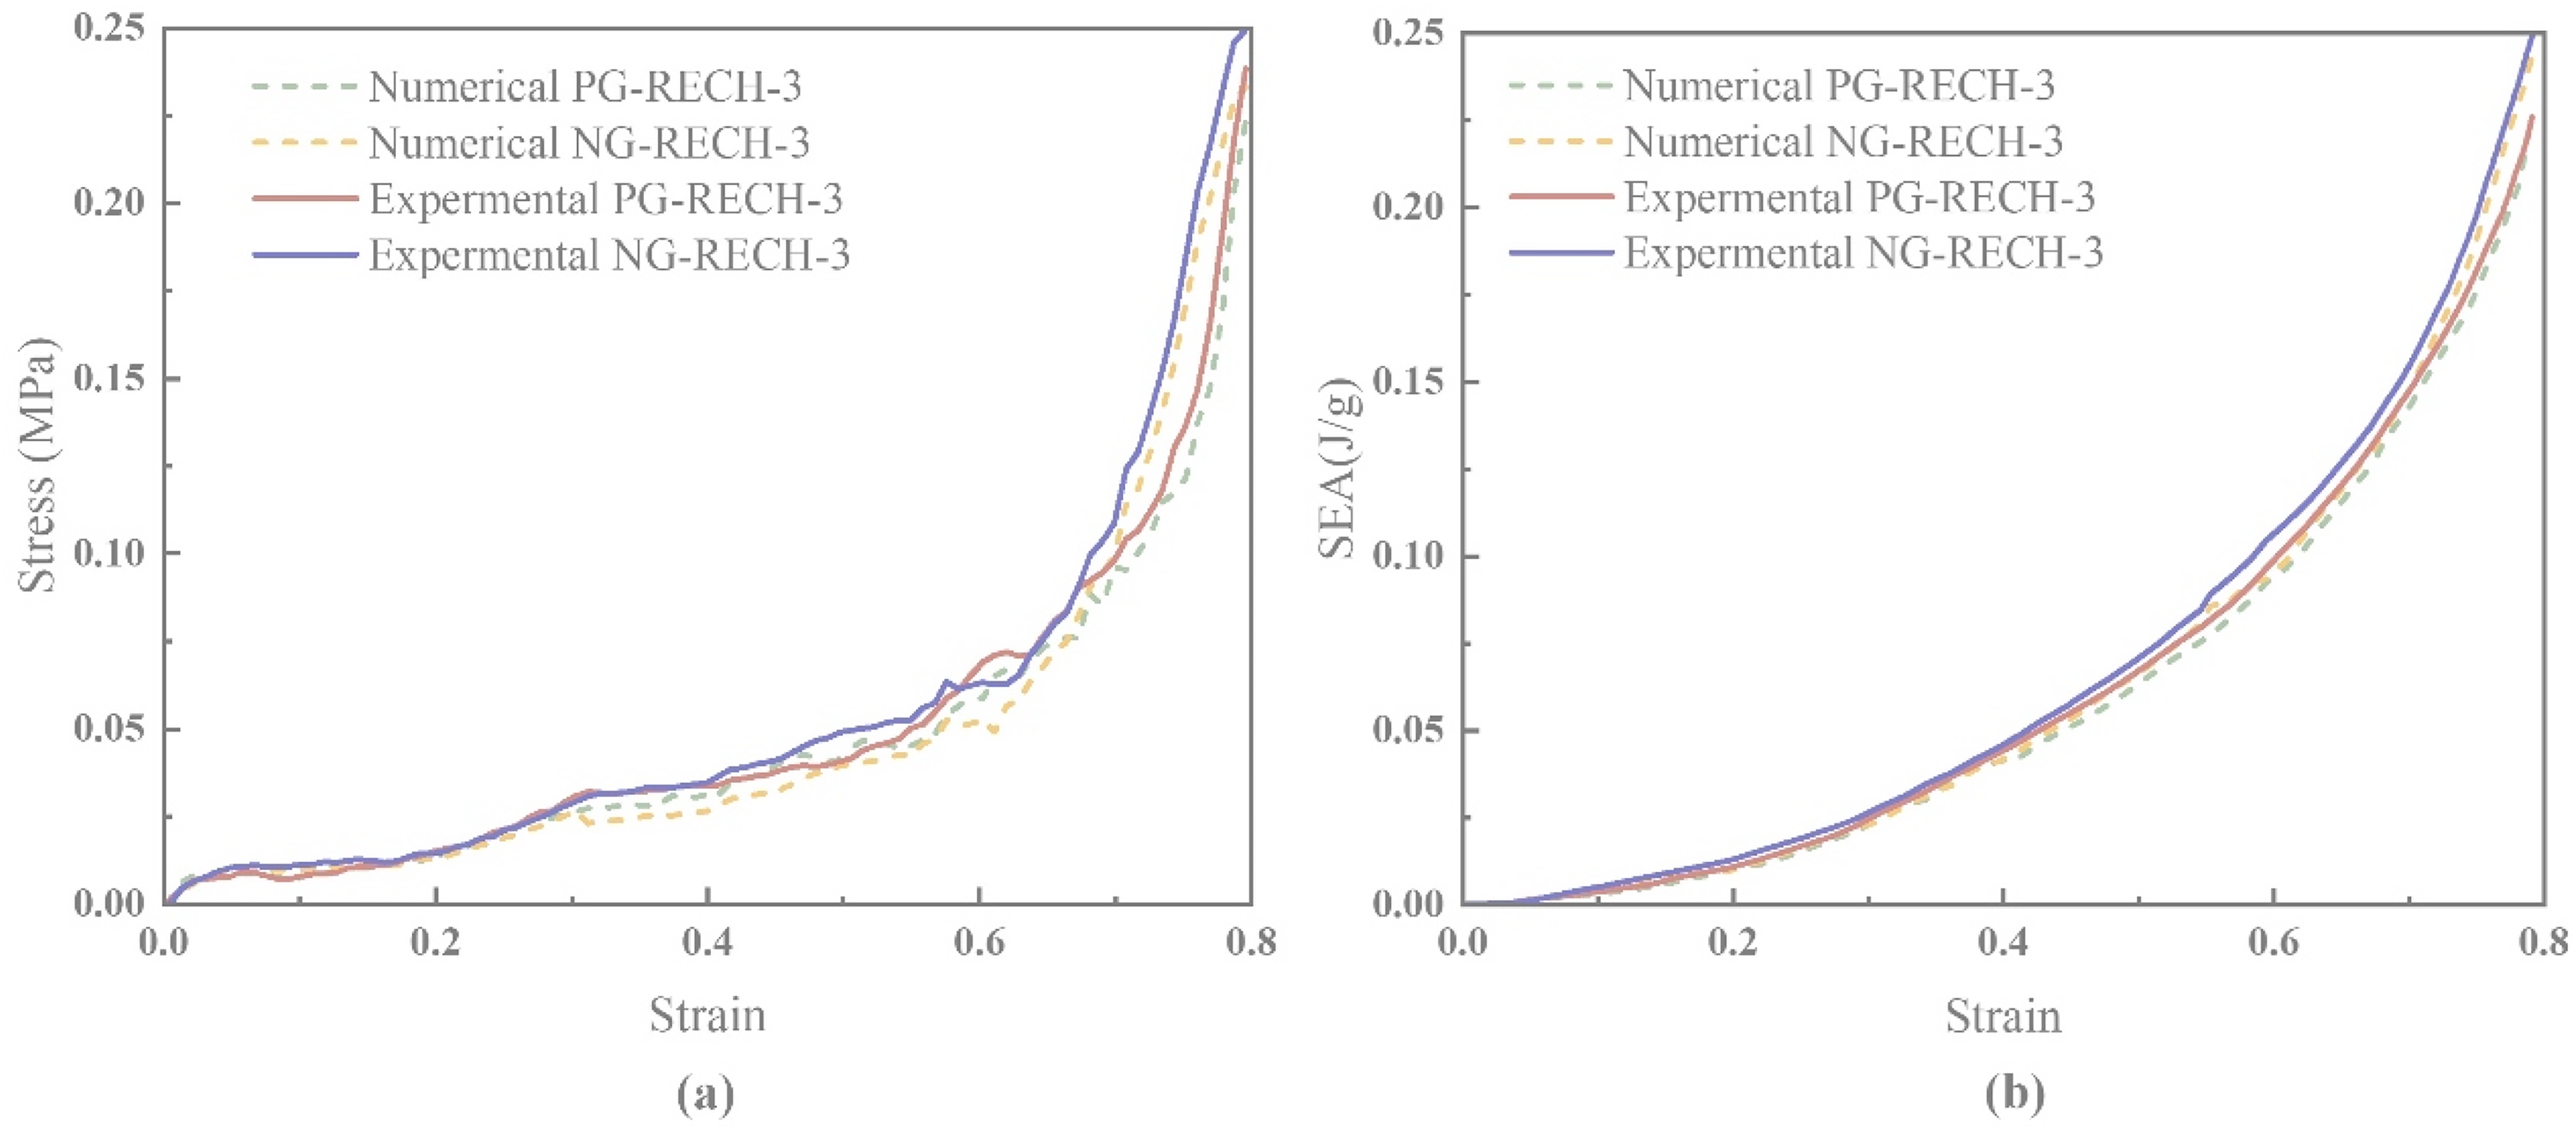
Figure 8 exhibits the stress-strain curves of RH and NEH for various impact speeds. The stress is the measure of the force F applied to the impacting end of honeycomb materials, divided by the initial cross-sectional area, expressed as
Dynamic crushing stress–strain curves of the (a) RH and (b) NEH.
Figure 8(a) presents the dynamic crushing stress-strain curves of RH at various impact velocities. It illustrates that, despite some fluctuations in the stress-strain curves, significant crushing stresses can become apparent at greater compression strains and velocities. When the compressive strain is small (ε < 0.2), the higher the impact velocity, the higher the stress obtained, and the more pronounced the stress fluctuation in the plateau phase. When exposed to low and medium impact velocities, the RH is in the elastic deformation stage during the initial deformation phase, followed by bending of the cell walls and deformation into the stress plateau stage, with smooth stress changes and uniform deformation. When subjected to high-velocity impact, it shows high crush stress at the start of the impact. As the compressive strain increases, the honeycomb transitions into the stress plateau stage, displaying increased crushing stress but reduced stability. Because of inertia, the compressive strain of RH continues to increase, causing the cells to undergo flexural deformation until compression collapses. Subsequently, the overall honeycomb enters the dense stage with a rise in crushing stress. Figure 8(b) illustrates the stress-strain curves of NEH at various impact speeds. When the compressive strain is small, the trend of stress-strain curves is similar to that of RH under different impact velocities. However, with the increase in compressive strain, the deformation of NEH enters the stress plateau stage, which is significantly different from that of RH. Especially at high impact speeds, the plateau stress of NEH is higher and more stable than that of RH. It can also be noted that the honeycomb material experiences a stage of platform stress elevation before being crushed, attributed to the NPR effect of NEH, known as the necking phenomenon. When ε > 0.6, the NEH transitions into the compacting stage, leading to the gradual crushing and compacting of the cells, resulting in the stress peaking once again. In addition, the higher the compression rate, the faster the crushing stress increases, and at high impact speeds, it increases linearly.
In conclusion, both the honeycomb structure and the striking speed significantly influence the crush stress. RH exhibits higher crush stress in the initial impact stage compared to NEH, while NEH shows relatively higher plateau stress with less fluctuation. On the other hand, in terms of protection and energy-absorbing material design, a high initial peak crush stress could present a risk to the safeguarded individual, building, or machinery. Hence, NEH is more suitable for protective structures.
Energy absorptive capacity
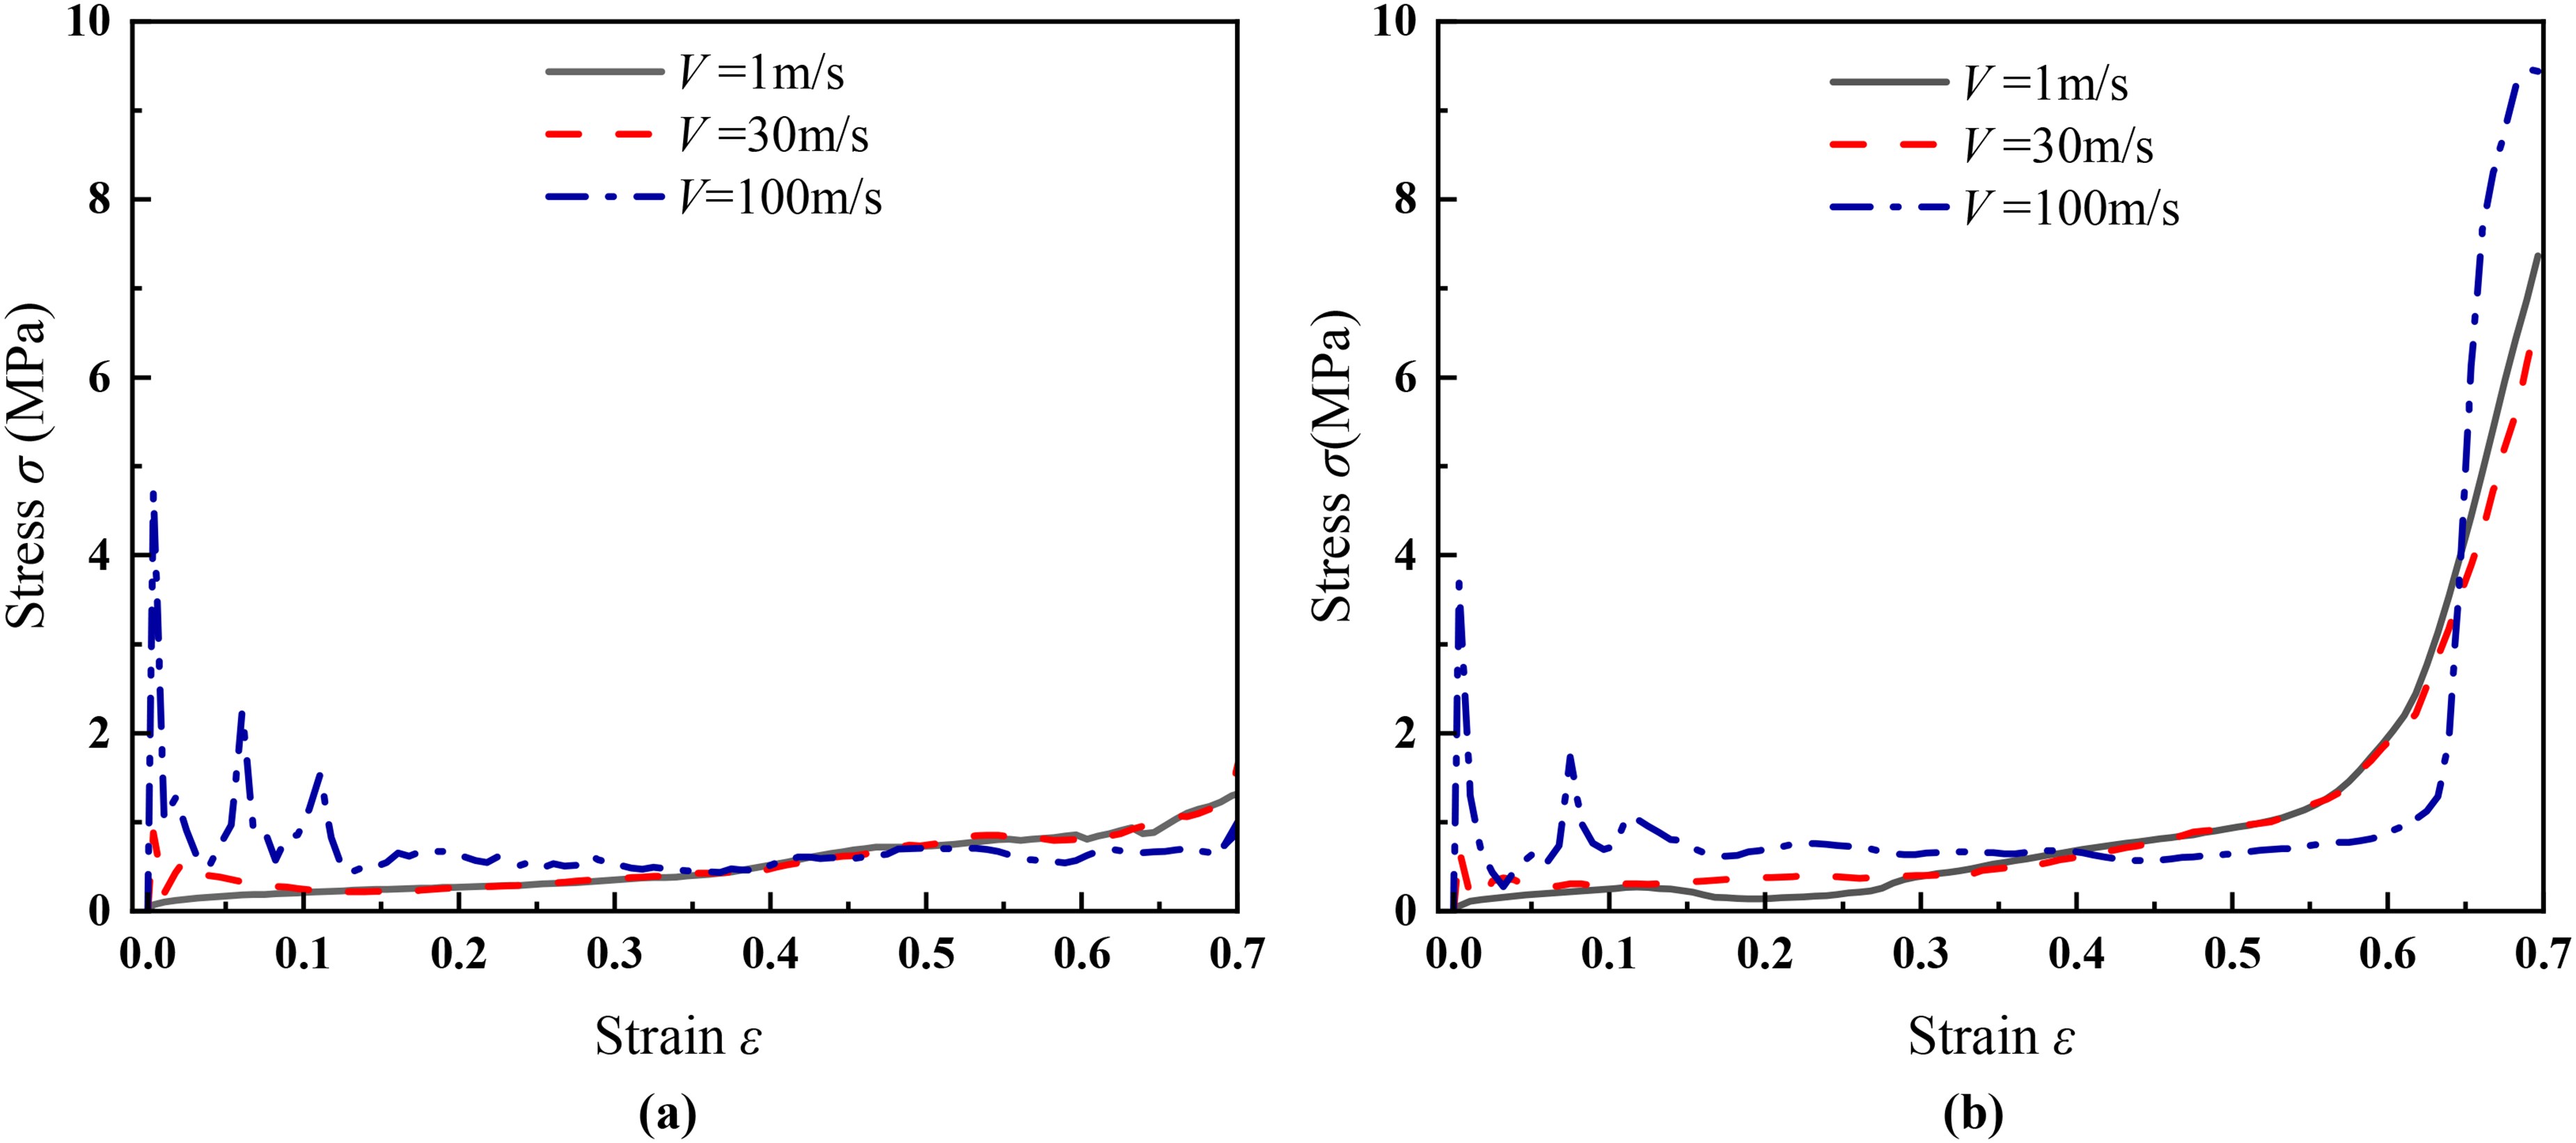
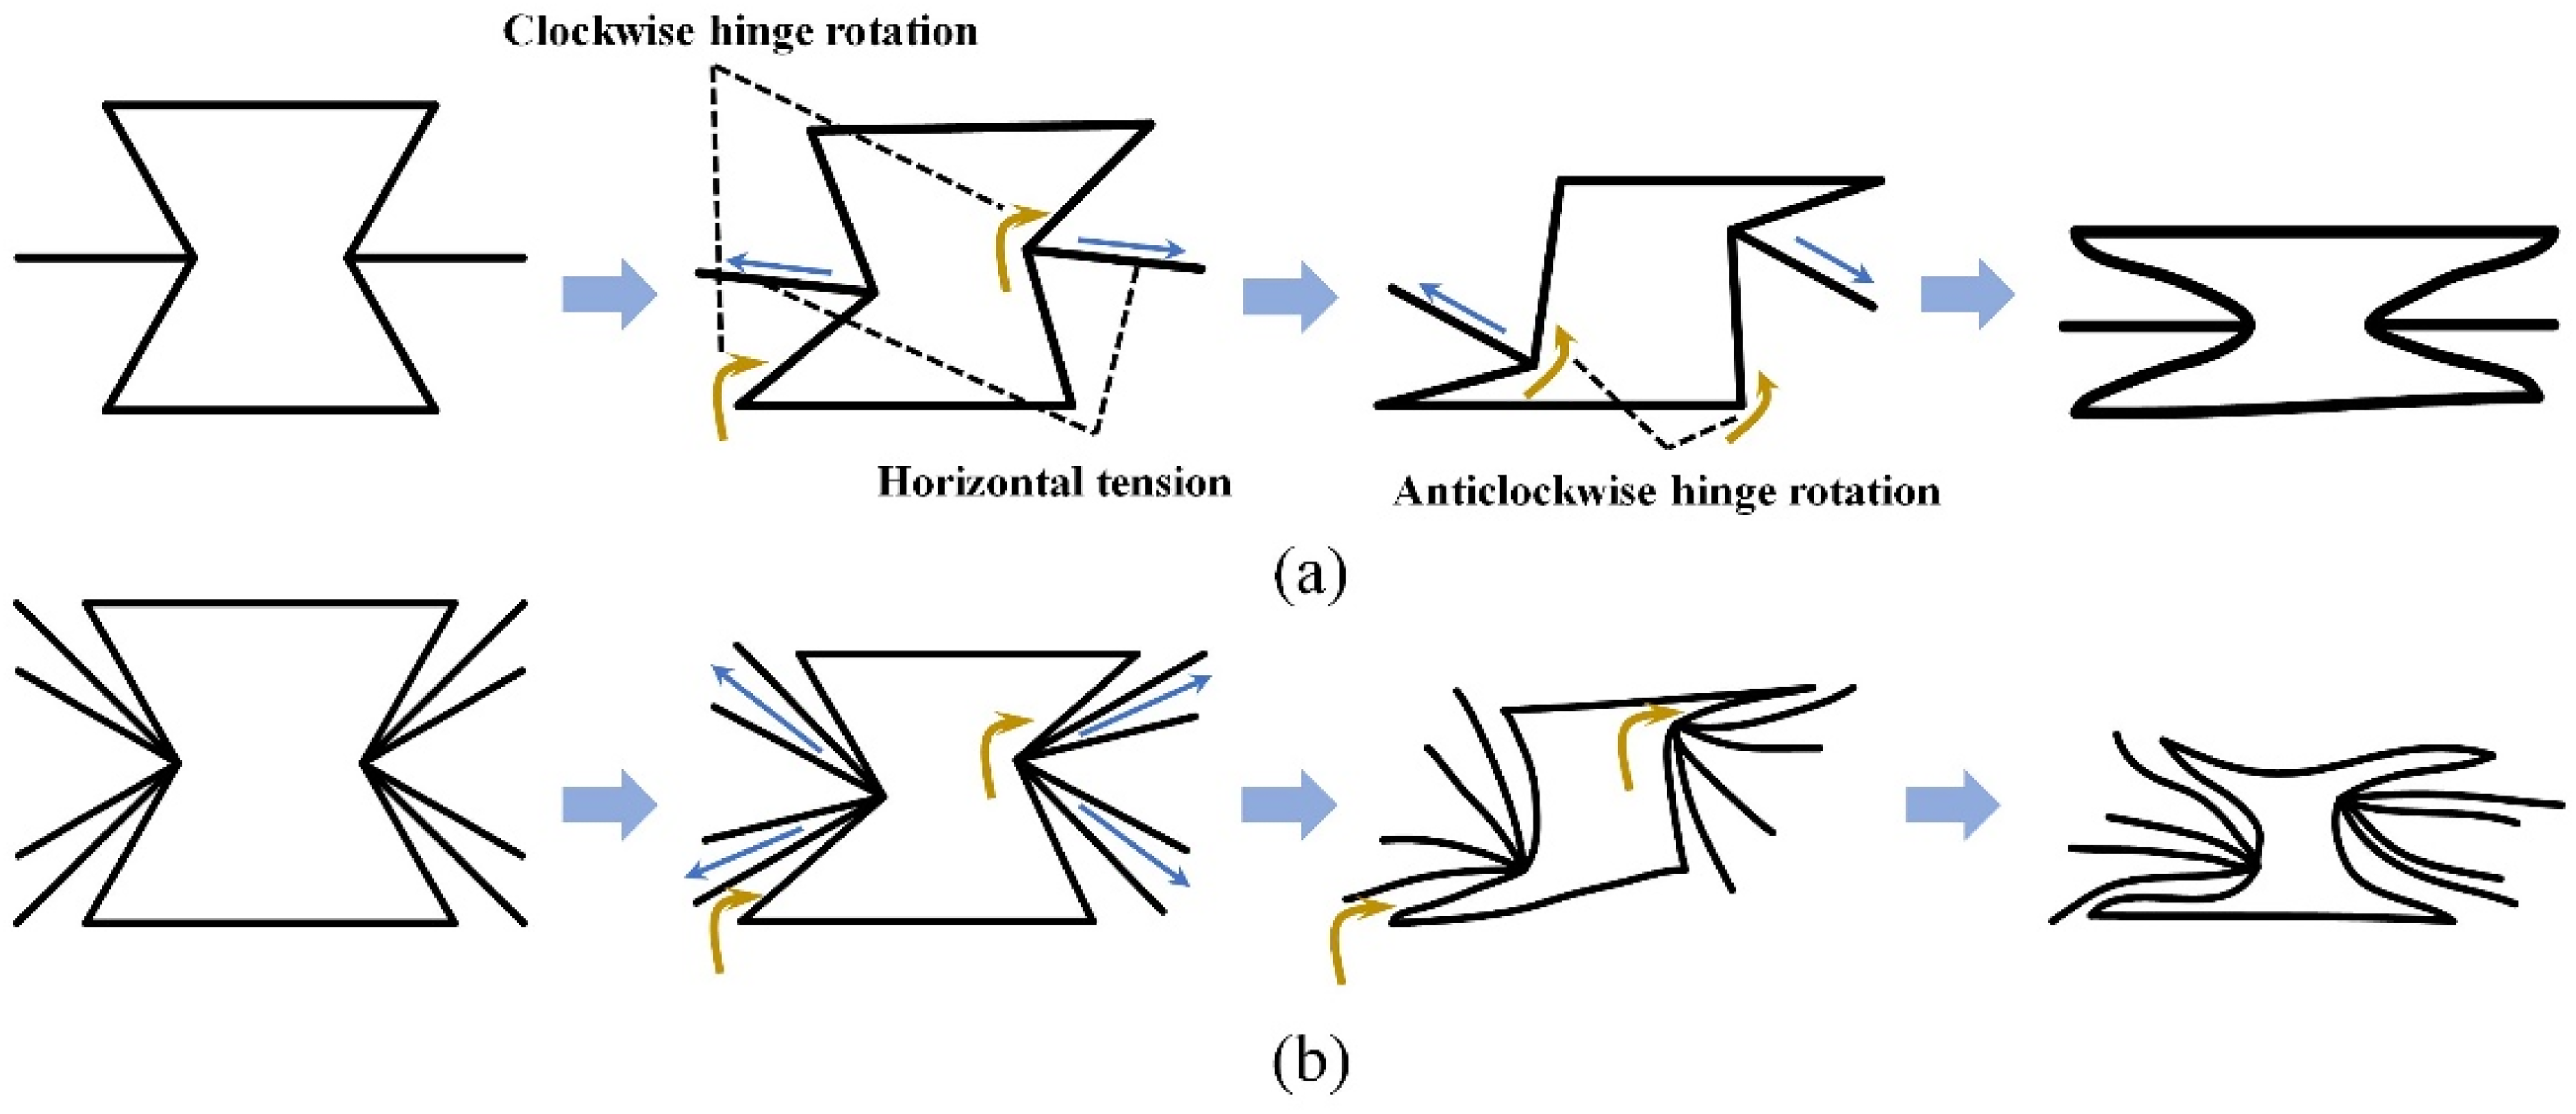
SEA is a crucial indicator of honeycomb impact resistance. Thus, a comparison of SEA between RH and NEH in the platform stage at various compression rates is illustrated in Figure 9. It can be observed from the figure that for different honeycomb configurations, greater energy absorption can be obtained at higher compression speeds. The difference in energy absorption of RH is not significant at medium and high compression speeds. However, the SEA of NEH is more responsive to changes in compression speed, which escalates with higher speeds. Additionally, the figure illustrates that NEH exhibits superior energy absorption capacity compared to RH across all specific velocities. Under low-speed compression, the SEA of NEH was 7.4% higher than that of RH. During medium-speed compression, the disparity in energy absorption capacity between the two configurations is most significant, with NEH's SEA being 47.3% higher than RH. Similarly, under high-speed compression, despite the honeycomb primarily experiencing inertial effects and the SEA between NEH and RH being closer, NEH still exhibits a more pronounced energy absorption capacity, which is 7.7% higher than RH's. In addition, the NPR effect induced by shrinkage deformation significantly impacts the impact resistance of honeycomb structures. Figure 7 illustrates the distinct deformation patterns between NEH and RH. To further illustrate this discrepancy, Figure 10 displays the localized deformation patterns of individual cells during quasi-static compression for NEH and RH. As depicted in the figure, the plastic hinge rotation in both honeycomb cells results in hypotenuse dense bending, and the horizontal tensile force causes contraction and deformation of the structure. In comparison to RH, NEH features multiple hypotenuse edges that disperse the horizontal force applied to the honeycomb without impacting the shrinkage or deformation of the structure. This characteristic is advantageous in extending the stress plateau period of NEH, thereby enhancing its energy absorption capacity.
Energy absorption of different honeycomb structures.
Local typical deformation mode of a single unit cell of a honeycomb structure under quasi-static compression: (a) RH, (b) NEH.
Discussions
In summary, NEH exhibits superior mechanical properties and energy absorption capacity compared to RH. It can be attributed to the significant impact of wall thickness on the mechanical characteristics of structures. Therefore, this section explores how various wall thickness gradient distributions impact the mechanical characteristics and energy absorptive capability of NEH.
Effect of gradient distribution on deformation patterns
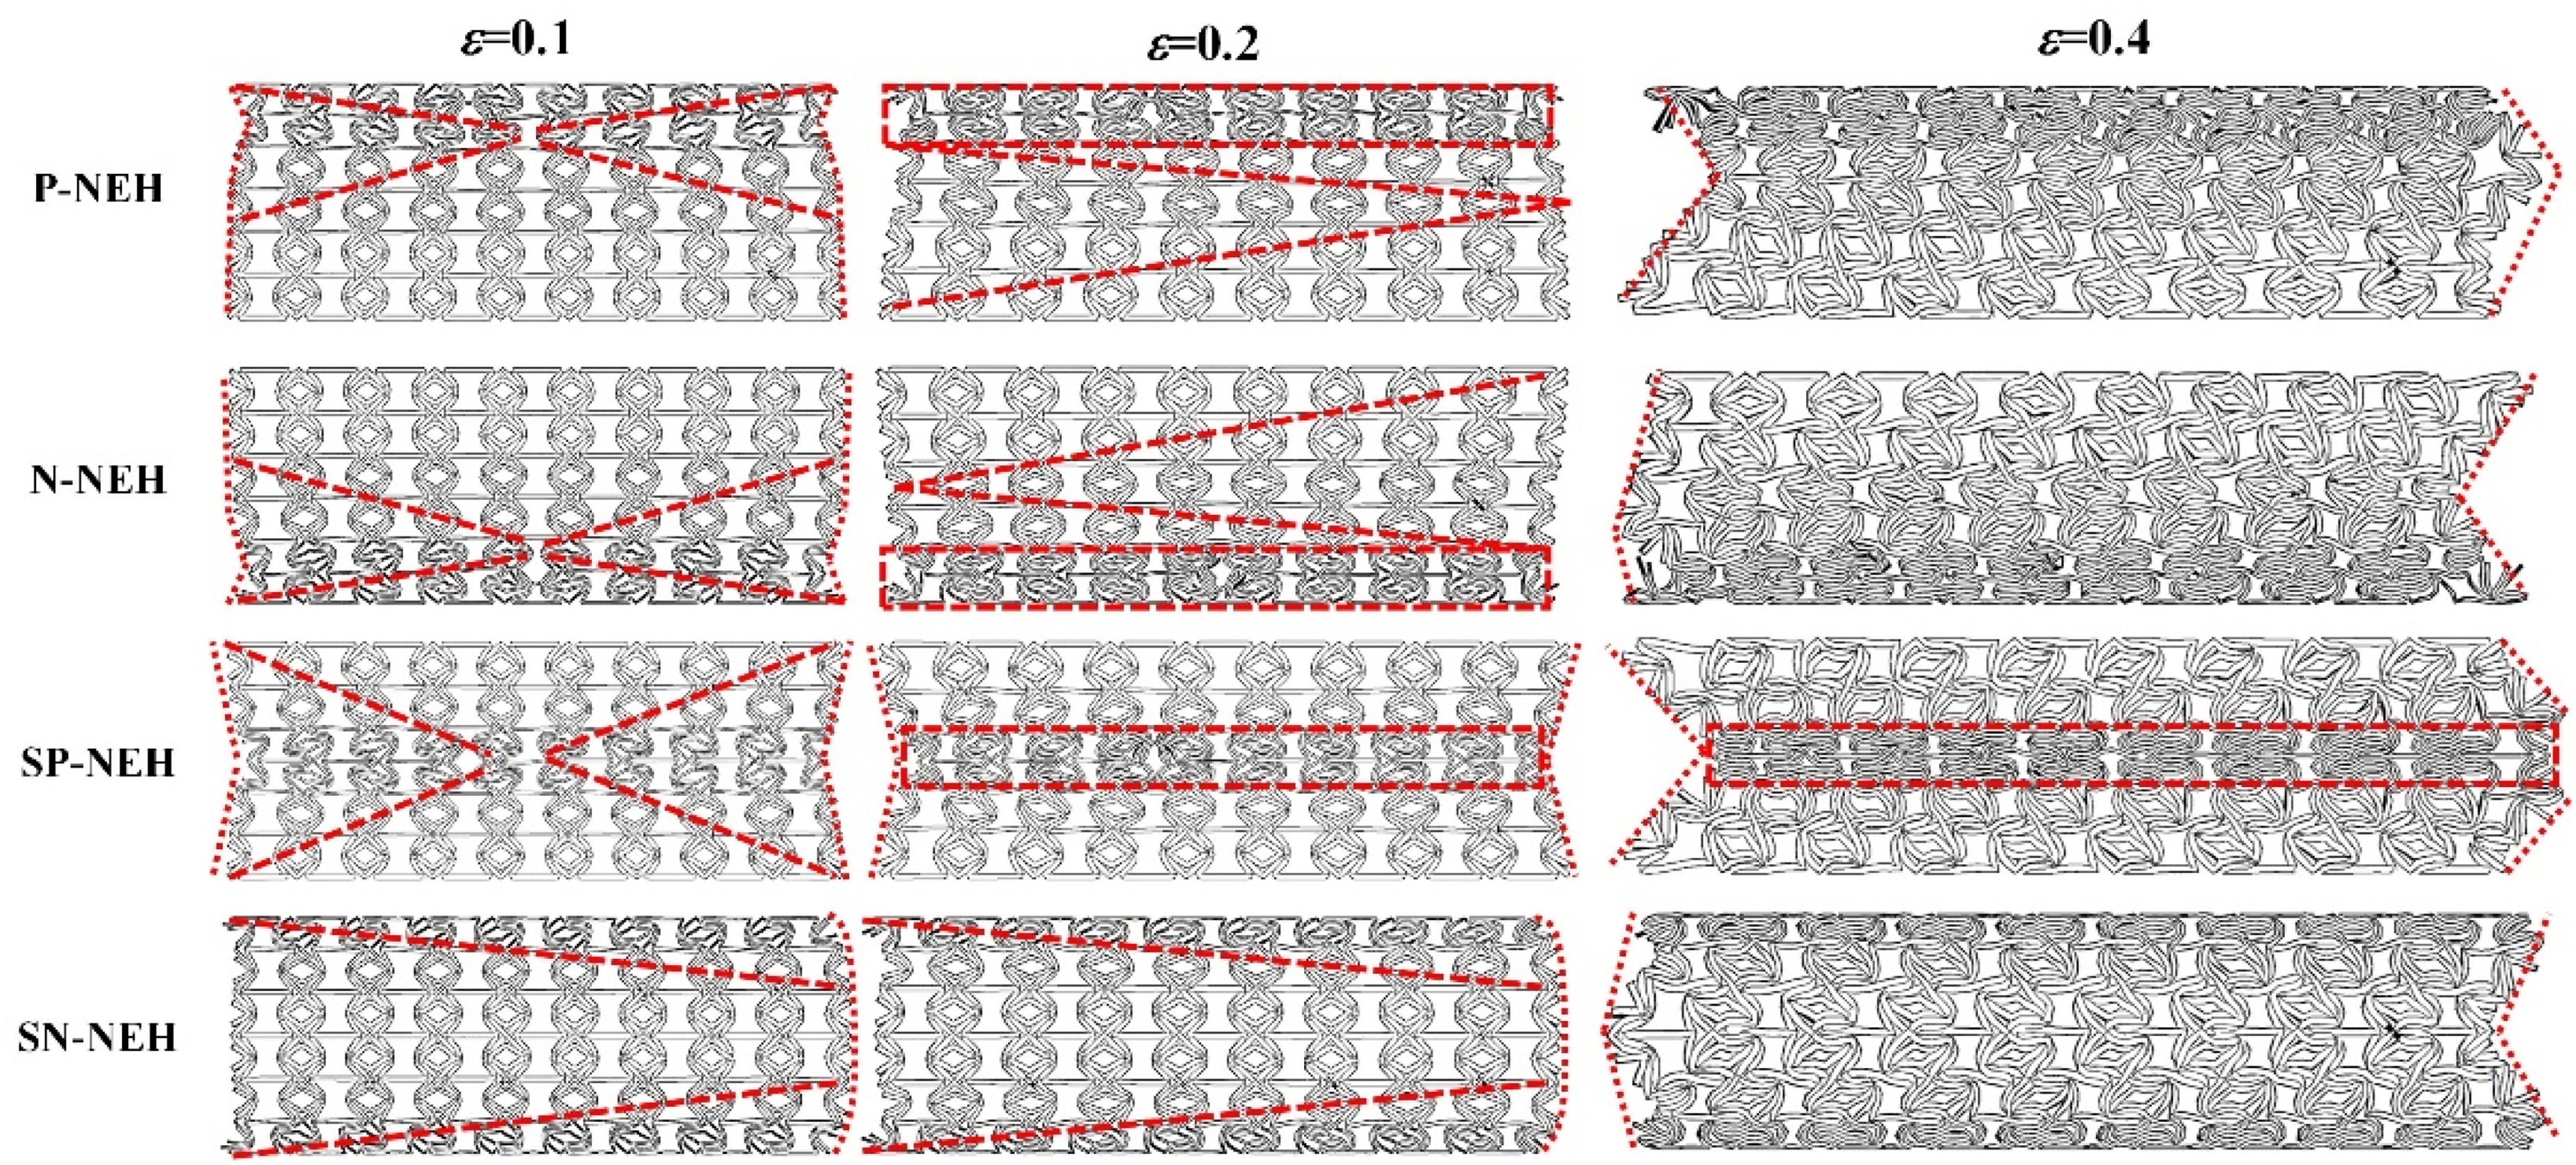
Figure 11 exhibits the deformation process and deformation pattern of NEH with different thickness gradients under low-velocity impact (1 m/s). As illustrated by Figure 11, during the early distortion phase under the low-velocity impact, the P-NEH undergoes distortion starting at the impact side, and gradient layers 1 and 2 are first deformed and locally “necked,” while the cells of gradient layer 3 remain undeformed. As the strain in the P-NEH increases, the cells in gradient layer 1 buckle to form an “I"-shaped dense band. Meanwhile, due to the interaction of wall thickness and reinforcement, the cells of gradient layers 2 and 3 formed a V-shaped deformation band with the opening to the right. As the strain increases, the “I + V” distortion band passes toward the fixed side until the entire P-NEH densifies. Also, the deformation patterns of N-NEH and P-NEH are the same; gradient layers 1 and 2 deform first and show the NPR effect. However, because of the varying arrangement and order of the gradient layers, the deformation of N-NEH is primarily focused on the impact and fixed sides. As a result, gradient layer 1, with a smaller thickness and equivalent elastic modulus of the cell elements, gets crushed initially. The central region of the SP-NEH will initially be compressed, displaying an incomplete “X” deformation pattern at the onset of deformation. With increasing strain, SP-NEH demonstrates an “I” deformation pattern. In contrast, the deformation pattern of the SN-NEH exhibits an incomplete “V” shape, attributed to the higher strength of gradient layer 3, with the NPR being less pronounced. Generally, the gradient NEH initially experiences compression in the gradient layer with the lower wall thickness. During low-velocity impacts, the NPR first appears in the cell layers with smaller wall thicknesses, causing the cells to rotate with the thickness change and apply transverse forces on the neighbouring layers. Consequently, the adjacent layers show transverse expansion, leading to a laminar shrinkage deformation pattern.
Deformation modes of gradient NEHs at low velocity impact (1 m/s).
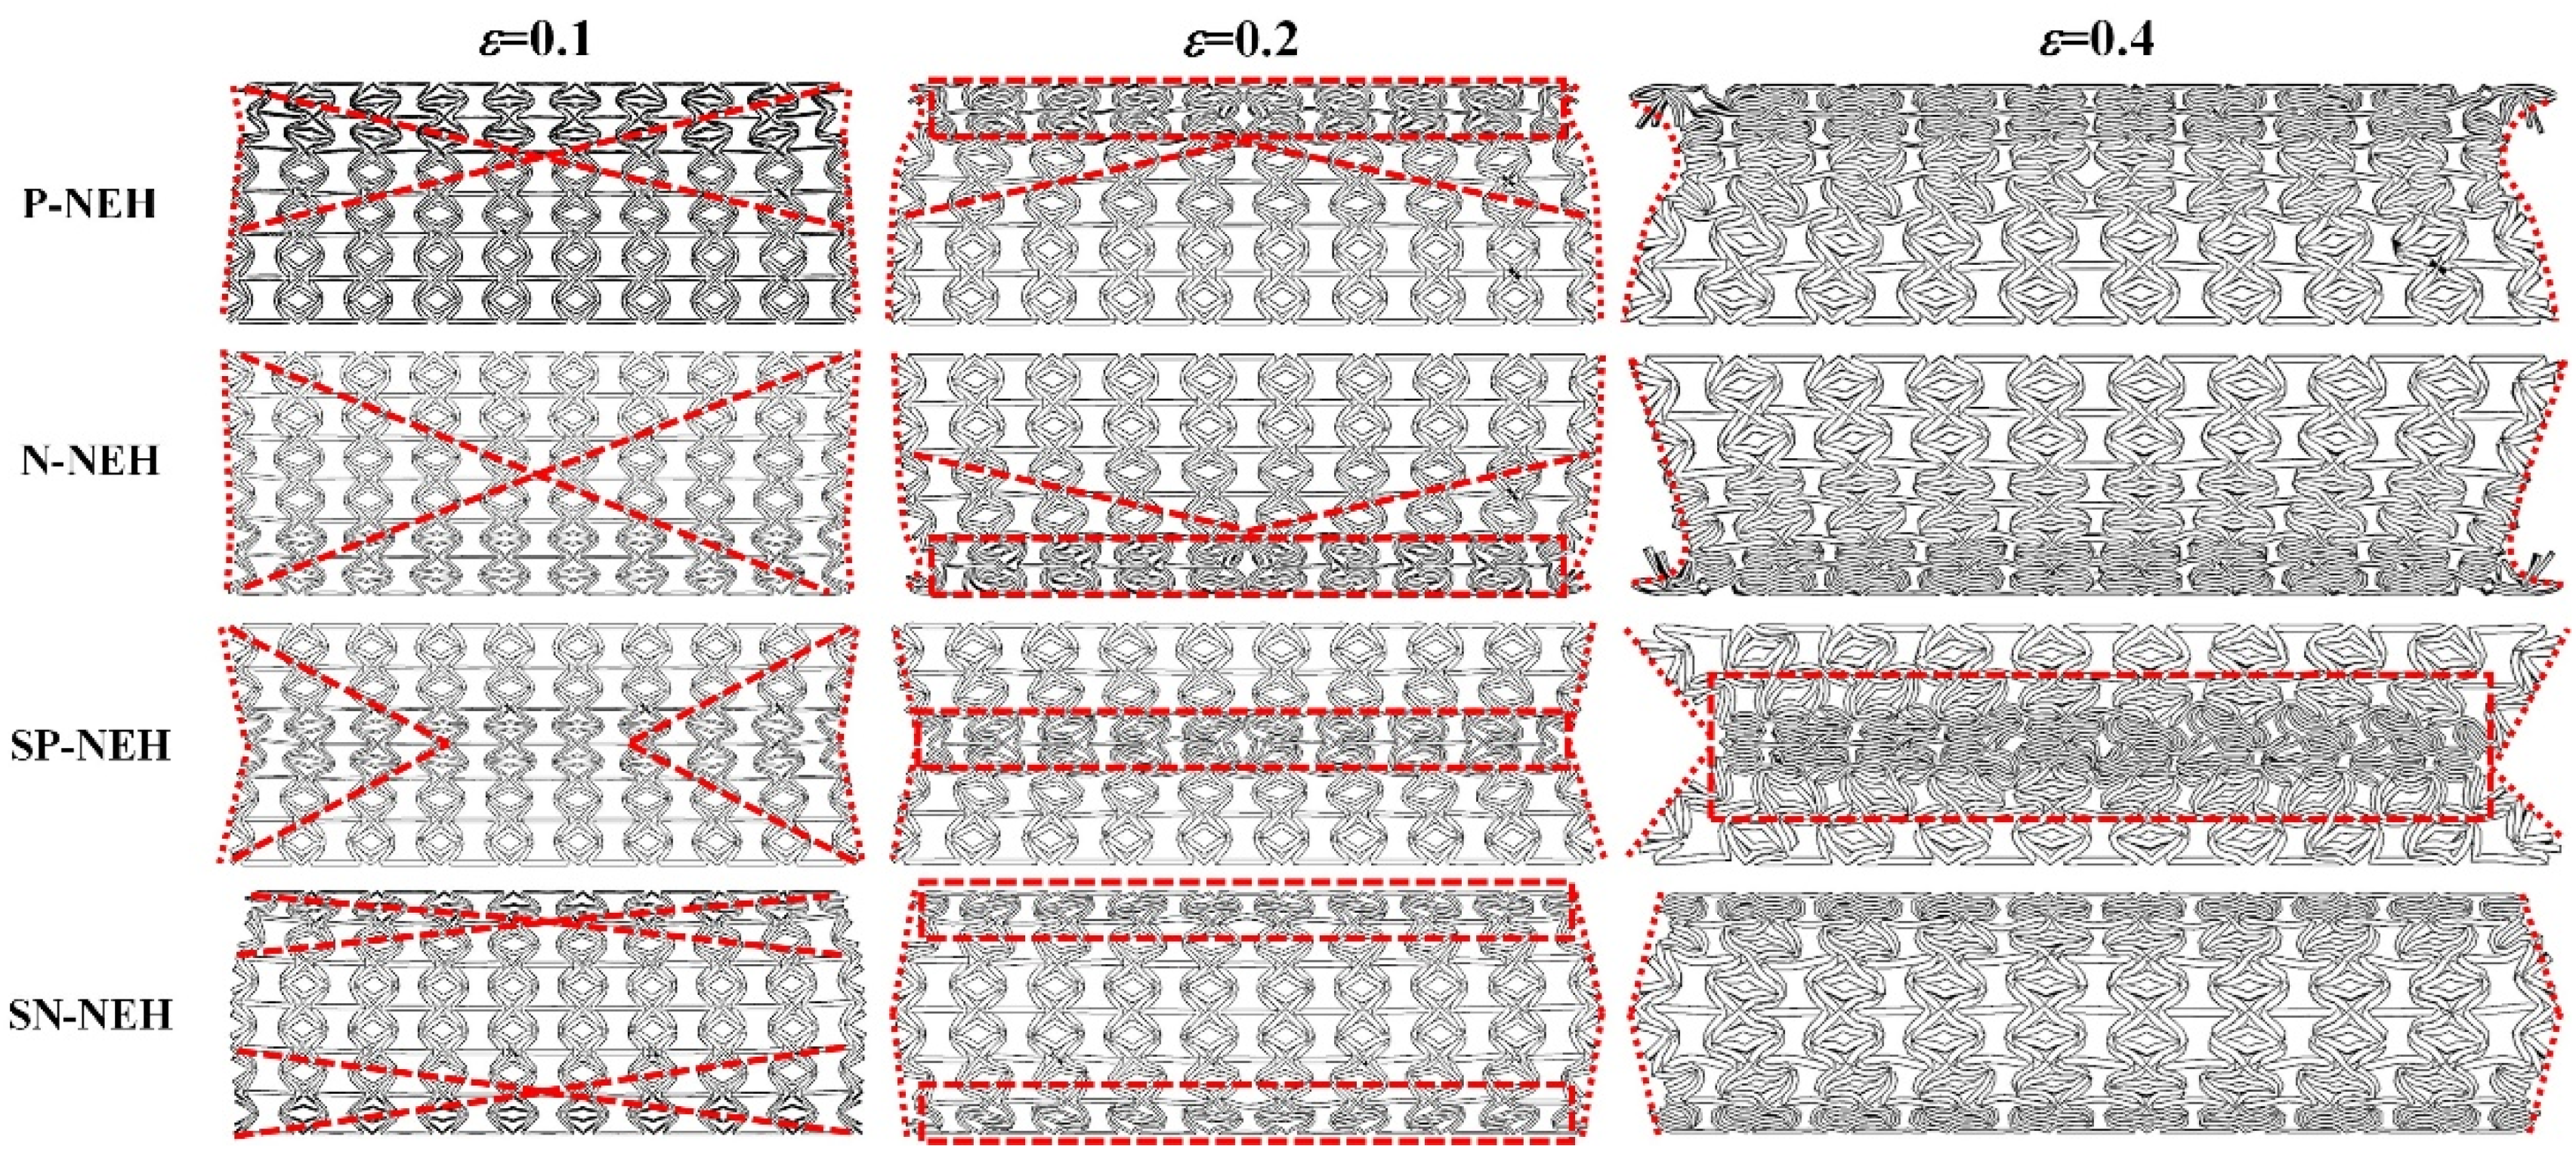
Figure 12 depicts the deformation process and pattern of NEH with varying thickness gradients during medium-velocity impact (30 m/s). The deformation pattern of P-NEH in the early deformation phase under medium-speed striking resembles that under low-speed striking in the figure. When ε = 0.2, the gradient layer 1 forms an “I” type dense zone, and the deformation region extends to the gradient layer 2 to create “V” type distortion zone. Consequently, the overall structure displays “I + V” pattern. Furthermore, with the ongoing compression displacement increase, the deformation region further expands until the entire P-NEH structure is fully densified. For N-NEH, in the initial deformation stage, different from the deformation pattern of P-NEH, the gradient layer 3 first undergoes contraction, and “X” pattern is found at ε = 0.1. As the compressive strain continues to increase, the distortion pattern of N-NEH is akin to that of P-NEH, and due to the greater strength of gradient layer 3, the gradient layer 1 first undergoes densification and shows an “I” deformation band, and the gradient layer 2 shows “V” deformation band until the whole is densified. For SP-NEH, it differs significantly from the gradient structure described earlier. During the initial phase of small distortion, the distortion initiates in the thin-walled gradient layer 1, leading to lateral shrinkage deformation in the overall structure, resulting in an incomplete “X” deformation pattern. As the strain increases, the gradient layer 1 undergoes densification, displaying an “I” deformation pattern. The deformation patterns of SN-NEH differ significantly from those of SP-NEH, but all deformation regions occur in the cell layers with smaller wall thicknesses. As the structural strain increases, SP-NEH exhibits an “X” type deformation pattern, showing a weakening of the sideways expansion of the gradient layer and a noticeable transverse contraction of the structure as a whole. However, the deformation zone of SN-NEH still occurs in areas with smaller wall thicknesses, and its deformation pattern is significantly affected by the distribution of the wall thickness gradient. Local deformation always initiates in regions with smaller thicknesses and gradually extends to areas with larger thicknesses.
Deformation modes of gradient NEHs at medium velocity impact (30 m/s).
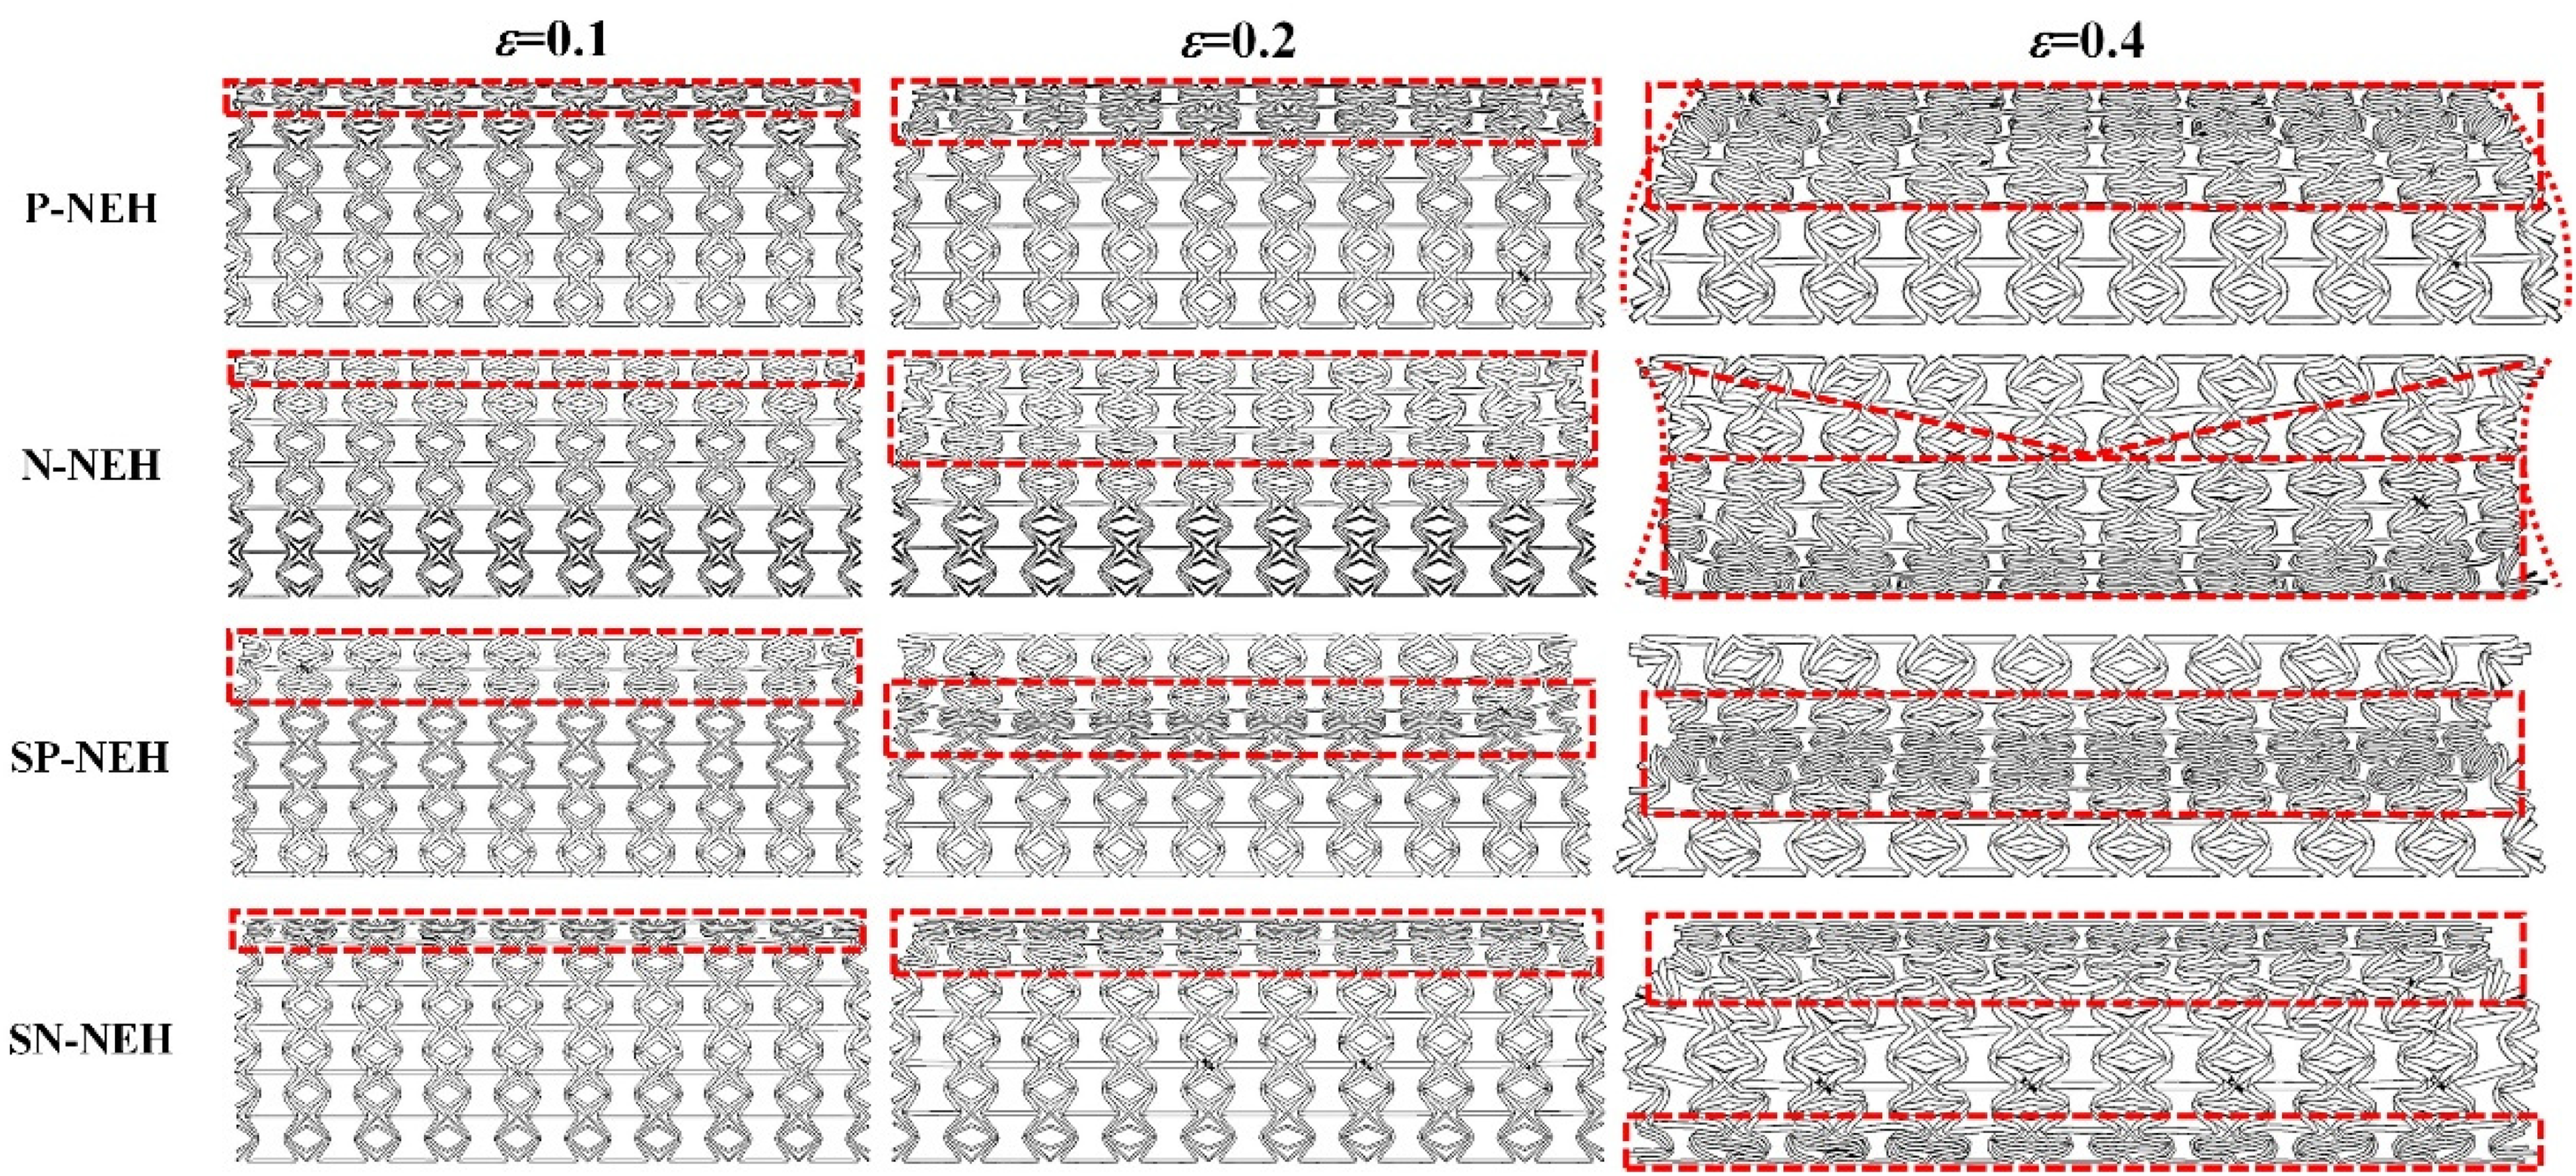
Figure 13 illustrates the deformation process and patterns of NEHs with varying thickness gradients during high-speed impact (100 m/s). The deformation pattern of NEH with thickness gradients is minimally influenced by the thickness distribution in the initial stage of deformation. With the increase in strain, NEH develops localized distortion at the striking side and then subsequently transmits to the fixed side. The deformation of these four gradient NEHs all exhibits “I” deformation patterns. However, the deformation patterns of NEHs with different thickness gradients are slightly different due to the different distribution of gradient layers in the transfer process. For both P-NEH and N-NEH, the compressive deformation of the structure initially happens near the impact end, while the densification deformation band occurs in the gradient layer with a thinner cell wall thickness. Therefore, there is an “I” type of deformation zone in both gradient NEHs, but the difference is that the N-NEH is an “I + V” type. In addition, In SP-NEH, cell layers with larger wall thicknesses did not expand outward, and the overall structure exhibited noticeable transverse shrinkage deformation, showcasing a strong NPR effect. While the deformation order of the gradient layer in SN-NEH mirrors that of SP-NEH, it is influenced by the distribution of the wall thickness gradient, resulting in a distinct deformation pattern and insignificant NPR performance.
Deformation modes of gradient NEHs at high velocity impact (100 m/s).
Effect of gradient distribution on the dynamic response curve
Figure 14(a) illustrates the dynamic crushing stress-strain curve of P-NEH. Additionally, the crushing stress-strain curves of N-NEH under various compression speeds are depicted in Figure 14(b). When ε is low (i.e., before 0.2), higher stresses are achieved at high compression speeds, while lower stresses are achieved at low compression speeds. Nevertheless, for a specific speed, the crushing stress first increases and then decreases before reaching ε = 0.2. Figure 14(c) and (d) exhibit the stress-strain curves of symmetric gradient NEH at different impact velocities. At low impact velocities, the SP-NEH exhibits higher peak stresses during the elastic phase. This is due to the greater equivalent elastic modulus at its top side during the initial stage of impact. Under medium-velocity impacts, both symmetric gradient NEHs exhibited significant stress peaks in the preliminary of deformation. During high-velocity impacts, the stress of SP-NEH fluctuates more during the plateau stage, but the plateau stress of SP-NEH surpasses that of SN-NEH regardless of impact velocity.
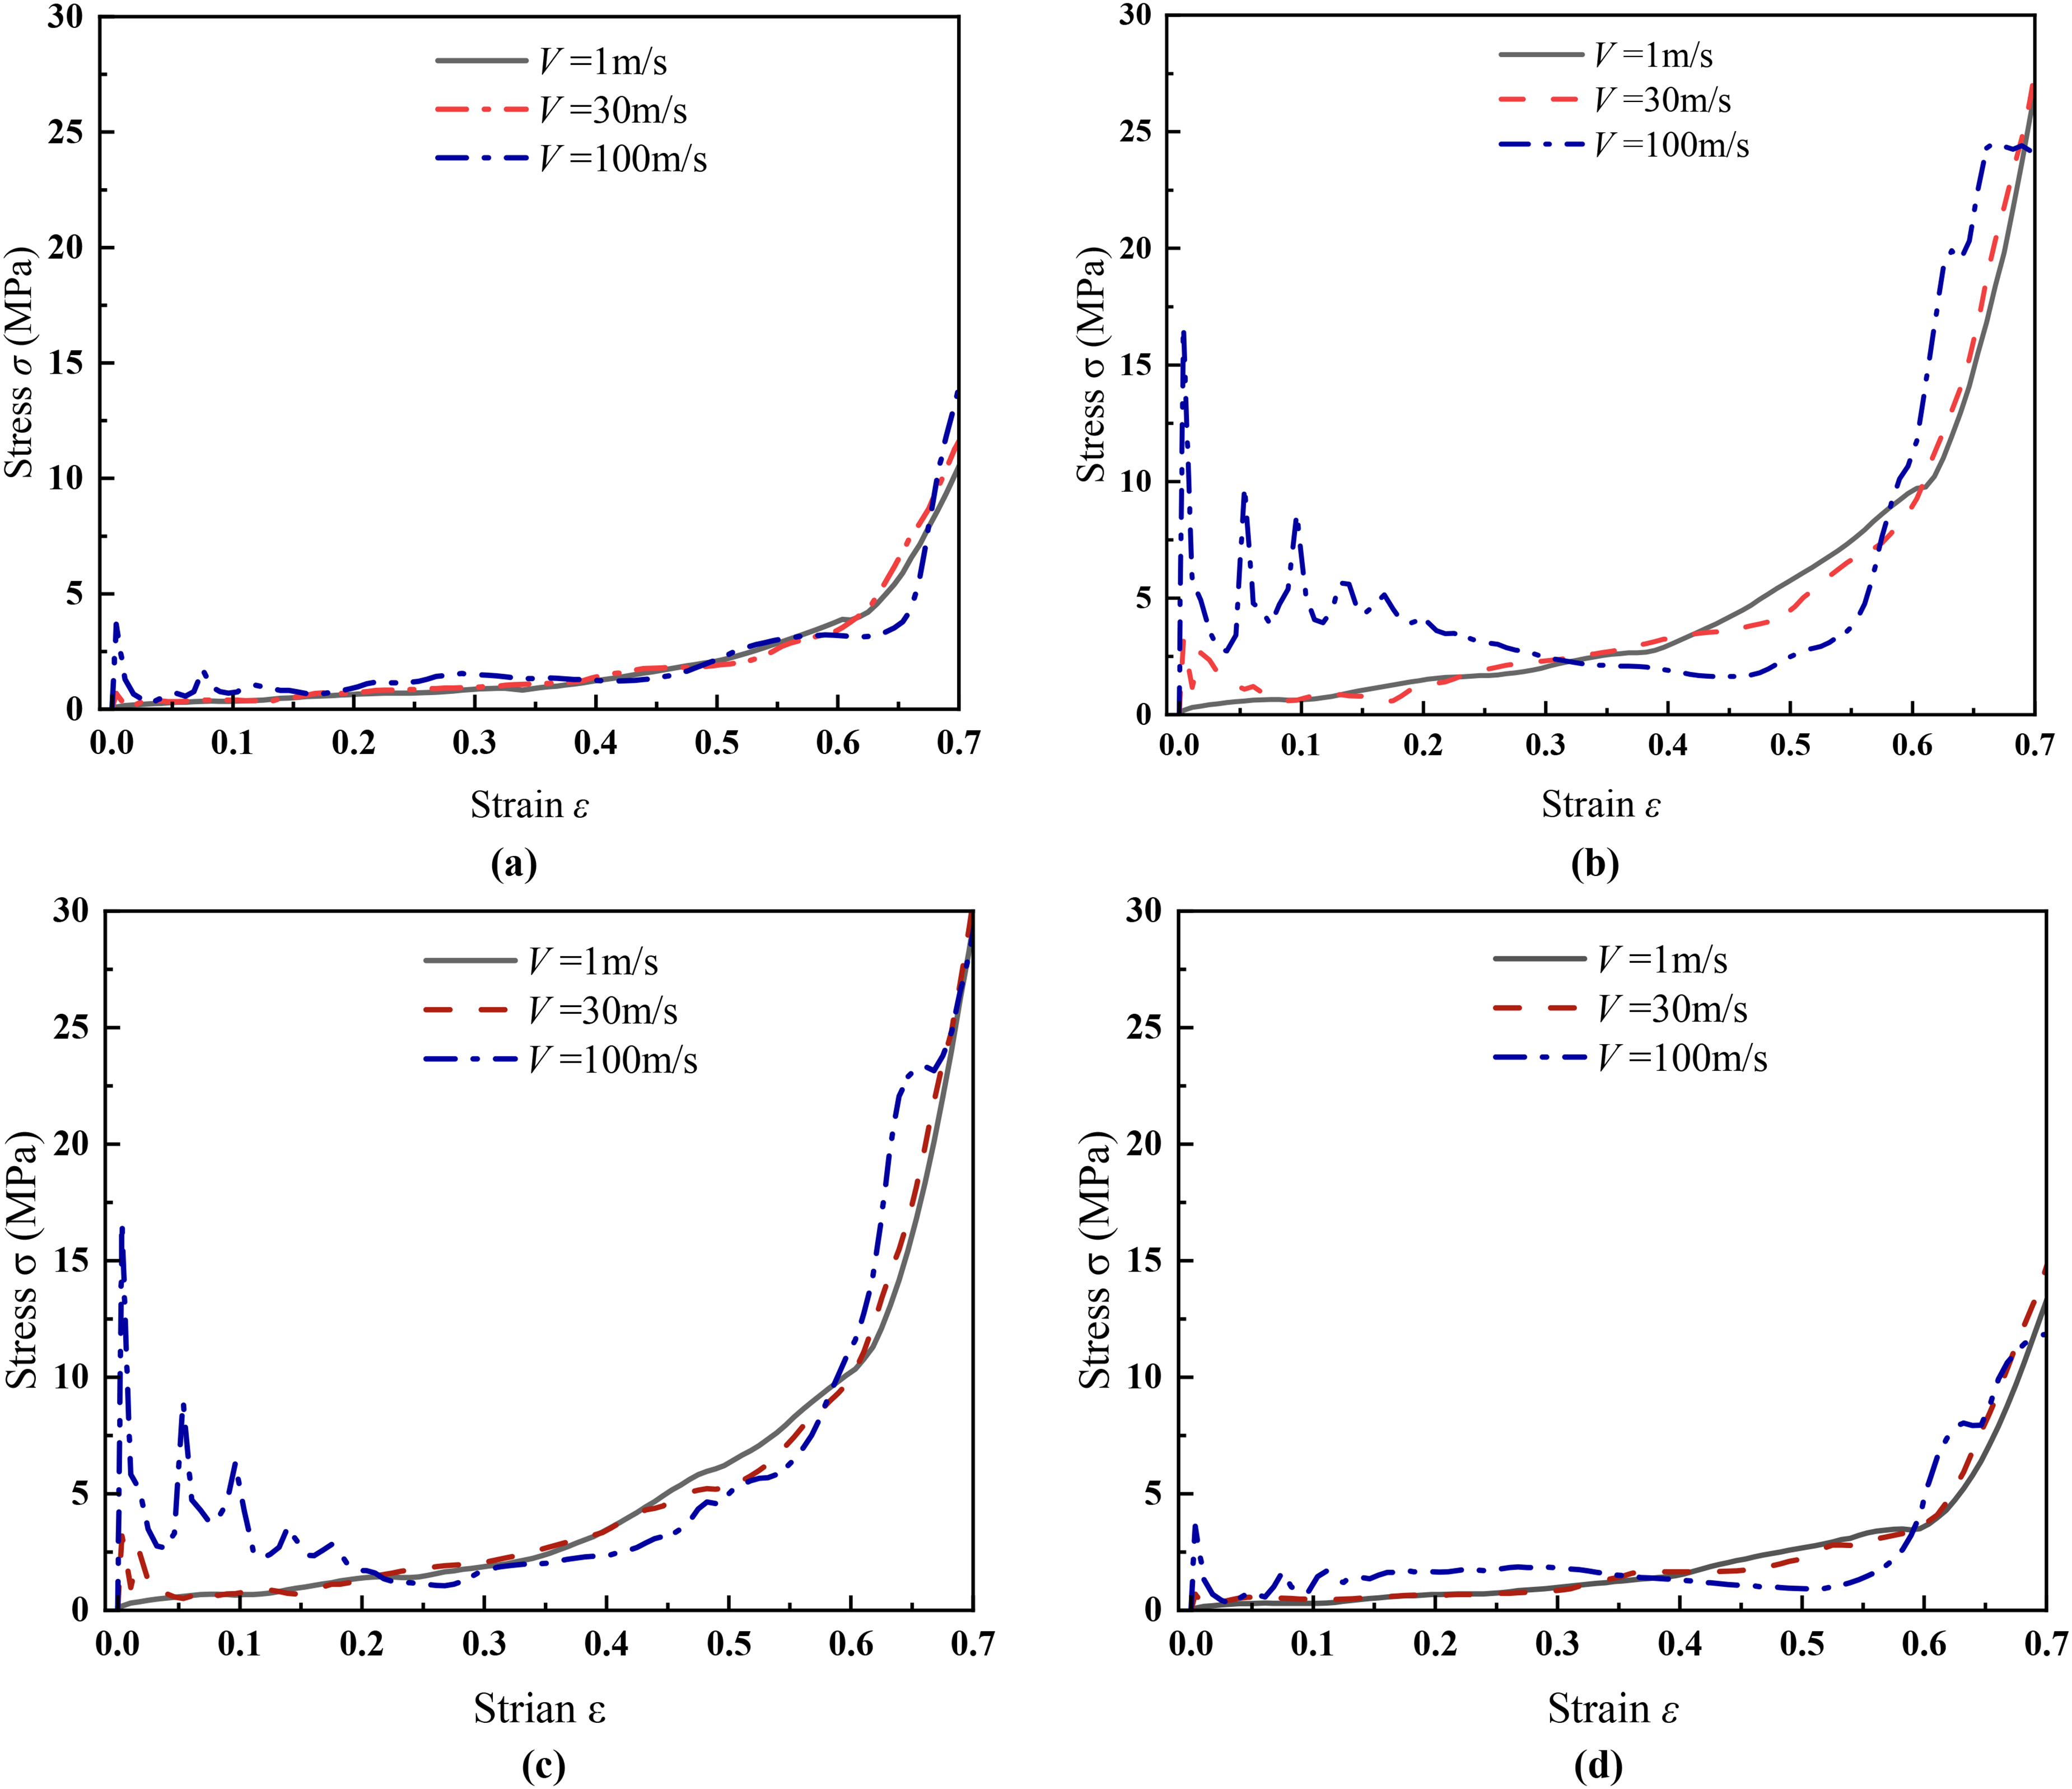
Dynamic crushing stress–strain curves. (a) P-NEH, (b) N-NEH, (c) SP-NEH, (d)SN-NEH.
Therefore, it can be inferred that the gradient distribution and compression speed play a substantial role in the crushing stress of the NEHs. It can be observed from Figure 14 that the trends of these four thickness gradients of NEH are similar under low and medium impact speeds, but the crushing stresses of SP-NEH and N-NEH are higher than those of P-NEH and SN-NEH. Therefore, SP-NEH and N-NEH exhibit superior impact resistance compared to the other two NEHs. However, inertia plays a crucial role in high-speed impacts, being transmitted layer by layer, resulting in more pronounced fluctuations in the stress-strain curve. Specifically, the stress levels of N-NEH during the plateau stage surpass those of SP-NEH, suggesting that N-NEH overall demonstrates better impact resistance.
Effect of gradient distribution on platform stress
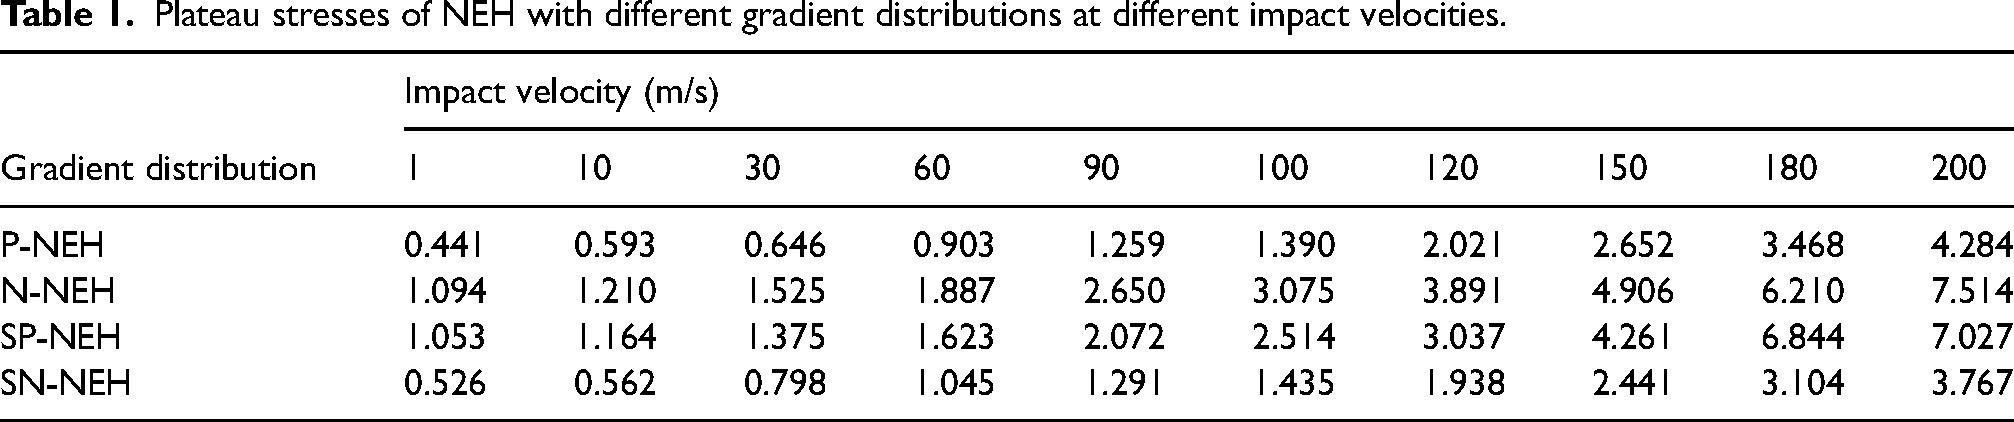
To further examine the influence of various gradient distributions on the impact resistance of NEH, this section will concentrate on platform stress. Typically, the higher the platform stress, the greater the impact resistance of the structure. Based on the stress-strain curves, the platform stresses of the gradient NEH were calculated using Eq. (3) and are presented in Table 1. Figure 15 depicts the numerical results and fitted curve of the gradient NEH platform stresses at different impact velocities. Discrete points and solid lines indicate the simulated values and fitted curves, respectively. From the figure, it is evident that platform stress rises as velocity increases. There is a notable contrast in platform stresses among the four gradient distribution honeycombs at the same impact velocity. Among them, the difference in plateau stress between N-NEH and SP-NEH, P-NEH, and SN-NEH is minimal. However, the plateau stress of N-NEH is the highest, suggesting that N-NEH can significantly enhance the energy absorption capacity of the honeycomb. Under high-speed impact, the gradient distribution has minimal influence on platform stress. However, due to the inertia effect, the slope of the curve in Figure 15 increases significantly as the impact speed rises, with N-NEH showing a faster increase rate. Consequently, the impact resistance of N-NEH surpasses that of other gradient NEHs. The platform stresses obtained by empirical equation (5) are compared with those calculated by simulation. The findings indicate that the platform stress of the gradient NEH is quadratically related to the impact velocity, and the fitted curves closely match the simulation results. The fitted parameters a were 0.115, 0.288, 0.229 and 0.142, and b were −72.1, −42.2, −45.0 and −86.4, respectively.
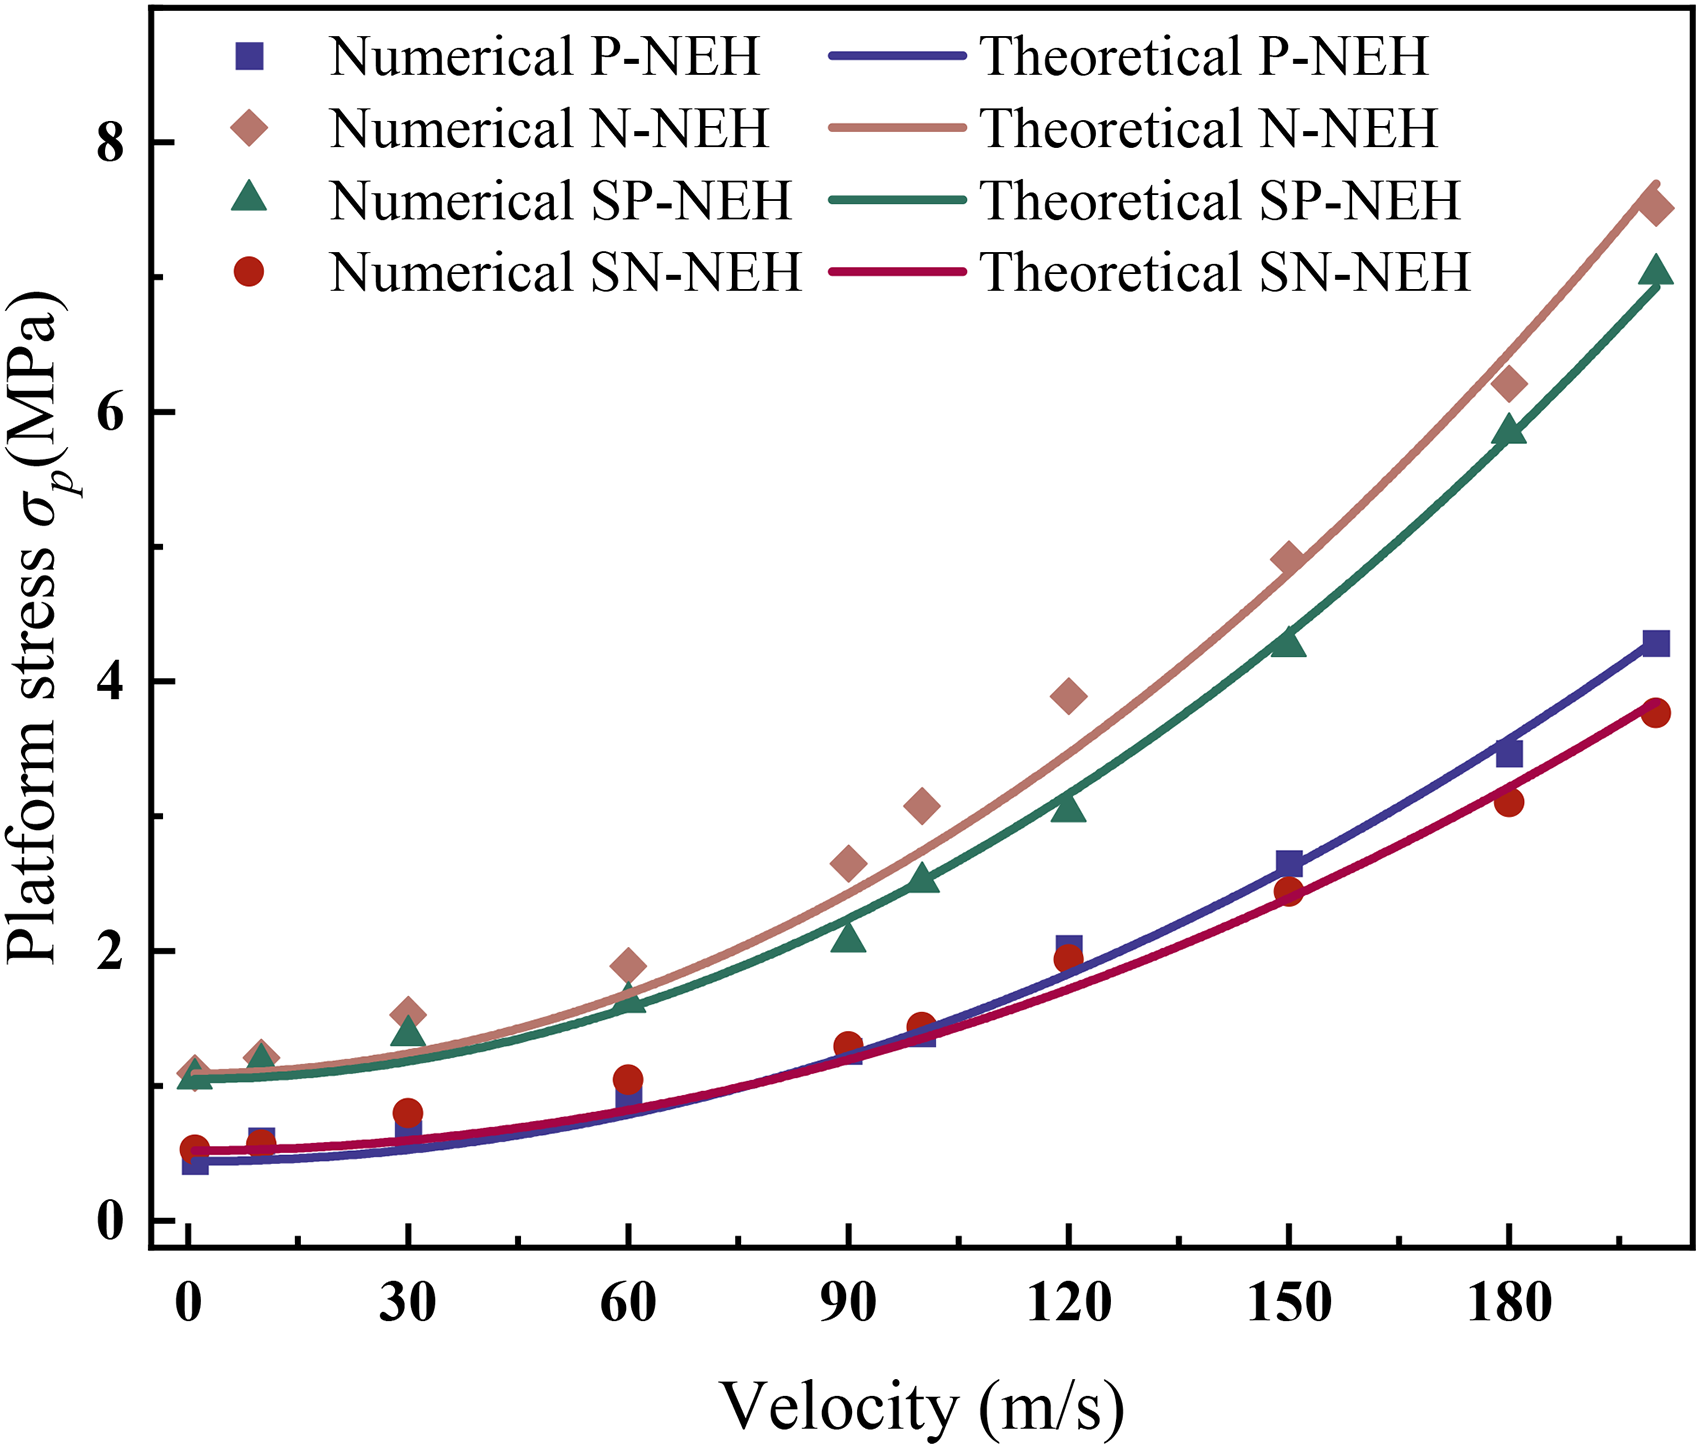
Comparison of the simulation results with the platform stress of the fitting formula.
Plateau stresses of NEH with different gradient distributions at different impact velocities.
Effect of gradient distribution on Poisson's ratio distribution
From analyzing the gradient NEH deformation pattern, it is evident that the honeycomb structure experiences compression and collapse deformation layer by layer, producing in a distinct local NPR deformation band. To determine the Poisson's ratio distribution in the Z-direction, five reference points are chosen along the Z-direction at equal intervals on both the left and right boundaries of the NEH, as illustrated in Figure 16. The Poisson's ratio distribution is defined by computing the ratios at five marks, and the average of the Poisson's ratios at all marks in a gradient layer is taken as the Poisson's ratio for that gradient layer. The horizontal strain 


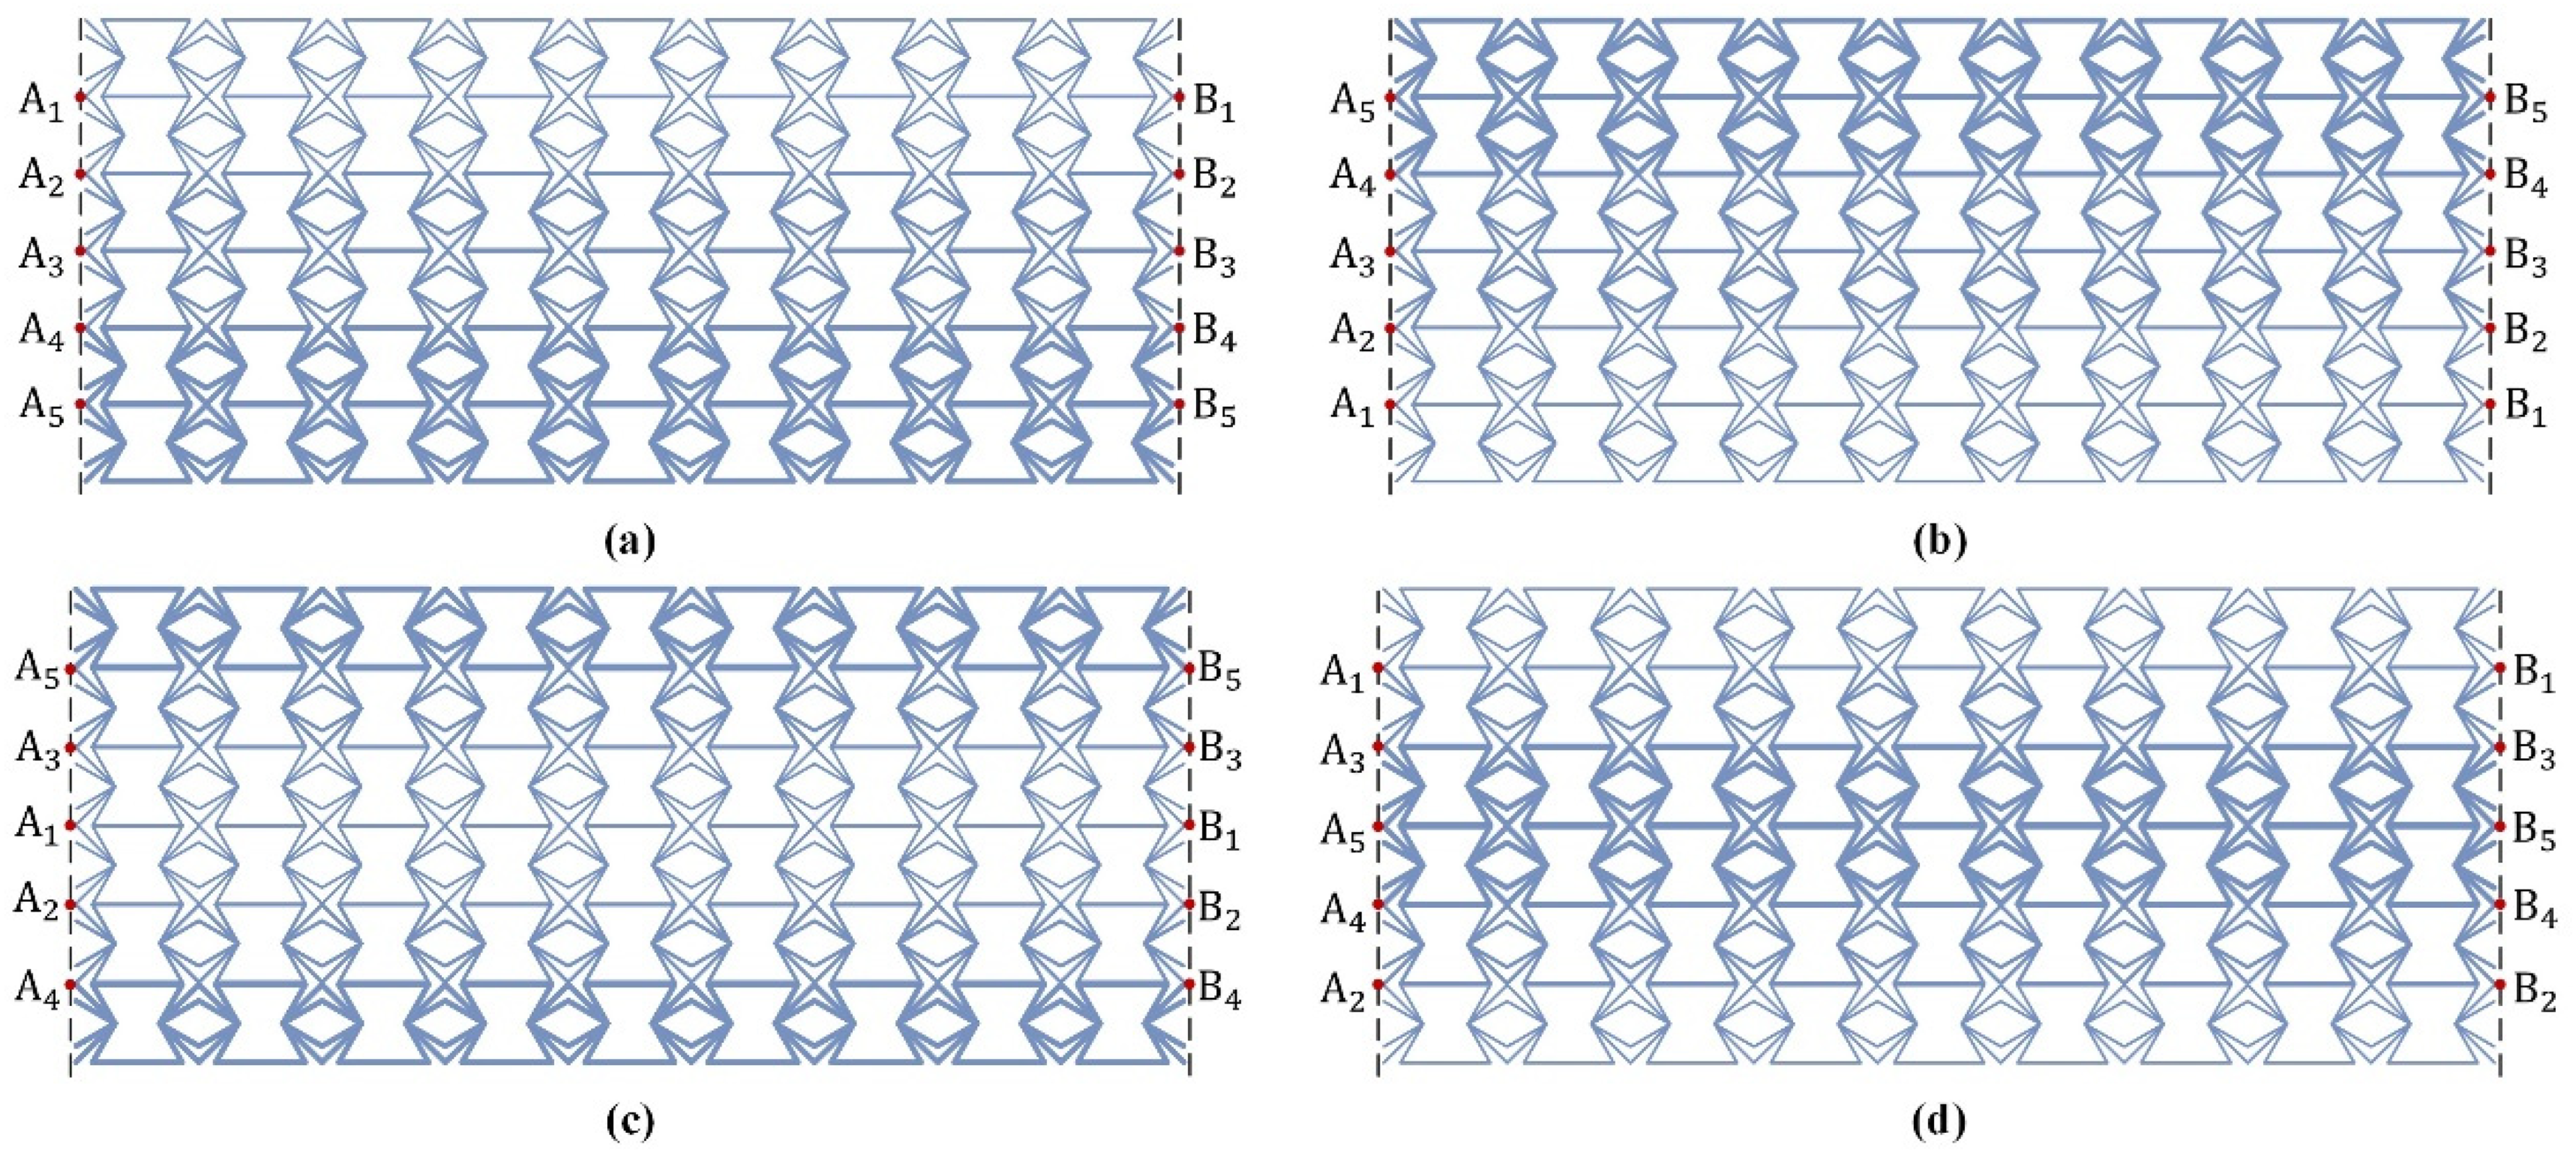
Schematic of the reference points of the gradient NEHs :(a) P-NEH, (b) N-NEH, (c) SP-NEH, (d) SN-NEH.
Where i is 0∼5, and
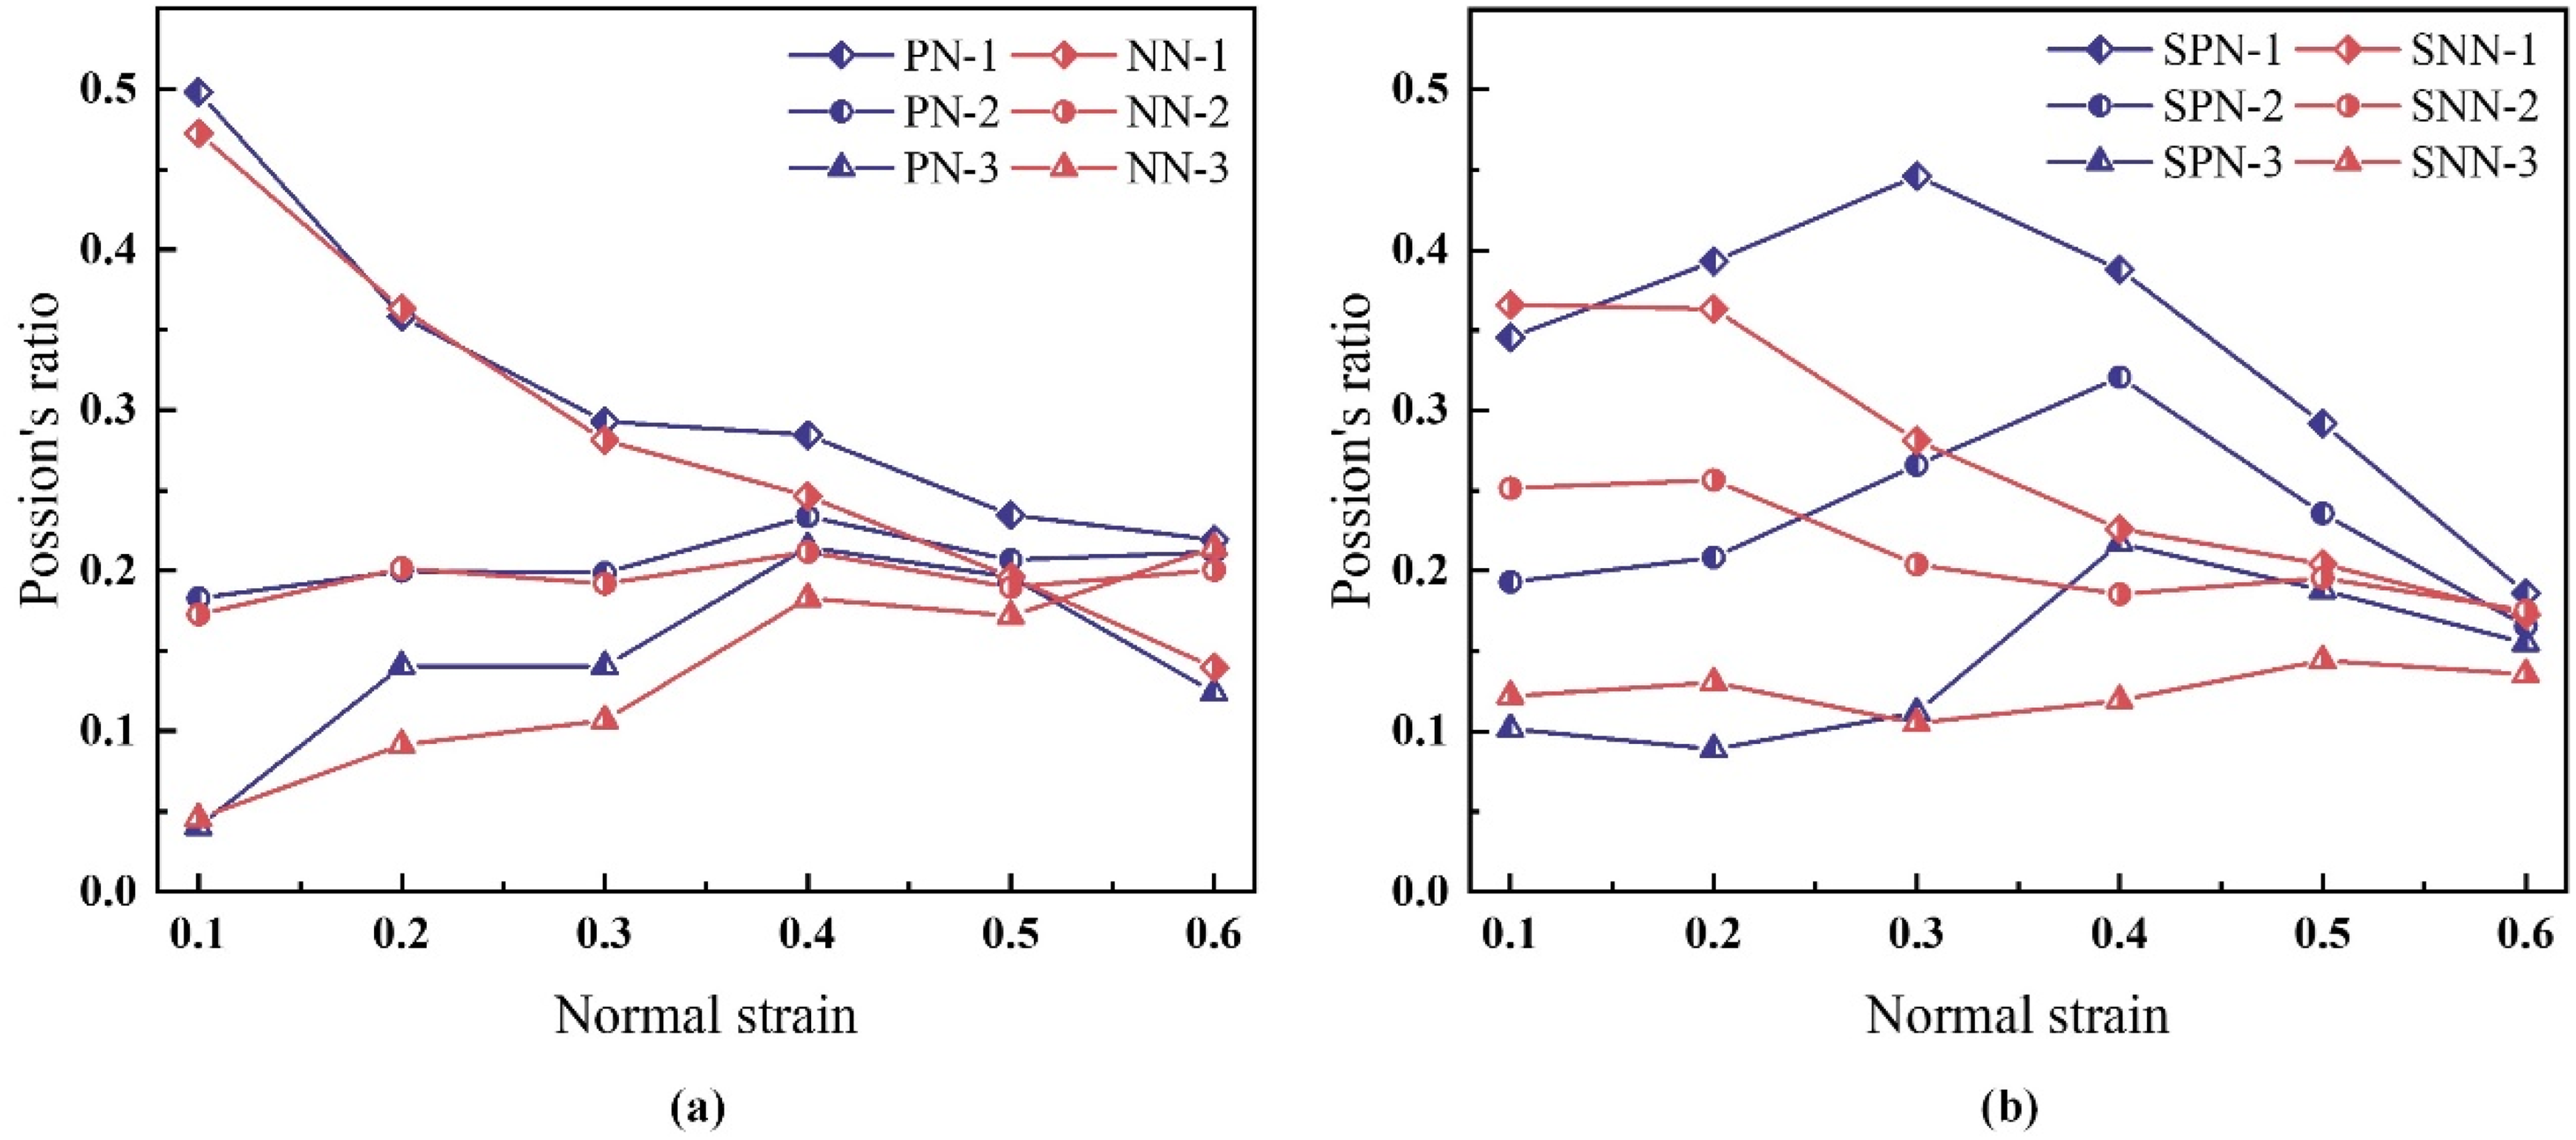
Poisson's ratio distribution at different graded layers with the nominal strain:(a) P-NEH and N-NEH, (b)SP-NEH and SN-NEH.
As shown in Figure 17(a), the absolute ν of gradient layer 1 in both gradient honeycombs are decreasing gradually, while the absolute ν of gradient layers 2 and 3 tend to increase initially and then decrease gradually. During compression, the absolute Poisson's ratio of gradient layer 1 in P-NEH is notably higher than that in N-NEH. In N-NEH, before the densification of gradient layer 1, the cells in gradient layer 2 experience simultaneous transverse compressive deformation, resulting in transverse compressive deformation of the honeycomb. However, in P-NEH, the
Figure 17(b) illustrates the absolute ν of SP-NEH and SN-NEH. It is evident from the figure that the absolute ν of all gradient layers of SP-NEH exhibit an initial increase followed by a decrease, whereas the absolute ν of SN-NEH gradually decrease throughout. Interestingly, the absolute ν of SP-NEH are significantly higher than those of SN-NEH as the compressive strain increases, except at the start of deformation, where the absolute ν of SP-NEH are smaller than those of SN-NEH. However, the gradient layer 1 in SN-NEH, which has a smaller wall thickness, deforms first and transmits the impact force it is subjected to layer by layer, resulting in the phenomenon that the absolute ν of the gradient layer 1 in SN-NEH are all higher than those of SP-NEH in the initial stage of the impact. Similarly, the absolute ν of SN-NEH is higher than that of SP-NEH when the gradient layer 2 and 3 of SN-NEH experience compression deformation earlier. However, as the strain increases, the gradient layer 1 in SP-NEH experiences shrinkage deformation until densification, resulting in significant shrinkage deformation of gradient layers 2 and 3 and an increase in the absolute ν. Therefore, the ν of gradient layer 2 and gradient layer 3 in SP-NEH are higher than those in SN-NEH when the strain exceeds 0.3.
Effect of gradient distribution on energy absorption characteristics
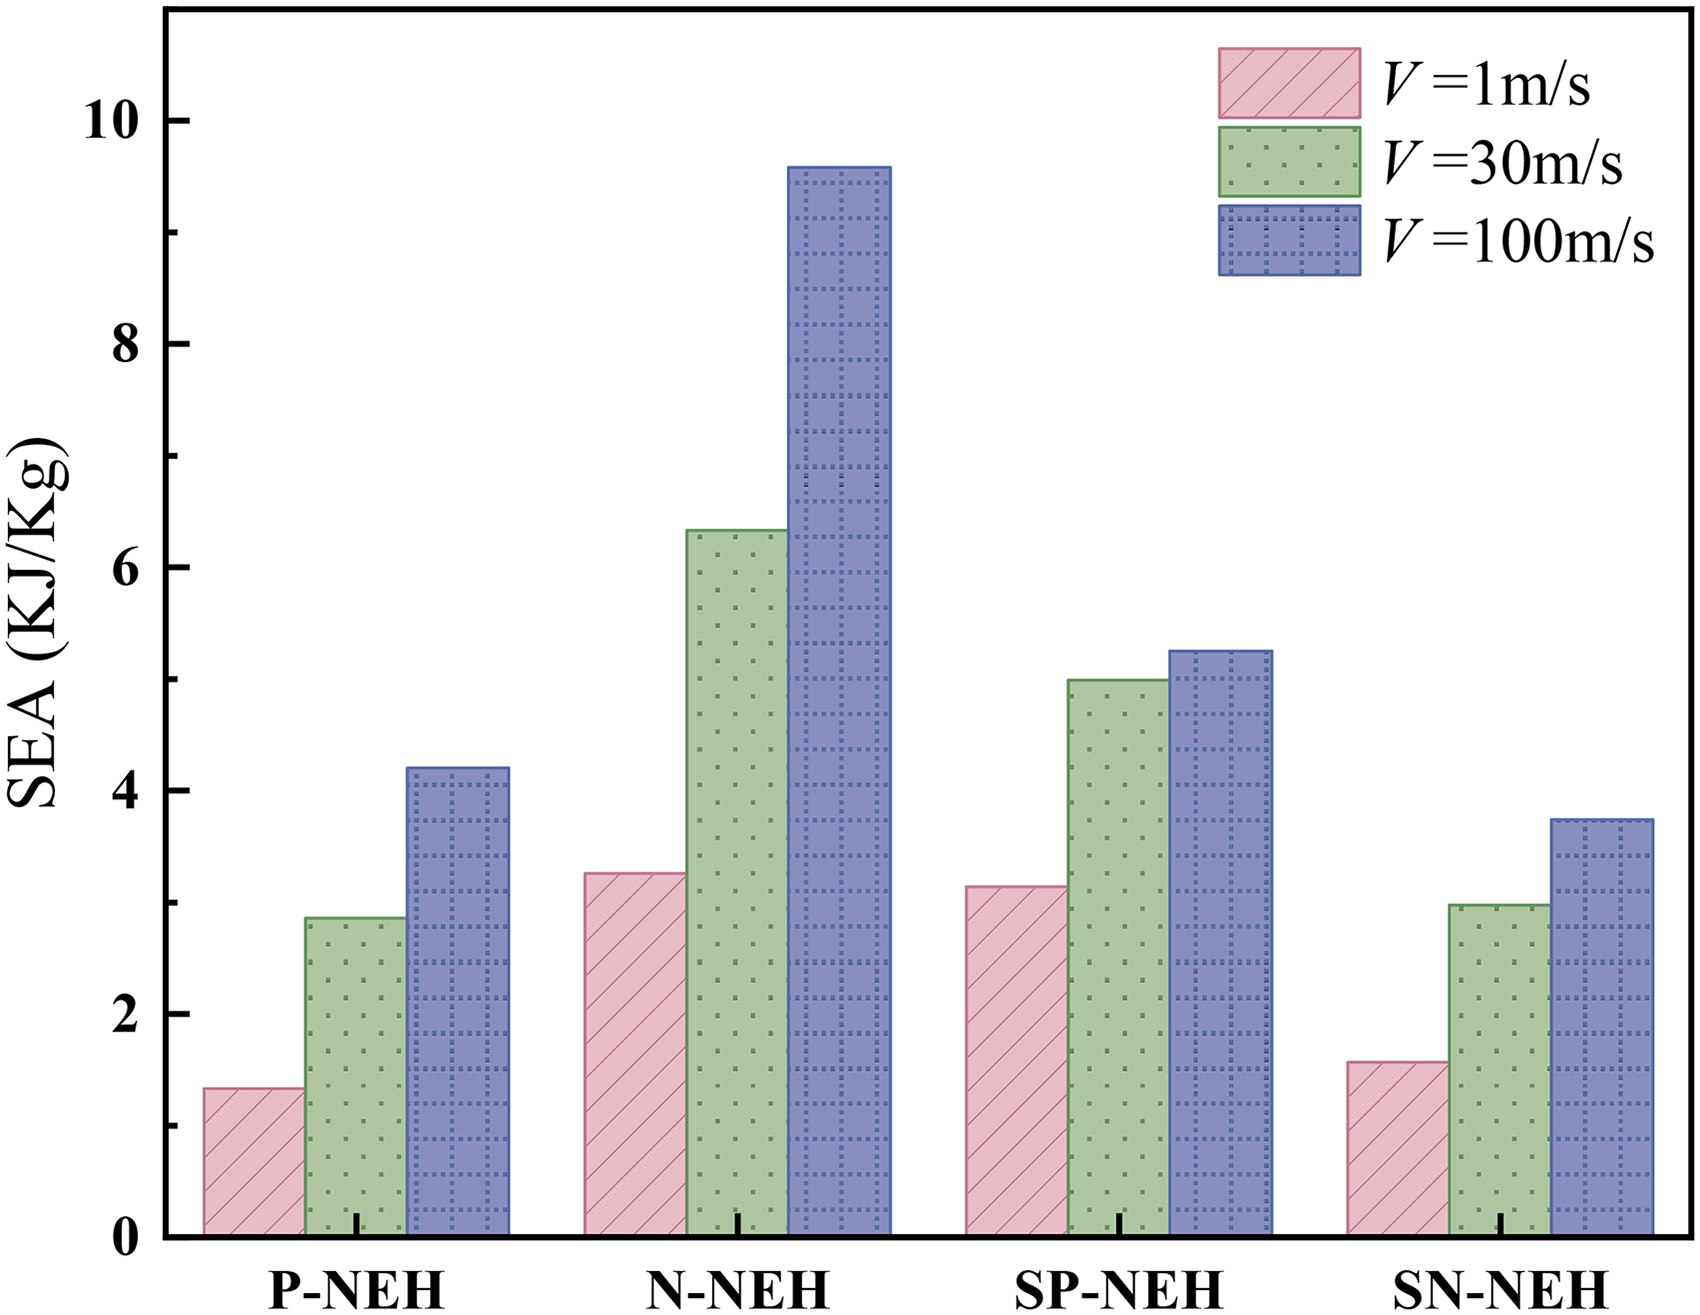
The energy absorption of the thickness gradient NEH during compression is shown in Figure 18. The figure indicates that a greater impact velocity leads to increased energy absorption for a specific honeycomb configuration. For a specific velocity, the energy absorption capacity of N-NEH surpasses that of other gradient distributions. This is due to the thicker cell wall of gradient layer 3 in the N-NEH, which is initially impacted, followed by layer-by-layer transfer, and the interaction between the gradient layers produces a superior energy absorption capacity. However, for the other gradient honeycombs, gradient layer 1 deforms first in the initial deformation stage, but the cell wall thickness is small, so it produces a small compression collapse stress. At the same time, the compressive deformation of the honeycomb is transmitted layer by layer, and it is only after the collapse of the previous gradient layer that it is transmitted to the next gradient layer, and the interaction between gradient layers is small. At V = 1 m/s, the SEA of N-NEH is similar to that of SP-NEH but much higher than that of P-NEH and SN-NEH by 148.2% and 108.1%, respectively. At V = 30 m/s, the energy absorption capacity of N-NEH is 124.6%, 28.9%, and 112.9% higher than the other three honeycombs, respectively. At high-speed impact, the SEA of the honeycomb is significantly higher than that under low- to medium-speed impact, which is primarily attributed to the obvious enhancement of the inertia effect, in which the energy absorption ability of N-NEH is extremely outstanding. Therefore, among these four gradient honeycombs, N-NEH has excellent energy absorption ability and impact resistance.
Energy absorption capacity of different gradient NEHs: (a) P-NEH, (b) N-NEH, (c) SP-NEH, (d) SN-NEH.
Conclusions
In this study, based on NEH cells, four-thickness gradient honeycomb structures were constructed by adjusting the wall thicknesses, and he mechanical properties of NEH with varying thickness gradients were analyzed. Firstly, the mechanical properties and energy absorption capacity of NEH and RH were compared using numerical simulation methods at various impact velocities. Subsequently, the deformation collapse modes, dynamic response curves, plateau stresses, Poisson's ratio distributions, and absorption properties of different honeycomb structures (positive gradient, negative gradient, symmetric positive gradient, and symmetric negative gradient) were analyzed under varying impact velocities. In summary, this study comprehensively revealed the mechanical properties of thickness gradient NEH, which provides new design ideas for applying protective structures in ships, automobiles, and other fields. The main research results are as follows:
The mechanical properties and energy absorption capacity of NEH and RH were analyzed through numerical simulation at various impact velocities. The findings revealed that NEH and RH exhibited distinct deformation patterns, with NEH demonstrating more stable and uniform distortion. Furthermore, the honeycomb structure and impact velocity were found to impact the crushing stress of the honeycomb structure significantly. Among them, NEH had a relatively high plateau stress, which resulted in excellent energy absorption capacity. Consequently, NEH demonstrated superior energy absorption capacity at varying impact speeds. The energy absorption capacity of the two honeycomb configurations showed the largest disparity under medium-speed compression, with NEH's capacity being 47.3% higher than that of RSH. Gradient distribution and compression velocity significantly influenced the deformation pattern of the NEH. During low-velocity impacts, the gradient NEH initially compacted in the gradient layer with a smaller cell wall thickness. As the structure compacted, areas with smaller cell wall thickness showed higher densities. Layers with varying wall thicknesses exhibited notable transverse expansion, which gradually diminished with increasing impact velocity. The distortion pattern was heavily influenced by the gradient distribution in the medium-velocity impact, with distinct gradient NEHs displaying varying deformation patterns. In cases of high-velocity impact, the localized distortion zone was primarily focused on the striking side and progressively extended towards the fixed side as the impact progressed, with the effect of gradient distribution on the distortion pattern diminishing. The gradient distribution and impact velocity significantly influenced the dynamic response curves of the NEH. At low and medium impact speeds, the trends of the four thickness gradients of NEH were similar, but the crushing stresses of SP-NEH and N-NEH were higher compared to P-NEH and SN-NEH. Therefore, SP-NEH and N-NEH exhibited superior impact resistance compared to the other two NEHs. However, inertia significantly influenced the high-speed impact, causing stress-strain curves to fluctuate more dramatically. Specifically, the stress during the plateau stage of N-NEH exceeded that of SP-NEH, indicating that N-NEH overall possessed better impact resistance. The platform stress rose with the velocity increment. The variance in platform stress among various thickness gradient distributions was minimal, yet the platform stress of N-NEH stood out as the highest, suggesting that N-NEH could significantly enhance the energy absorption capability of honeycomb. As a result, at low-speed impact, the SEA of N-NEH was similar to that of SP-NEH but significantly higher than that of P-NEH and SN-NEH by 148.2% and 108.1%, respectively. At medium- and high-speed impacts, N-NEH's energy absorption capacity was 124.6%, 28.9%, and 112.9% higher than the other three honeycombs, respectively. At high-speed impact, the SEA of NEH was much higher than at low and medium-speed impacts, with N-NEH's energy absorption capacity being exceptionally outstanding.
Footnotes
Author contribution(s)
Declaration of conflicting interests
The authors declared no potential conflicts of interest with respect to the research, authorship, and/or publication of this article.
Funding
The authors disclosed receipt of the following financial support for the research, authorship, and/or publication of this article: Qiang He is supported by The Chinese Postdoctoral Science Foundation (grant number 2022M712932) and the Natural Science Fundamental Research Project of Jiangsu Universities (grant number 22KJA460003). Rui Qiu is supported by the Opening Foundation of Anhui Key Laboratory of New Energy Automobile Lightweight Technology (grant number CNE2022-X-FW-00233). Junlan Guo is supported by Postgraduate Research & Practice Innovation Program of Jiangsu Province (grant number KYCX24-4079). The authors would like to express their thanks.
Consent to participate
All authors have read and agreed to the published version of the manuscript.
Consent for publication
All authors have read and agreed to the published version of the manuscript.