
Abstract
High-entropy Mn-based damping alloys, such as MnCuNiFeZnAl with a mixing entropy of 9.39 Jmol−1K−1, are promising for high-temperature use. In-situ XRD shows oxidation starts at 673 K, forming MnO, ZnO, and CuO, followed by Mn3O4 and Mn2O3. The alloy demonstrates enhanced antioxidation performance due to a continuous Al2O3 film near the oxidation film/matrix interface but is prone to oxide scale detachment at high temperatures. Splitting of MnO diffraction peaks arises from Mn2O3/Mn3O4 redox reactions or replacement of MeO (Zn, Cu, Ni, Fe) by Mn.
Introduction
Mn-Cu based damping alloys have attracted much attention because of their excellent vibration and noise reduction performance. It has been pointed out that the damping capacity of the alloys mainly comes from the migration of {101} twin boundary or phase interface movement during the process of face-centered cubic (fcc) to face-centered tetragonal (fct) phase transformation, 1 and the service temperature can be tuned to keep high damping in a wide temperature range from 150 K to 380 K by adjusting the microstructure through varied heat treatment. 2 Traditional vibration and noise reduction methods include system damping and structural damping, such as sound absorption, sound insulation treatment, vibration isolation, and damping vibration reduction. However, these methods make the entire system cumbersome and bulky, and sometimes, they fail to provide a solution under high-temperature conditions. In order to cater for the demand for vibration and noise control of mechanical parts at high-temperature service conditions in the fast-developing modern industry, high-entropy Mn-based MnCuNiFe damping alloy with doping of Zn has been developed with excellent damping performance at temperatures higher than 673 K, 3 in which experiment of the in-situ X-ray diffraction (XRD), however, it is found the alloy is susceptible to oxidation.
Mn-based alloys are easily oxidized at high temperatures, 4 as Mn is a special 3d-series element with large atomic radius and varied oxidation valence of +2, + 3, + 4, + 6, and +7, and the diameter of manganese ions decreases with the increase of valence after oxidation in comparison with the metal atoms. 5 It has been found that in the oxidation process of MnCuNiFe alloy at temperatures from 800 °C∼1000 °C, 6 the alloying elements react with oxygen in the order of Mn, Fe, Ni and Cu, and MnO is formed preferentially to Mn3O4, FeO, NiO and Cu2O from the point of thermodynamics. Furthermore, the displacement reactions of the oxides Cu2O, NiO and FeO with Mn element has been verified to occur by thermodynamic calculations, and interestingly, once Mn3O4 is formed in the outer layer, it can be reduced to MnO by the Mn atom diffused from the metal matrix. Of these oxides, at ambient conditions MnO is of fcc structure, 7 while Mn3O4 is a unique mixed-valence oxide that shows a tetragonal distorted spinel structure. 8 The complex oxidation behaviour will seriously affect the service life of damping alloy parts at high temperature environments.
It is known that the entropy of mixing dependence of a solid solution containing n elements follows
9
:
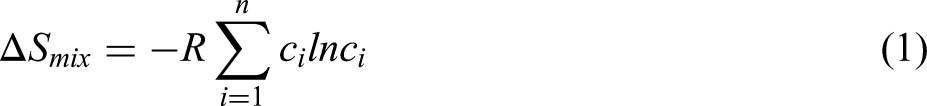
Materials with multi-principal elements, unlike traditional alloys featuring one or two key alloying elements, are also called high entropy alloys (HEAs) for higher mixed entropy. 10 The damping capacity has been explored in HEAs prepared by casting method,11–13 or by mechanical alloying and spark plasma sintering.14,15 It has been found the peak of internal friction (IF) of Fe65−xMn20Cr15Cox (x = 0, 5, 10, 15) HEAs increased monotonously as the configurational entropy was increased from 0.88R to 1.23R. 15 As for AlxCrFeNi (x = 0.3, 0.35, 0.37, 0.4, 0.5) alloy system, it is revealed that the phase constituent changes gradually from fcc dominated structure to a single body-centered cubic (bcc) structure when x increases from 0.3 to 0.5 while the Al0.37CrFeNi shows the maximum damping capacity of 0.07093 at the strain amplitude of 1.5 × 10⁻⁴. 11 For all the AlxCoCrFeNi (x = 0, 0.25, 0.5, 0.75, and 1) alloy investigated, the IF value increases very gradually at lower temperatures, and then starts to increase very rapidly at temperatures higher than 698 K, which is attributed by the structural relaxations under the applied periodic stress. 12
Al is an economical alloying element in HEAs with the specific characteristic of the atomic diameter of 2.86 Å and valence electron concentration (VEC) of 3. Most importantly, alloying Al in metals might improve the antioxidation performance because of formation of Al2O3 under oxidation atmosphere. 16 Accordingly, the MnCuNiFeZnAl alloy was prepared by doping Al in MnCuNiFeZn alloy, and the entropy of mixing was elevated to 9.39 Jmol−1K−1 from 8.62 Jmol−1K−1 with the consideration of keeping high-temperature damping capacity as well as structural stability. It can be seen MnCuNiFeZnAl alloy show much higher configurational entropy than that commonly used M2052 alloy with the value of 6.48 Jmol−1K−1.
In order to clarify the high-temperature oxidation behaviour of high-entropy MnCuNiFeZnAl damping alloys, oxidation experiments were carried out to study the growth characteristic of the oxide film and to reveal the oxidation mechanism of the damping alloy at high temperatures.
Experimental procedure
The Mn-based alloy ingot with the composition of Mn-15Cu-10Ni-4Fe-5Zn-1Al wt% was prepared by induction melting of manganese (99.9 wt%), copper (99.9 wt%), industrial pure iron and nickel under argon atmosphere, according to Equation 1, the entropy of mixing is 9.39 Jmol−1K−1. The ingot with the diameter of 90 mm was forged and then rolled into a plate of 20 mm thickness. The specimens for oxidation with the dimension of 10 × 10 × 10 mm was spark cut from the plate, and then ground up to 1200 grit SiC abrasive paper followed by ultrasonically cleaning in ethanol and acetone. Since the oxide scale of the Mn-based alloy is prone to fall off at high temperatures after holding even for 10 min, 6 the specimens were put into corundum crucible for oxidation in order to prevent the measurement error caused by the drop of oxide from the specimens. After recording the weight of individual specimen and the corresponding crucible, the specimens were subjected to high-temperature oxidation tests at temperatures from 873 K to 1273 K with the holding time from 0.5 h to 6 h by using a muffle furnace, and then the mass change after oxidation was determined for each crucible containing the specimen. BrukerTM D8 Discover X-ray diffraction (XRD) was used to identify the phase constituents of the oxide film by using Cu Kα with a scanning speed of 3 °/min, operated at tube voltage of 40 kV and a current of 40 mA. Due to severe detachment of the oxide scale at 1273 K, the phase structure of the test was also determined by taking the detached oxide and the substrate with residual oxide film, respectively. The in-situ XRD was performed by employing the Rigaku Smart Lab X-ray diffractometer without gas protection during the experiment. The scanning rate for high-temperature phase analysis was 10°/min, and a finely focused 9 kW rotating target X-ray generator was used. A Quanta450 scanning electron microscope (SEM) equipped with an energy spectrometer (EDS) was used to observe the surface morphology of the specimens and to analyze the composition distribution of the matrix and the oxide layer.
Results and discussions
Oxidation kinetics
Figure 1 shows the relationship between mass gain and holding time at different oxidation temperatures. With the increase of holding time, the mass gain dependence of square root of holding time all show a linear growth trend for all the specimens under different oxidation temperatures. Oxidation at lower temperatures (873K、1073 K), the mass gain of the oxidized specimen is very low, and the value at 873 K holding for 6 h is only 4.15 g/m2, while that at 1073 K holding for 6 h is 37.64 g/m2, respectively. The mass gains are much faster for specimens oxidized at higher temperatures of 1173 K to 1273 K. The mass gain significantly increases to 147.75 g/m2 for specimen holding at 1173 K for 6 h, and further elevates to 187.44 g/m2 for that at 1273 K for 6 h. It can be seen that the corresponding fitting equation is
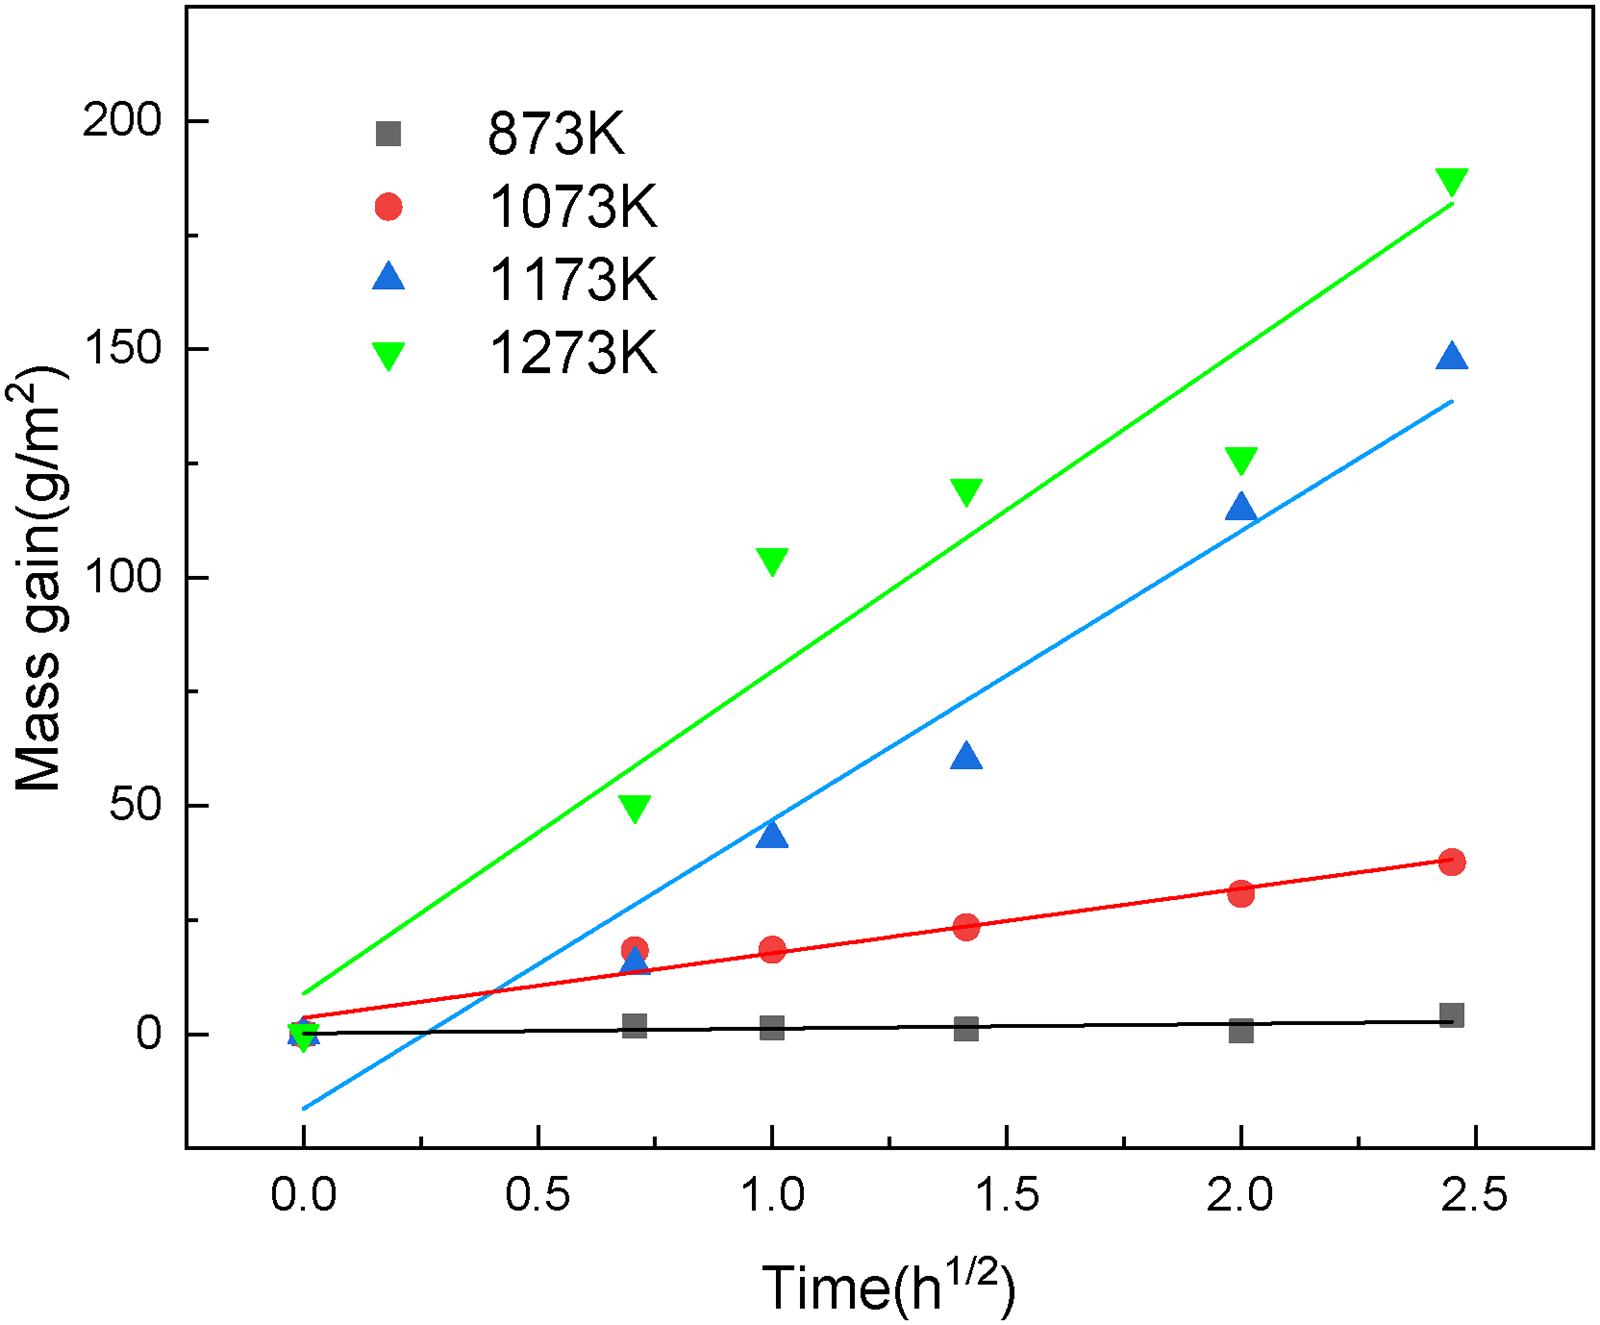
Mass gain dependence of holding time at different temperatures.
XRD analysis
Figure 2 shows the in-situ XRD patterns of specimens heated to different temperatures. It can be seen that the alloy at room temperature consists of a single γ-Mn phase. When the specimen is heated to 673 K, oxidation starts with the appearance of the diffraction peaks of fcc structured MnO, wurtzite structured ZnO and monoclinic tenorite structured CuO.
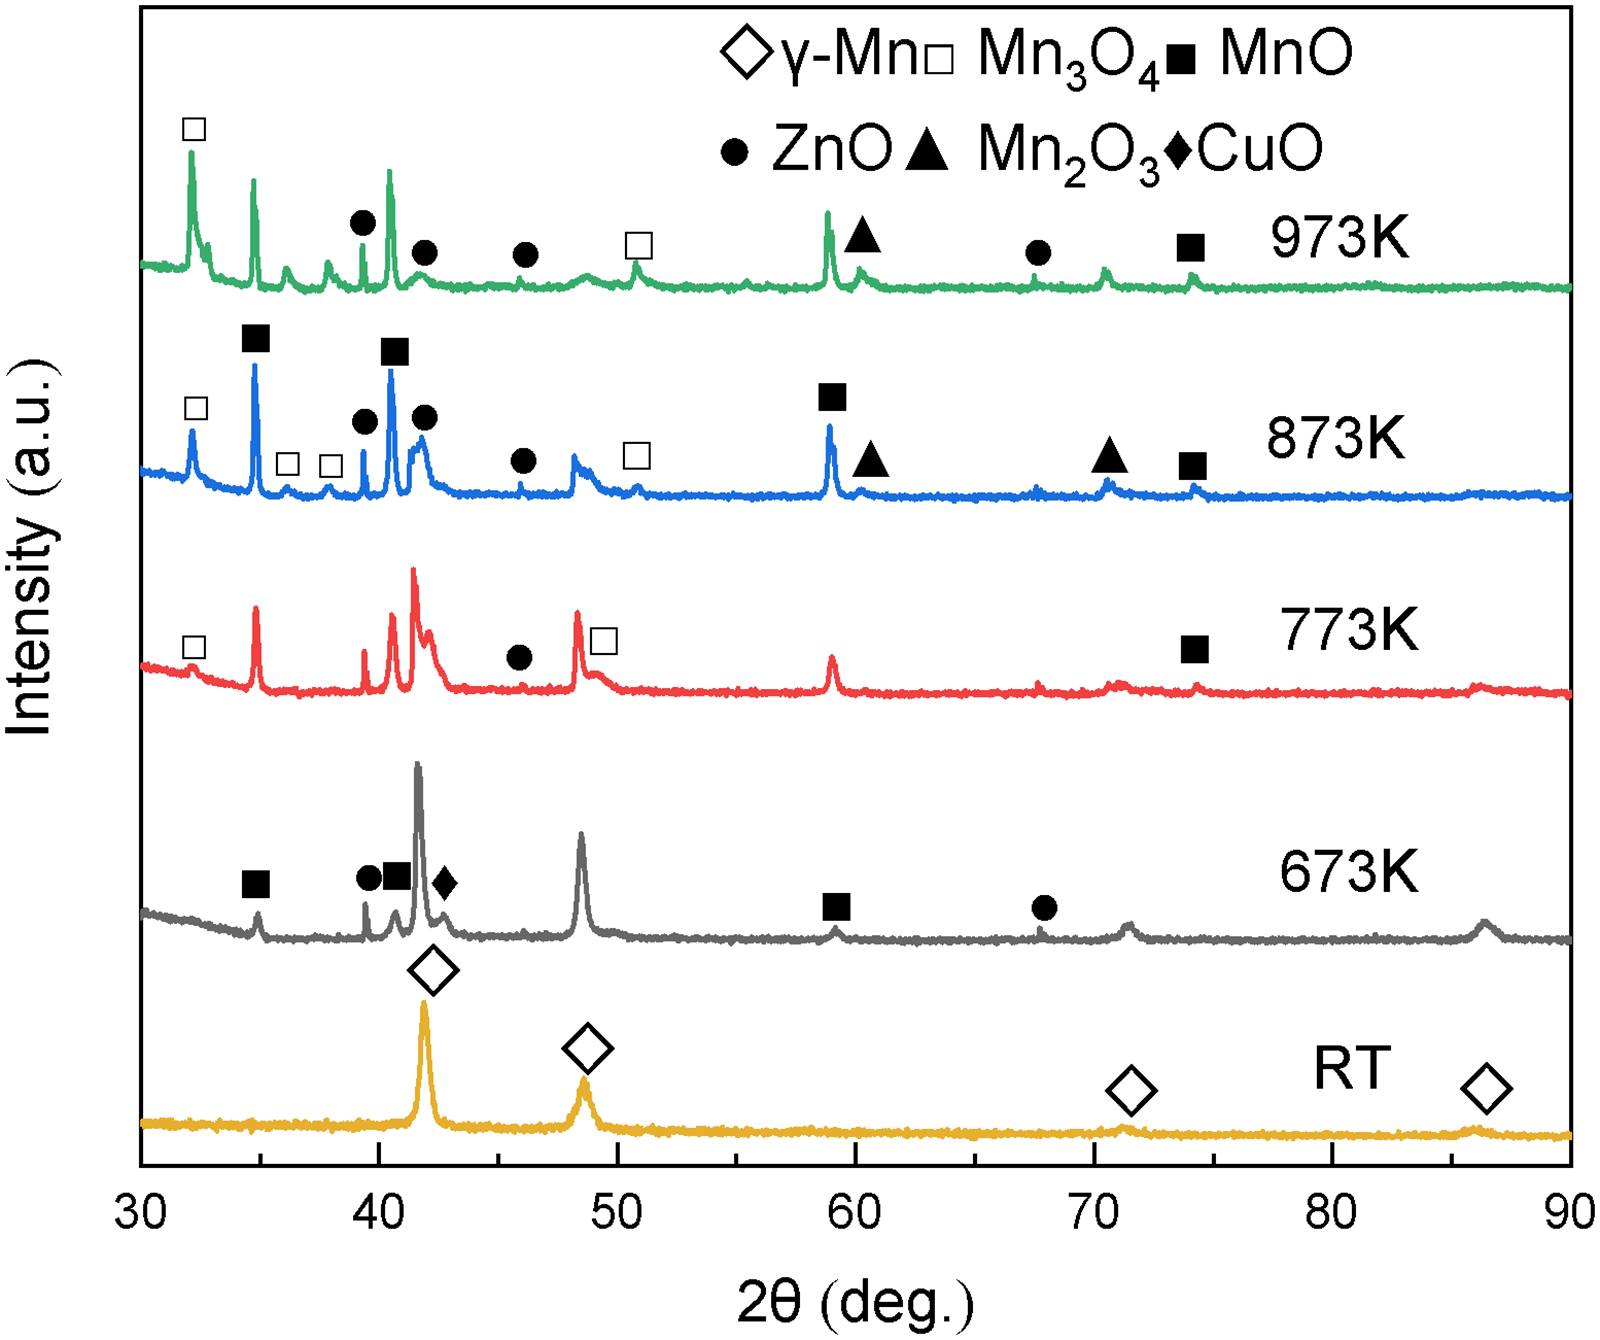
In-situ XRD spectra of MnCuNiFeZnAl alloy specimens heated to elevated temperatures.
As the temperature is increased to 773 K, the spinel Mn3O4 phase begins to appear on the surface of the specimen accompanied by obviously heightening of the MnO peak and gradually weakening of γ-Mn matrix phase peak, indicating the growth of oxide film and the formation of the mainly MnO oxidation substance. As the temperature increases to 873 K, the MnO diffraction peak becomes the predominant one, and the Mn3O4 peak is also relatively strengthened. Meanwhile, the CuO peak disappears while the Mn2O3 phase appears in the first time. It is obvious that the main constituents of the oxide are of the MnO phase with a certain amount of Mn3O4, ZnO and some Mn2O3 phase at this temperature. As the temperature comes to 973 K, the diffraction peaks for MnO and Mn3O4 are comparably strong, indicating that the Mn3O4 film begins to form in the outer oxide layer. Then, the surface of the specimen has been completely covered by a layer of oxide film, and the matrix phase cannot be detected any more.
Figure 3 shows the XRD spectra of MnCuNiFeZnAl specimens holding at 873 K and 1273 K for 6 h, respectively. It can be seen that after isothermal oxidation at 873 K for 6 h, the surface oxide of the specimen is mainly composed of MnO, and some Mn3O4 and CuO. The detached oxide scale from the specimen isothermal oxidation at 1273 K for 6 h also consists of MnO and Mn3O4, while the constituents of the residual oxide chiefly contain MnO, Mn3O4, as well as Mn2O3 phase remaining on the substrate.
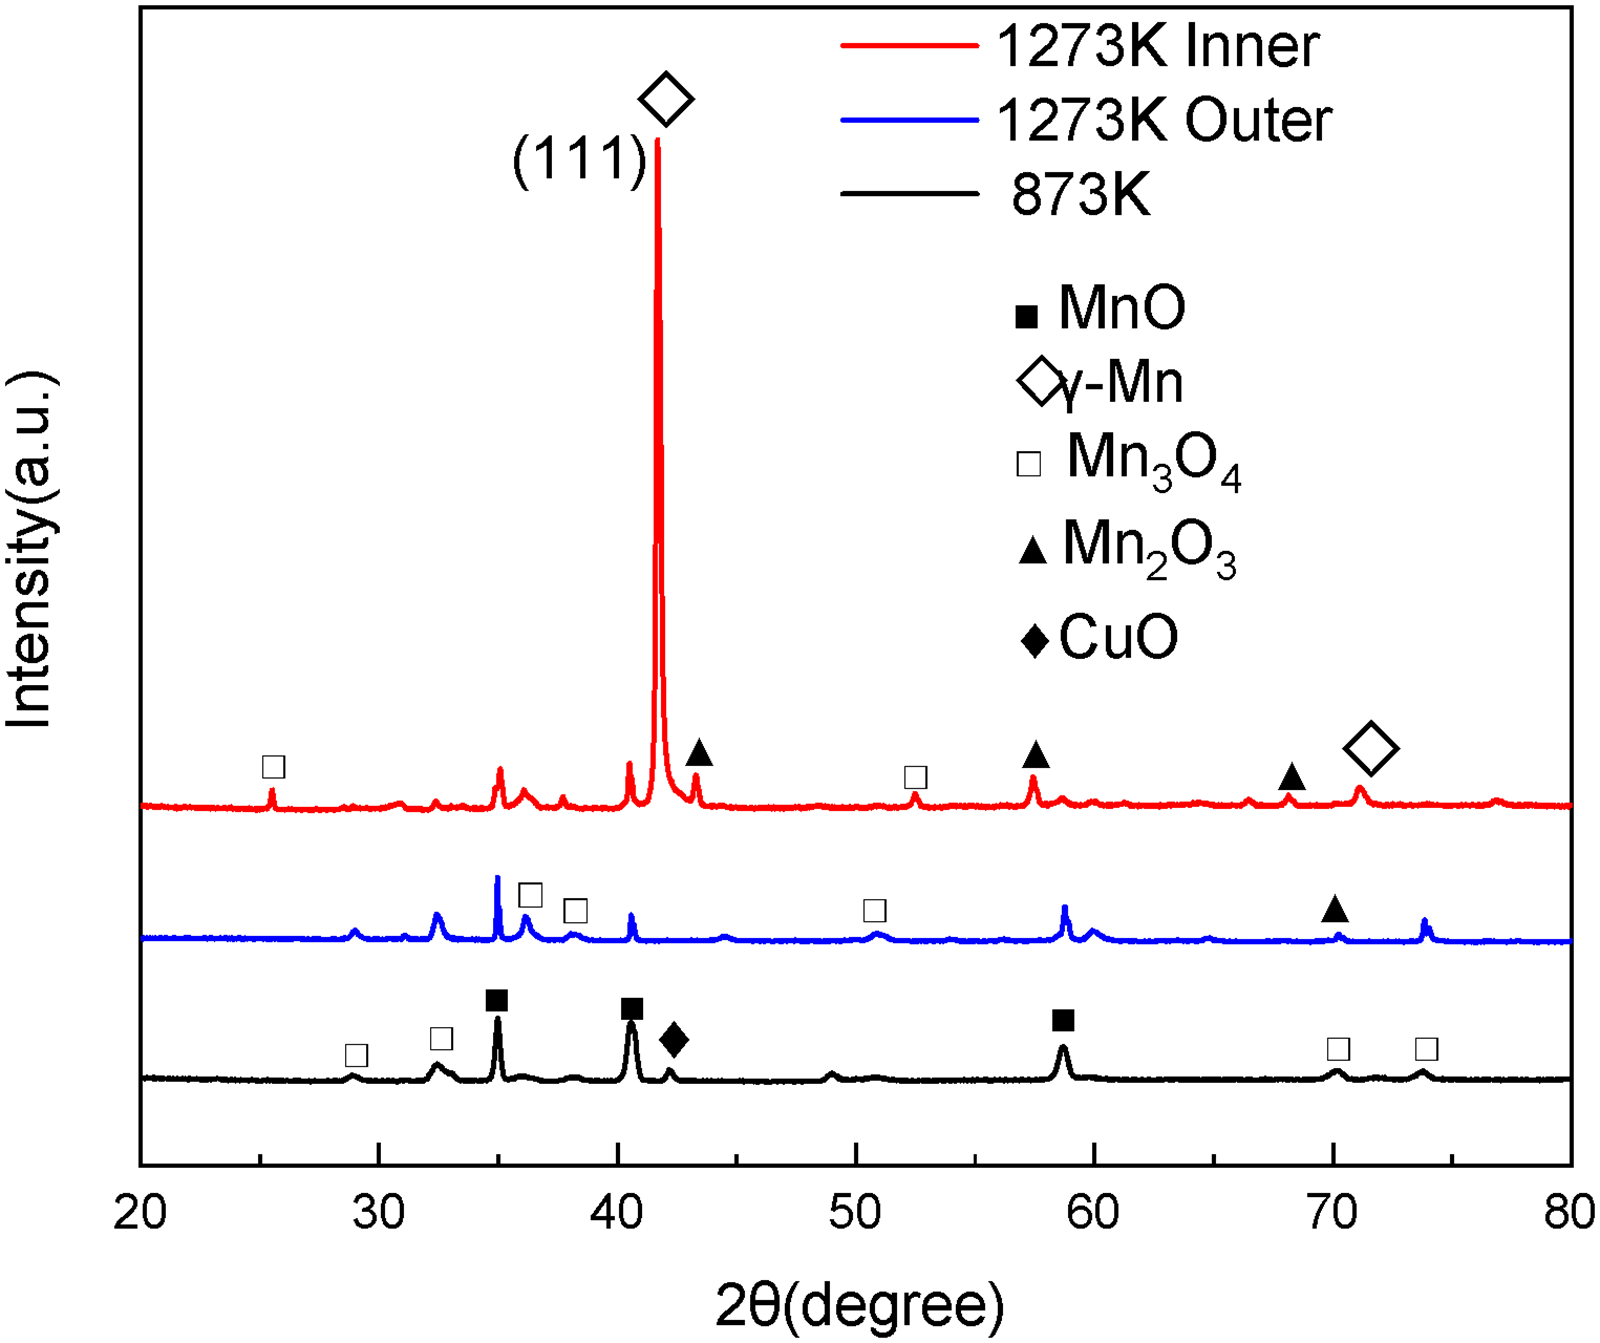
XRD spectra of MnCuNiFeZnAl specimen isothermal oxidation at 600 °C and 1000 °C for 6 h.
Surface morphology observation
Figure 4 shows the surface morphology of the specimens oxidized at different temperatures. As seen in Figure 4(a), the scratches originated from the polishing process by sandpaper can be clearly seen on the surface of the specimen held at 873 K for 0.5 h, indicating that the oxide film formed is very thin, and the enlarged morphology shown by the inset figure reveals that the oxide film consists of flocs and needles, which may be one-dimensional nanowire ZnO crystal exhibiting as an asymmetric wurtzite structure.17,18 As the oxidation time increases to 6 h, scratches still exist while the oxide on the surface of the sample has grown into granular and cubic shape (Figure 4(b)), which corresponds to fcc MnO and spinel Mn3O4 according to Figure 3, respectively. Figure 4(c) shows the surface morphology of specimen isothermal oxidation at 1073 K for 6 h, it can be seen that the surface of the specimen has formed a relatively dense oxide film, of which make up by bulk particles with varied sizes under high magnification. However, multilayered oxide film already exists on the surface of specimen oxidized at 1273 K only for 0.5 h, indicating that severe oxidation has occurred, and the oxide scale has been partially detached from the substrate.
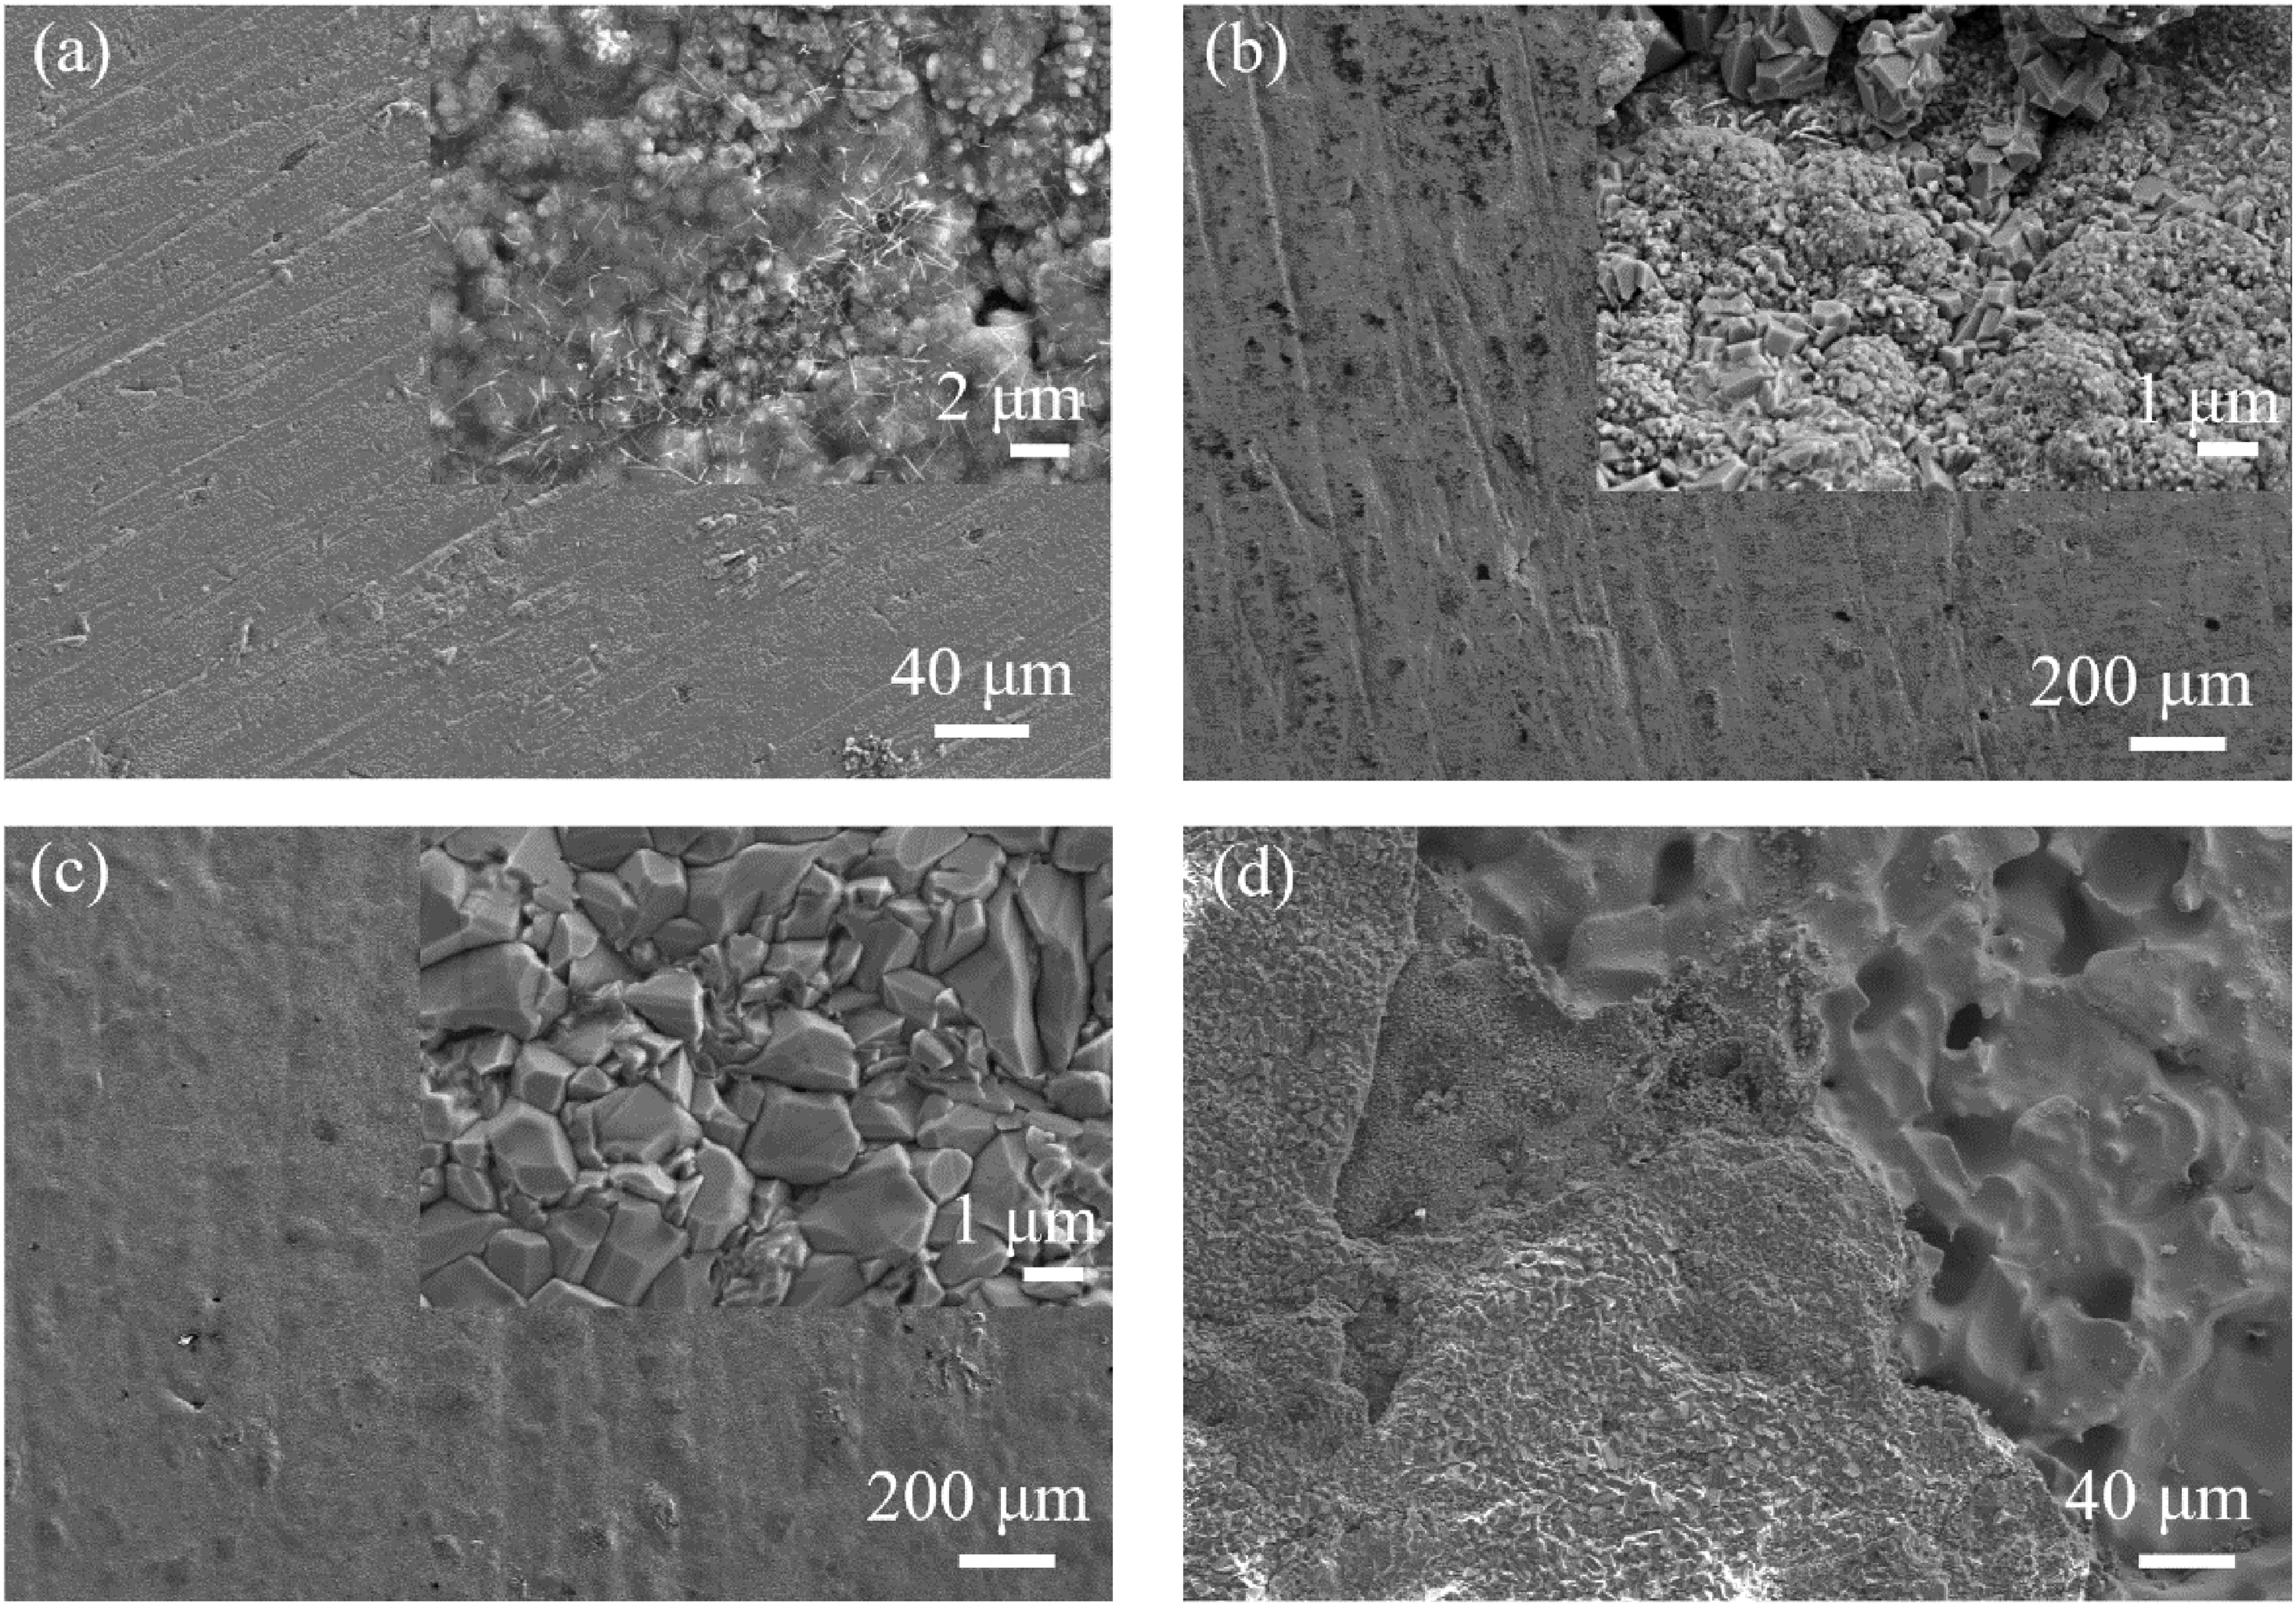
Surface morphology of the samples oxidized at different temperatures, (a) 600 °C for 0.5 h, (b) 600 °C for 6 h, (c) 800 °C for 6 h, (d) 1000 °C for 0.5 h, where the inset is enlarged morphology.
Figure 5 gives the compositional map scan of the oxide film oxidation at 873 K for 0.5 h. It can be seen that the distribution of Mn and O in the surface oxide is relatively uniform, indicating that the surface oxide is mainly of MnO. According to the height variation on the morphology combined with the Zn distribution, it is inferred that the needle like substance on the specimen surface is surely ZnO. It is noted that the enrichment of Cu and Ni also appear on the surface oxide of the specimen, as the CuO and NiO phases are also identified in Figure 2, it is indicated that these oxides may be also generated at the early stage of oxidation.
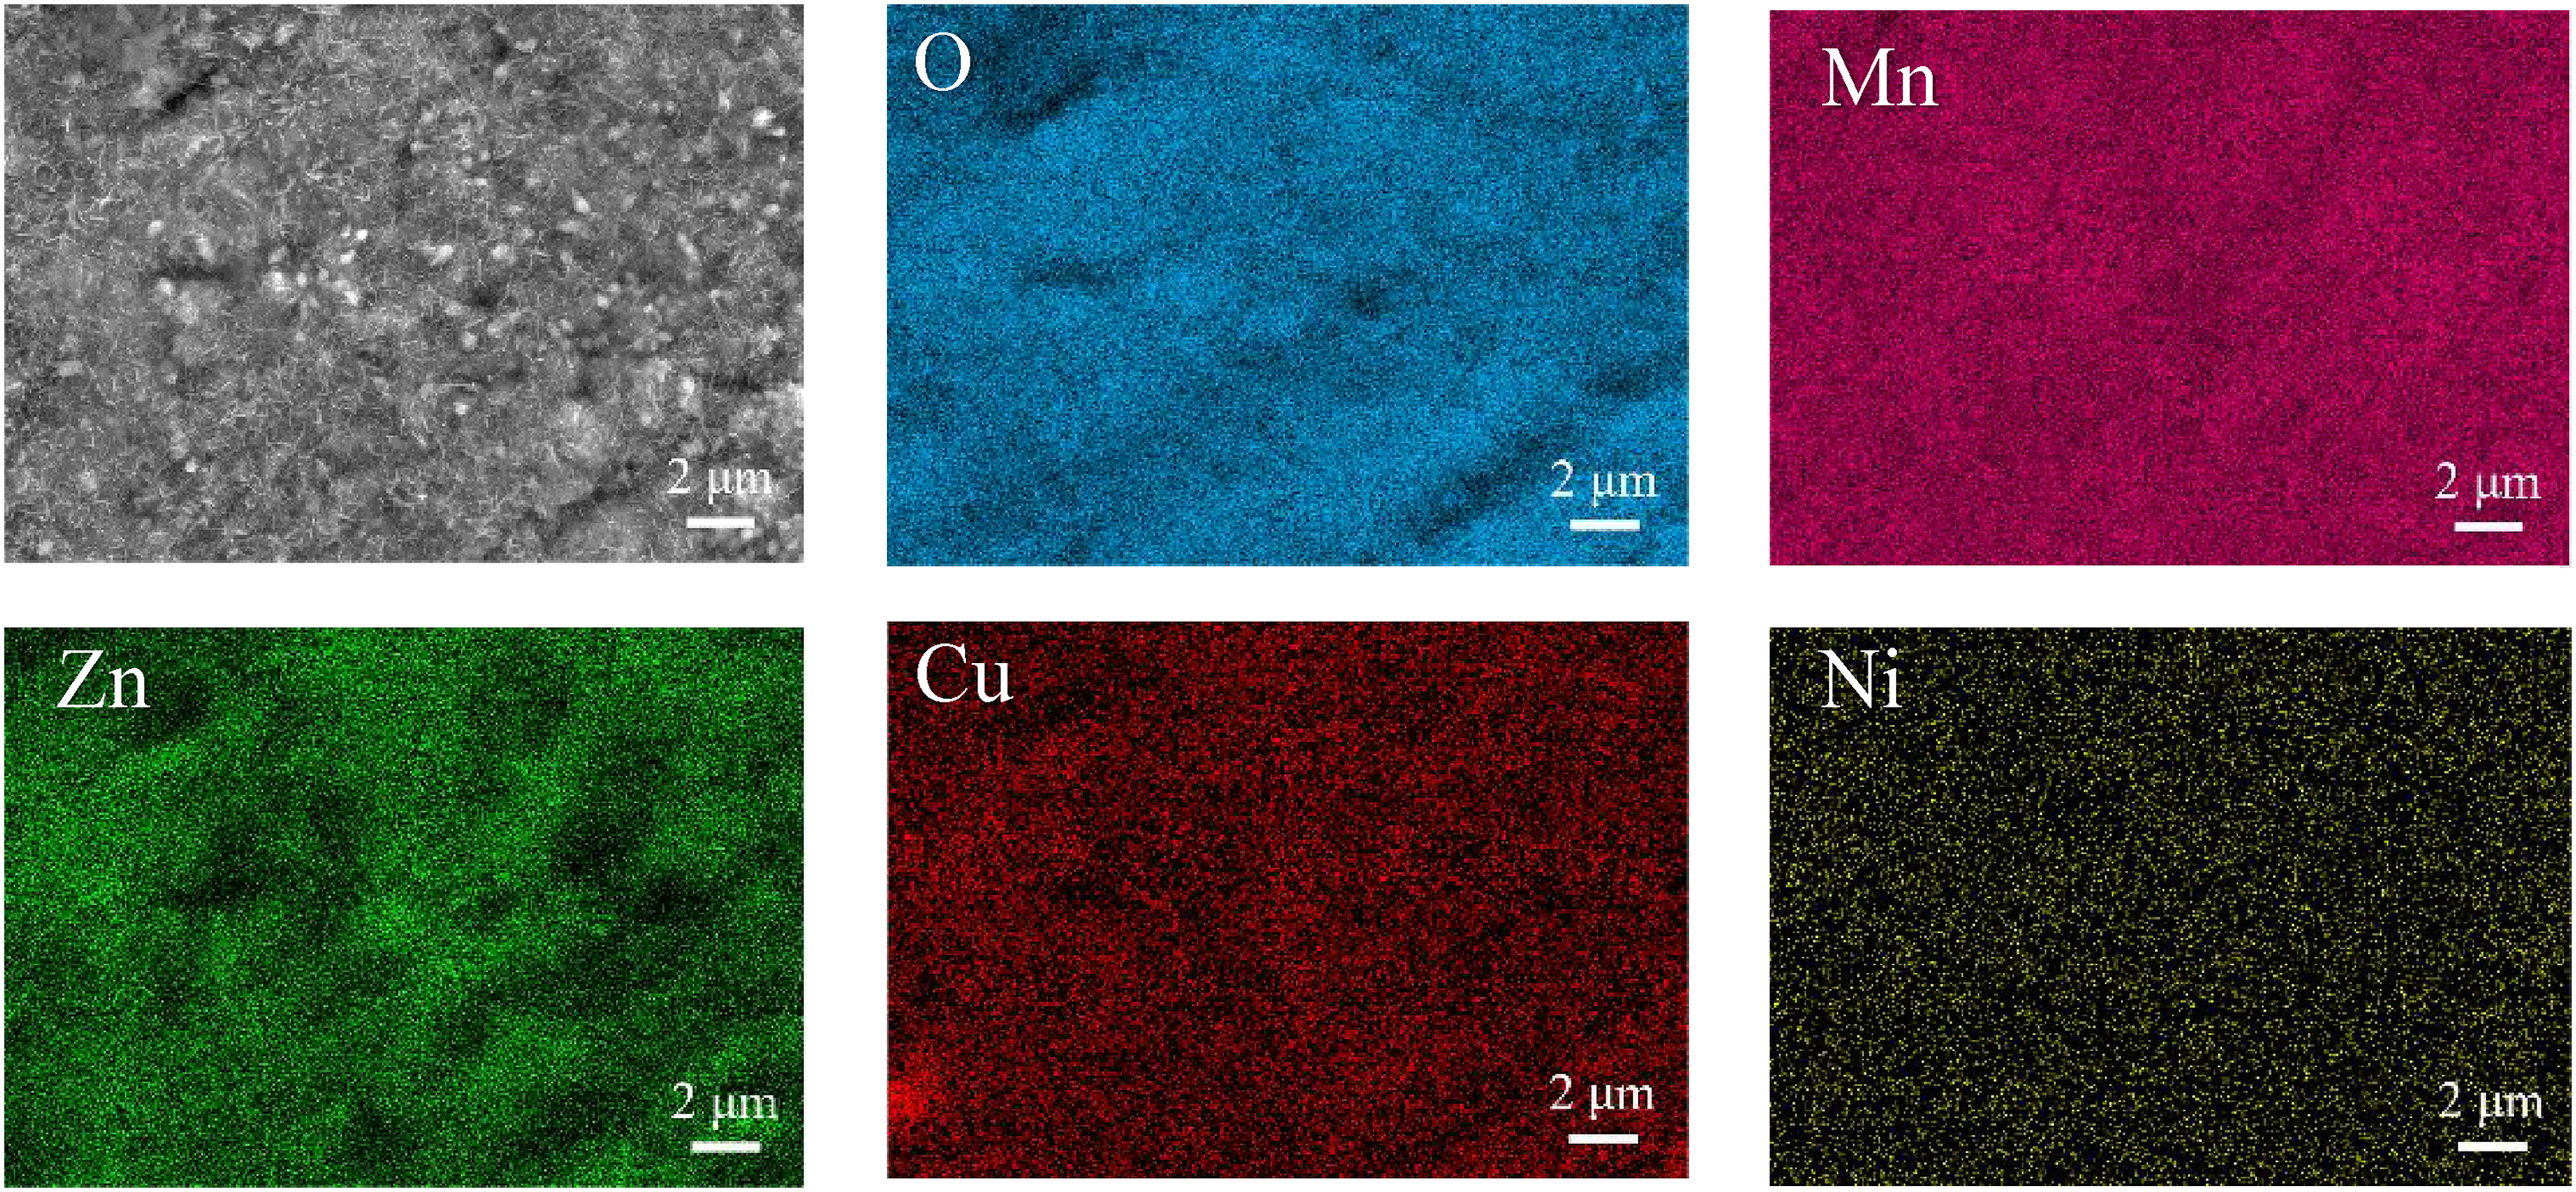
Compositional map scan of specimen oxidation at 600 °C for 0.5 h.
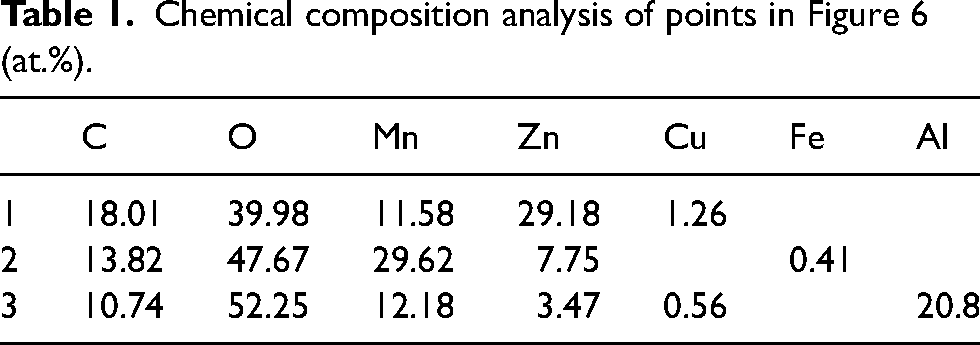
Figure 6 shows the enlarged morphology of specimen oxidation at 1273 K for 0.5 h. It can be seen that massive particles are also formed inside the detachment pit of oxide film (Figure 6(a)), and the rapidly developed massive oxides on the surface mostly have a layered structure, as shown in Figure 6(b). The composition analysis is carried out on typical points, of which results are shown in Table 1. It can be seen that all of them contain a certain amount of Zn, as well as a small amount of Cu or Fe. The bulk oxide contains higher content of Mn in point 1, while the Zn content is much higher in small particles of the oxide in point 2, however, according to the XRD in Figure 3, the oxide should be of Mn3O4 and MnO phases, which suggests that the element Zn occupies the lattice of the two oxides. The white material of point 3 possesses a higher content of O and Al, indicating the domination of Al2O3.
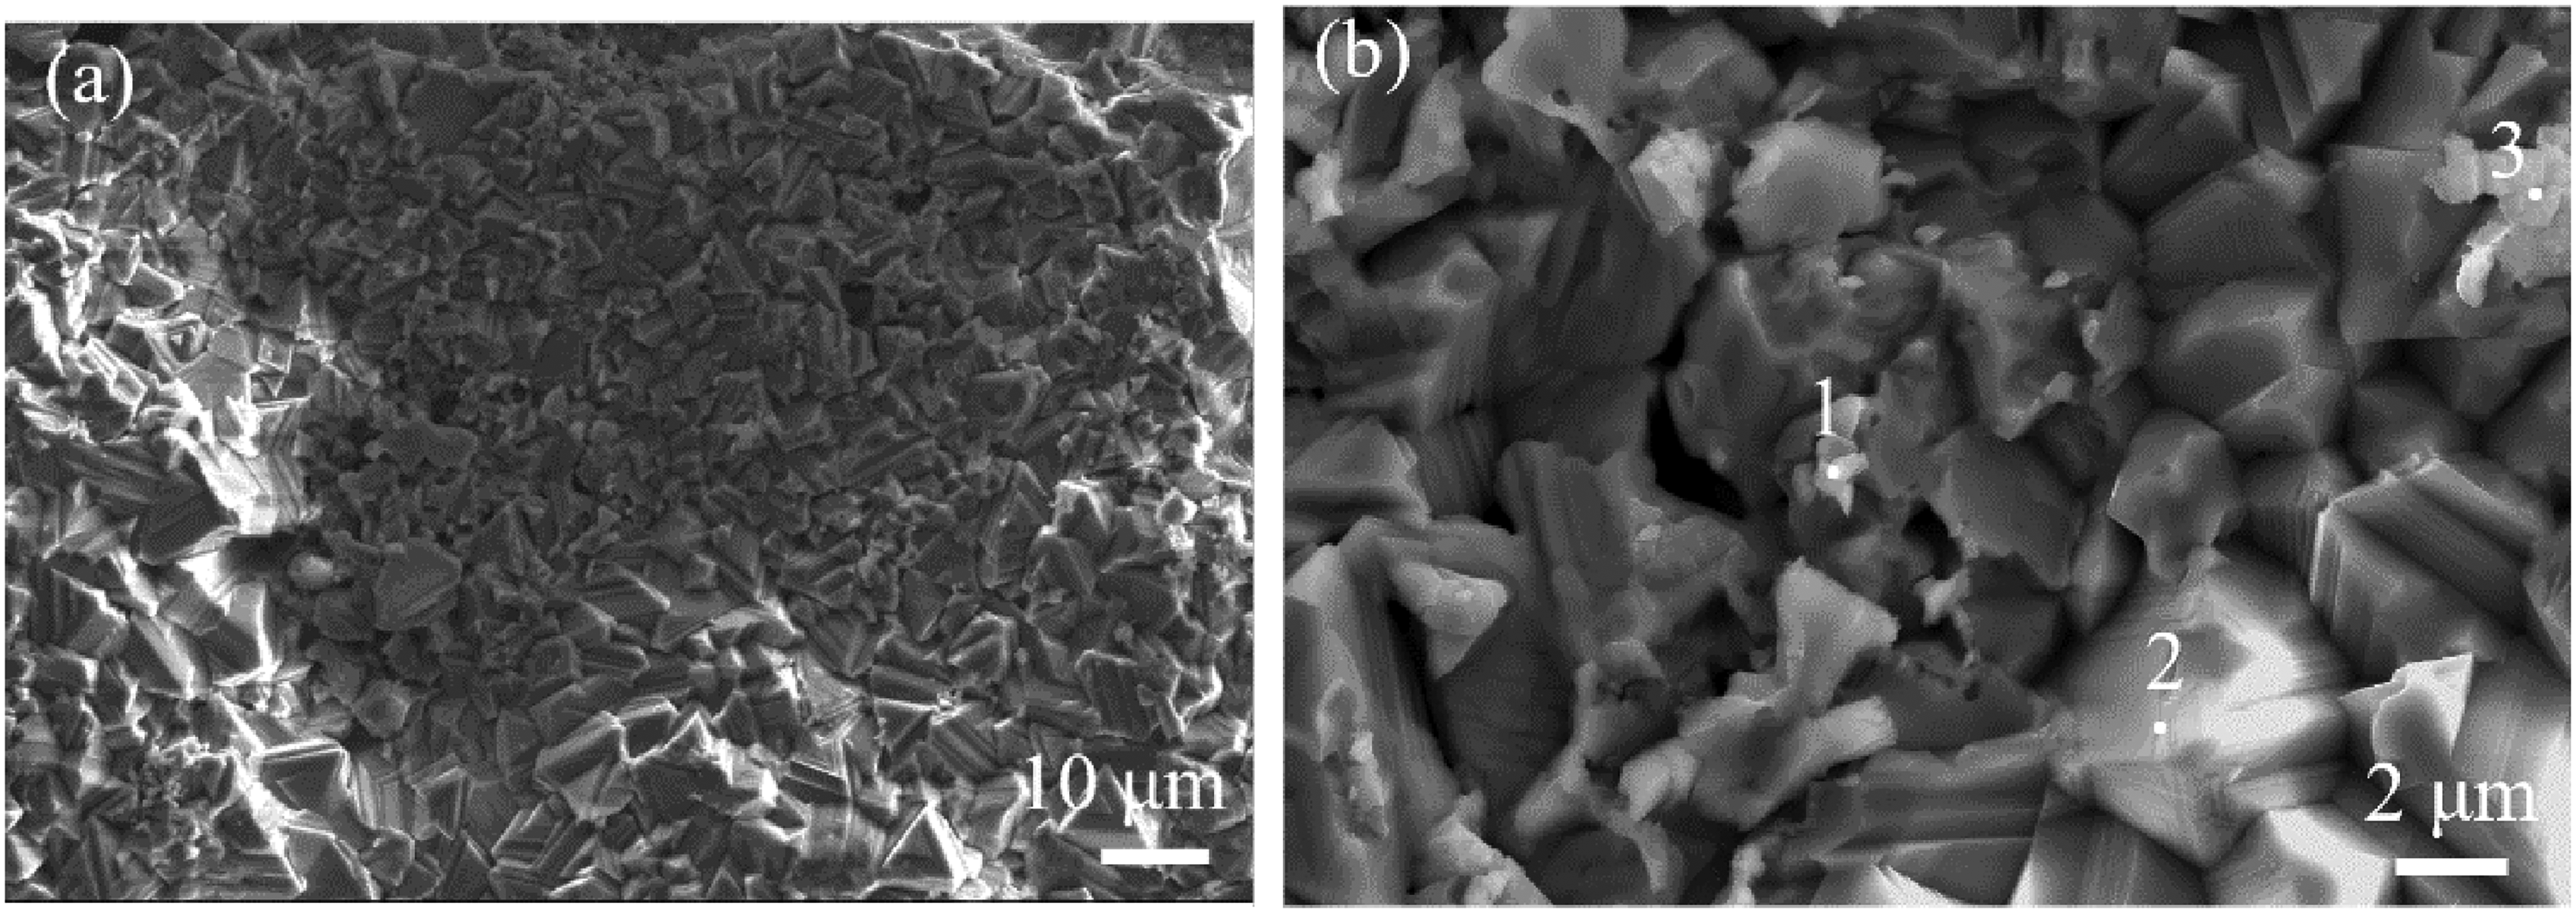
Oxide surface morphology of specimen at 1273 K for 0.5 h, (a) scaling-off pit (b) chemical composition analysis points in the enlarged morphology.
Chemical composition analysis of points in Figure 6 (at.%).
Cross-sectional characterization
The mass gain of the specimens oxidized at 873 K and 1073 K is much lower, and the cross-sectional morphology of the specimen oxidized at 1073 K is shown in Figure 7. It can be seen that although the outermost oxide film has displayed the evidence of delamination and sign of detachment, the surface oxide film is relatively intact. Oxidation has proceeded along the grain boundary near the interface of the oxide film / matrix, as shown by the arrow in Figure 7(a). Figure 7(b) represents the result of the compositional line scan along the dashed line in Figure 7(a). Obvious two layers are characterized by the element distribution of the oxide film, of which outer layer is mainly Mn and O, while the distribution in the inner layer is more complex. From the matrix outward, the content of Mn and O gradually increases, while the distribution of Cu, Ni, Fe, and Zn shows a downward trend. Correspondingly, the trend of alloying elements distribution in the matrix from inside out is just the opposite, Mn content gradually decreases while the contents of Cu, Ni, Fe, and Zn gradually increase to the concentration reaching its maximum at the interface.
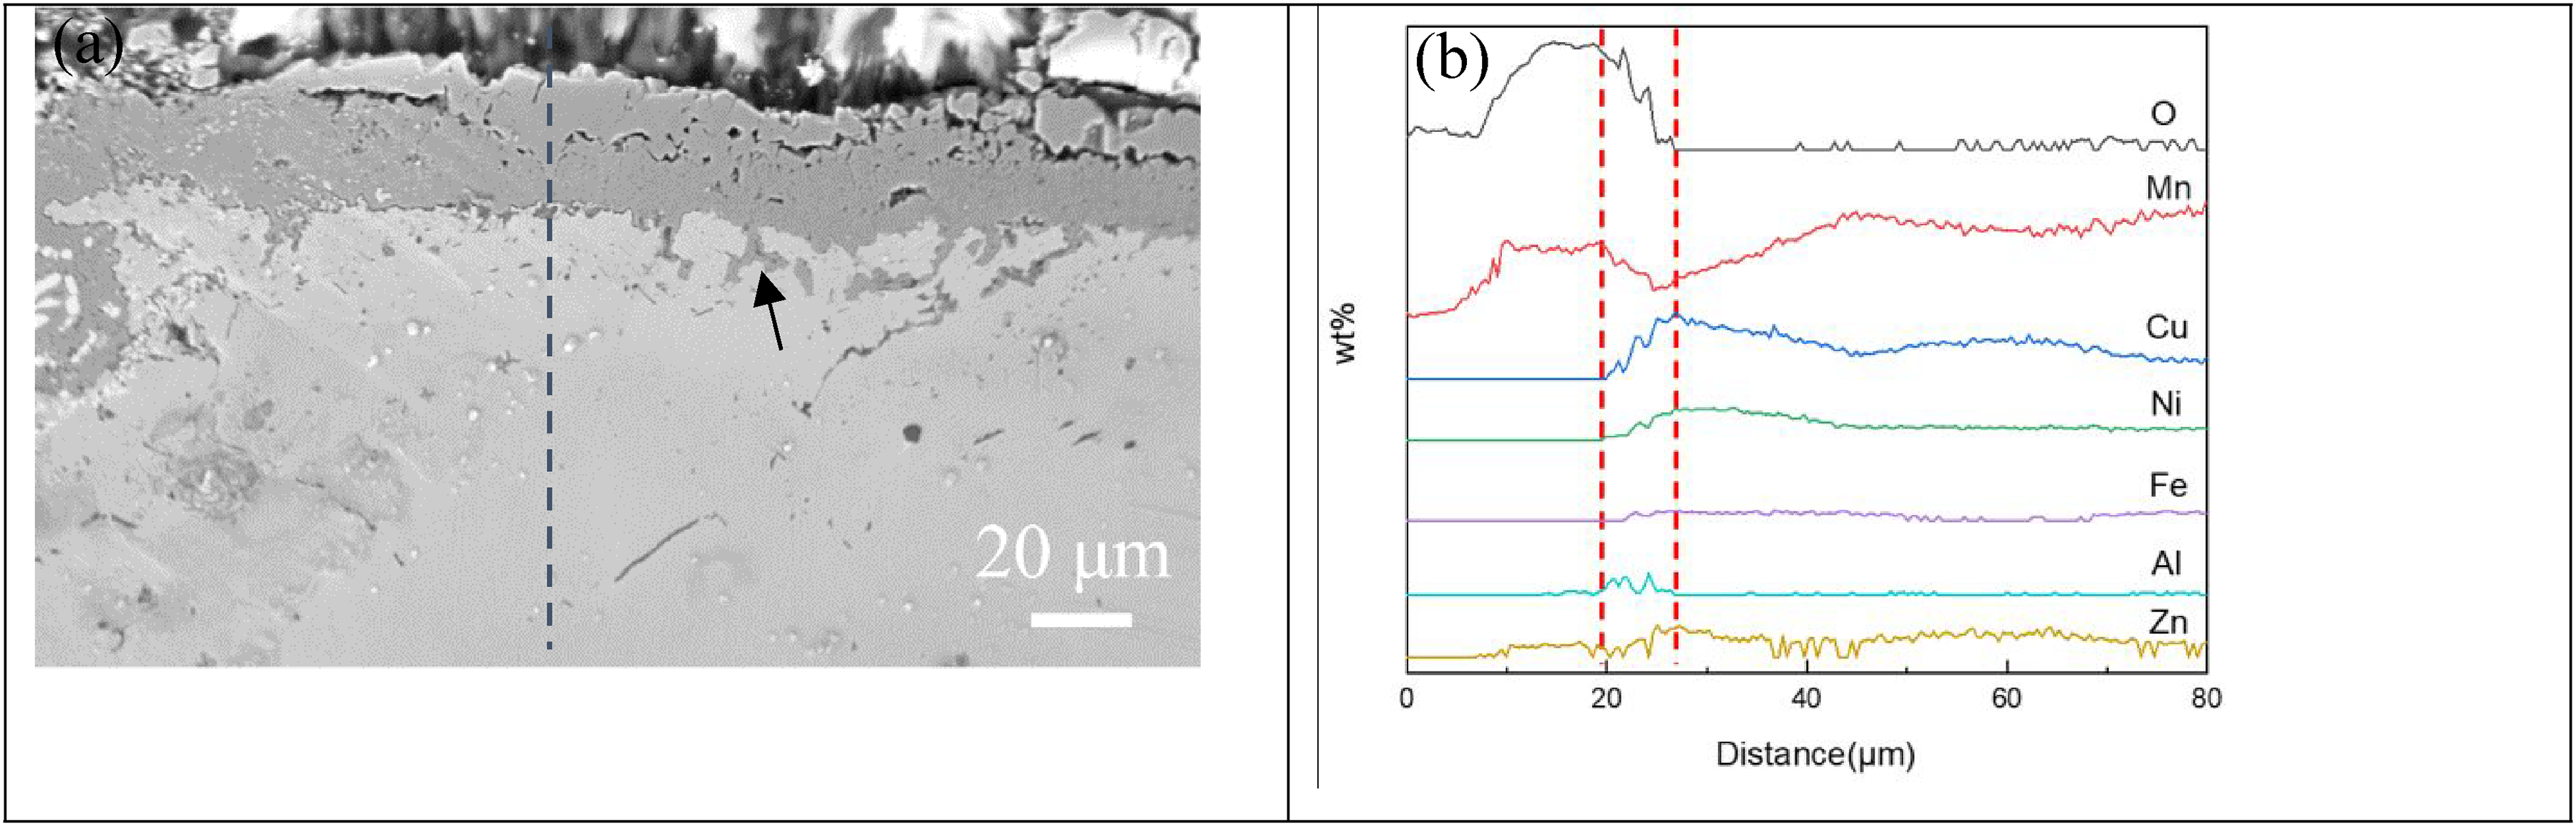
Cross-sectional analysis of specimen oxidation at 1073 K for 6h, (a) cross-sectional microstructure morphology, and (b) line scan of dashed line in (a).
Figure 8 shows the cross-section morphology and the corresponding compositional map scan of the specimen oxidized at 1273 K. It can be seen that the concentration of Mn is higher in the oxide film and lower in the substrate, which has undergone serious internal oxidation. Speculation from the compositional distribution characteristics of Al, the main product of inner oxidation is Al2O3 particles, and has formed a continuous Al2O3 film in the substrate near the interface of the oxidation film / matrix, which will effectively improve the antioxidant performance of the alloy. Interestingly it is found that the distribution characteristics of Cu, Ni, Zn and Fe are the same, and enriched in a band just beyond the Al2O3 layer, as shown in Figure 8 by the dotted line belt, where Mn and O are poor, indicating the occurrence of replacement reactions of CuO, NiO, ZnO, FeO with Mn to produce MnO, as well as the precipitation of Zn, Cu, Ni and Fe in the matrix. The distribution characteristics of Fe are opposite to that of Mn, and it is also distributed in the oxide film, but the concentration in the matrix is relatively high.
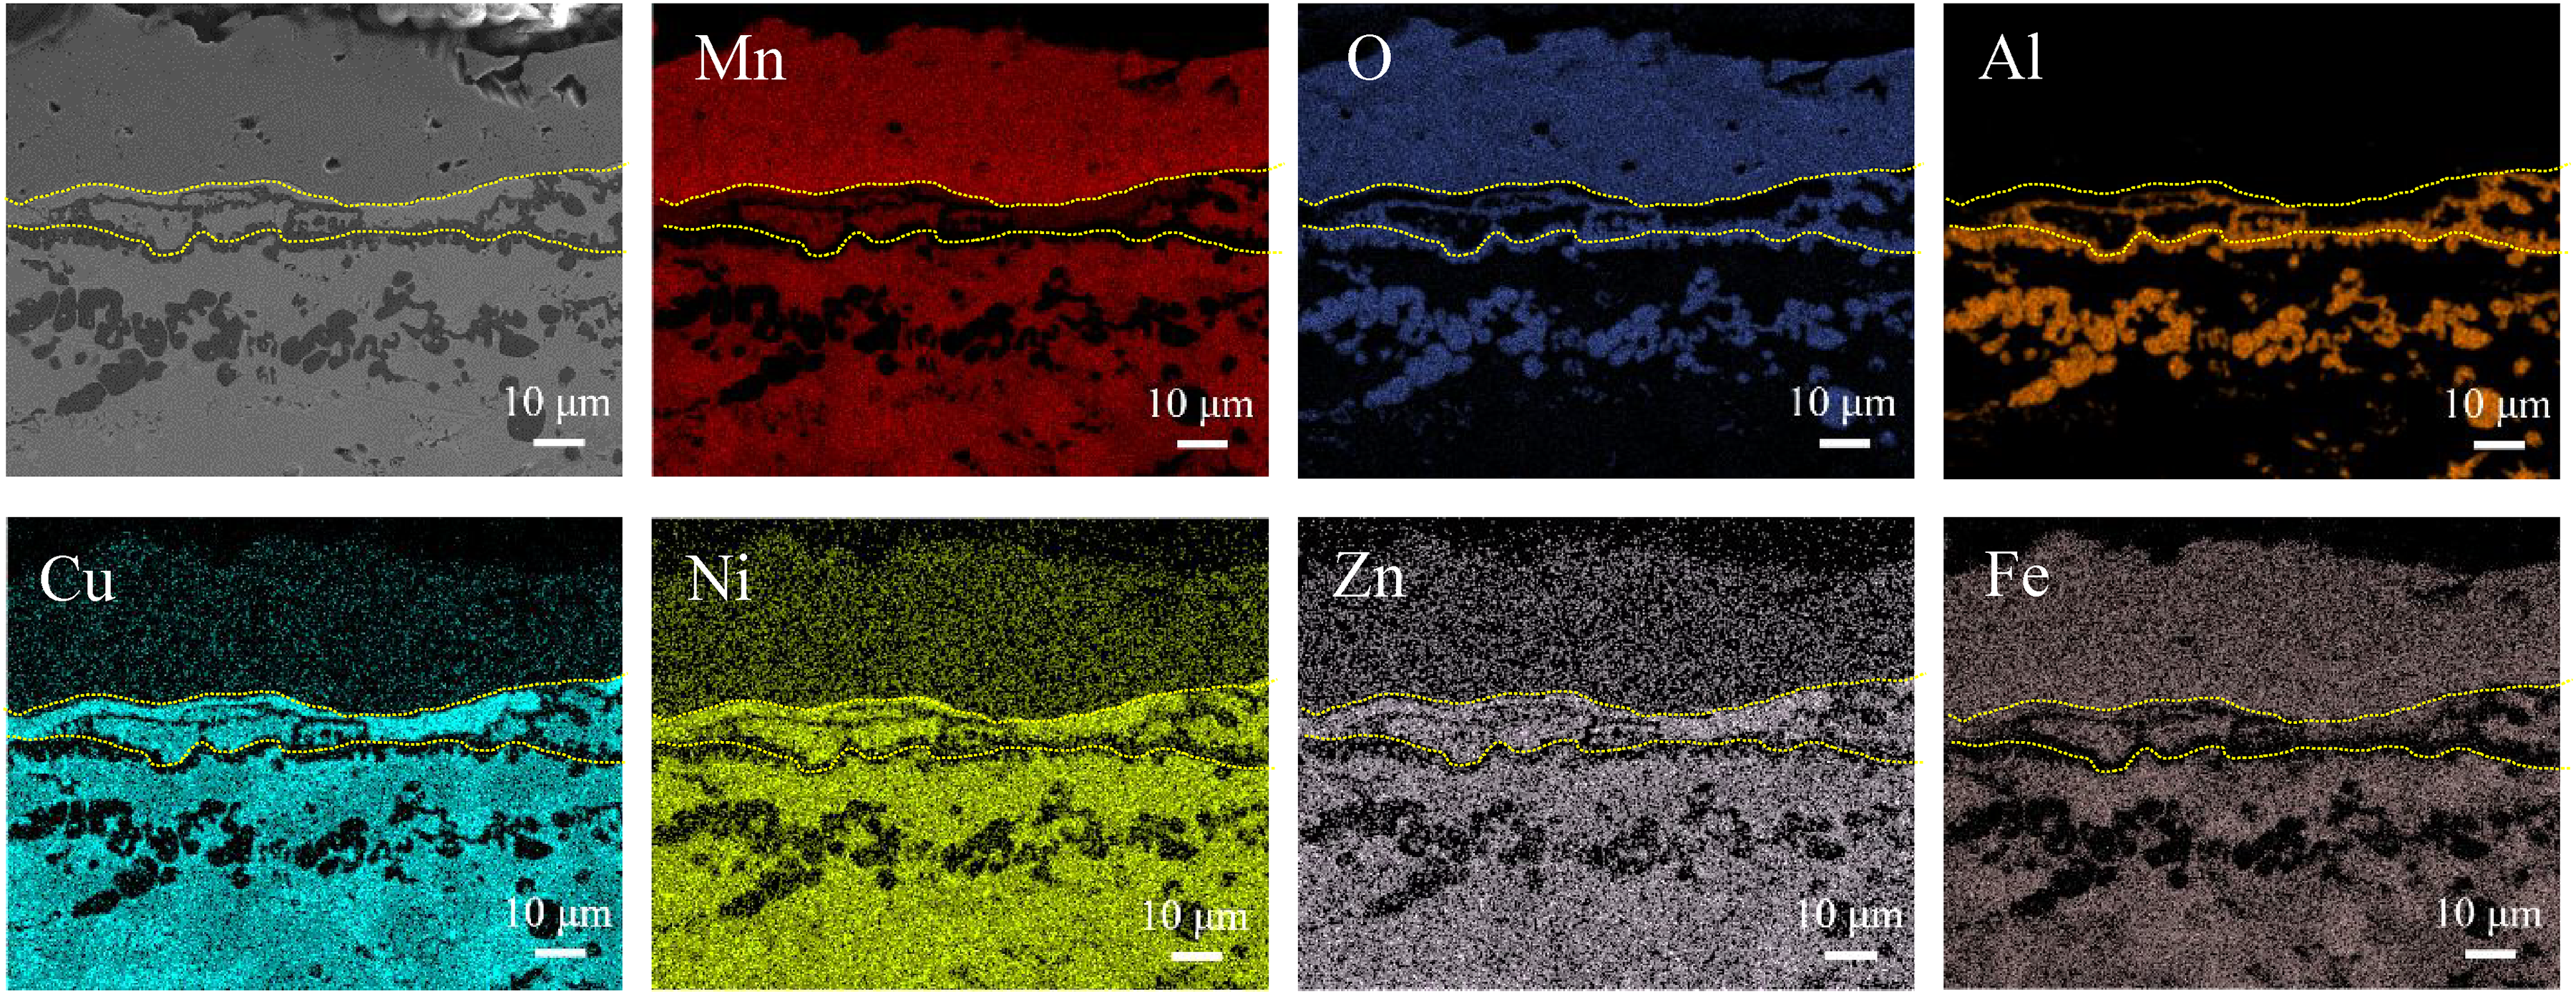
Cross-sectional map scan of specimen oxidation at 1000 °C for 6 h.
Ion transportation and thermodynamics during oxidation
According to the thermodynamic principle,
19
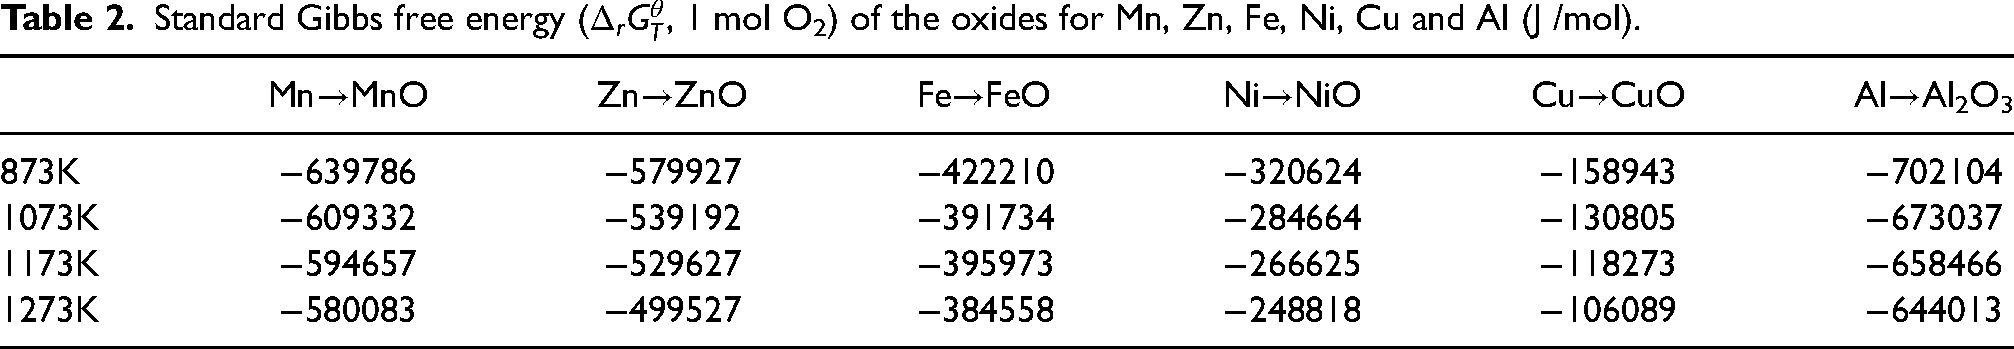
the formation and growth of the oxide layer on the alloy surface is closely related to the Gibbs free energy of the oxide. At certain temperature, the more negative the Gibbs free energy, the greater the affinity of the element with oxygen and the easier the occurrence of oxidation reaction.
20
The standard Gibbs free energies (
Standard Gibbs free energy (
As oxidation proceeds, O diffuses inward through the oxide film, and then further oxidation produces the high valent oxides of Mn2O3 and Mn3O4, and eventually a two-layer structured oxide develops with the outer layer of Mn2O3 and Mn3O4 and the inner layer of MnO. As shown in Figure 8, the ion transport behavior of Fe is similar to that of Mn in the oxide scale. Table 3 list the
Standard gibbs free energy (
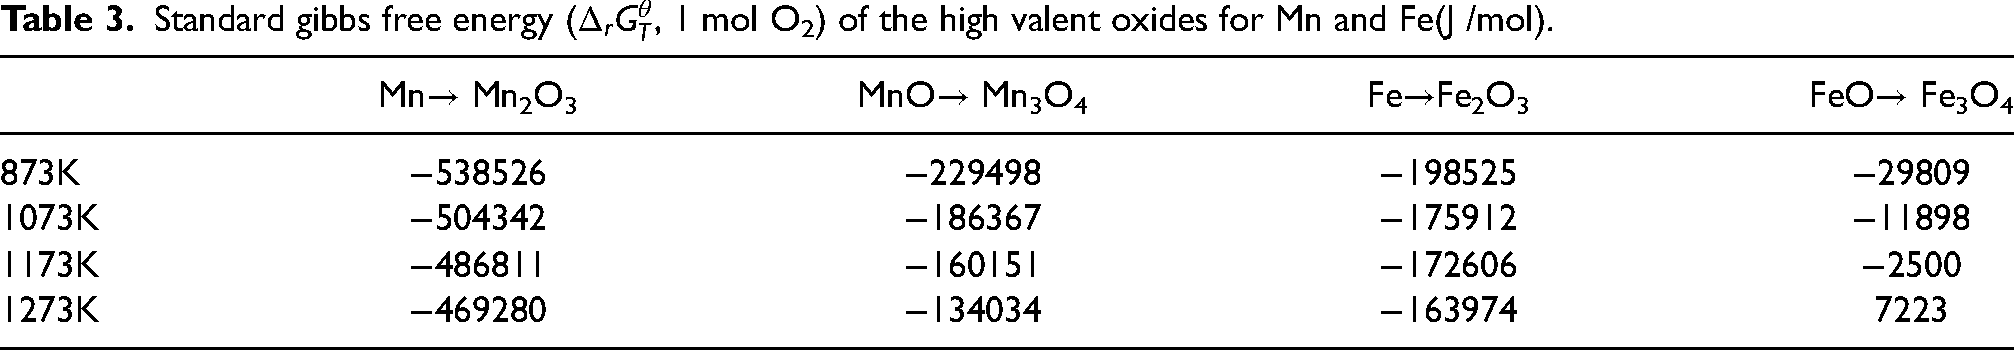
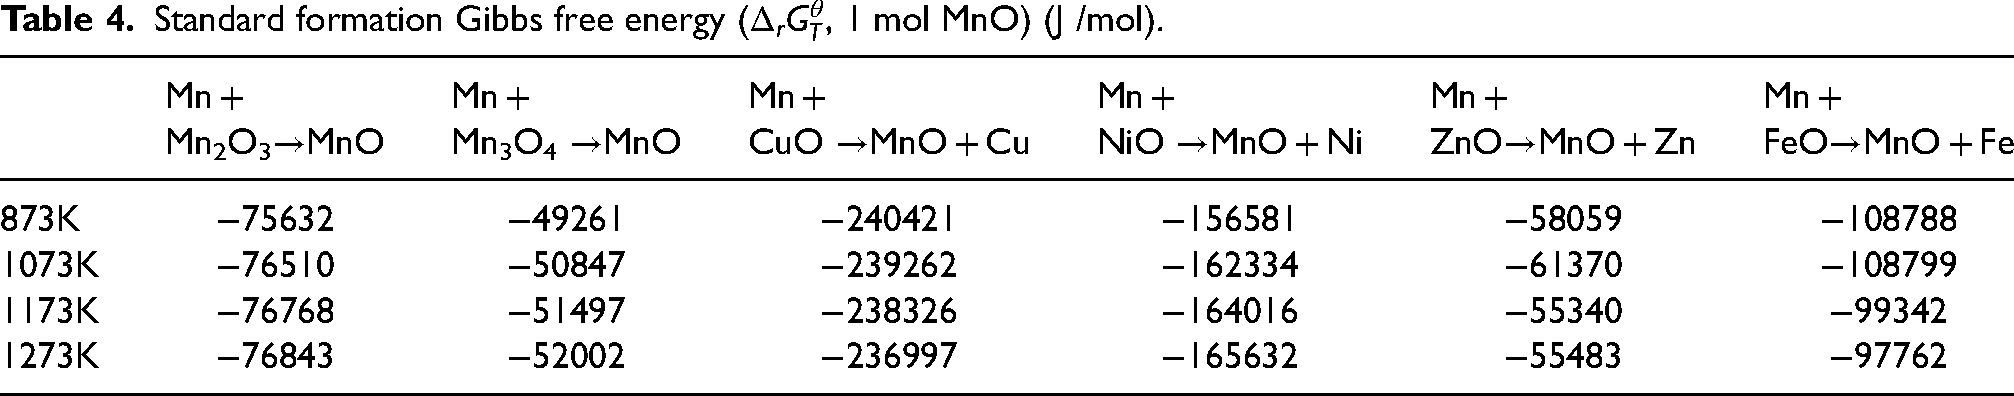
Meanwhile, Mn diffuses outward in the matrix, and further redox reactions may take place, as shown in Table 4, MnO film can be thickened by the redox reactions of Mn2O3 and Mn3O4 with Mn. Moreover, Mn can replace the metal element in CuO, NiO, ZnO, and FeO to produce MnO, and simultaneously lead to the enrichment belt beneath the inner oxide layer (Figure 8). It is clear that MnO not only originates from the oxidation of Mn, but also comes from either the redox reaction or the replacement reaction.
Standard formation Gibbs free energy (
Susceptibility to detachment of oxide scale
It is known that the spinel Mn3O4 is easily scaled off, in addition, the oxidation reaction process can be reflected by the change of XRD profiles. Take the (200) diffraction peak in Figure 2 for an example, Figure 9 shows the enlarged MnO peak dependence of heating temperature. As seen in Figure 9(a), the peak gradually shifts to the left and gets closer to the MnO standard peak position of 40.226° with the increase of temperature. It is known that internal stresses in the oxygen film are the main cause of oxide cracking and peeling off. For cubic crystal systems, the internal stress 
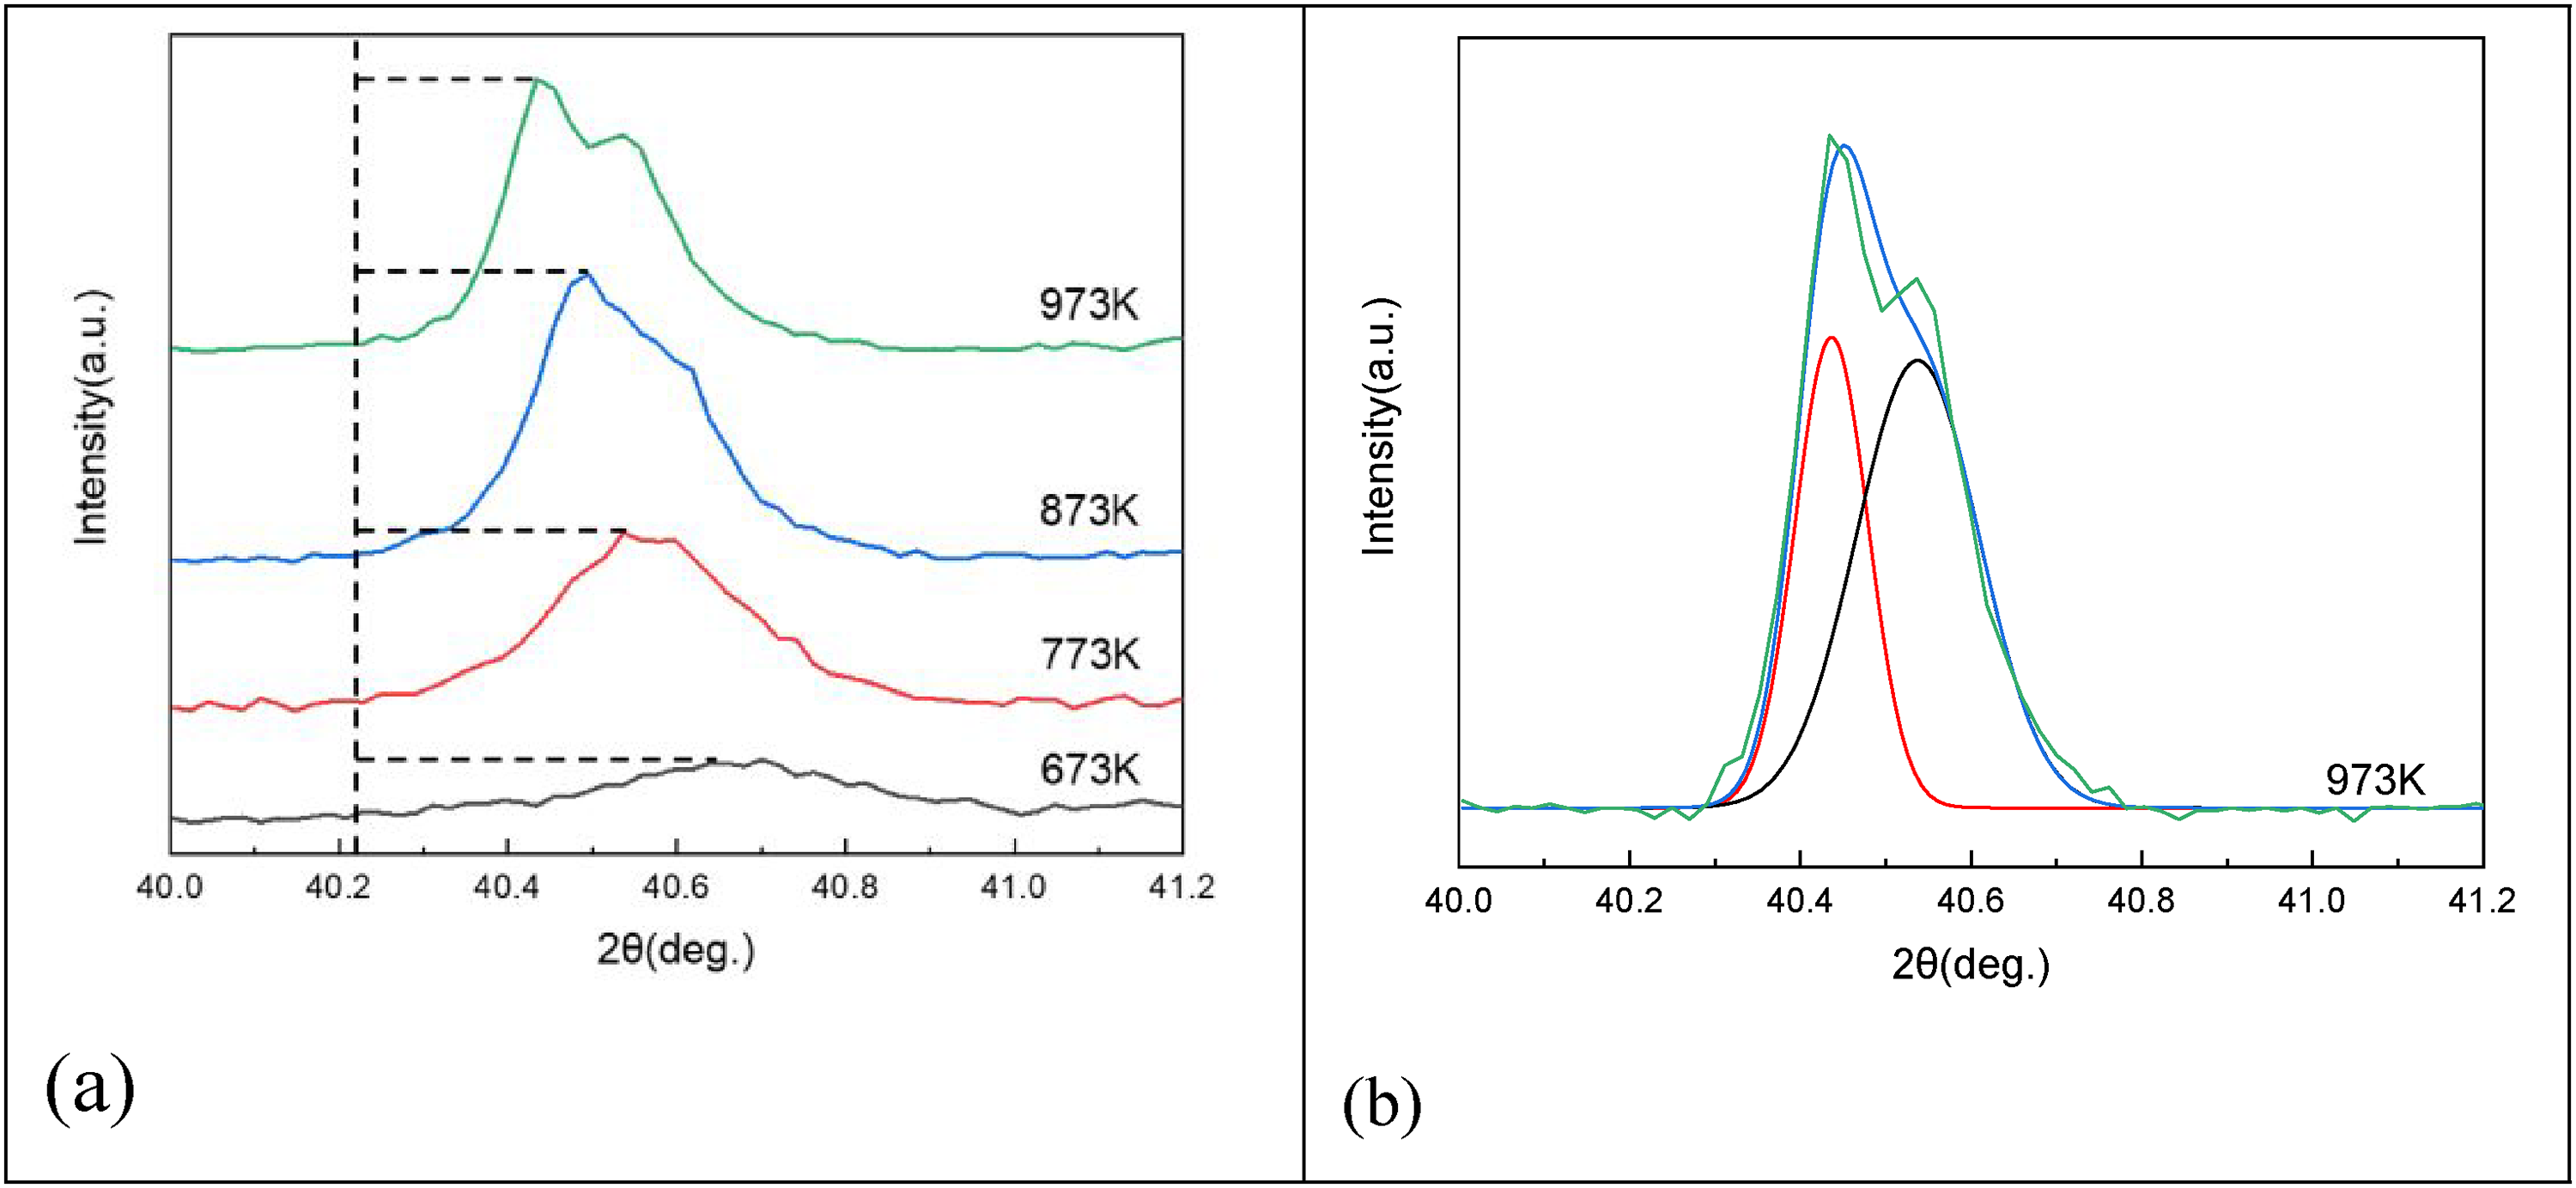
The (200)MnO diffraction characteristics under different heating temperatures, (a) the enlarged peaks, (b) separation of the peak at 973K.
Other more, the peak gradually splits from a flat-sloped one into overlapping double peaks, which can be well fitted by the peak separation, shown in Figure 9(b), which indicates that the MnO phase exhibits varied lattice distances. During the in-situ oxidation process, the oxidation process becomes fast while the oxide film gets thicker with the increase of heating temperature and holding time. It is supposed that the peak splitting should be attributed by the replacement reaction of the former formed MeO (Me = Cu, Ni, Fe, Zn) with the outward diffused Mn, and then the right peak corresponds to the direct oxidation of metals probably with other elements occupation the lattice position leading to a higher crystal spacing, while the left one with smaller spacing is the MnO peak from replacement reaction. The different origins of MnO formation provide the detachment nature of the developed oxide scale.
The oxide formation under isothermal oxidation also reflects the ion transport and reaction by a certain degree. Figure 10 shows the enlarged (100)MnO diffraction, exhibiting a smooth-sloped peak at 873 K, which means that the splitting peaks have merged again with the growth of oxide film. Surely as shown in Figure 4(b), the surface oxide has developed into granular or cubic crystals after isothermal holding at 873 K for 6 h. As for oxidation at 1273 K, the diffusion rate is so fast that that both the redox reaction and the replacement reaction happen rapidly. If we assume that the splitting peak of MnO in the outer scale layer is owing to the redox reaction of Mn2O3 and Mn3O4, while that in the inner layer is contributed by the replacement reaction, it can be seen that high internal stress will be generated in the inner layer in comparison with the previously formed outer layer during the oxide growing process, which is the reason why the high-temperature oxide scale be prone to peel off.
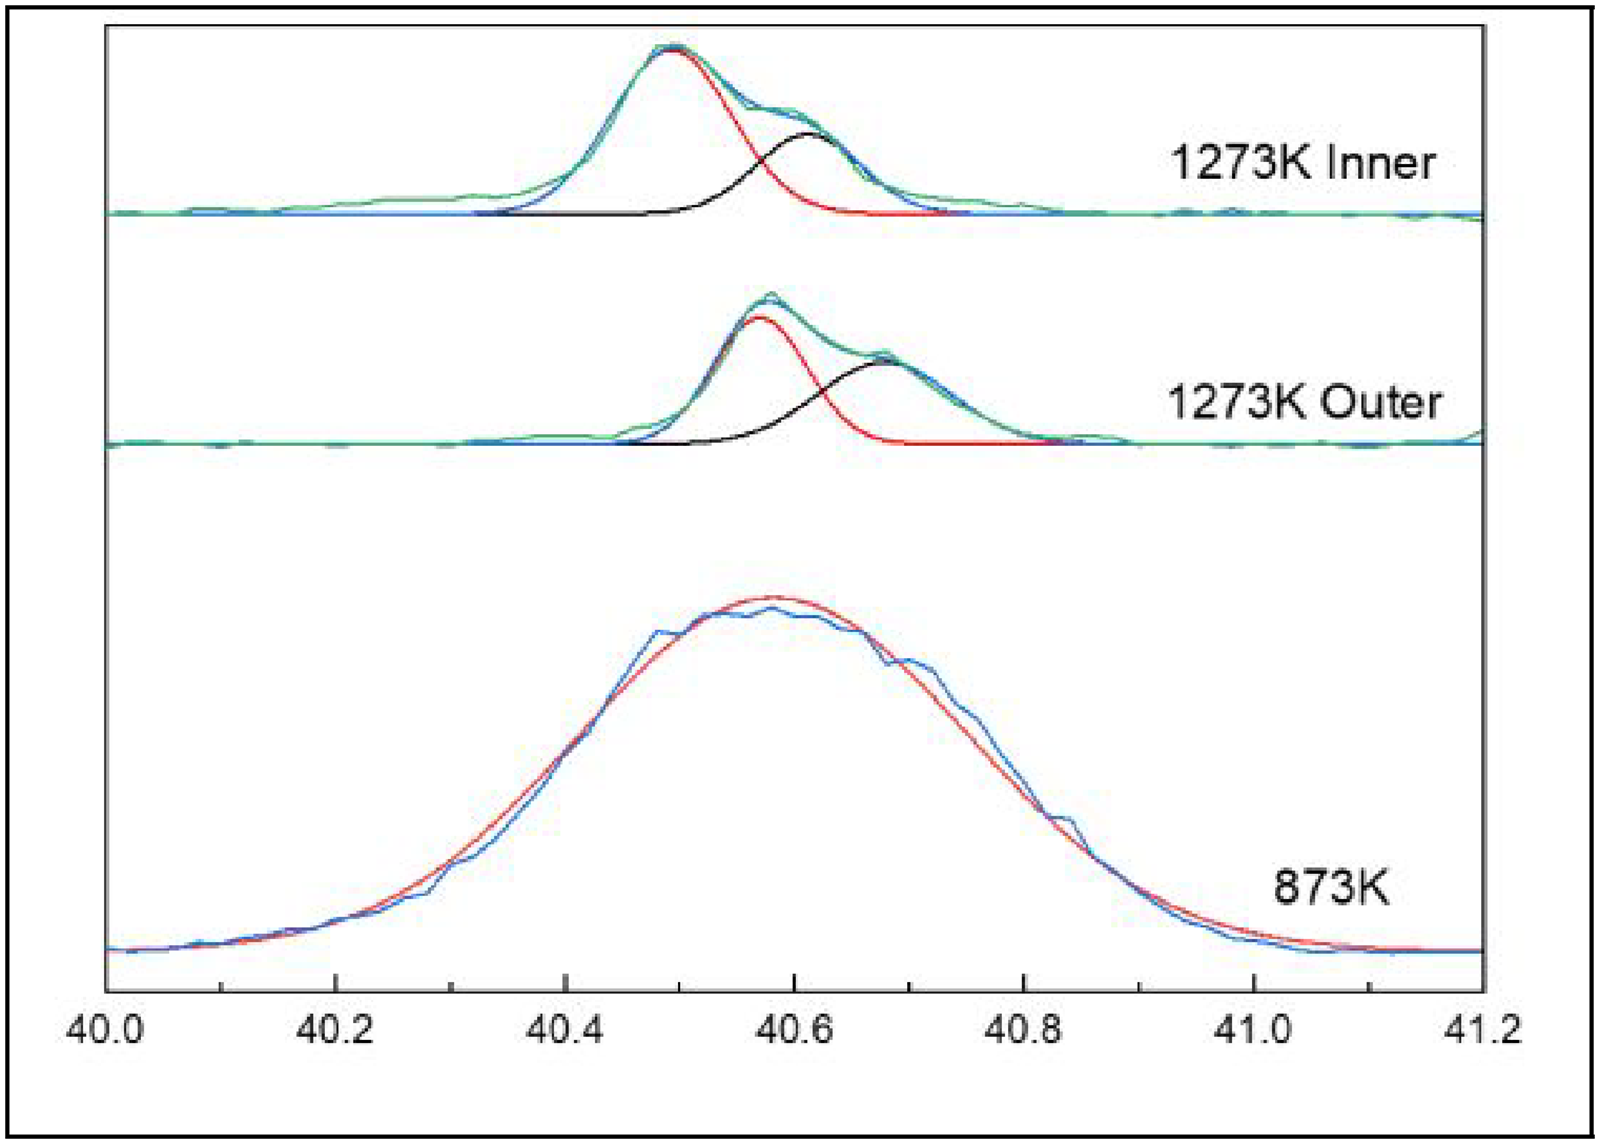
The (100)MnO diffraction characteristic of the isothermal oxidation specimens, (a) at 873 K for 6 h, (b) 1273 K for 6 h.
Conclusions
The oxidation behaviour of MnCuNiFeZnAl alloy were studied under different temperatures, the main conclusions are as follows:
The mass gains dependence of square root of holding time show a linear relationship under different oxidation temperature, and the fitting equation follows The in-situ XRD analysis of MnCuNiFeZnAl alloy reveals that oxidation begins at 673 K with the formation of MnO, ZnO, and CuO. As the temperature increases, MnO phase dominates and then Mn3O4 and Mn2O3 appears in the outer oxide layer. After isothermal oxidation at 873 K for 6 h, the surface oxide consists mainly of MnO, with some Mn3O4 and CuO. Oxidation at 1273 K for 6 h results in the formation of MnO and Mn3O4, and the residual oxide on the substrate also contains Mn2O3 phase. In the early stages of oxidation at 873 K, there forms needle-like ZnO, flocs like MnO, CuO and NiO phases, as oxidation time extends and holding temperature increases, the oxide film grows denser, forming granular and cubic shapes of MnO and spinel Mn3O4. Severe oxidation occurs at 1273 K, but continuous Al2O3 film has formed in the substrate near the interface of the oxidation film / matrix, effectively improving the antioxidant performance of the alloy. There exists obvious two layers of oxide scale for the specimen oxidized at 1073 K. The element distributions in the oxide film and the matrix reflect the redox reactions of Mn2O3 and Mn3O4 with Mn, as well as the replacement reaction of MeO (Zn, Cu, Ni, Fe) with Mn to produce MnO. The process of ion transport and chemical reaction are reflected by the shift and split of MnO diffraction peak, disclosing the nature of manganese oxide scale susceptibility to detachment.
Footnotes
Author contribution(s)
Declaration of conflicting interests
The authors declared no potential conflicts of interest with respect to the research, authorship, and/or publication of this article.
Funding
The authors received no financial support for the research, authorship, and/or publication of this article.