
Abstract
Operation of a civil nuclear pressurised water reactor (PWR) facility results in a complex variable loading sequence arising from combined mechanical and thermal loadings, which must be evaluated in conjunction with welding residual stresses. This presents a challenge for fatigue crack growth (FCG) assessments at the design stage, with no load history, in support of a safety case for components where gross failure must be shown to be incredible within the design life. Assessment methods for FCG are generally contained within in-service inspection codes, e.g. RSE-M, ASME XI. The codified methods were not developed for use at the design stage and can be overly conservative as a result. This study considers the treatment of crack closure in the RSE-M code in the case of a low alloy steel component. The aim is to understand the reasonableness of the approach and if this assessment parameter is a potential source of significant conservatism. The primary focus is the treatment of the start-up/shutdown transients, with a negative R-ratio modified via the inclusion of welding residual stress. The study has been carried out using elastic-plastic cracked-body finite element models with a constant defect size i.e., propagation is not explicitly modelled. Crack growth is inferred by examination of behaviour ahead of the crack-tip and crack-tip opening displacement (CTOD) to determine an effective load range on an un-cracked elastic model to subsequently derive an effective stress intensity factor range
Introduction
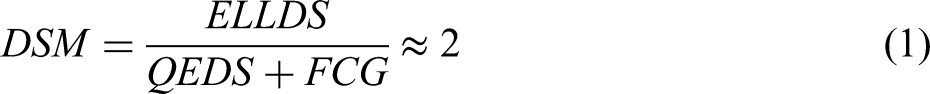
In UK civil nuclear facilities, fracture mechanics assessments (FMAs) form part of the safety case for components requiring the highest reliability claims, referred to as the high integrity components (HICs). A demonstration via FMA is required to show that a target defect size margin approaching 2 can be achieved for the intended operating life, defined as:
The large components of the primary circuit in a civil nuclear pressurised water reactor (PWR) are subject to complex variable loading sequences during operation arising from combined mechanical and thermal variations, in addition to welding residual stresses. The definition and number of occurrences of design loads and transients are inherently conservative to cover variations of parameters within the design basis envelope and fault schedule.
Existing codified assessment procedures were not developed for specific PWR geometries and loading types in which the numbers of occurrence of major cycles are relatively low with large stress ranges and, as such, can lead to high calculated values of fatigue crack growth (FCG) in safety assessments. The study considers the approach for the determination of an effective stress intensity factor range,
The issues addressed in this article were identified as part of a larger piece of work summarised in a review of methods for FCG assessments of HICs carried out by the UK Technical Advisory Group for Structural Integrity (TAGSI) in Horn et al.
2
Analyses carried out for the work aimed to justification of a less onerous method for determination of cycles from periods of plant operation, referred to as plant operating condition (POC) cycles. The reader is directed to Horn et al.
2
for further references relating to the POC approach. However, as part of the demonstration is was identified that crack closure effects on the representative model geometry and loading conditions analysed had significant effects on the determination of
Appendix 5.6 of RSE-M
1
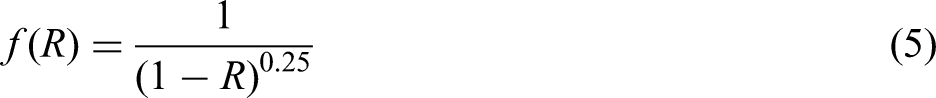
defines the FCG rate in terms of crack growth per cycle, da/dN. For low alloy steel in a PWR environment, the FCG rate laws (derived using compact test (CT) specimens) are provided in Tables 5.6-II.2 depending on sulfur content. However, in all cases da/dN is determined as follows:


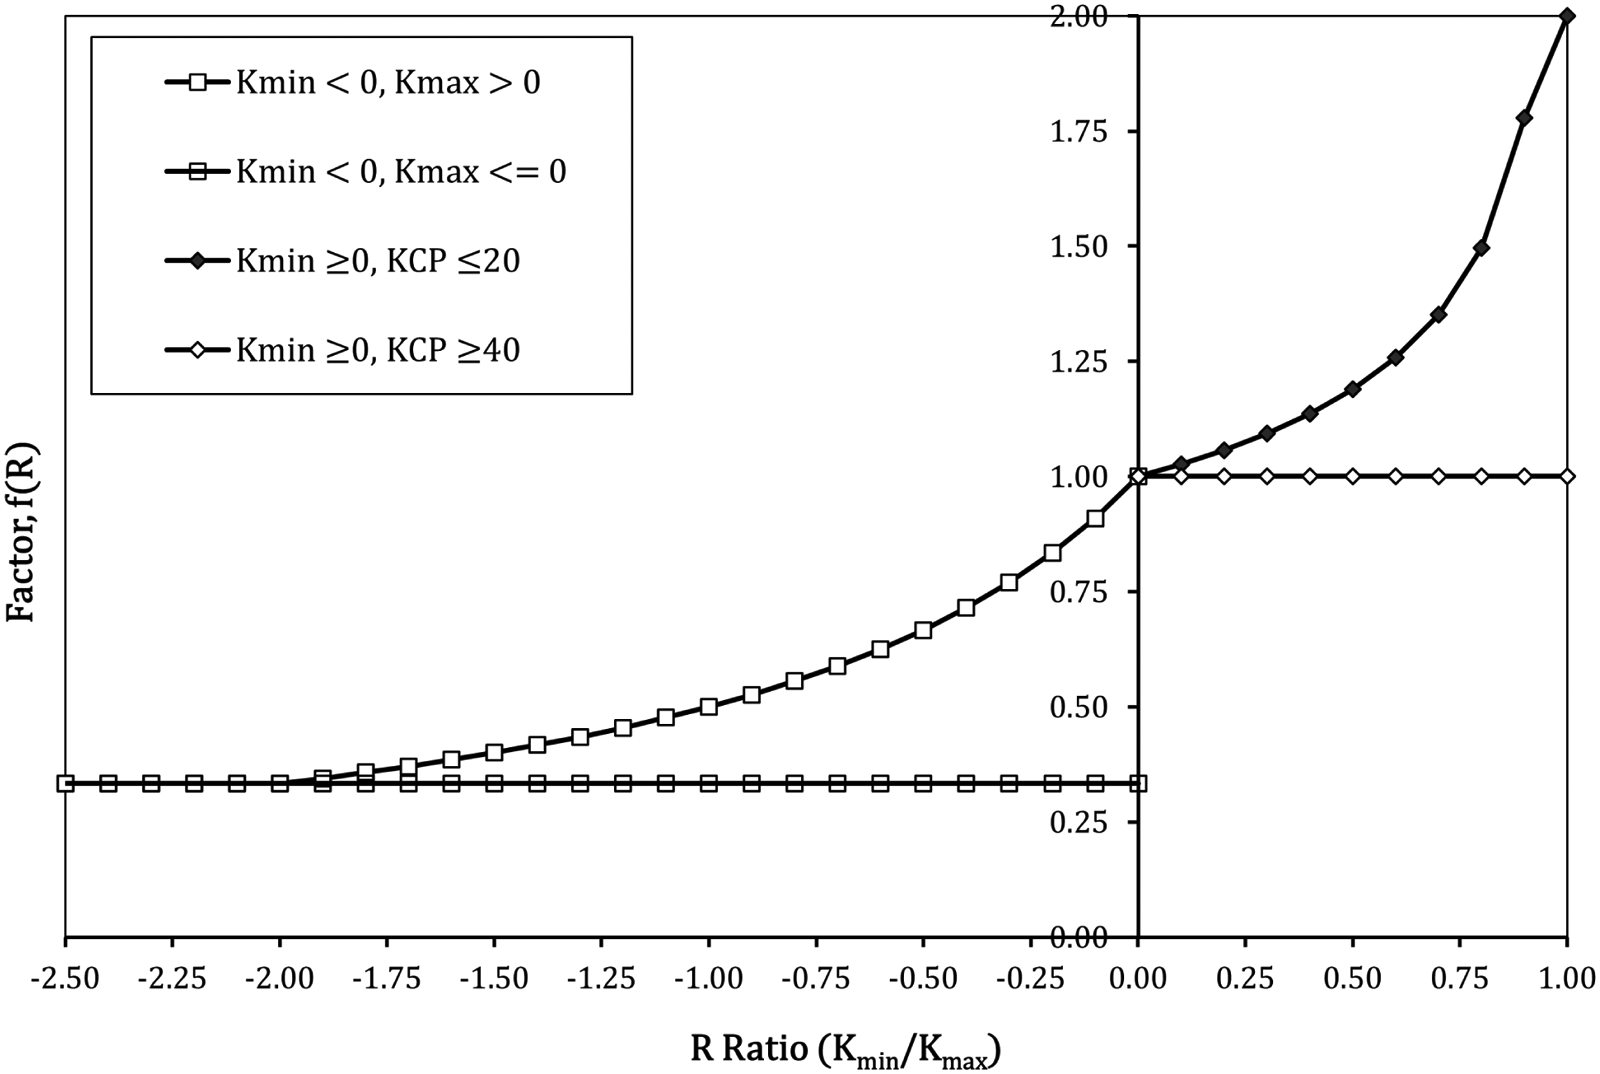
Variation of RSE-M Crack Closure Parameter, f(R), with R-Ratio for Low Alloy Steels.
Although not explicitly assessed in the study here, for completeness, when

Modelling
A significant consideration for the work here was the type of analysis to be performed. To avoid additional uncertainty due to the analysis, a conscious effort was made to employ a modelling technique not considered novel. Thus, crack growth behaviour is inferred via analysis of stress and strain behaviour ahead of the crack-tip, rather than, for example, energy approaches or specific techniques predicting crack propagation paths etc. It is noted that such approaches can be extremely useful, and may be introduced in future further work. However, the current work here aims to highlight and better understand the issues in the first instance.
An axisymmetric model of a cylindrical vessel with
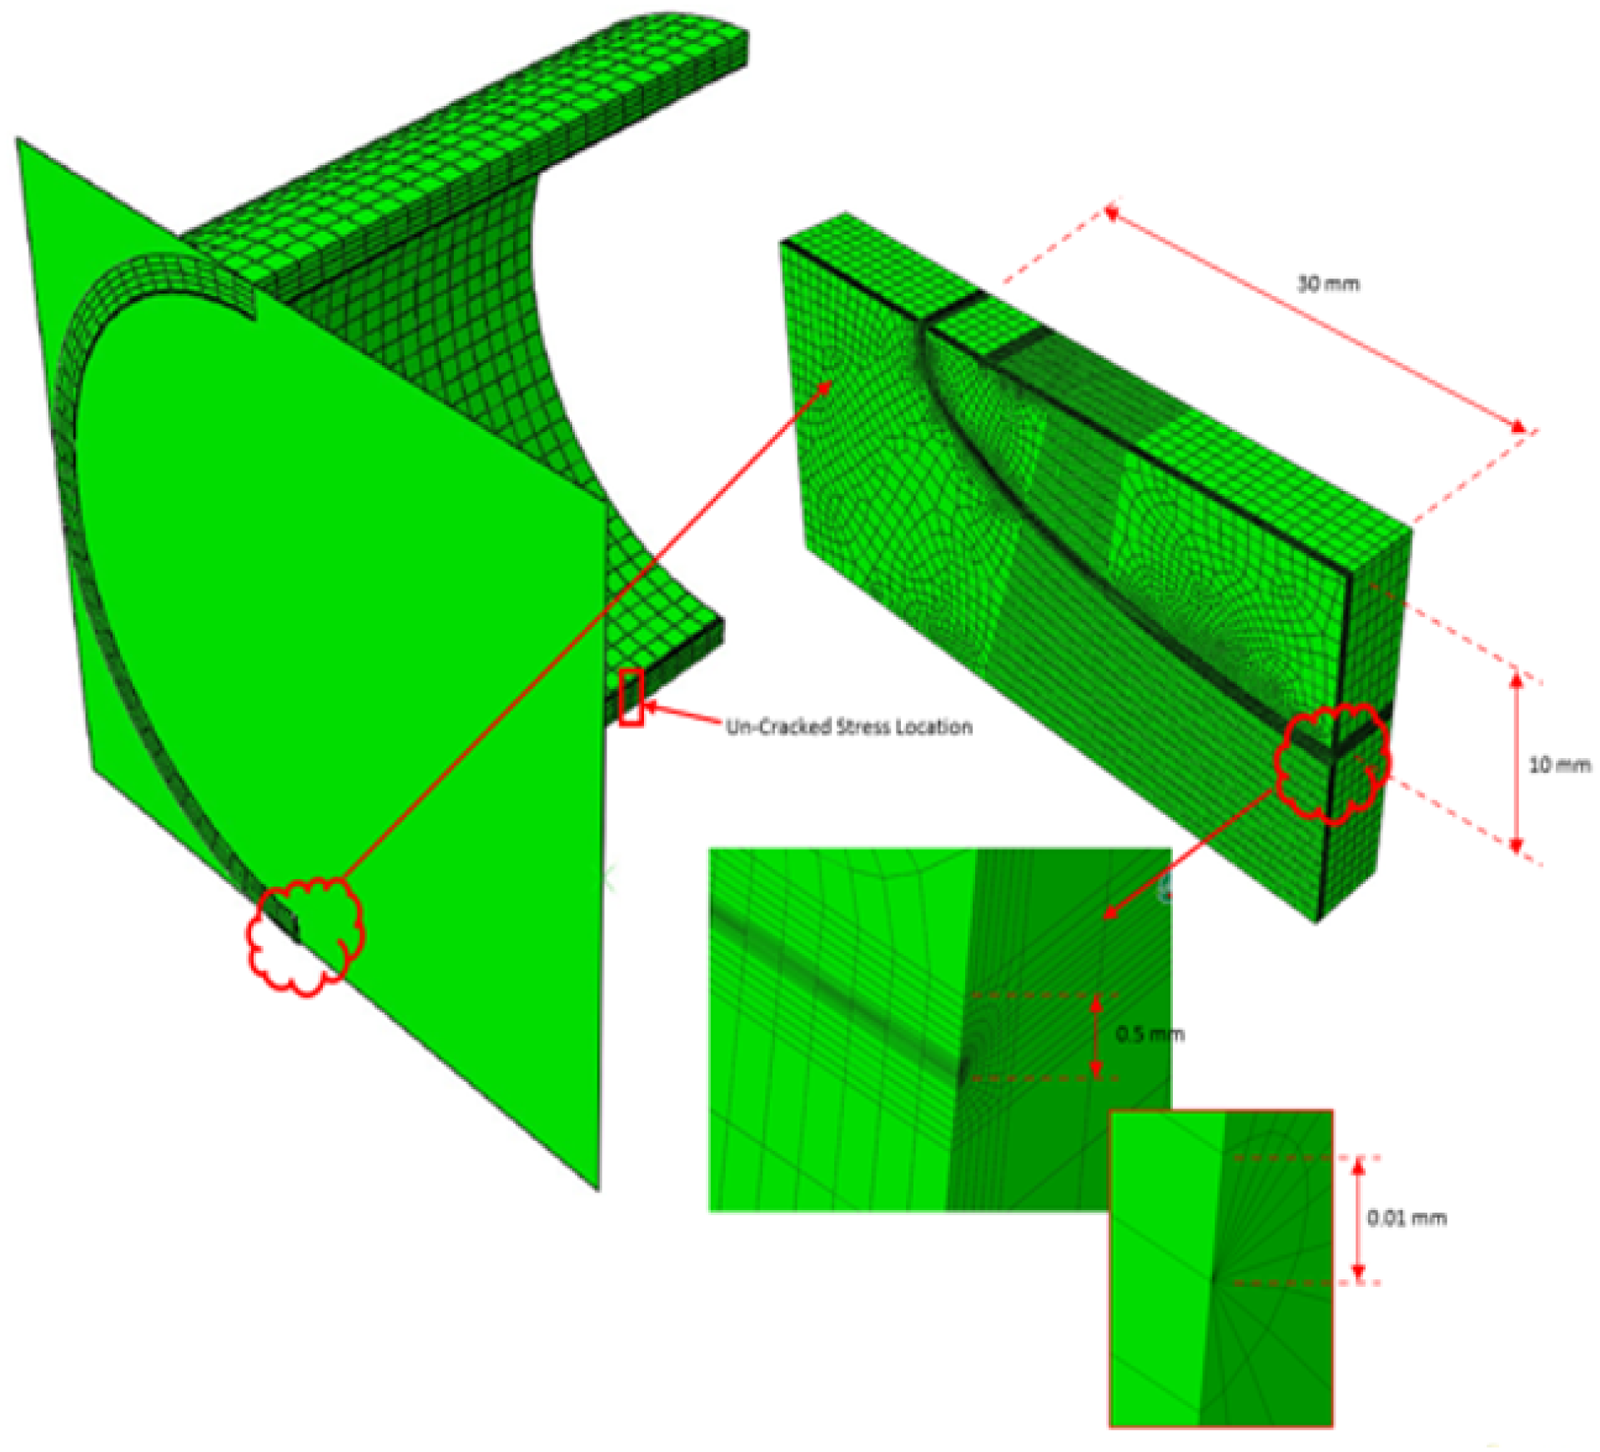
3D Finite Element Model.
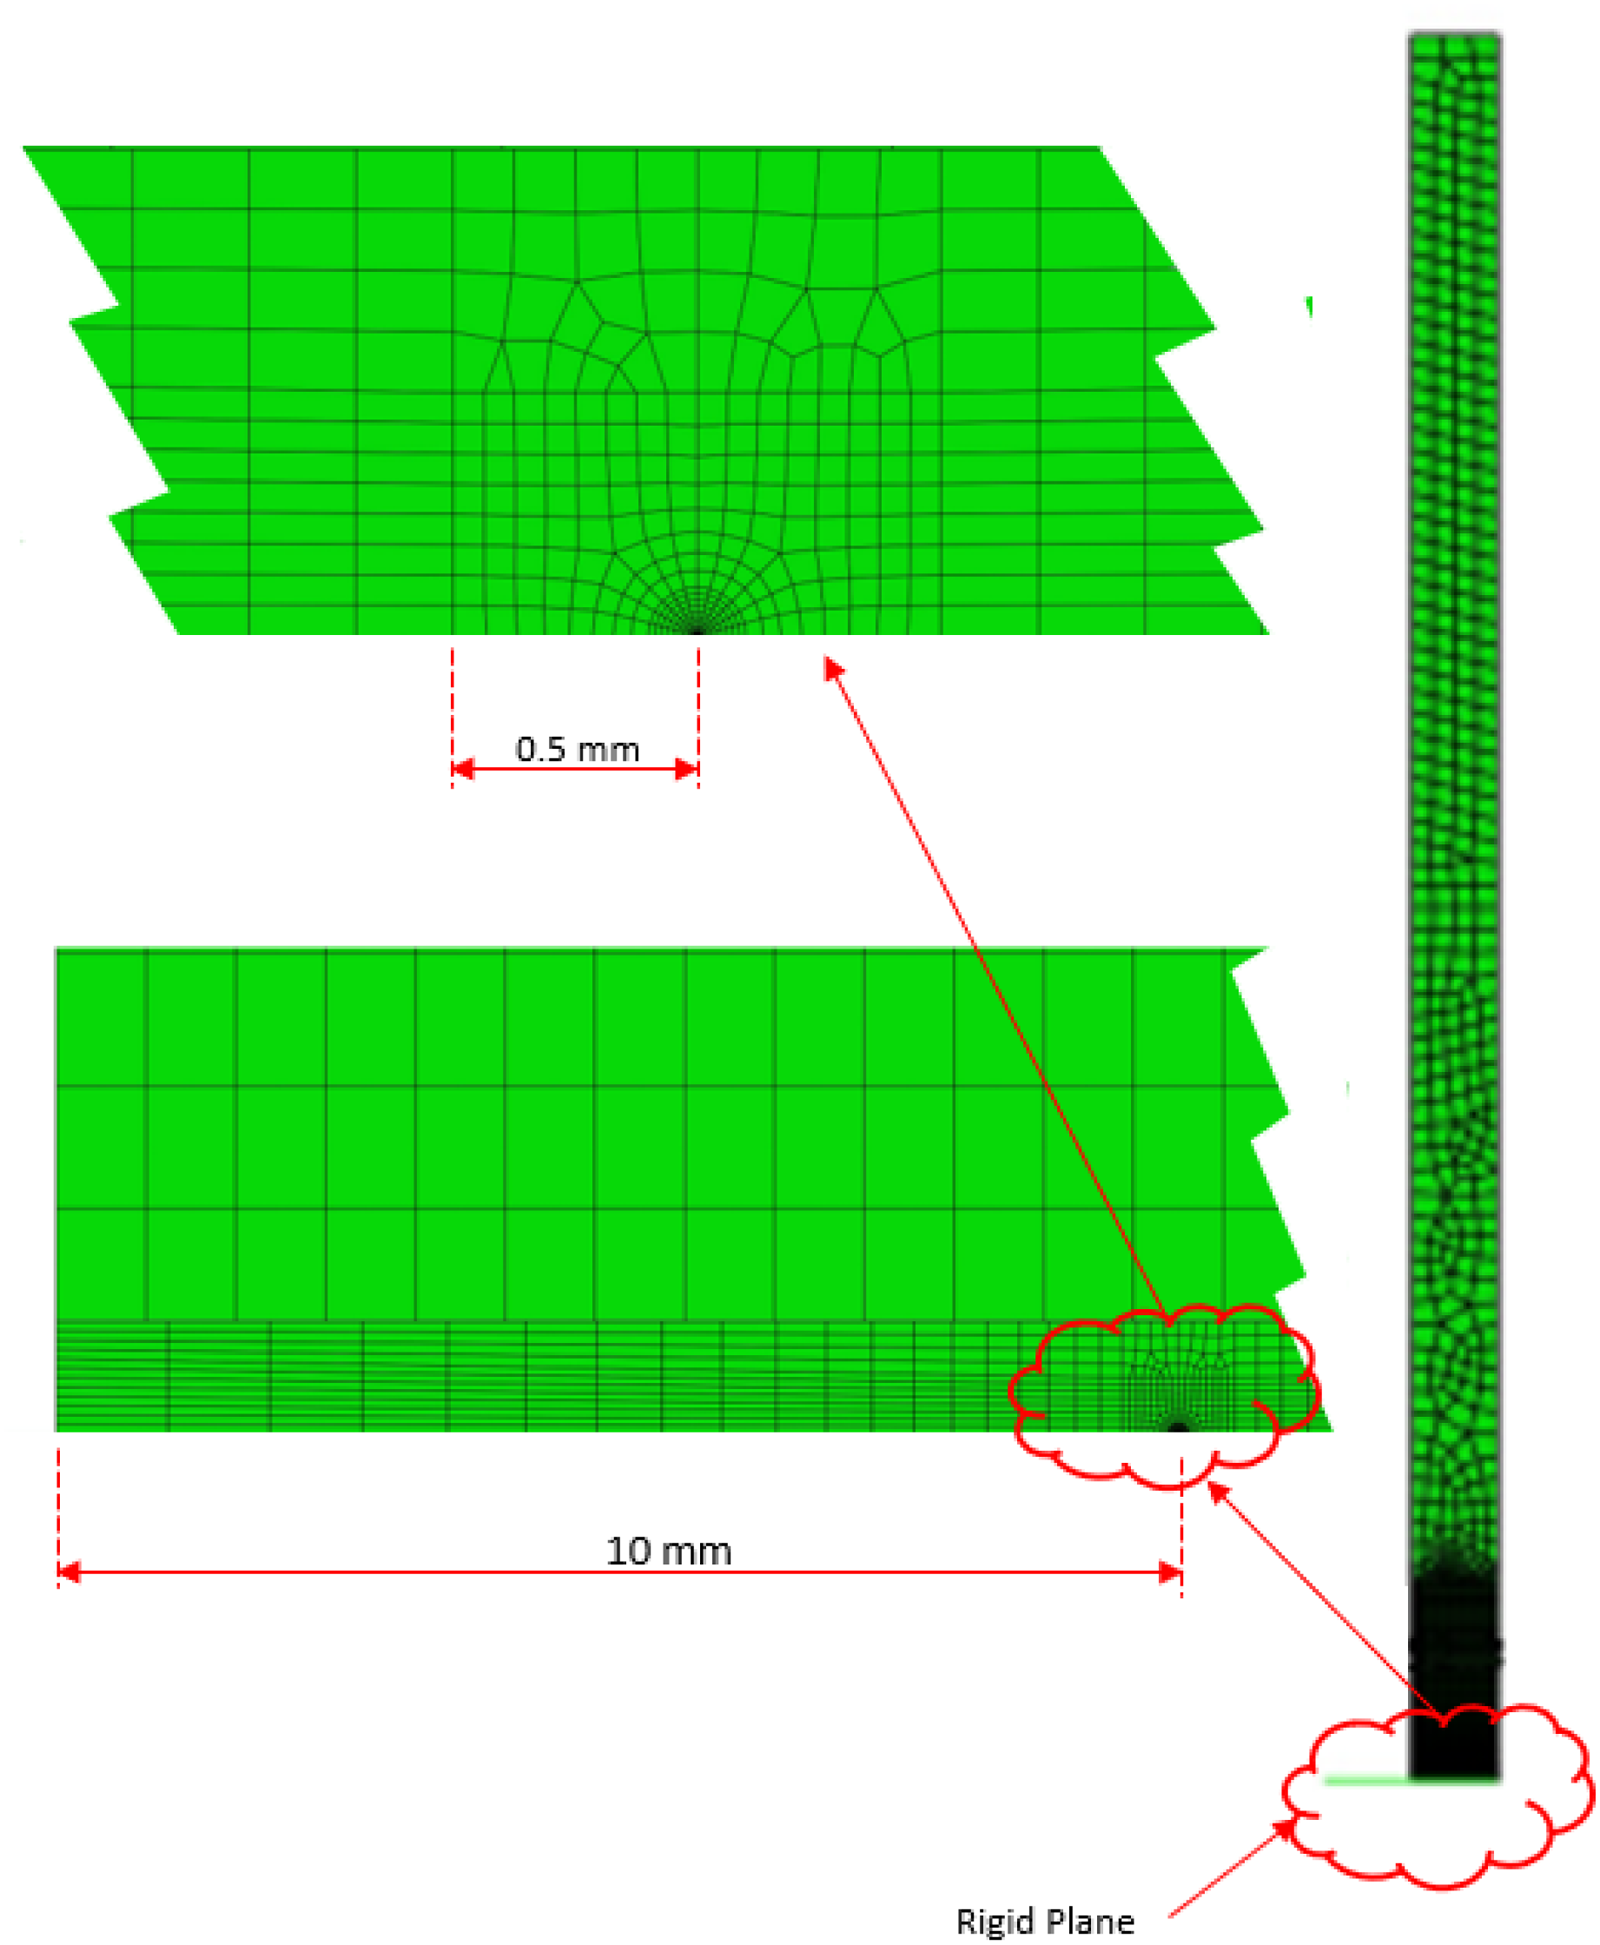
Axisymmetric Finite Element Model.
Throughout the analysis, a large and constant HTC value has been assumed. This is representative for normal operating conditions when flow rates are high. Although not the case for some parts of the start-up or shutdown, for the purposes of the study here, the assumption is judged reasonable.
For initial consideration of defect geometry effects, a 3D model has also been generated containing a semi-elliptical surface breaking defect with an aspect ratio of total length to depth, 2c/a = 6/1, postulated on the inside surface with a circumferential orientation. This is the main type of defect considered at the design stage and is generally the most onerous configuration for a thick section component in which the main loading arises from pressurised cold thermal shock. To confirm the appropriateness of an axisymmetric model for inferring behaviour of the deepest point of a semi-elliptical defect, the elastic stress-strain hysteresis loop 50µm ahead of the crack tip from the 3D and axisymmetric models for the 2nd loading cycle are compared in Figure 4. The loading cycle is defined in more detail later in the article; however, it gives rise to a complex hysteresis loop. These have initially been used only to draw conclusions in terms of defect modelling geometry. It is observed that the strain ranges for both analyses are similar, while the stress range for the axisymmetric case is larger, as expected. The overall trends between the two analyses are judged sufficiently similar such that it is considered acceptable to use the axisymmetric model to form conclusions here. The 3D and axisymmetric models are shown in Figures 2 and 3 respectively. Further, detailed consideration of the hysteresis loops to infer crack growth behaviour is provided later when discussing the elastic-plastic analyses.
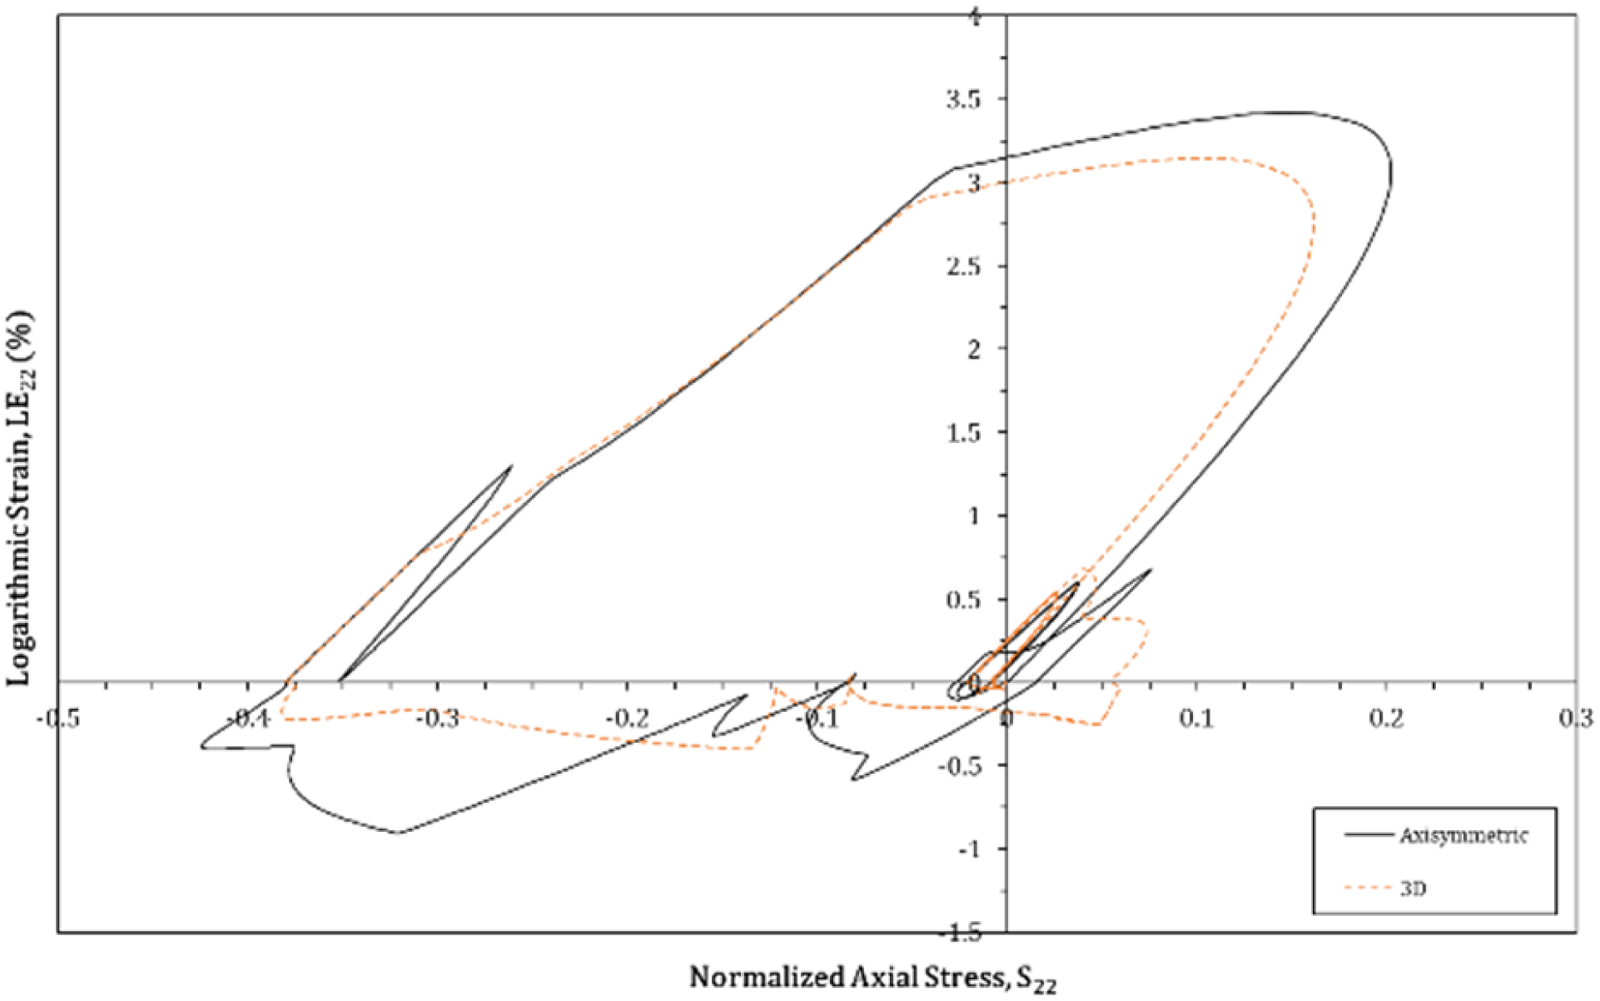
Comparison of Elastic Stress-Strain Hysteresis Loops for 3D and Axisymmetric Models.
The component is constructed from low alloy steel, type 16MND5, with austenitic cladding on the inside surface. Elastic tensile and physical properties have been taken from Appendix Z I of RCC-M at 20°C and 300°C. Monotonic stress-strain data are taken from Appendix 5.6 of RSE-M. 1 Due to modelling complexities (size of the analysis and contact), linear kinematic hardening is assumed. The hardening slope has been assumed to envelope the stress-strain data in the low-strain region to conservatively underestimate plasticity, which is expected to be beneficial for the geometry and loadings considered here. The stress-strain inputs assumed in the analyses are shown in Figure 5. It should be noted that the aim of the analyses here is not to provide definitive values in terms of damage, but to illustrate trends. The importance of material hardening models and associated uncertainty in finite element applications is noted and discussed later in the article, though the approach used here is judged to be suitably indicative.
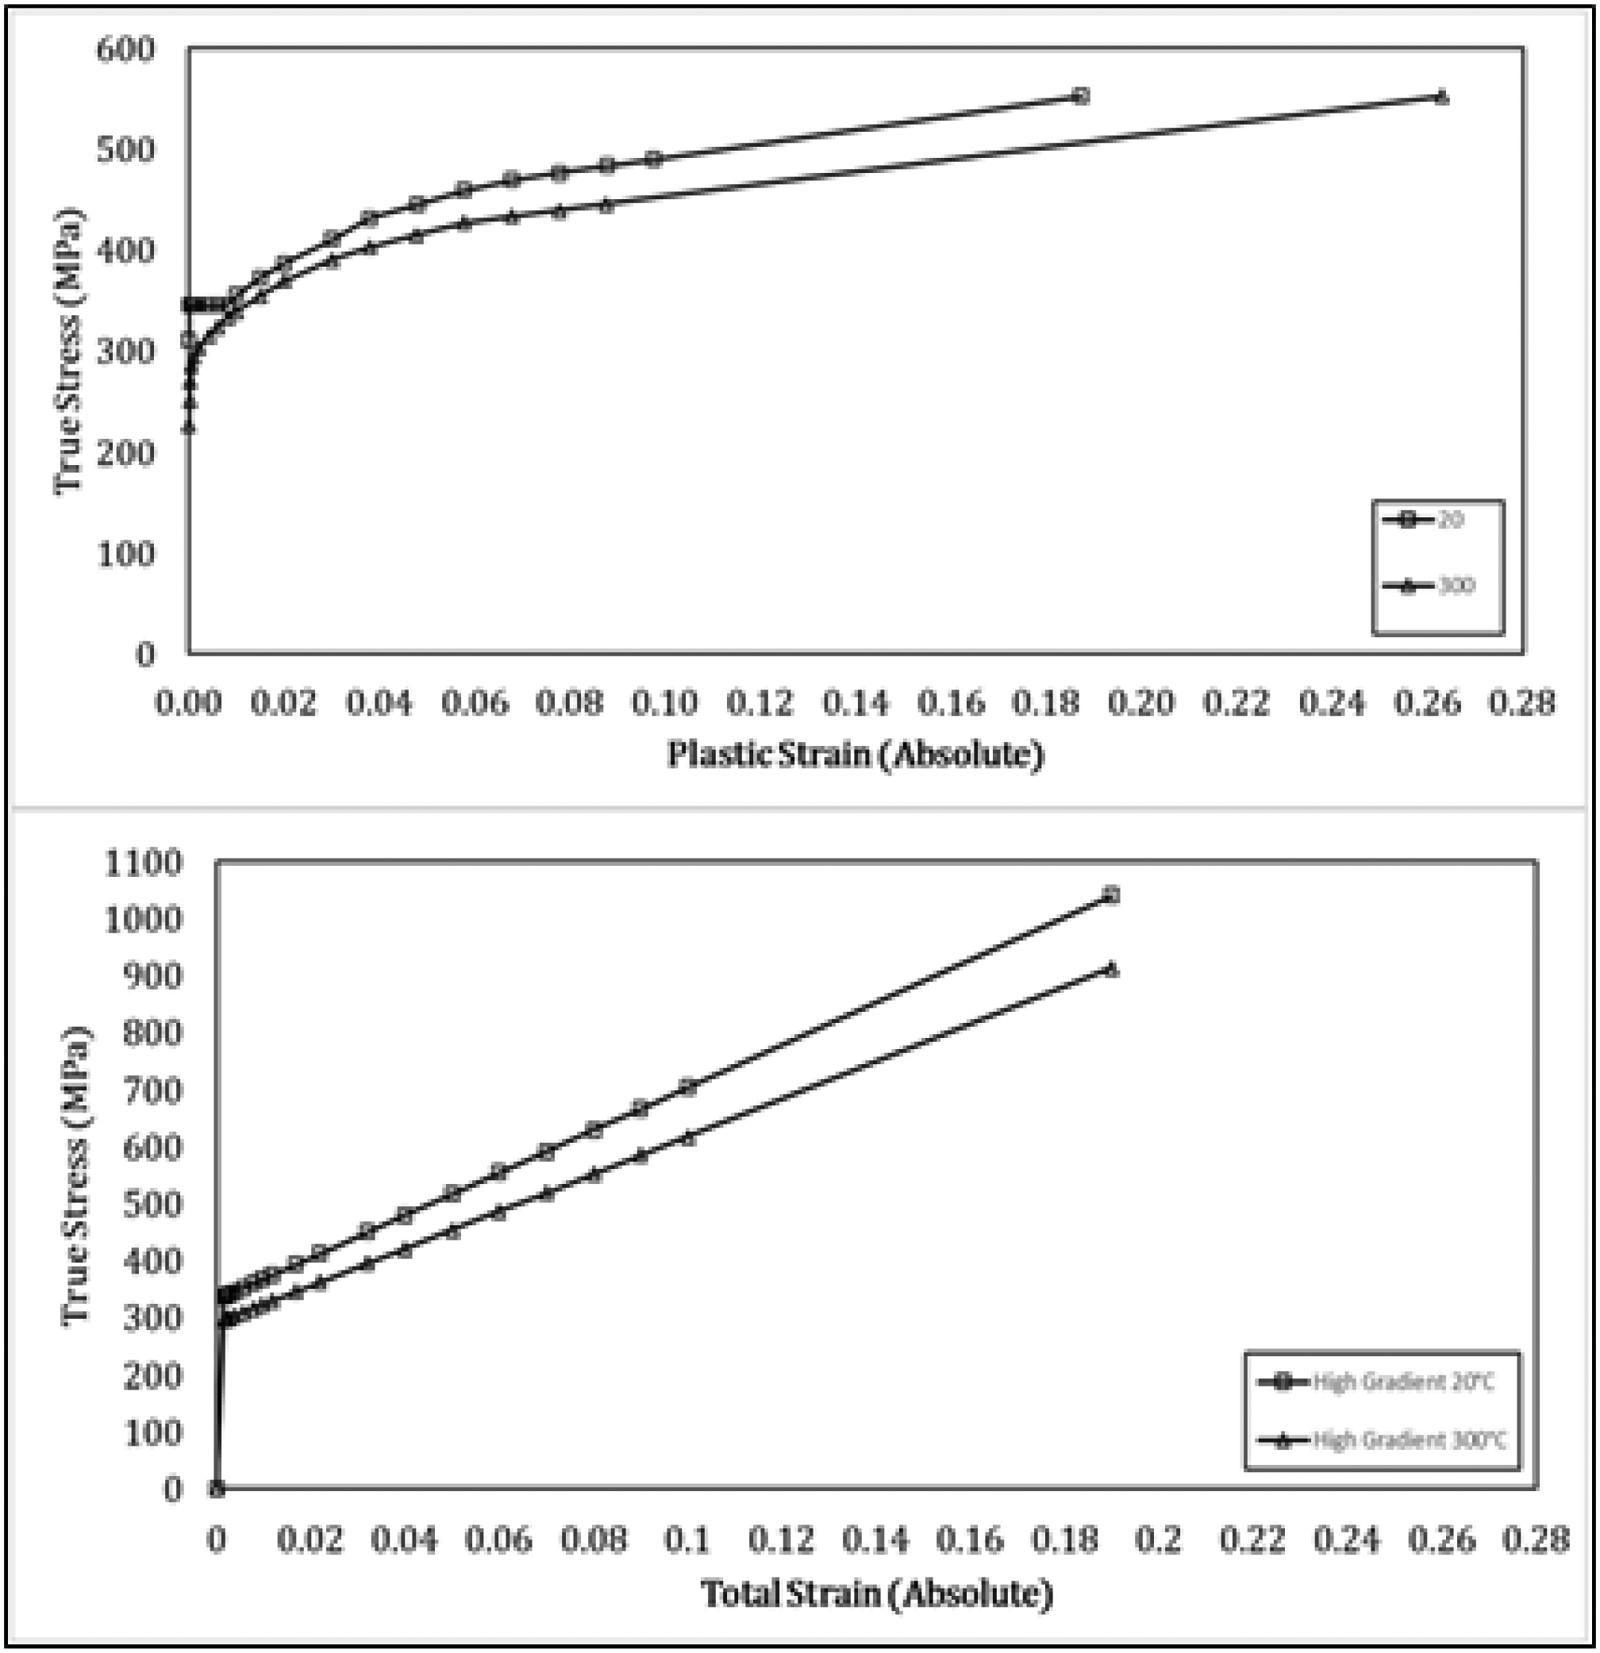
Assumed Stress-Strain Behaviour Based on RSE-M Properties.
The loading is defined in more detail later. However, to set the logic for the cases considered, the part of the POC cycle analysed in detail is the shutdown/start-up operation. In the components considered here, start-up operations result in heating transients, giving rise to compressive stresses on the internal surface resulting in a negative R-ratio. Consideration of the influence of welding residual stress (WRS) leads to the following cases to be analysed:
Negative R-ratio, no WRS. Negative R-ratio, enhanced by low/moderate WRS. Positive R-ratio, due to high WRS.
Case 1 is the base case and representative of assessments carried out on ferritic parent materials. Case 2 is representative of a welded component that has been subject to a furnace post-weld heat treatment (PWHT). Case 3 is representative of loading levels for some ferritic welded components subject to local PWHTs, where the final PWHT residual stress values can still be significant.
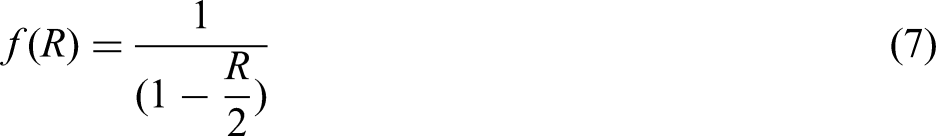
WRS are not cyclic but contribute to the mean stress. In routine structural assessments, this is accounted for by a modification to Equation (4) to determine R-ratios according to Equation (8):

The major stress cycles generally occur due to thermal transients associated with normal shutdown and start-up operations. A period of fictitious, but representative, continuous operation has been defined, which includes an initial start-up, a period of steady operation followed by a shutdown, and then repeated (Figure 6). The total period considered for one cycle of continuous operation is approximately 54 hours. For analysis purposes, the period of the start-up transient has been optimised to reduce analysis run time. In practice, the temperature is held constant at 15°C for several hours at low pressures while the main coolant pumps are brought into service. This period is omitted from the analyses and the transient is assumed to begin as pumps are started and the pressure is increased, resulting in a rapid temperature change from 15°C to 50°C.
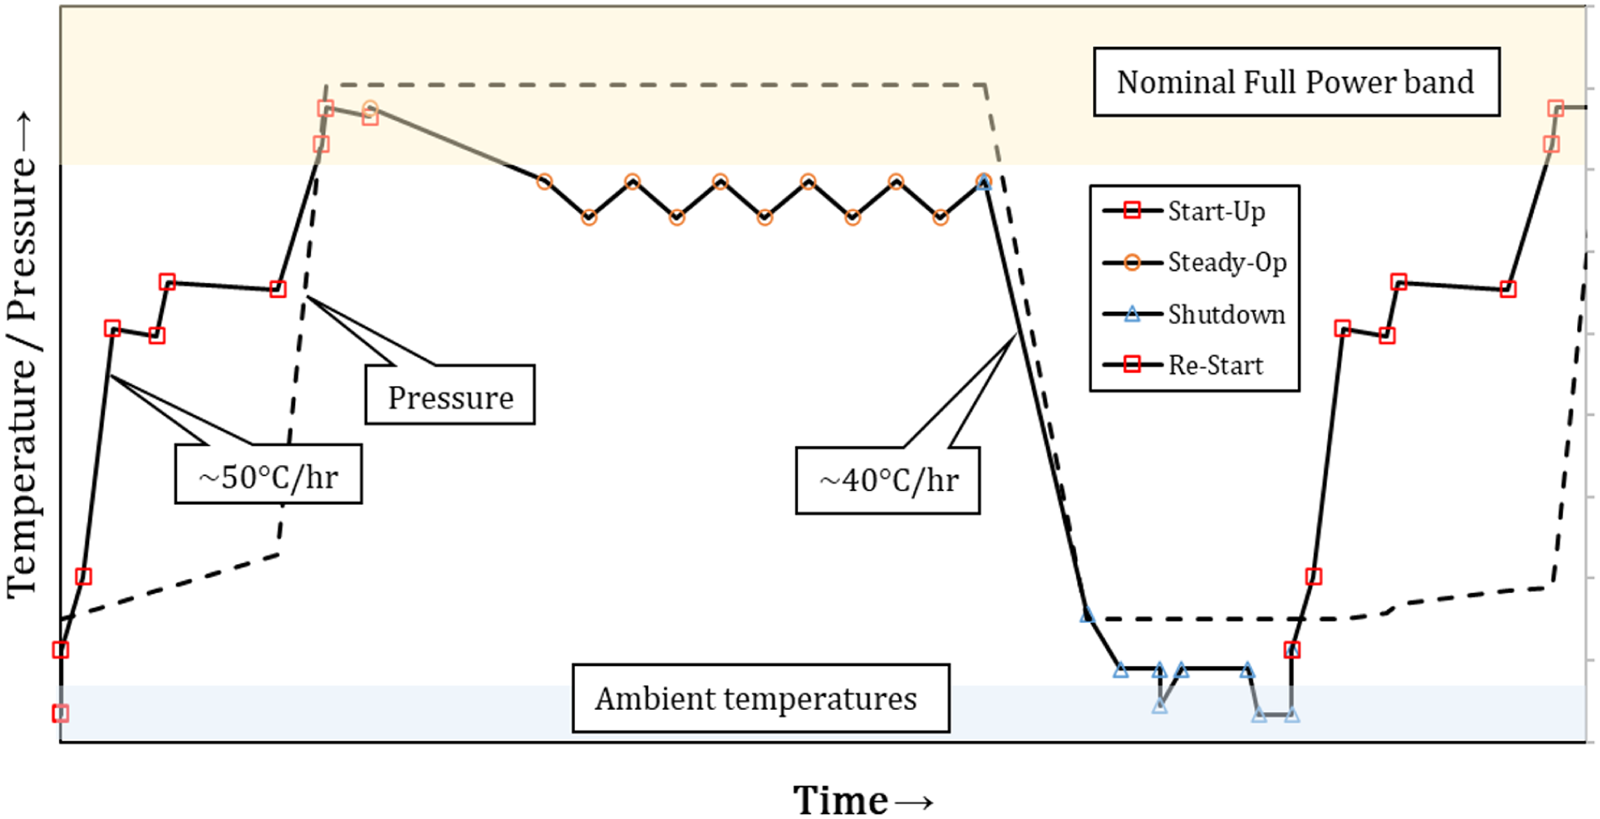
Schematic Loading Cycle.
Approximate WRS distributions have been determined from a thermal analysis of an arbitrary cool-down transient, obtained via an elastic thermal analysis on an uncracked model with an undeformed mesh (displacements not written to the ABAQUS *.odb file). The ABAQUS *initial conditions, TYPE=STRESS was used to introduce an initial stress (and strain) state. A dummy static step was then run to obtain equilibrium to achieve a self-balancing stress distribution with representative values close to the inside surface. This is reasonable on the basis that the scope here relates to small defects in thick-section components. Two magnitudes of WRS have been used: “moderate” and “high” representing different PWHTs. The peak values are approximately 25% and 58% of the room temperature (lower bound) yield stress respectively (Figure 7).
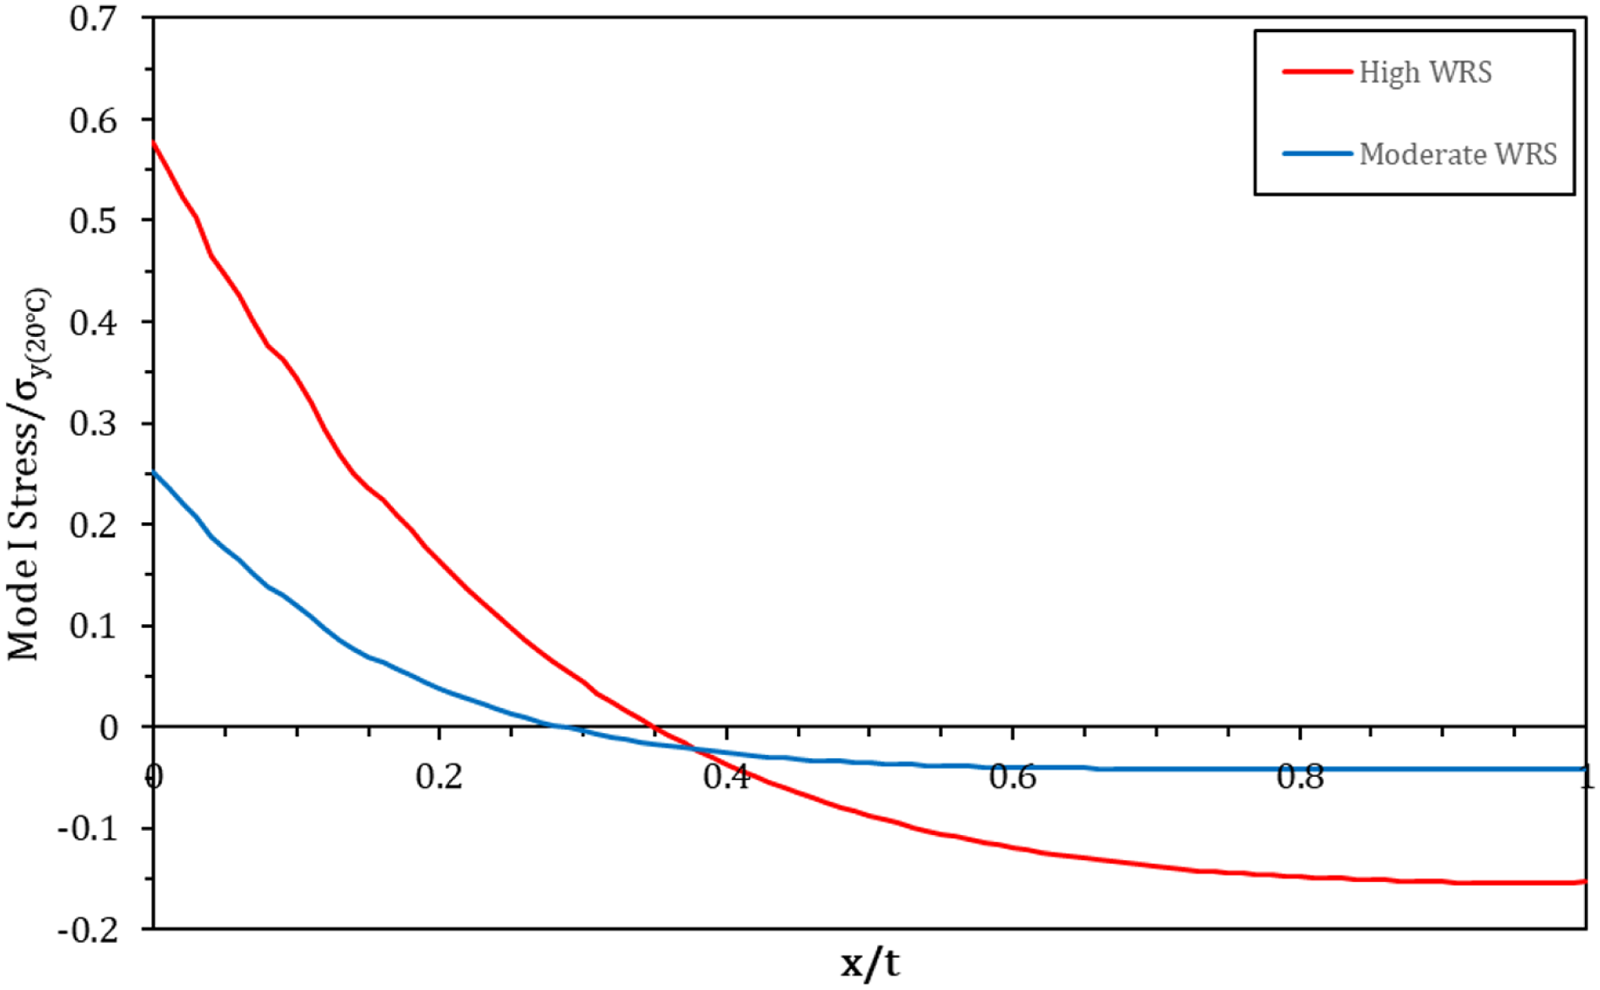
Assumed Residual Stress Profiles.
Results
The approach taken for Cases 1 to 3, is summarised as follows:
Carry out a conventional analysis and assessment to determine Carry out elastic-plastic cracked-body analysis and use the un-cracked elastic analysis to estimate Compare
Un-Cracked Elastic Analysis
Combined elastic thermal and pressure stresses at a point 10mm below the surface are shown in Figure 8 from the un-cracked axisymmetric model. Through-wall stress distributions have been extracted at the time of the maximum (shutdown) and minimum (start-up) stresses for an assessment of Cases 1, 2 and 3.
Normalised Un-Cracked Elastic Axial Stress, 10mm Below Inside Surface.
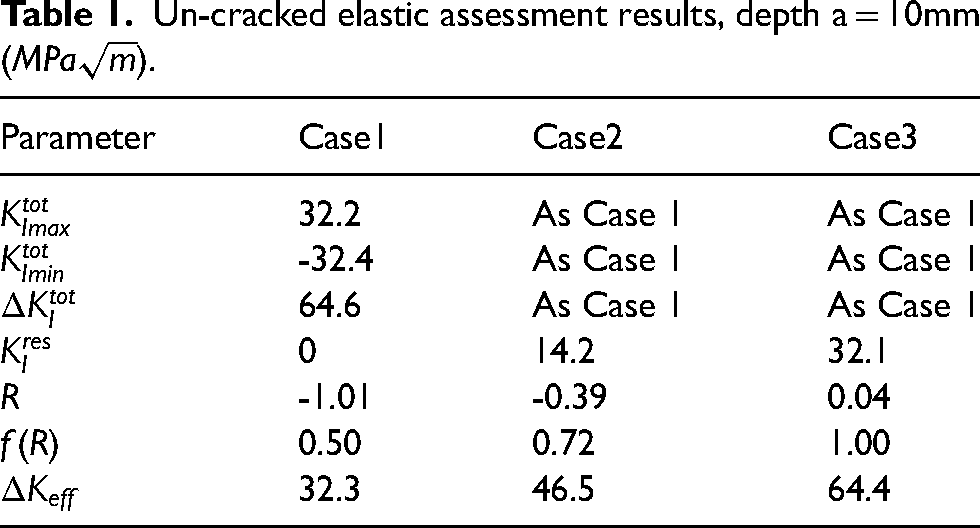
Un-cracked elastic assessment results, depth a = 10mm (
Cracked-Body Elastic and Elastic-Plastic Analysis
The effects of prior operating history are difficult to reliably quantify in an industrial engineering application. Nevertheless, an indication of these effects has been studied here by application of a minimum of 4 complete periods of continuous operation, defined as; start-up (no-prior history and hydro-test not accounted for), a period of steady operation (small fluctuations), and shutdown (refer to Figure 6), followed by a further 3 continuous periods. The 4th cycle is taken to be representative of a stabilised cycle. In practice, 4 cycles could comprise up to approximately 6 calendar years of operation.
It is assumed that FCG only occurs due to energy deposition via reverse cyclic plasticity. For small-scale yielding conditions, most of the crack-tip plastic zone is assumed to cycle elastically after first loading (with an assumption that the cycles are roughly of the same magnitude). Therefore, only material where the stresses exceed twice the yield stress is assumed to adsorb energy and contribute to driving crack growth. Practically, the choice of where to extract these stresses is difficult to reliably obtain due to significant stress variations within the process zone. As a practical engineering approach, the time of maximum and minimum elastic-plastic stress, 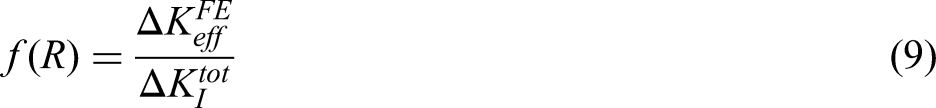
Elastic-plastic axial (S22) stresses have been extracted 50µm ahead of the crack-tip. The distance of 50µm was selected to correspond with the characteristic length “d” for low alloy material in RES-M.
1
Stresses have only been extracted for Case 1. Since the global behaviour of the structure is elastic, in the first instance,
Cracked assessment results, depth a = 10mm (
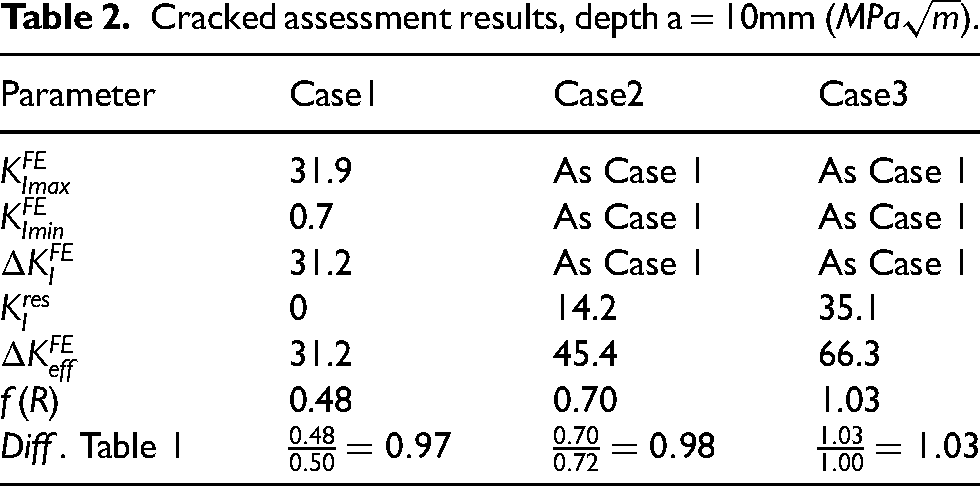
Results from the cracked-body elastic-plastic analyses are within
Alternative Analyses
Two alternative approaches to that used to obtain results in Table 2 are presented to illustrate the challenges for determination of definitive values to be claimed in structural assessments for industrial applications. The first is a slight variation in which the elastic-plastic stress range for each case individually is used to obtain the respective maximum and minimum times to determine
Case Specific Hysteresis Loop Analyses
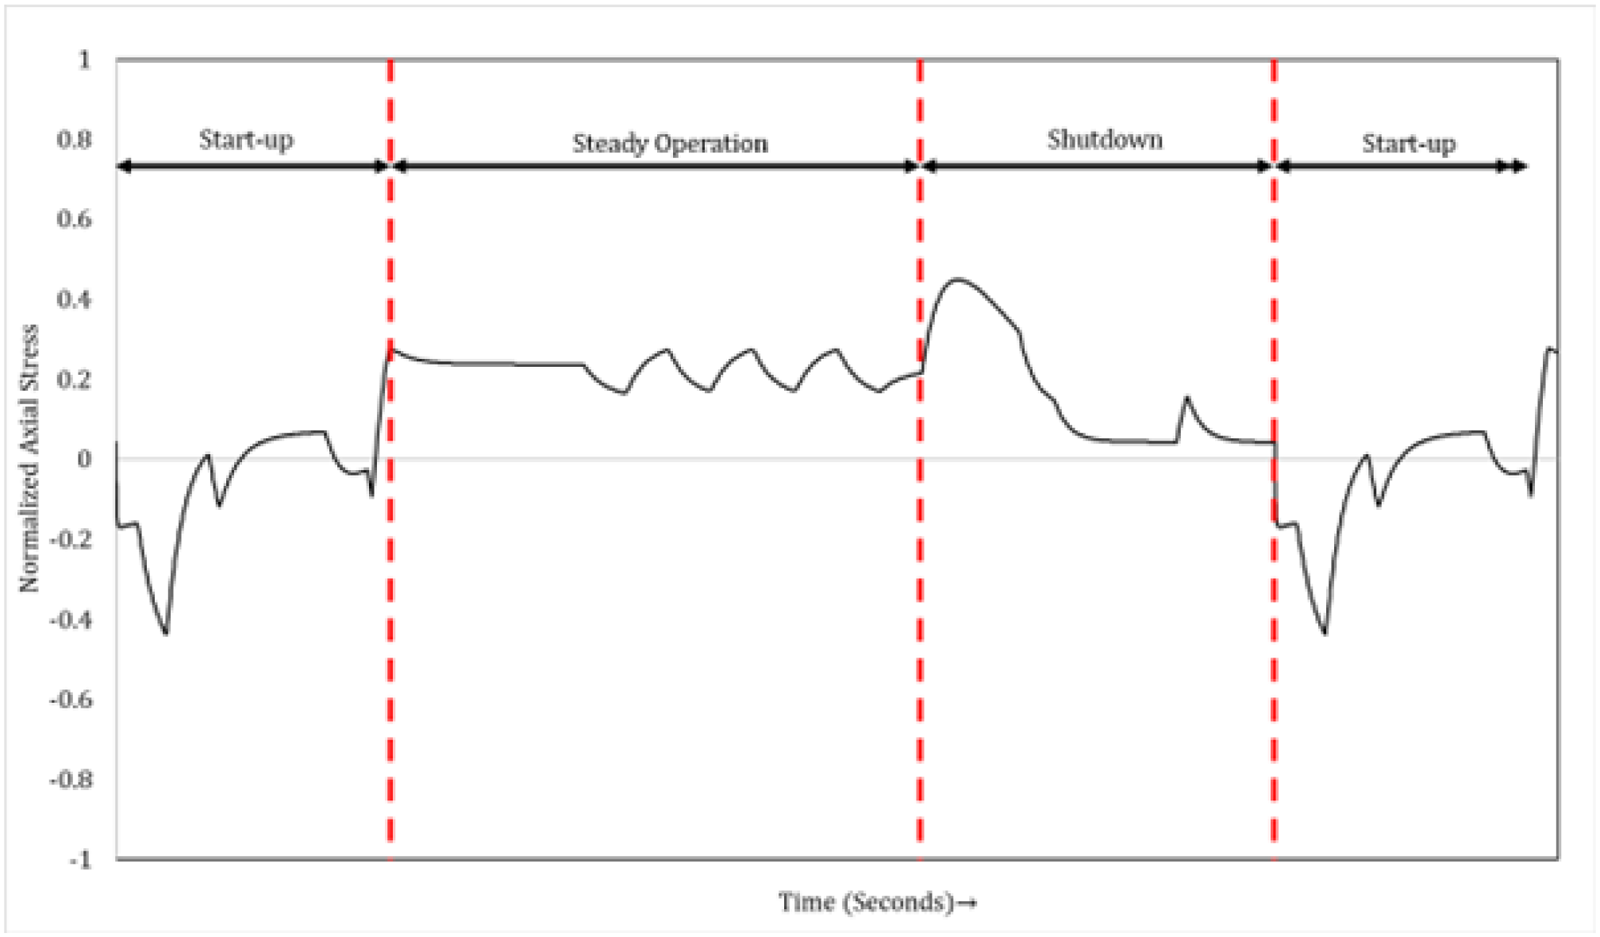
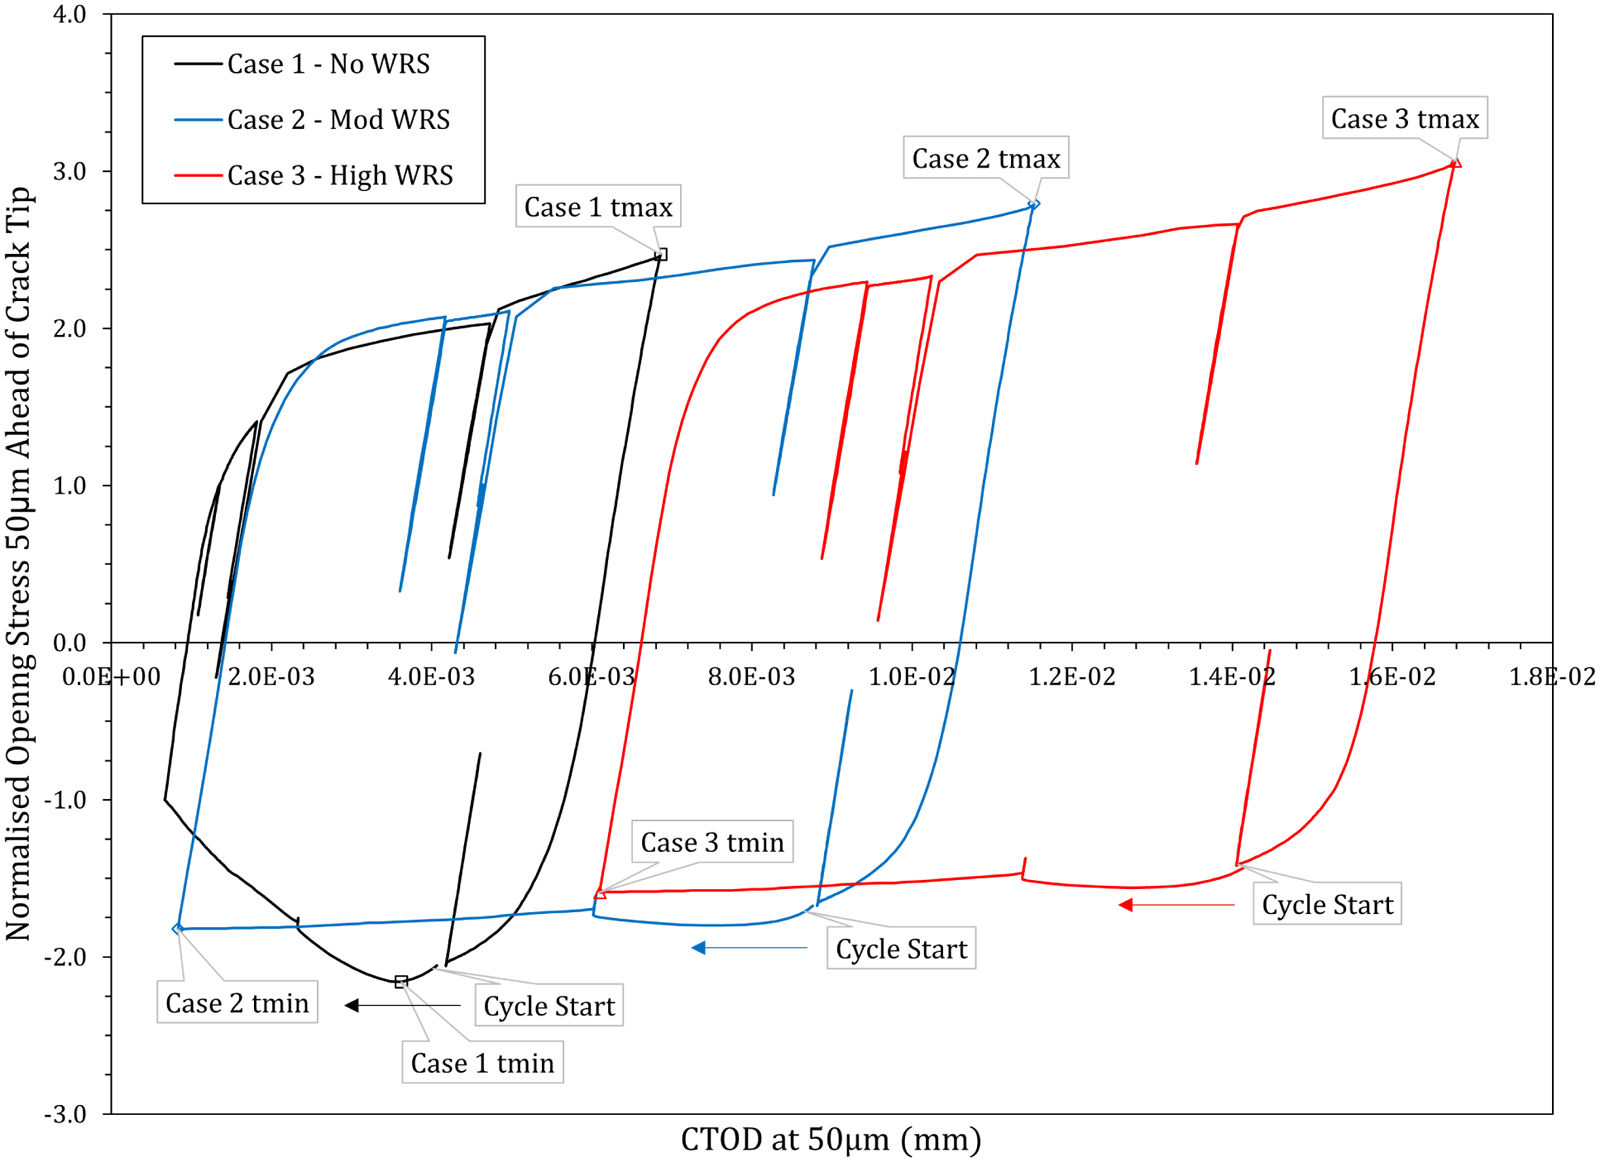
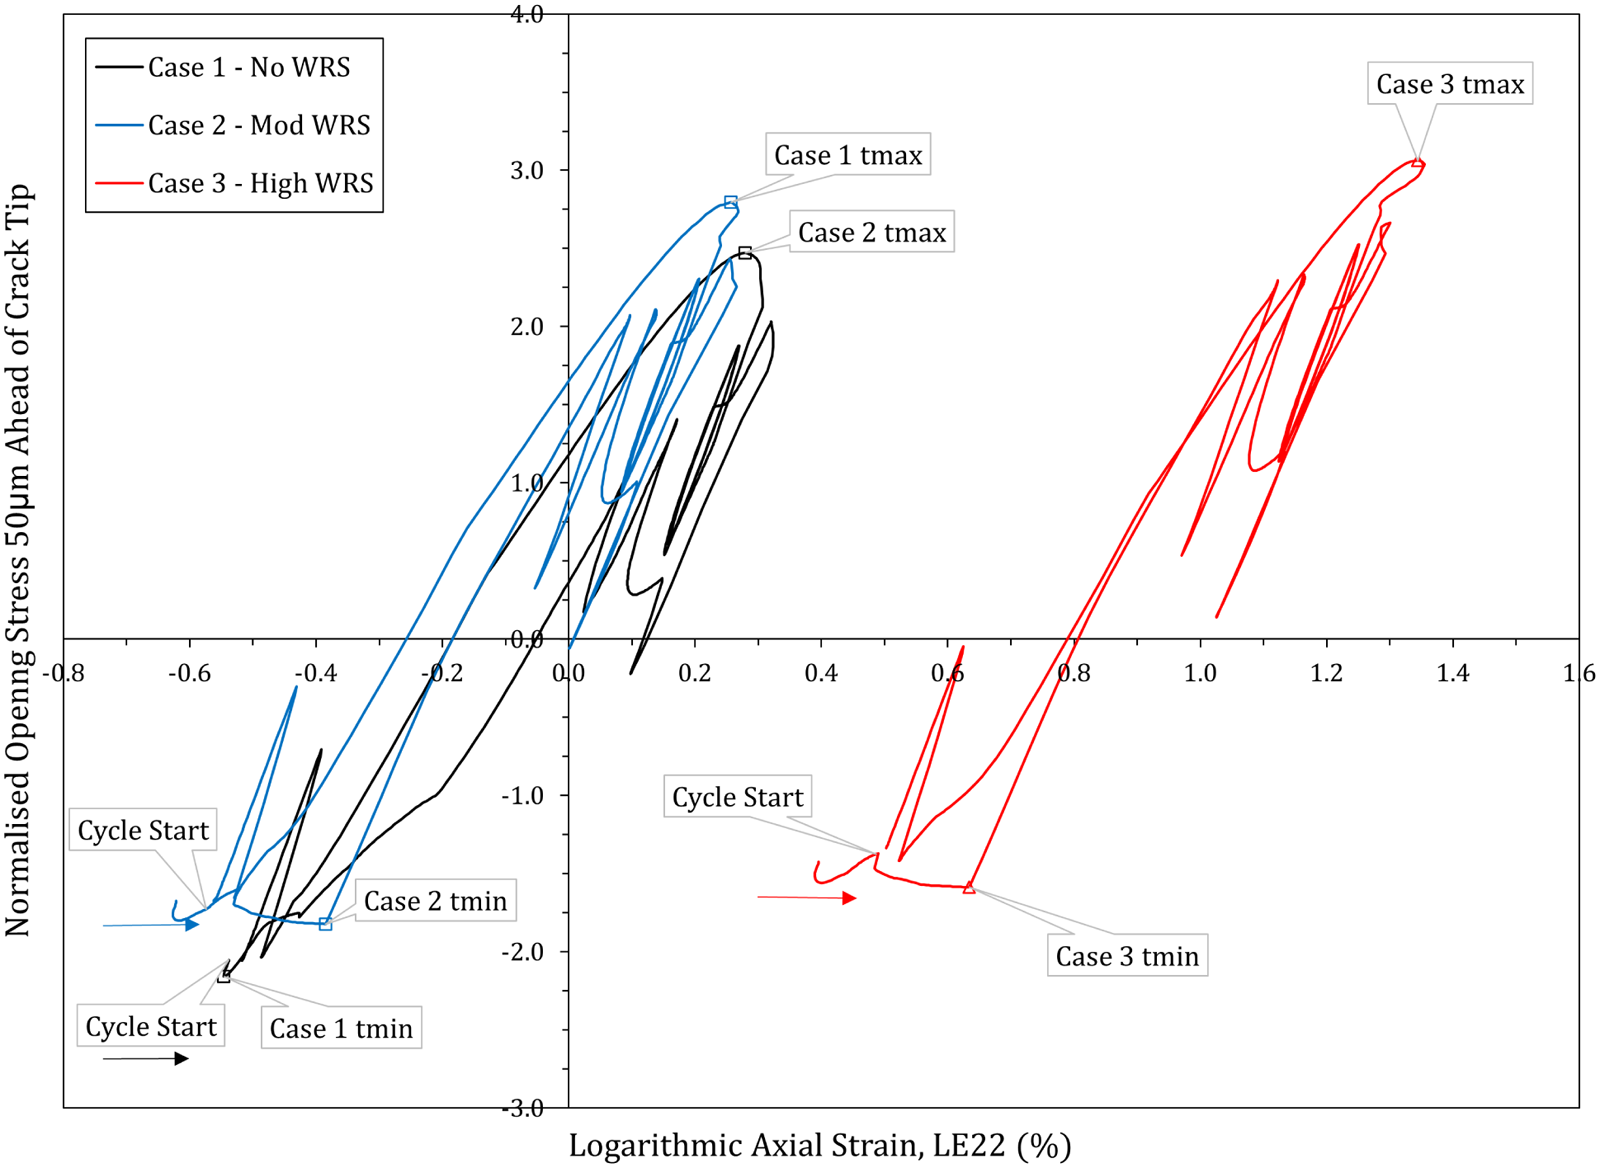
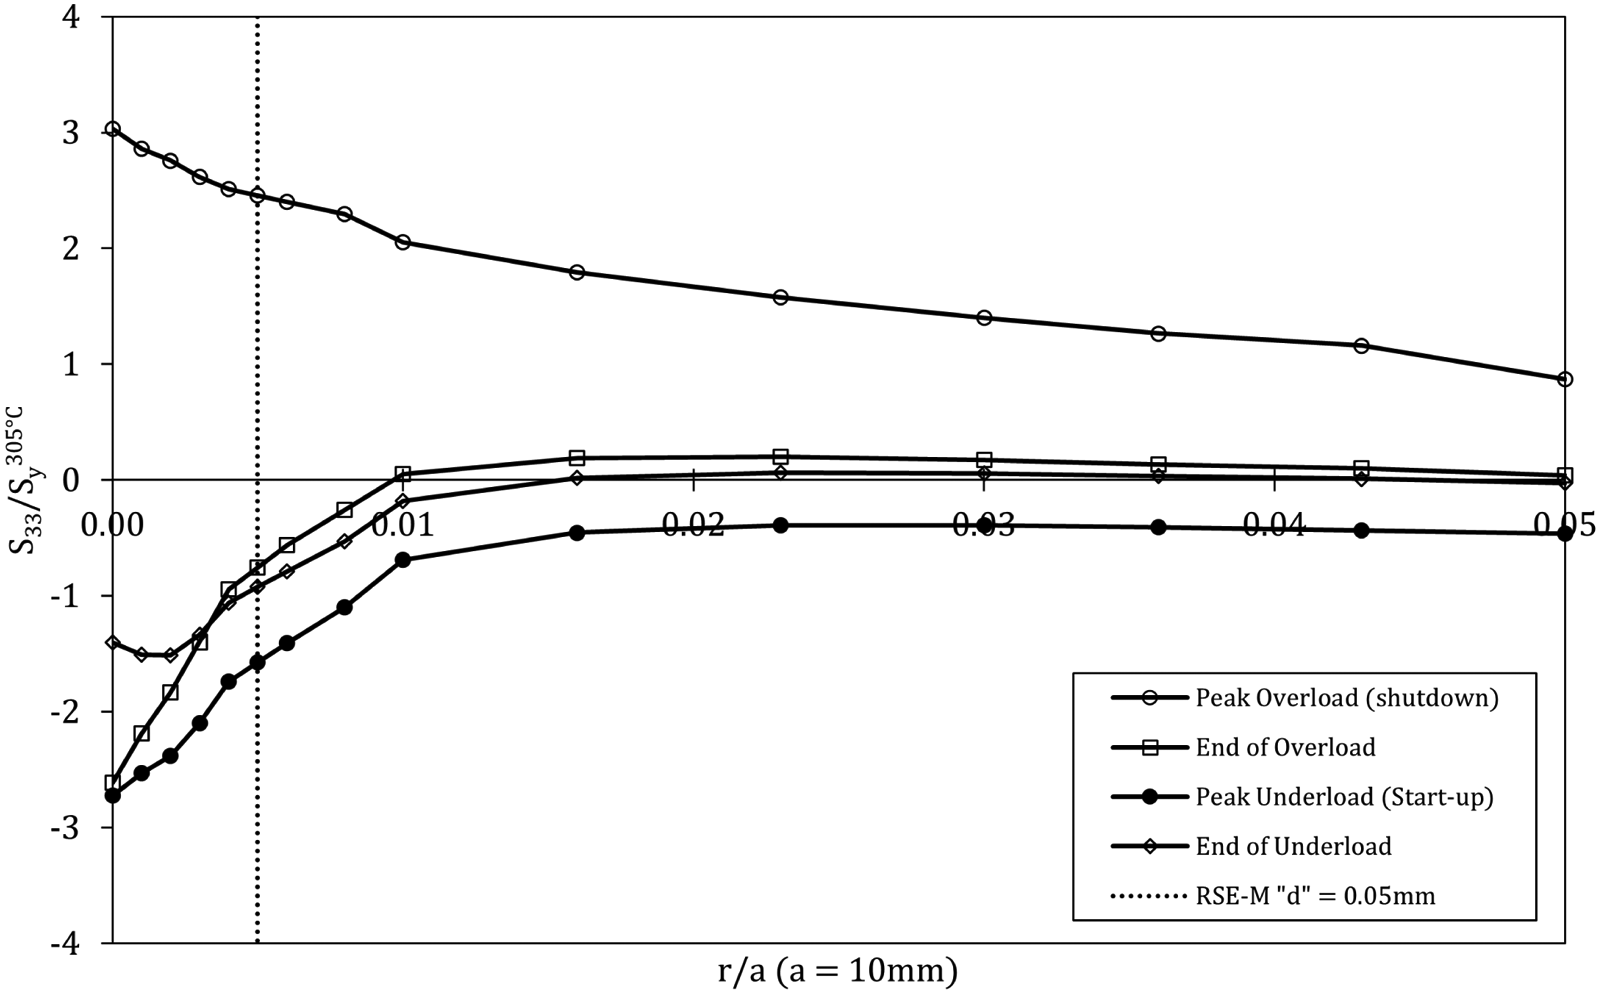
Axial stress-displacement hysteresis loops for the 4th cycle for Cases 1 to 3 are shown in Figure 9. Stresses are again extracted 50µm ahead of the crack-tip, and the displacements are measured 50µm behind the crack-tip. There are several interesting features that can be observed from Figure 9:
In all cases, there is no contact of the crack faces. Mean stress effects in Cases 2 and 3 are evident from the vertical shift of the respective loops. The minimum stress for Case 1 does not correspond to the minimum opening. The additional mean stress in Case 2 results in greater opening range than Case 1, but the range for Cases 2 and 3 are almost identical.
Normalised Axial Stress-Displacement Hysteresis Loops.
As for the main analyses, results have been obtained by extracting un-cracked elastic through-wall stresses at times
Hysteresis loop specific assessment results, depth a = 10mm (
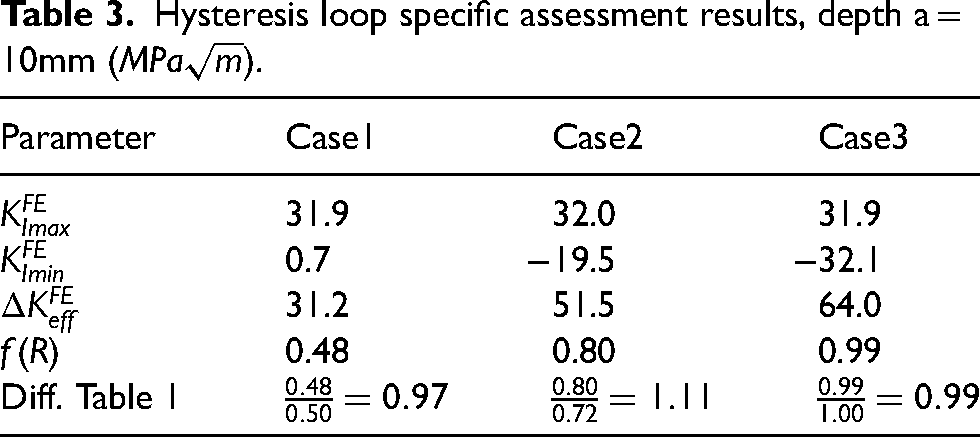
A potential explanation to the notable change in Case 2 results is offered by consideration of the positioning of the stress-strain hysteresis loops in Figure 10. Noting that the stresses in Figures 9 and 10 are only the component perpendicular to the crack, the different positioning of each loop can be attributed to constraint effects. This is confirmed by calculating the stress triaxiality, 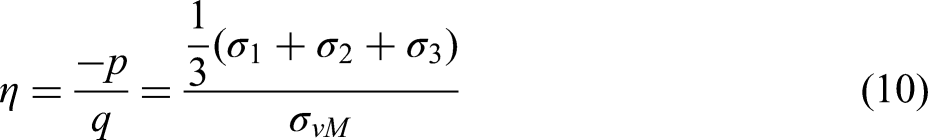
Normalised Axial Stress-Strain Hysteresis Loops.
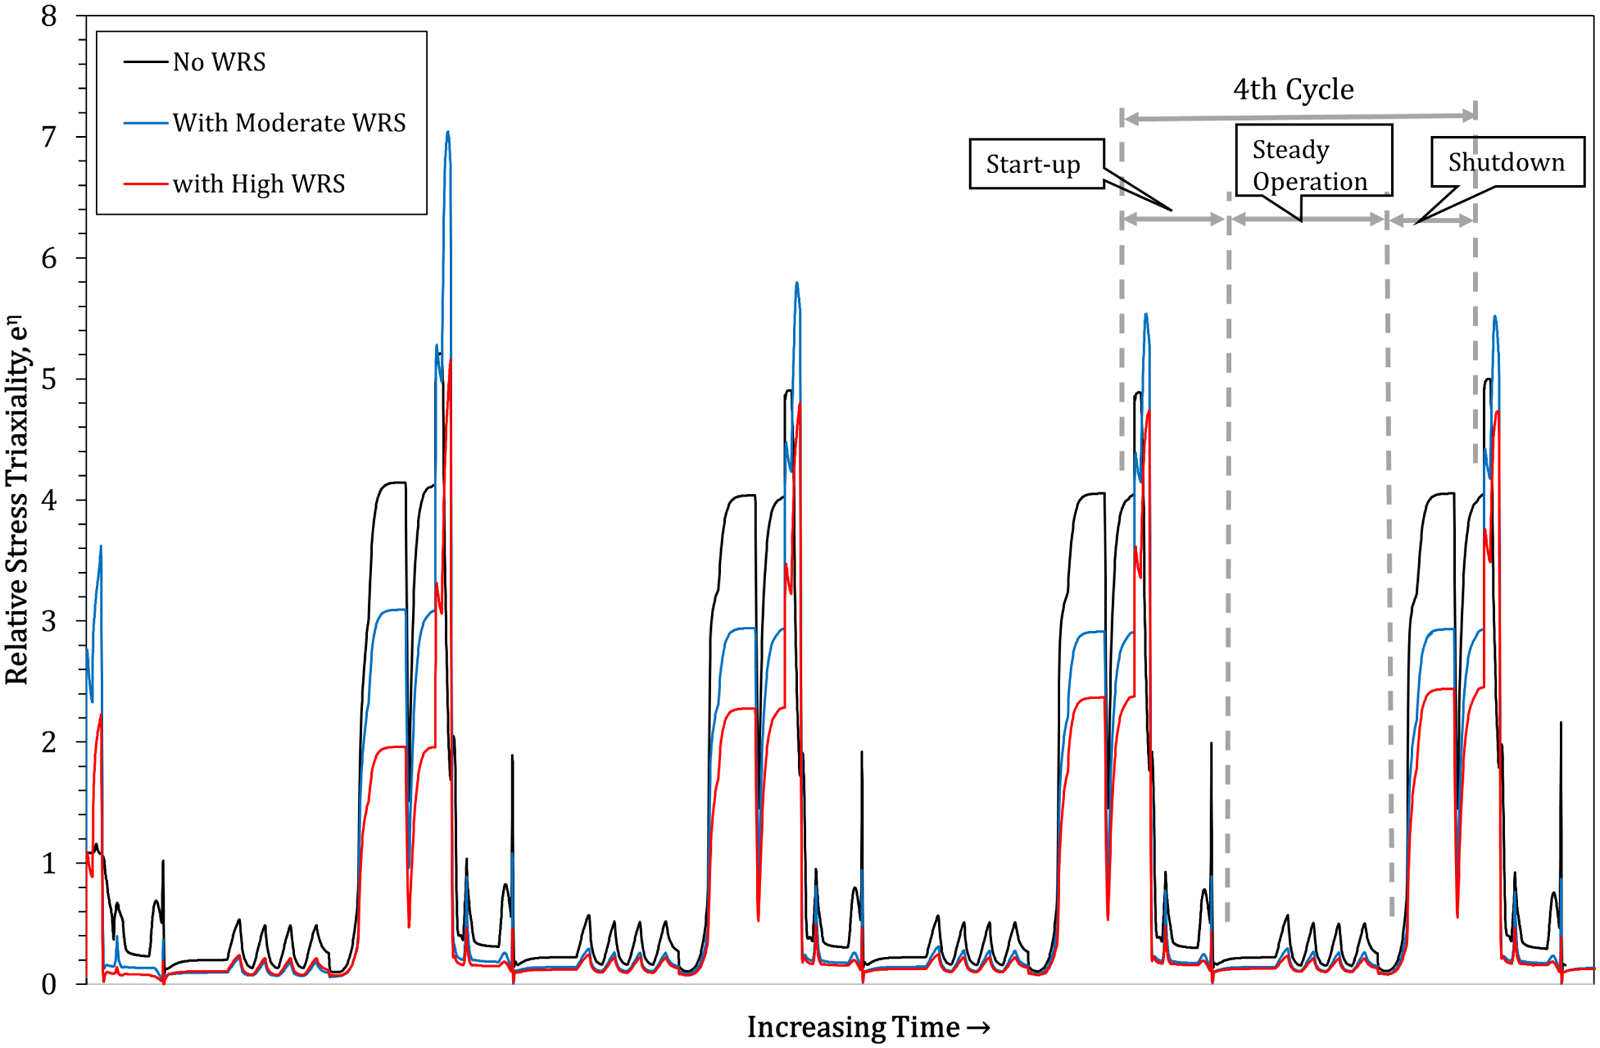
Relative Stress Triaxiality for Each Cycle.
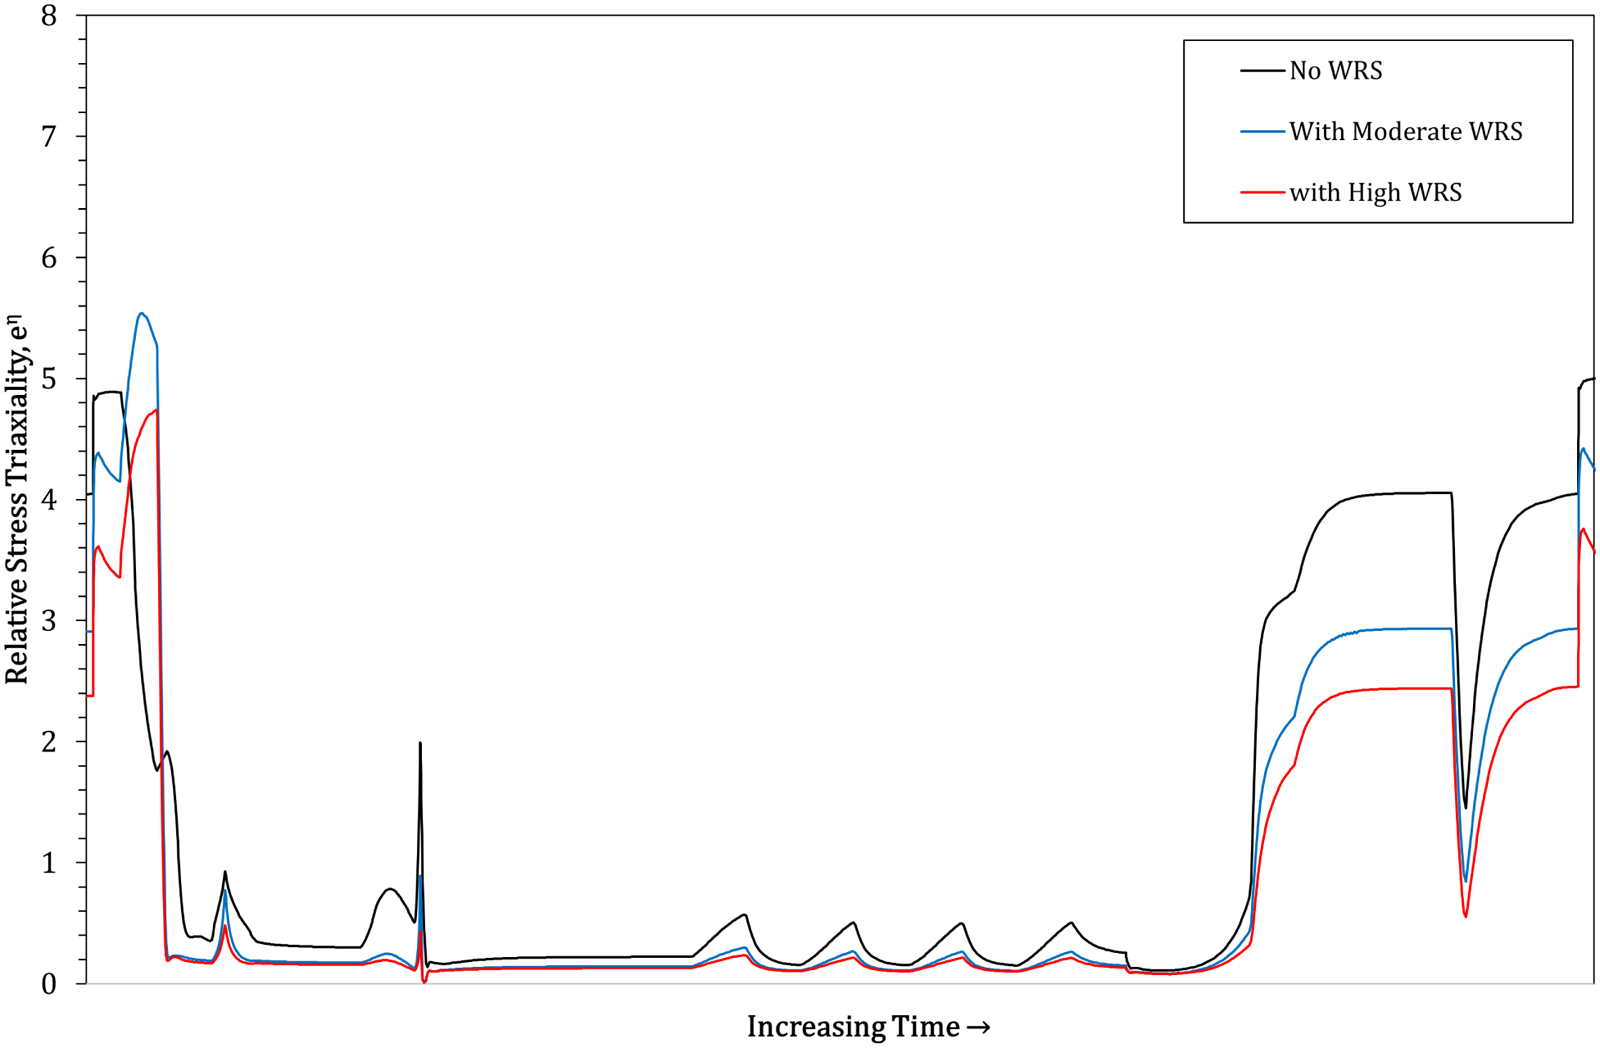
Relative Stress Triaxiality – 4th Cycle.
Estimation of the Plastic Zone
To establish the reasonableness of the results obtained from the analyses here, comparison was made with some publicly available literature. For example, Anderson 7 suggests that during a variable loading sequence overloads can result in retardation of FCG. This effect is reduced when followed by a subsequent under load, which is similar to the conditions for a civil PWR plant. In a global sense, the POC cycle comprises an overload (shutdown) followed by an under load (start-up) with operating load variations considered to be “sub-cycles”. Anderson 7 reports that at the peak of the overload, there are tensile stresses ahead of the crack-tip, which change to a compressive state at the end of the overload. A subsequent under load results in a notable reduction in the compressive stresses. The same demonstration has been carried out here taking Case 1 stresses from the peak of the shutdown transient (max overload), the end of the shutdown (end of overload), the peak of the start-up (minimum under load) and the end of the under load (start of steady operation). The results are presented in Figure 13. The results are in very good agreement with the trends identified in Anderson, 7 though in the case here the end of the under load remains in a compressive state. The differences are due to different loading histories and levels assumed in the respective analyses. Nevertheless, it provides good confidence that the approach used for the analyses of the components here is in agreement with independent publicly available literature.
Normalised Perpendicular Stress Ahead of the Crack-Tip.
It is observed that yielding ahead of the crack is limited to within approximately 0.5mm (at the peak of the overload), and the compressive plastic zone is approximately
At the peak of the overload, the total plastic radius, 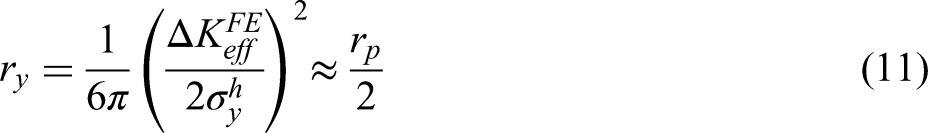
Results Summary
Results of all cases are summarised in Figure 14 together with the complete f(R) values according to RSE-M. It can be seen that in all cases where f(R) has been derived using stresses from the hysteresis loops they are less onerous than the codified values. For Case 1, the calculated f(R) values show the code to be conservative by approximately 3%. However, the Case 1 assessment based on an estimate of the plastic zone size provides a result approximately 13% in excess of the code values.
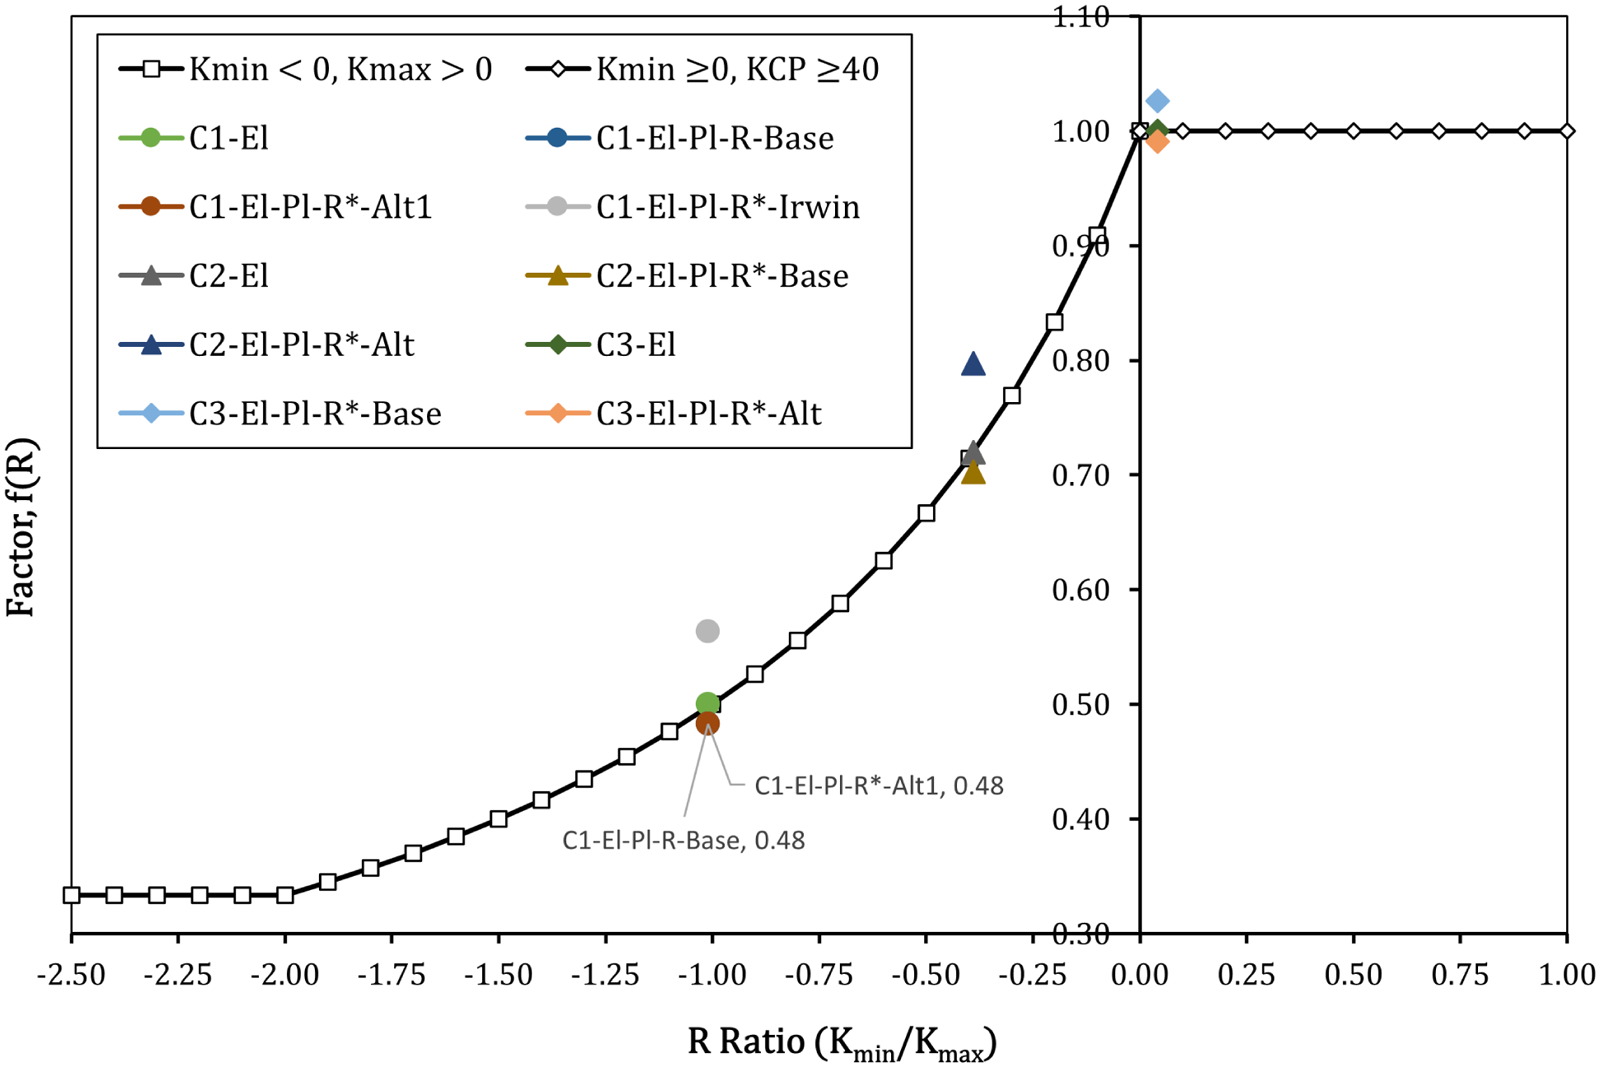
Comparison of RSE-M f(R) and Results from All Cases Plotted Against Nominal R-Ratio.
Case 2 and 3 results vary between being suitably conservative i.e. within 2% of the codified result to values in excess of the code by up to 9%. The implications of these levels of variation are discussed in the following section.
Discussion
Considerations for Structural Assessments
Routine structural assessments typically used to substantiate plant and equipment employ more simplistic analyses than those performed here. Thus, one may conclude that this work would be expected to yield more accurate results or reduced uncertainty. To an extent, ”good agreement” depends on the level of reliability being claimed or required. The work here emphasises that caution should be exercised when interpreting results from detailed analyses alone in support of safety claims on components requiring the highest reliability, but the analyses are extremely insightful.
When considering the results from the conventional codified assessment route, the detailed analyses showed both conservative and non-conservative results depending on the approach taken to post-process the output. It has been observed that constraint effects, in the form of stress triaxiality, appear to have a notable impact on the determination of
Even for a relatively simple structure, such as the cylinder considered here, modelling behaviour of a crack in 3D is complex. The analysis here used an axisymmetric defect to remove some of the complexity associated with opening/closing variations along the crack front. Nevertheless, even when such behaviour is captured it should be noted that the defect shape remains a conservative idealisation of an actual defect. These types of approximations of reality should be at the forefront of the mind of any analyst when interpreting modelling results. Good practice would suggest that modelling should be validated with experimental evidence (and vice versa). However, aside from issues of transferability of small-scale testing results to real components, loading conditions of the large components of a civil PWR primary circuit are difficult to replicate in small-scale tests. The actual loading is a combination of primary and secondary loads, in which the latter is dominant. Although the primary stresses are not dominant, they have been shown in this work to have a significant impact on the positioning of the stress-strain hysteresis loop, and thus should not be neglected. The secondary loads are due to through-wall thermal stresses caused by transient temperatures, and as such can be considered short-range and displacement-controlled. It is possible to evaluate fracture behaviour using small-scale tests under displacement-controlled loading, however, such tests are difficult to design when the “displacement” in the real structure is due to thermal expansion, in which the variable temperature field gives rise to variations in triaxiality and stiffness due to the change in Young’s modulus.
Whilst the observations from the detailed analyses are of interest, the uncertainties associated with modelling mean that they are not considered to undermine the findings of the more simplified approach when applied in the context of an industrial structural assessment. The principal reasoning for this is that, the detailed analyses provide good general agreement with expected behaviour i.e. plasticity induced crack closure in a representative structure results in a reduction in
Conclusions
An investigation of the RSE-M crack closure parameter, f(R), originally obtained using CT specimens has been performed by comparing with results generated from elastic-plastic cracked body finite element analyses of a structure representative of a large PWR primary circuit component.
Determination of
Potential further explanation of the results was undertaken with the aim of providing more insight to the mechanics of f(R). The outcome of this was that there are potential effects of constraint when determining
Footnotes
Abbreviations
Acknowledgments
The Author is grateful to EdF Energy for permission to publish this work carried out on their behalf, and to colleagues in Kinectrics, EdF and Framatome for their kind support.
Author contribution(s)
Funding
The author(s) received no financial support for the research, authorship, and/or publication of this article.
Declaration of conflicting interests
The author(s) declared no potential conflicts of interest with respect to the research, authorship, and/or publication of this article.