
Abstract
Severe plastic deformation (SPD) techniques have been widely used to enhance strength and promote grain refinement in metals. Multi-Directional Forging (MDF), based on successive compressions with strain path changes, enables tailoring of microstructure and mechanical properties by controlling strain amplitude (Δɛ) and total strain (ɛt). In this study, copper (99.8%) was processed at room temperature using two MDF amplitudes: Δɛ ≈ 0.075 and Δɛ ≈ 0.50 with ɛt between 0.075–3.6 and 0.50–3.0, respectively. Hardening in early compressions is mainly due to dislocation tangles and LAGBs. A higher Δɛ intensifies cross-Bauschinger effects and produces a bimodal microstructure with recrystallized and deformed regions after ɛt ≈ 3.0. The results contribute to understanding how Δɛ and ɛt influence microstructure and strength in copper during MDF.
Keywords
Introduction
Metals with refined grain structures typically exhibit enhanced mechanical strength. As a result, severe plastic deformation (SPD) techniques have been widely explored, as they introduce a high dislocation density, promote work-hardening and reduce the average grain size by converting the dislocations substructures into High Angle Grain Boundaries (HAGBs).1,2 In submicrometer-grained materials the occurrence of thermally-activated phenomena alter the underlying strengthening mechanisms, adding complexity to their mechanical behavior and characterization. 3
Common SPD methods include Equal Channel Angular Pressing – ECAP, 4 High Pressure Torsion – HPT, 5 Accumulative Roll Bonding – ARB 6 and Multi-Directional Forging – MDF.7,8 MDF involves sequential compressive deformation with the same amplitude (hereafter denoted by “Δɛ”) along the three orthogonal axes (X, Z and Y) of parallelepiped specimens. Every set of 3 orthogonal compressions constitutes a “MDF cycle”, which restores the specimen to its original dimensions.9,10
According to Sakai et al., 7 MDF offers several advantages over other SPD techniques: (i) stress-strain curves behavior and microstructural evolution can be investigated for each compression step, (ii) the process is relatively simple and compatible with standard testing equipment or industrial press, and (iii) it can be scaled up for industrial applications. However, free-compression MDF often leads to lateral bulging and geometric distortion of the specimens, making strain measurements difficult.2,11 This issue has been addressed through the use of a channel die in a method known as Cyclic Channel Die Pressing – CCDP, 12 which imposes plane strain conditions but alters the strain path compared to free compression MDF. To overcome this, a novel confining die has recently been developed that maintains the same strain path as free MDF while controlling lateral flow.13,14
A pioneering study by Armstrong et al. 15 investigated free MDF with intermediate specimen re-machining in commercial-purity Aluminum, using Δɛ values from 0.075 to 0.33 and comparing unidirectional and multidirectional loading. Since then, numerous studies have examined microstructural evolution, mechanical properties and thermal stability at various homologous temperatures.8,11,16–25 For copper – the focus of the present study – it has been shown that higher strain amplitudes (Δɛ) and number “n” of MDF cycles (and therefore the total applied strain, ɛt = 3nΔɛ) enhance grain refinement8,17,23 but reduce thermal stability.24,26 These results have been linked to increases in stored energy as Δɛ and ɛt rise, and to microstructural transition from dislocation tangles and Low Angle Grain Boundaries (LAGs) generated in the initial MDF cycles to structures dominated by HAGBs for higher numbers of MDF cycles, which display a higher mobility under thermal activation than LAGBs. 26 For instance, it has been shown 24 that copper processed with MDF under a low strain amplitude Δɛ ≈ 0.075 up to ɛt ≈ 1.8 exhibits a similar hardness but better thermal stability than when processed for ɛt ≈ 10.8. In other words, fewer MDF cycles - which is economically advantageous - may also yield improved thermal performance.
Commercially pure copper was selected in this study due to its well-known physicochemical attributes like high ductility, excellent electrical and thermal conductivity and a face-centered cubic (FCC) crystal structure, which enables well-characterized mechanical response under complex deformation paths. These characteristics render copper a model material in experimental studies involving processes such as MDF, facilitating in-depth analysis of strain accumulation, dislocation density evolution and grain refinement. Furthermore, thermomechanical processing of copper via severe deformation routes like CCDC, a plane–strain MDF process, has shown to enable the simultaneous enhancement of mechanical strength and the retention of electrical conductivity above 90% IACS (International Annealed Copper Standard) 26 an essential requirement for applications demanding optimized electromechanical performance.27,28 Thus, copper not only supports fundamental understanding of microstructural evolution but also maintains technological relevance in strategic sectors of contemporary engineering, including energy-efficient systems and advanced manufacturing technologies.
Fine-tuning the MDF processing conditions for copper, particularly Δɛ and ɛt, is essential to establish cost-effective routes that yield targeted microstructures and mechanical properties. To date, no studies have systematically compared the first MDF cycle at low and high Δɛ, with their counterparts at higher ɛt. Therefore, the present work investigates the mechanical behavior and microstructural evolution of copper processed under (i) 1, 2, 3 compressions in the first MDF cycle and for 48 compressions (16 MDF cycles, ɛt ≈ 3.6) under Δɛ ≈ 0.075 and (ii) 1, 2, 3 compressions in the first MDF cycle and 6 compressions (2 MDF cycles, ɛt ≈ 3.0) under Δɛ ≈ 0.50.
It should be emphasized that the selected strain amplitudes (Δɛ ≈ 0.075 and 0.50) represent two distinct deformation regimes: one favoring thermal stability and delayed refinement (Δɛ ≈ 0.075) 24 and the other enabling higher dislocation density and strain energy accumulation. Notably, the parameters strain amplitude (Δɛ) and total strain (ɛt) play a central role in describing the severity and cumulative effects of the MDF process. Here, Δɛ is defined as the equivalent plastic strain imposed per uniaxial compression, while ɛt corresponds to the total accumulated strain after n MDF cycles, with each cycle composed of three orthogonal compressions (thus, ɛt = 3n·Δɛ). So, in this study Δɛ ≈ 0.075 or 0.50 refers to the equivalent plastic strain imposed in each individual compression, according to the selected forging schedule. For a given total strain (ɛt), a smaller Δɛ requires a greater number of cycles to be reached, which results in higher deformation redundancy. Therefore, the combination of Δɛ and n plays a critical role in governing the balance between strain hardening, recovery and grain refinement during MDF.
To date, no prior study has systematically compared the early (1–3 compressions) and advanced stages of MDF (ɛt ≈ 3.0–3.6) under both low and high strain amplitudes in copper. Remarkably, the present results reveal the occurrence of discontinuous Dynamic Recrystallization (dDRX) during processing at ɛt ≈ 3.0 with Δɛ ≈ 0.50, giving rise to regions of polygonal recrystallized grains and severely deformed areas - a phenomenon not observed at ɛt ≈ 3.6 with Δɛ ≈ 0.075. These findings expand the understanding of strain path-dependent recrystallization mechanisms in FCC metals and support the development of optimized processing strategies aimed at tailoring properties for specific engineering applications.
Experimental procedures
Straining was carried out on commercially pure copper (99.8%) obtained as bars 3 m long and cross section of 15.8 × 15.8 mm. The bars were cut into shorter lengths (≈100 mm) and annealed at 873 K for 2 h.29–31 The specimens were machined with the dimensions in X, Y and Z equal to 13.00 × 12.06 × 12.52 mm for MDF with strain amplitude Δɛ ≈ 0.075 (hereafter referred to as MDF0.075) and 13.00 × 7.88 × 10.12 mm for MDF with Δɛ ≈ 0.50 (hereafter referred to as MDF0.50), keeping the larger dimension parallel to the longitudinal direction of the bar and the other two dimensions parallel to the bar lateral faces.
The MDF dies material was a quenched and tempered AISI D2 steel with hardness 56 HRC, designed so that after each compression the material could be reinserted into the channel and the change in sample dimensions, after each pass, resulted in a strain amplitude of 0.075 for MDF0.075 and 0.5 for MDF0.50 (Figure 1). For each compression, the initial height of 13.00 mm was upset down to 12.06 mm for MDF0.075 and 7.88 mm for MDF0.50. The samples were compressed through 1 (
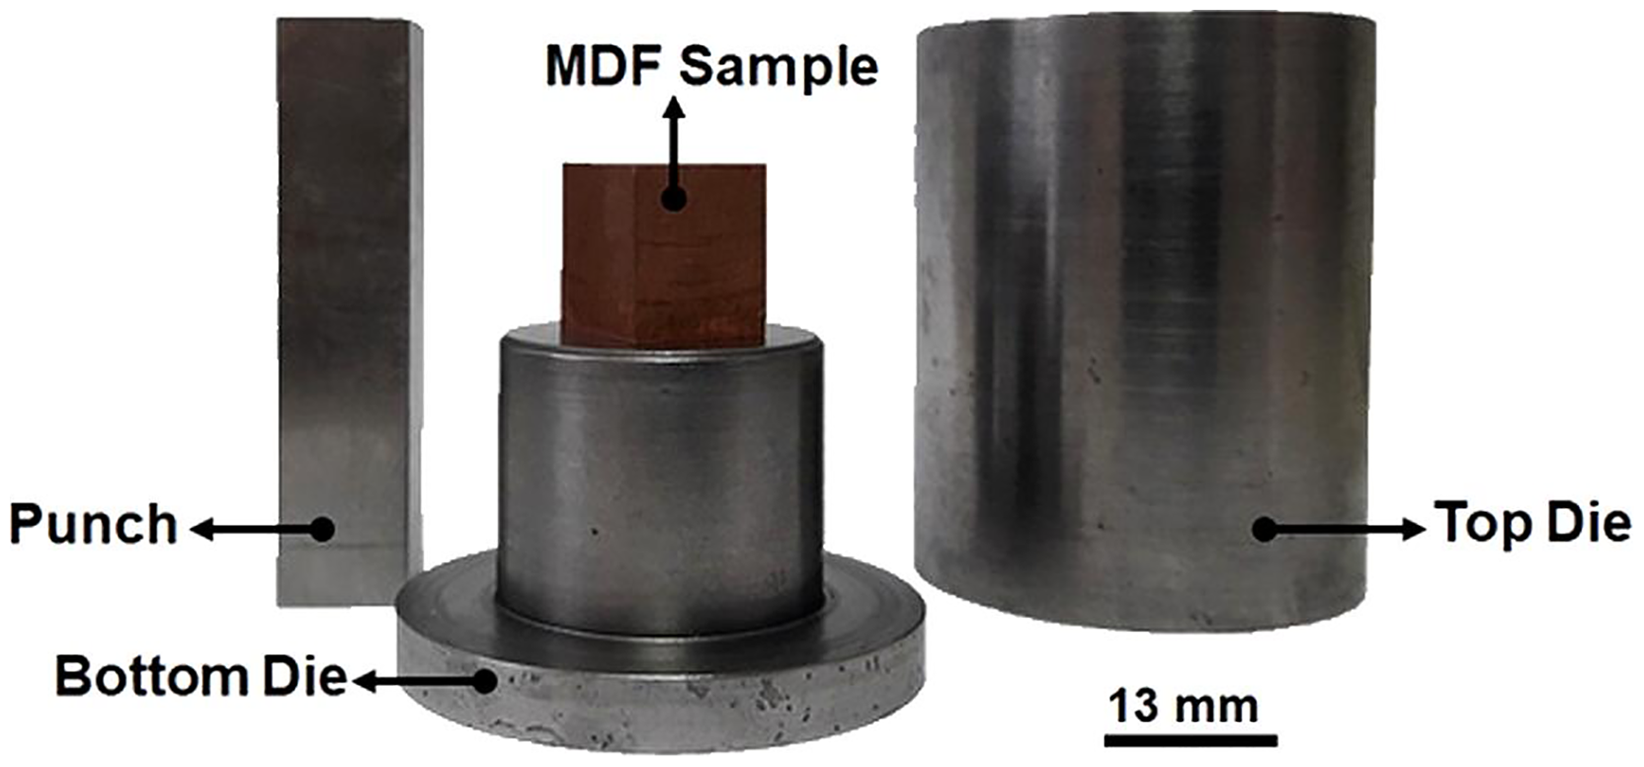
MDF0.50 die.
MDF processing was performed using an INSTRON 5582 testing machine operating at room temperature and at a constant speed of 0.05 mm/s. The die walls and the punch were lubricated using MoS2 paste. The mechanical properties were evaluated using the in situ true stress–true strain curves acquired during the MDF processes. The yield strength (YS), defined at a plastic strain of 0.2%, was determined for each compression step by measuring it in the subsequent step, where the compression was applied in a direction orthogonal to the previous one.
Stress-strain curves and Vickers microhardness (HV) were used to analyze the mechanical properties after processing. In order to gain a better understanding of the mechanical behavior of Copper, a cumulative flow curve was adopted, according to Belyakov et al. 32 and Takayama et al. 33 0.2% offset yield strength (YS) were extracted from the processing stress–strain curves, considering three specimens for each MDF condition. For Vickers microhardness (HV) measurements, a single representative specimen per condition was analyzed. Prior to the microhardness measurements, the Cu specimens were cut along their mid-sections in a plane perpendicular to the X direction. Afterwards, they were prepared following standard metallographic procedures: grinding with 600, 1200 and 4000 grit SiC abrasive papers and polishing with 1 µm diamond paste, followed by etching in a solution consisting of 65 ml concentrated H2SO4, 16 g K2Cr2O7, 3 g NaCl and 800 ml distilled water. 34 The measurements were recorded using a FUTURE TECH – FM 700 microhardness tester by applying a load of 500 gf for 30 s. Hardness measurements were carried out along the vertical and horizontal symmetry lines of each sample at positions separated by ≈2 mm.
Microstructural analyses covered Optical Microscopy (OM), Electron Backscattered Diffraction (EBSD) and X-Ray Diffraction (XRD) performed on the central region of the specimen. OM employed a Union model VERSAMET 3 microscope and EBSD was conducted with Scanning Electron Microscope (SEM) FEI Quanta 200 FEG with a QUANTAX EBSD Bruker analysis system and step size between 47 and 180 nm. Data were processed with the ATEX 35 (Analysis Tools for Electron and X-ray diffraction) software, where High Angle Grain Boundaries (HAGBs) and Low Angle Grains Boundaries (LAGBs) were taken as those with disorientations (ϴ) > 15° and between 2° and 15°, respectively. The average grain size (D) was obtained through the area fractions generated by the ATEX software. 35
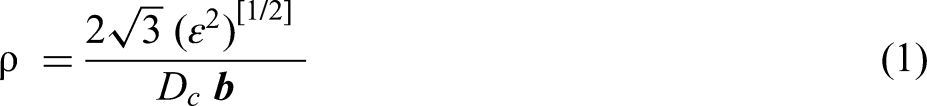
X-Ray Diffraction (XRD) was conducted in a single representative specimen per condition using a PANALYTICAL diffractometer with Cu Kα1 radiation (wavelength: λ = 0,154056 nm), for quantitative microstructural characterization, enabling the calculation of the dislocation density
This technique involves assumptions and potential sources of error, including instrumental broadening, peak overlap and anisotropic strain effects. In the present work, instrumental effects were corrected using a high-purity silicon (Si) standard sample and full-pattern fitting was performed using MAUD software over a broad angular range (2θ = 30°–140°), incorporating multiple reflections to reduce orientation-dependent artifacts. The use of the MAUD (Materials Analysis Using Diffraction) software to analyze the XRD data allowed the calculation of the average crystallite size (Dc) and of the lattice microstrain (ɛ2)[1/2], based on the Rietveld method. These values were utilized for the calculation of the dislocation density
The samples for XRD experiments were cut from the central region perpendicularly to the largest dimension of the specimen and then cut into the slices 5 mm thick, which were then ground, polished and etched in the same way as previously described.
Results
Figure 2(a) and (b) show the true stress - true strain curve for commercially pure Copper after 48 MDF0.075 compressions and 6 MDF0.50 compressions, respectively. In these figures, the curves in blue correspond to the individual compressions in the X, Z and Y directions, while the black curves correspond to the envelope flow curve for cumulative strains. There is a marked increase in the slope of the individual compression curves at the end of each step. This is related to the triaxiality of stress caused by the contact of the specimen with the die walls and, therefore, it was not considered in the construction of the cumulative flow curve.8,14,23
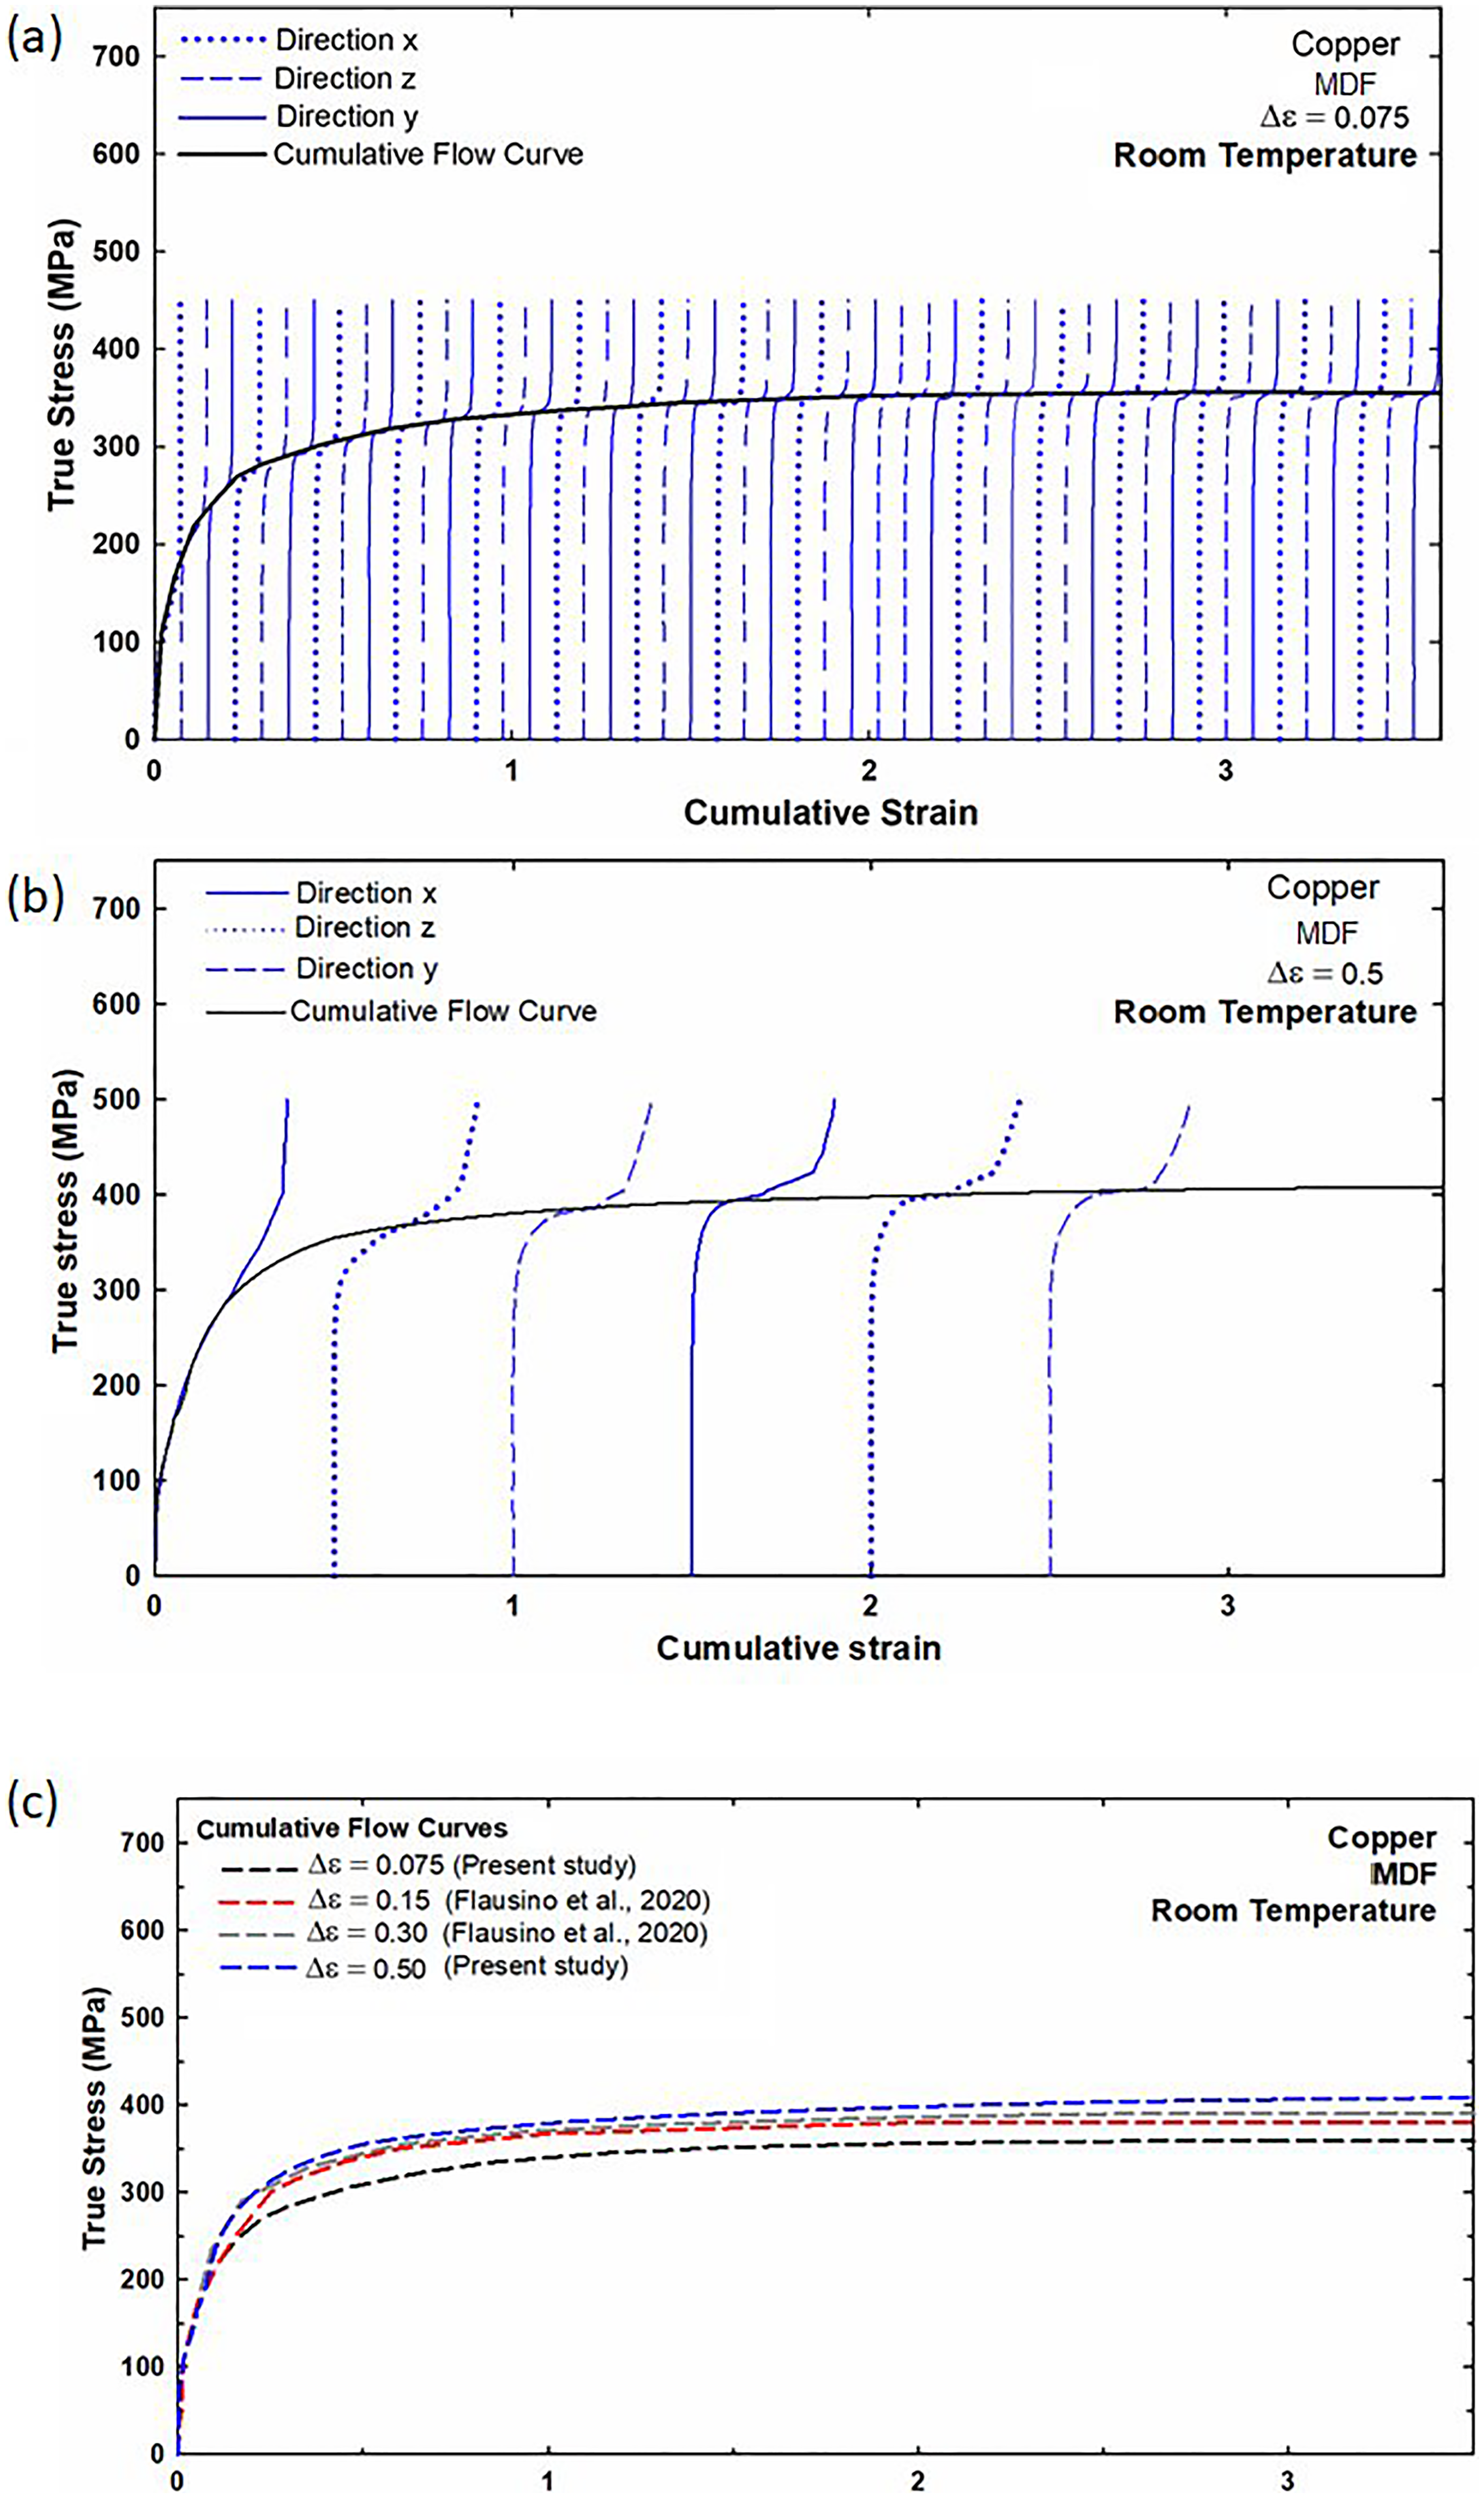
Figure 2(c) displays the envelope stress-strain curves for MDF0.075 and MDF0.50, as well as those for strain amplitudes Δɛ ≈ 0.15 and 0.30, extracted from the literature. 23 In all cases there is an initial pronounced work hardening of the material, followed by a slow flow stress saturation, which rises as Δɛ is increased.
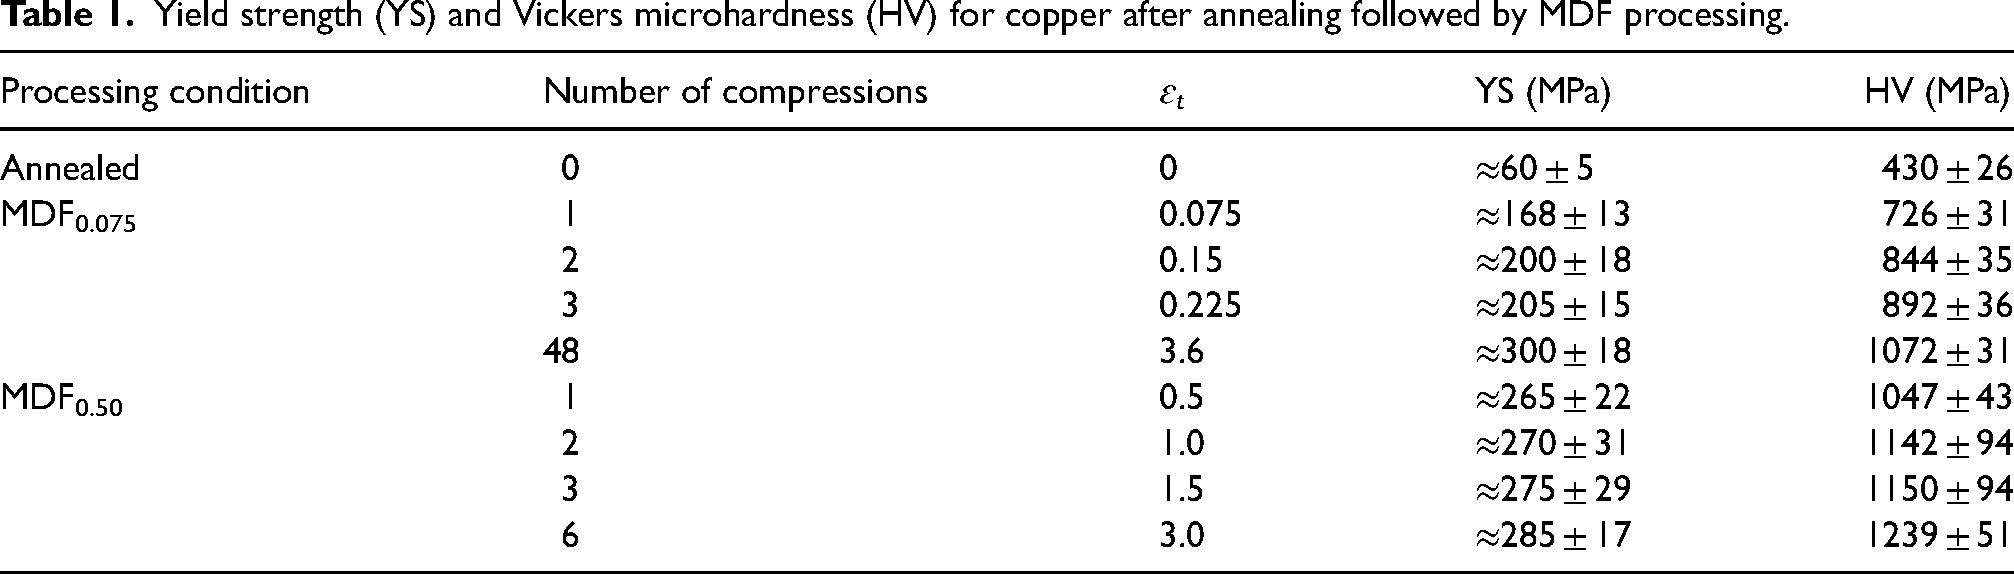
Table 1 shows values of the yield strengths a 0.2% plastic strain (YS) and Vickers microhardnesses (HV) for annealed and processed Copper for the various conditions in the present experiments. When compared with the initial annealed condition, the data for the first cycle (compressions 1, 2, and 3) indicate that a higher strain amplitude in MDF results in higher values of yield strength (YS) and microhardness. For instance, after the first pass, the increase in YS and HV is ≈180% and ≈69%, respectively, for MDF0.075, whereas for MDF0.50, the increase is ≈342% and ≈144%, respectively. The present YS and HV data are consistent with those reported in the literature for copper processed at room temperature by MDF with Δɛ ≈ 0.075, 0.15 and 0.30. 24 Six compressions of MDF0.50 (ɛt ≈ 3.0) leads to a YS ≈ 8% lower than that observed after 48 compressions of MDF0.075 (ɛt ≈ 3.6), but the hardness of the former is higher. This contradiction will be treated in the discussion section of this paper.
Yield strength (YS) and Vickers microhardness (HV) for copper after annealing followed by MDF processing.
Since increases in mechanical strength can be related to decreases in average grain size through the Hall-Petch equation, optical microscopy and EBSD analysis were used to correlate the microstructural characteristics with the mechanical changes observed in the present research. Figures 3–5 exhibit, respectively, optical microscopy images, Orientation Imaging Microscopy (OIM) images and boundary maps for Copper specimens after annealing and subsequent processing by 1, 2, 3 and 48 compressions of MDF0.075 and 1, 2, 3 and 6 compressions under MDF0.50. In Figure 5, HAGBs (ϴ > 15°) are displayed in blue in the boundary maps, whereas LAGBs are presented in green if 5 < ϴ < 15° or in red if 2 < ϴ < 5°.

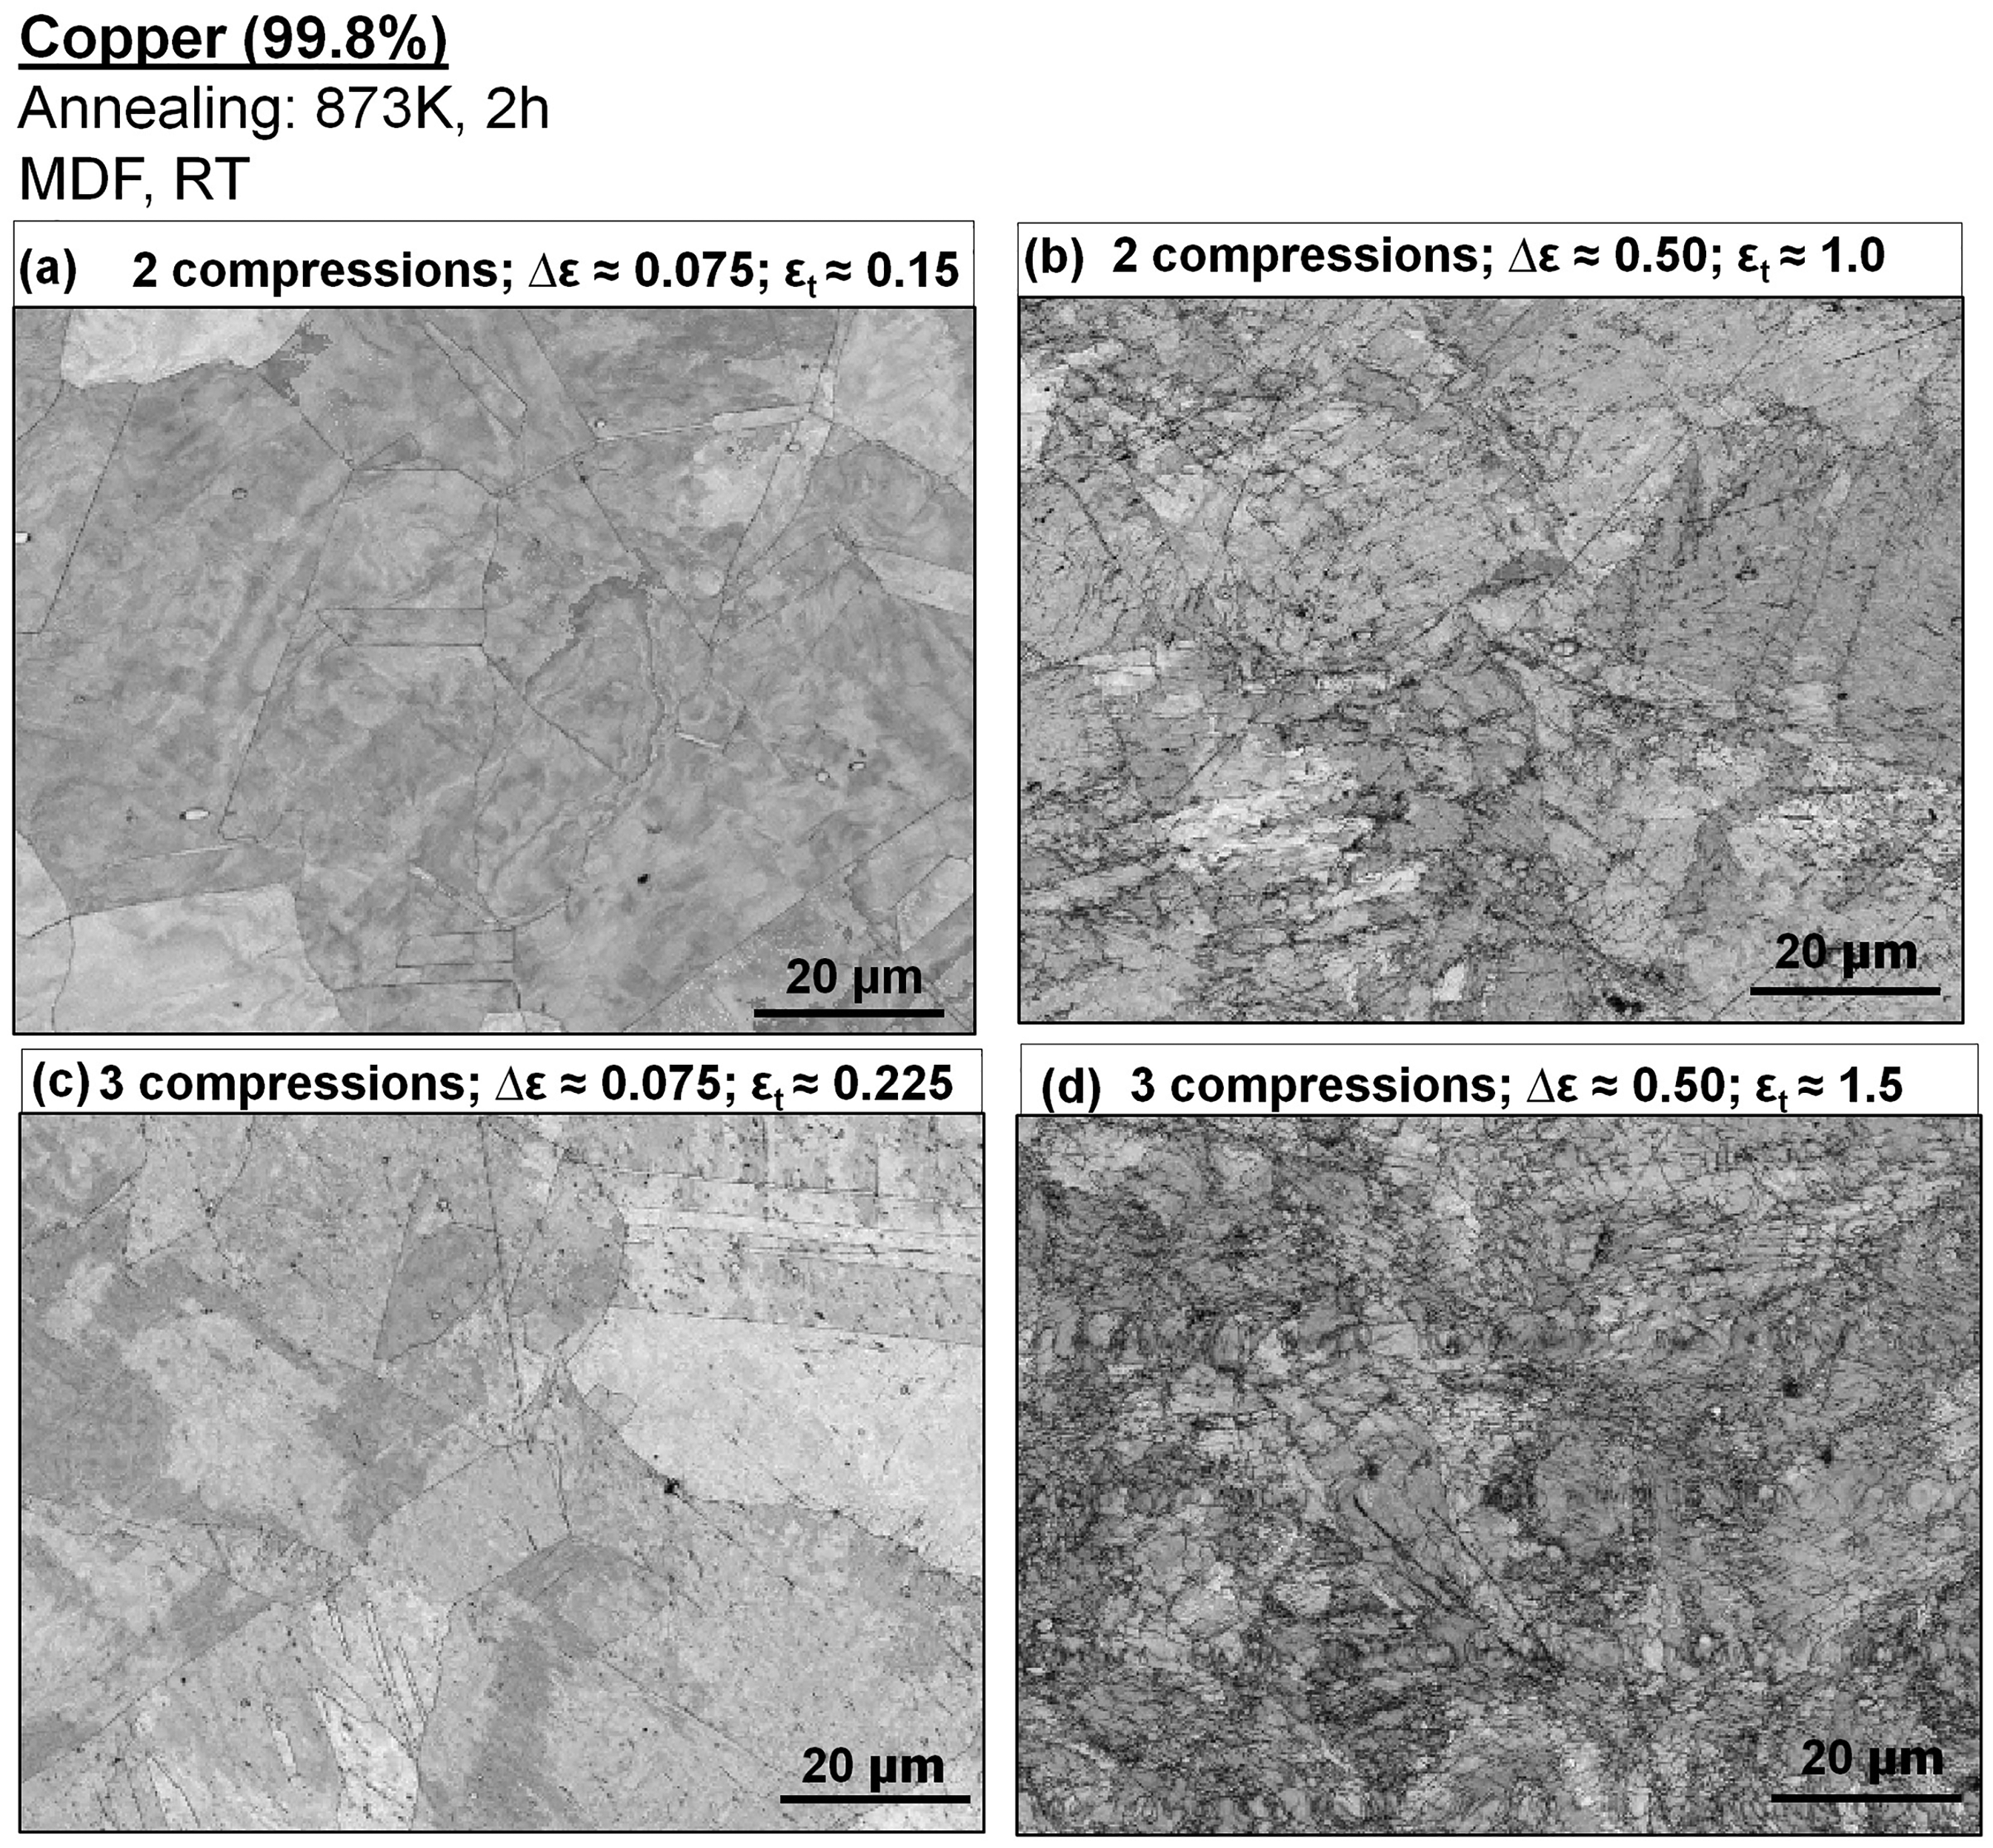
Optical microscopy images for copper specimens after (a) annealing and further processing through (b) 1, (d) 2, (f) 3, (h) 48 MDF0.075 compressions and (d) 1, (e) 2, (g) 3, (i) 6 MDF0.50 compressions.

OIM images (IPFZ) for copper specimens after annealing and further processing through (a) 1, (c) 2, (e) 3, (g) 48 MDF0.075 compressions and (b) 1, (d) 2, (f) 3, (h) 6 MDF0.50 compressions. The triangle above the Figure represents orientation color key, where each color corresponds to a crystallographic direction aligned with the sample's Z-axis after different numbers of MDF cycles.

Boundary maps and LAGBs e HAGBs fractions for copper specimens after annealing and further processing through (a) 1, (c) 2, (e) 3, (g) 48 MDF0.075 compressions and (b) 1, (d) 2, (f) 3, (h) 6 MDF0.50 compressions. The color scale above the image indicates the misorientation angle (θ): black lines HAGBs (θ > 15°), while green and red lines denote LAGBs with 5° < θ < 15° and 2° < θ < 5°, respectively (color version available online).
The annealed material displays polygonal and equiaxial grains, as well as annealing twins (indicated by black arrows in the Figure 3(a)). Such characteristics were also reported by Flausino et al. 8 in copper annealed under the same conditions of time and temperature as in the present investigation and by Wang et al. 41 for similar annealing parameters. The regions of dark contrast observed in the initial condition (circled in black in the Figure 3(a)) results from differential etching, which enhances contrast between grains with varied crystallographic orientation. Furthermore, slight heterogeneities in the recrystallized microstructure prior to MDF - such as stored energy variations or incipient substructures - can result in these contrast differences.
In addition, the isolated black point observed inside the grains correspond to micrometric inclusions, primarily non-metallic oxides commonly found in high-purity commercial copper as a result of its processing history and residual impurity content. These exogenous inclusions are dispersed within the grain interiors and do not constitute a secondary phase in the metallurgical sense. Their morphology and distribution are consistent with previous observations reported by Garcia et al., 42 who investigated hot compression of 99.9% pure copper.
The microstructure for copper processed by 1, 2 and 3 MDF0.075 compressions (Figure 3(b), (d), (f) respesctively) is similar to that of the annealed material, but with features that tend to disappear with increasing deformation. Processing with 48 MDF0.075 compressions (Figure 3(h)) led to no annealing twins and grains fragmented into microvolumes, associated with large, dark areas of refined structures (some representative regions where this feature occurs are delineated in red). Although polygonal and aligned grains are the main features after the first compression of MDF0.50 (Figure 3(c)), dark areas are also observed after the second pass (Figure 3(e)) and the area fraction occupied by them increases with increasing strain (Figure 3(g) e (i)).
The above mentioned dark areas are connected to substructures introduced by plastic deformation.8,32 This is confirmed by the presence of color shades within the original grains in Figure 4 and by the evolution of the dense network of LAGBs in Figure 5. Figure 4 presents inverse pole figure (IPF-Z) maps obtained by EBSD. The triangle above it represents orientation color key, where each color corresponds to a crystallographic direction aligned with the sample's Z-axis after different numbers of MDF cycles for both low (Δɛ ≈ 0.075) and high (Δɛ ≈ 0.50) strain amplitudes. In the grain boundary maps (Figure 5), the color scale above the image indicates the misorientation angle (θ): black lines HAGBs (θ > 15°), while green and red lines denote LAGBs with 5° < θ < 15° and 2° < θ < 5°, respectively.
In the initial stages (Figure 4(a) and (b)), clear contrast is observed between the two conditions: while one-pass MDF at low amplitude (ɛ ≈ 0.075) maintains large equiaxed grains with minimal distortion, the same number of passes at higher amplitude (ɛ ≈ 0.50) already induces elongation and rotation of grains along shear directions. As the number of compressions increases, distinct microstructural evolution pathways become evident. For low-amplitude MDF (Figure 4(a), (c), (e), (g)), the microstructure evolves gradually with limited grain fragmentation, preserving high orientation contrast and polygonal grain structures even up to ɛ ≈ 3.6 (Figure 4(g)). In contrast, samples processed with higher amplitude (Figure 4(b), (d), (f), (h)) exhibit intense grain subdivision, misorientation accumulation and progressive fragmentation at lower total strains, with signs of equiaxed ultrafine grains emerging as early as ɛ ≈ 1.5 (Figure 4(f)). At ɛ ≈ 3.0 (Figure 4(h)), a nearly saturated grain refinement is observed with diminished orientation contrast, indicating high internal misorientations. These results confirm the strong influence of strain amplitude on the microstructural response of copper under MDF, aligning with previous literature that associates higher Δɛ with faster formation of high-angle grain boundaries 23 and greater stored energy. 24
Additionally, data in Figure 5 indicate that MDF0.075 causes a continuous decrease in the HAGBs fraction (from 88% in the annealed material down to 18% after 48 MDF0.075 compressions and ɛt ≈ 3.6, as shown in Figure 5(h)). A similar decrease occurs under MDF0.50 in the 2 initial compressions (from 88% in the annealed material down to 13%, for ɛt ≈ 1.0). The HAGBs fraction then rises to 16% after 3 compressions (ɛt ≈ 1.5) and then, surprisingly, to 29% for 6 compressions (ɛt ≈ 3.0, Figure 5(h)), differently from the continuous decrease in the HAGBs fraction in MDF0.075. Under this condition, a unique microstructure was observed, characterized by the coexistence of distinct features. In some regions, polygonal grains with twins and free of dislocations were observed. These grains were found alongside equiaxed submicrometric grains and a deformed matrix, resulting in a bimodal grain structure. This combination of microstructural features suggests the occurrence of partial discontinuous recrystallization.
The average grain size (D), measured using the linear intercept method for annealed sample, is ≈30 µm. For the processed conditions, the grain size was determined based on data for area fractions generated by EBSD files, considering the increasing microstructural complexity as the deformation level rises. For MDF0.075, D was 26 μm after 1 pass, ≈30 µm after 2 compressions; ≈40 µm after 3 compressions and ≈18 µm for 48 compressions. Similarly, for MDF0.50, D was 40 μm after 1 pass, ≈ 30 µm after 2 compressions; ≈ 35 µm after 3 compressions and ≈ 25 µm for 6 compressions.
These average values, however, should be interpreted with caution. To better visualize the grain size evolution and clarify the apparent discrepancies in early deformation stages, grain size (θ > 15°) distribution histograms were constructed and are presented in Figure 6. In early MDF0.075 stages (1–3 compressions), the grain size distributions are wide and multimodal. The calculated average diameter increases, resulting in an apparent grain coarsening caused by boundary coalescence rather than true grain growth. The twins, present in abundance in the recrystallized microstructure of the annealed material, contribute significantly to the total number of boundaries detected by EBSD. As MDF deformation proceeds, twin boundaries - typically associated with high-angle character - are gradually replaced by LAGBs structures. This transition leads to a reduction in the number of HAGBs counted by the analysis software and, consequently, to an artificial increase in the calculated average grain size, despite the absence of true grain growth. This apparent “coarsening” is not due to thermally activated mechanisms, but rather to a structural effect, in which the disappearance of twins merges contiguous domains into larger units. This phenomenon is confirmed by the grain size distribution histograms (Figure 6), which reveal a shift in the distribution profile and a broadening in the early 3 MDF0.075 compressions.
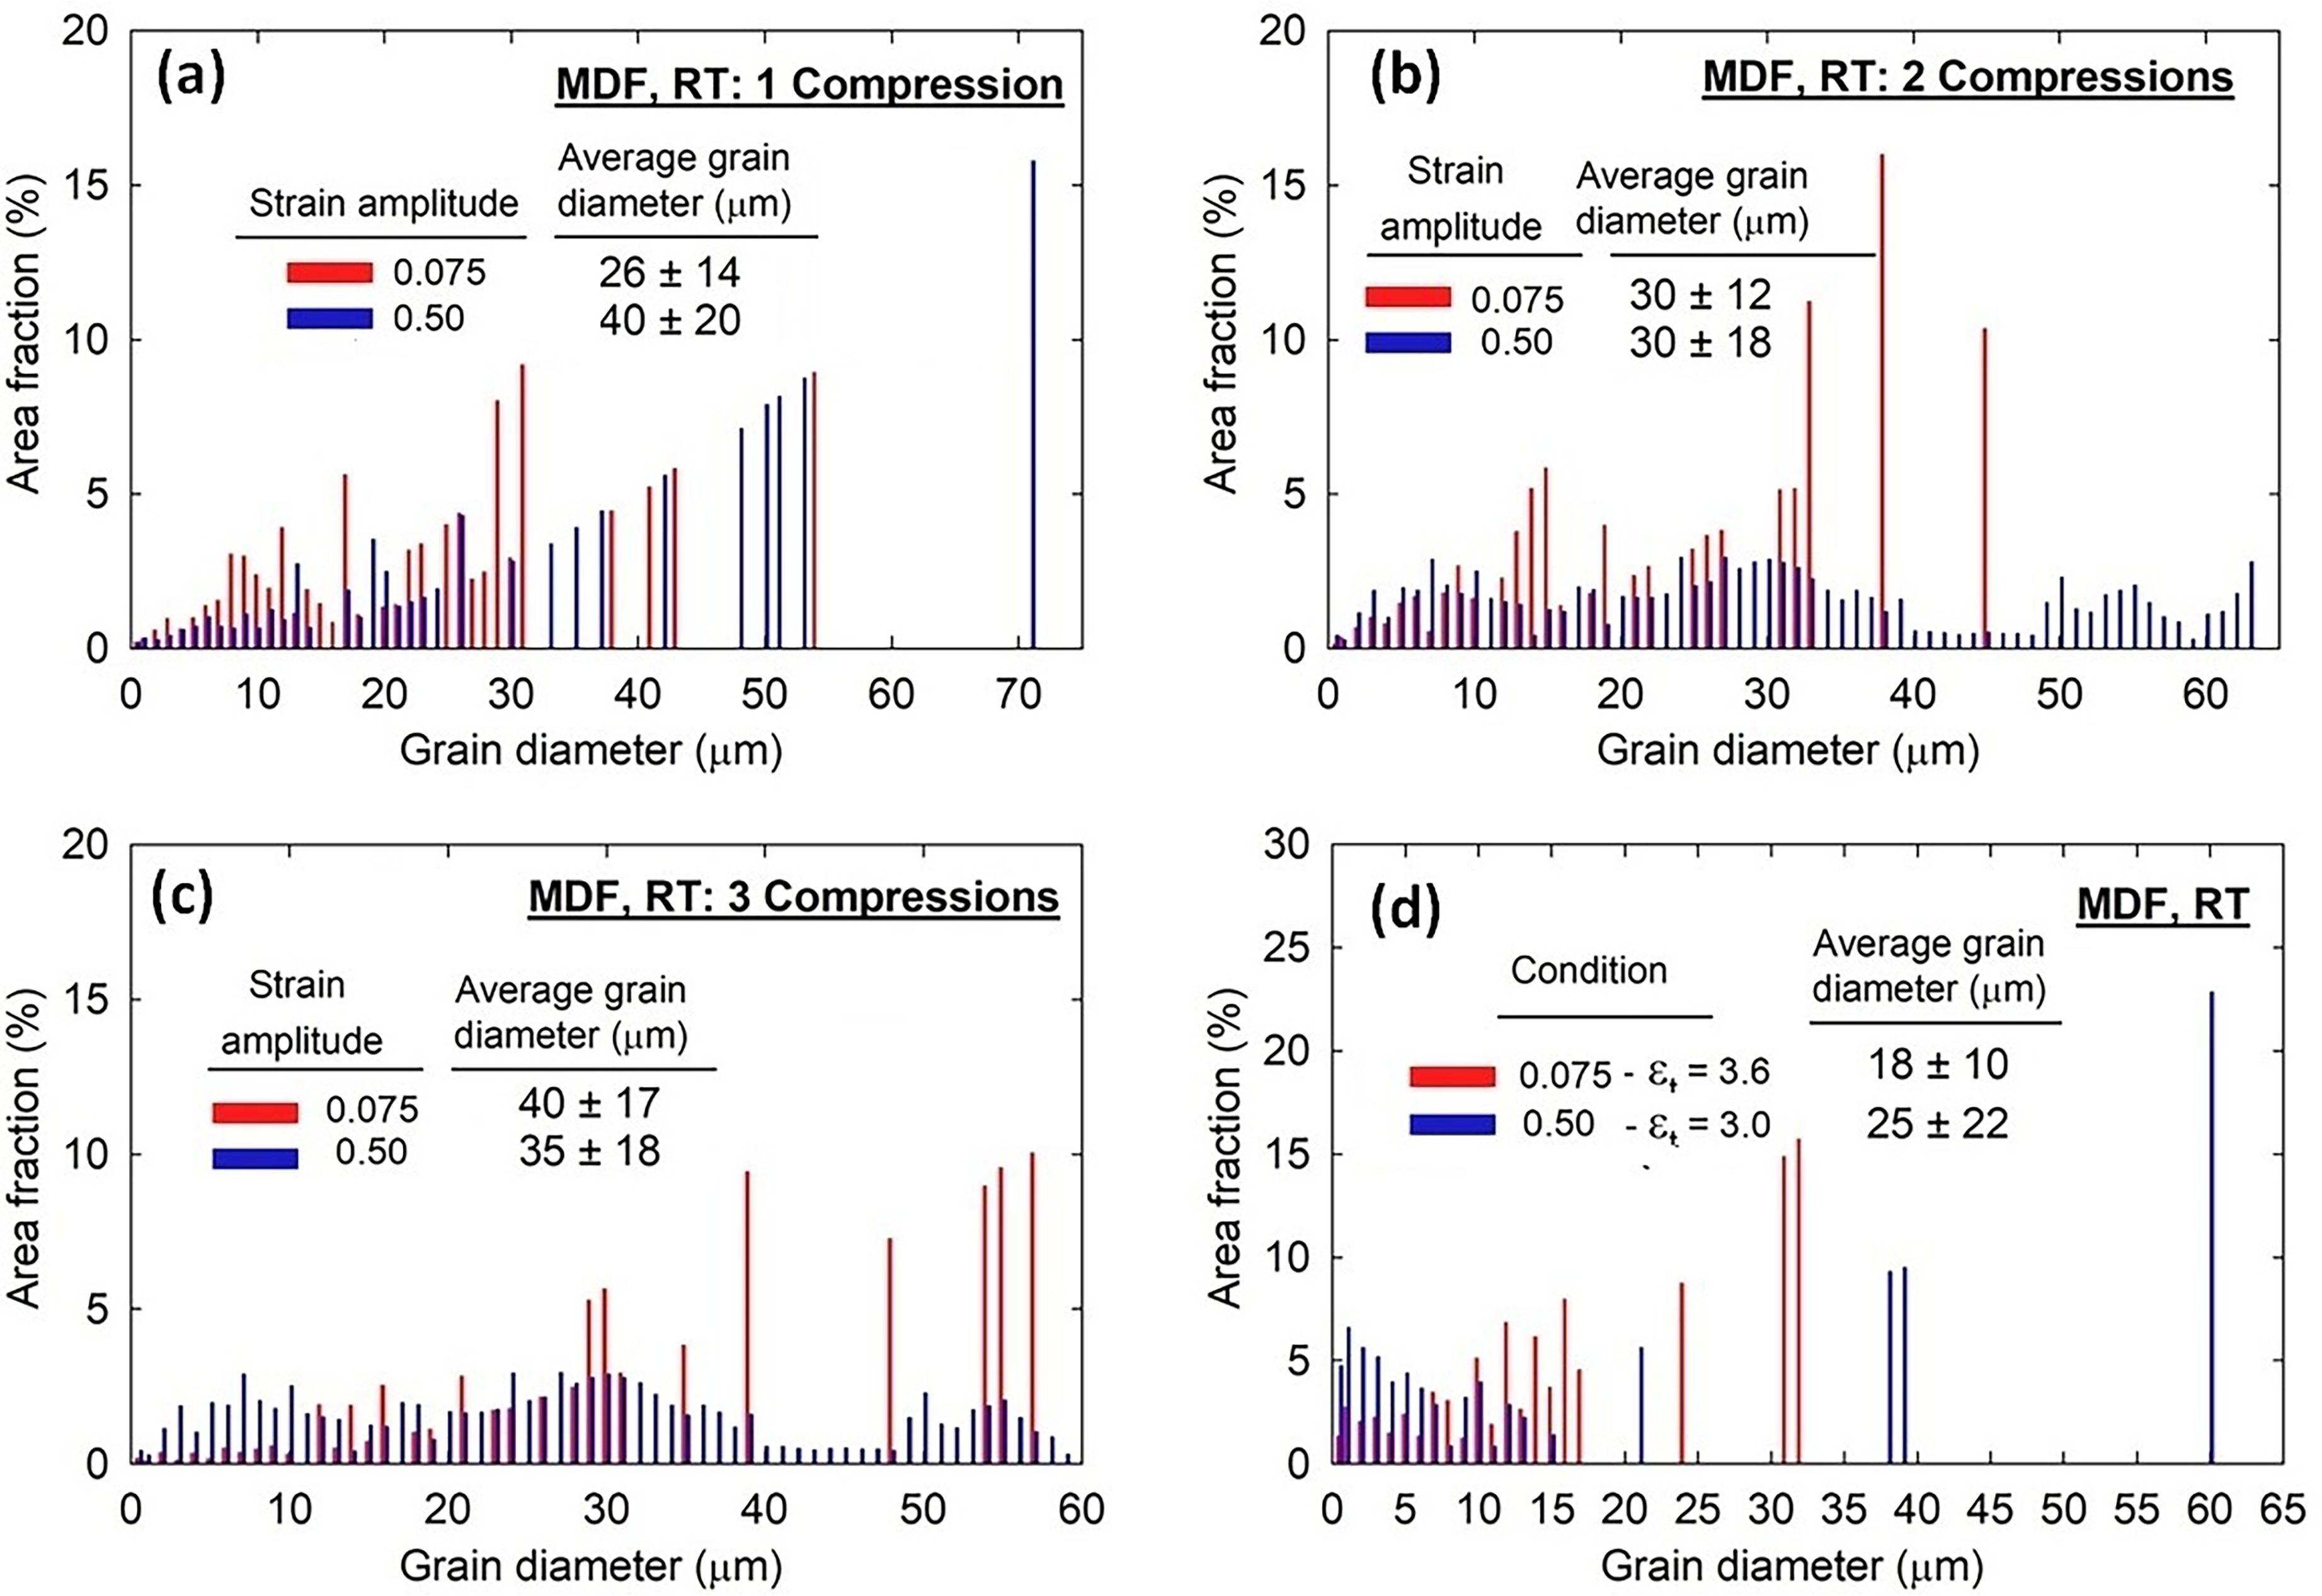
Grain size distribution histograms (θ > 15°) obtained by EBSD for copper specimens processed by MDF0.075 (red bars) and MDF0.50 (blue bars) after (a) 1, (b) 2, (c) 3 and (d) 48 compressions for MDF0.075 (ɛt ≈ 3.6) and 6 compressions for MDF0.50 (ɛt ≈ 3.0).
In contrast, the MDF0.50 condition promotes faster substructure evolution and grain fragmentation even at early stages, as indicated by the broader distributions skewed toward finer grain sizes, despite a comparable or even higher average value (with greater standard deviation). At higher strain levels (ɛt ≈ 3.0–3.6), the grain size distributions become narrower and shift toward the refining regime, particularly for MDF0.075. For MDF0.50 condition, some isolated peaks at larger grain diameters can possible be associated with incipient onset of discontinuous recrystallization, locally producing coarser grains; even though this is not dominant at these early strain levels.
Additionally, deformation heterogeneity plays a significant role in influencing grain size evolution, as localized strain variations can lead to non-uniform grain refinement or coarsening related to the gradual disappearance of twin boundaries in the initial deformation stage. These findings are consistent with those from Flausino et al. 8 who reported an average grain size of 13.5 µm, obtained by EBSD after 48 compressions of MDF0.075.
Table 2 displays the evolution of the dislocation density with the number of compressions and accumulated strain. The data reveal a clear trend of increasing dislocation density (ρ) with accumulated true strain (ɛt) for both processing routes. As expected for a thermally recrystallized microstructure, the annealed condition exhibits a lower initial ρ of approximately 9.3 × 10¹² m−2. After the first deformation cycle, even a modest strain amplitude (Δɛ ≈ 0.075) leads to a significant increase to 1.0 × 10¹³ m−2, indicating the onset of substantial dislocation storage.
Dislocation density (ρ) for Copper after annealing followed by MDF processing.
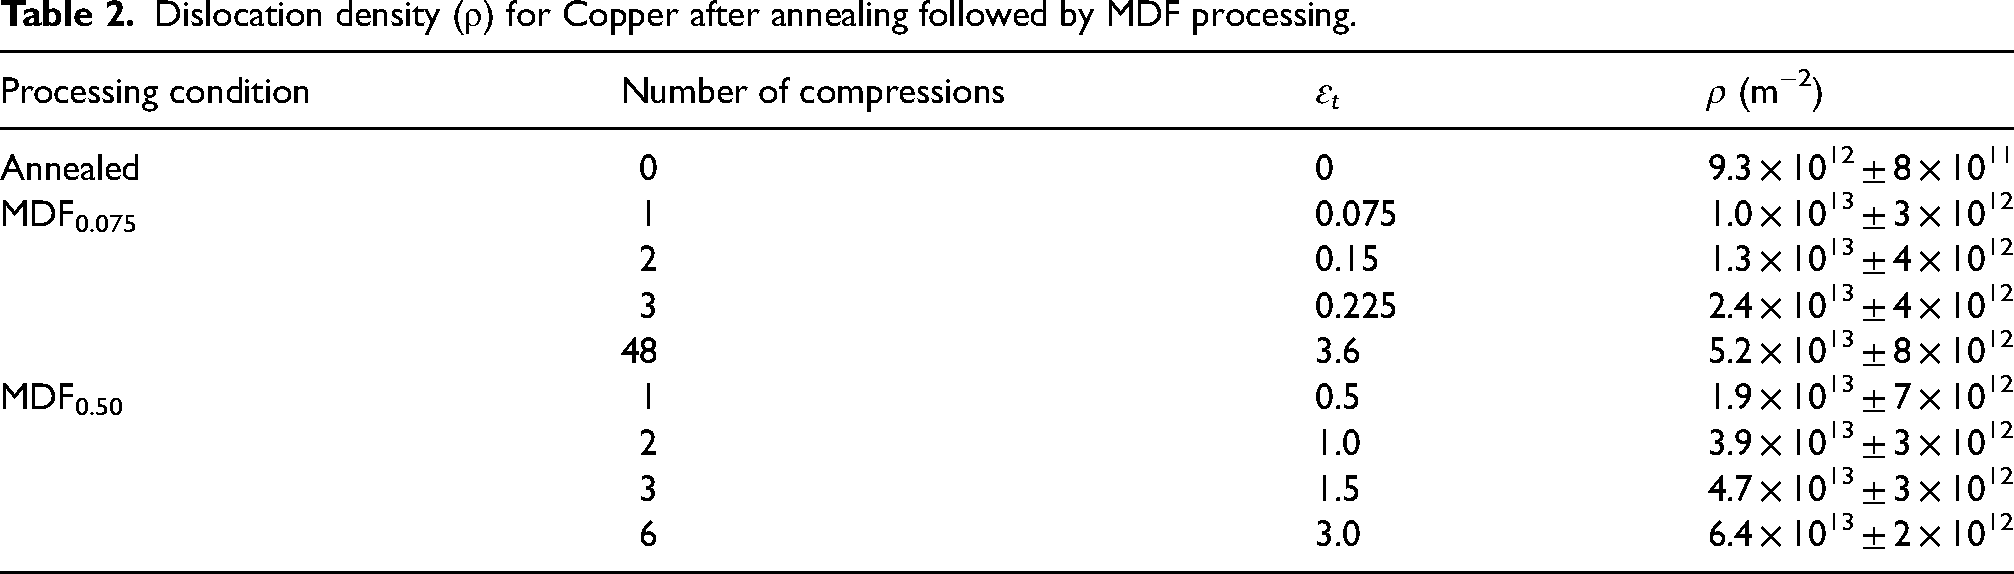
As the number of cycles increases, a growth in ρ is observed. For MDF0.075, the dislocation density reaches 2.4 × 10¹³ m−2 after three compressions (ɛt ≈ 0.225) and continues to grow steadily, achieving 5.2 × 10¹³ m−2 after 48 compressions (ɛt ≈ 3.6). A similar but more accelerated trend is evident in the MDF0.50 condition, which attains higher ρ values for equivalent or even lower numbers of cycles. For instance, after three cycles (ɛt ≈ 1.5), MDF0.50 yields ρ = 4.7 × 10¹³ m−2, almost doubling the corresponding value in MDF0.075 for equivalent ɛt ≈ 0.225. This behavior reinforces the correlation between the imposed strain path complexity and dislocation multiplication mechanisms and support the hypothesis that higher strain amplitudes promote more intense structural fragmentation and higher ρ values.10,23,43
A progressive increase in ρ is observed with higher accumulated strain (ɛt), reaching values up to 6.4 × 10¹³ m−2 for the MDF0.50 condition after six cycles (ɛt ≈ 3.0). Although the absolute increment in ρ becomes less pronounced at higher strain levels the available data do not support the assertion of a clear saturation plateau.
Discussion
The shape of the cumulative flow curve for MDF0.075 and MDF0.50 (Figure 2) resembles that typically associated with processes where dynamic recovery predominates: the work-hardening rate decreases progressively until a stationary flow stress is achieved. Similar behavior has been reported for Aluminum (Al) and Copper (Cu) processed by multiaxial compression under distinct strain amplitudes and temperatures,15,20,33 as well as in studies involving cyclic tensile-compression deformation 44 and cyclic High Pressure Torsion (HPT) 43 with different strain amplitudes. This is due to successive changes in the loading direction during deformation, which enhance recovery processes.8,15,23,43
These directional changes promote the annihilation and rearrangement of dislocations, leading to a balance between work hardening and dynamic recovery, 43 resulting in the observed stationary flow stresses, which increase as strain amplitudes (Δɛ) rise. For the same cumulative strain value, smaller Δɛ values in multidirectional/cyclic loading involve a higher number of changes in the strain path. This favors dynamic recovery, resulting in a lower dislocation density (see Table 2) due to the enhanced annihilation of these defects through reverse shearing. The saturation flow stress reached ≈ 360 MPa for MDF0.075 (similarly to reported by Flausino et al. 8 ), ≈ 380 MPa for MDF0.15, 23 ≈ 390 MPa for MDF0.30 23 and ≈ 400 MPa for MDF0.50. Values reported in the literature for the saturation flow stress for MDF with Δɛ ≈ 0.4 at room temperature were ≈ 350 MPa, 33 ≈ 390 MPa 20 and ≈ 400 MPa. 32 CCDP with Δɛ = 0.8 led to a saturation flow stress of ≈ 450 MPa. 16 The differences between these results and the present ones can be attributed to variations in the chemical composition of the material, and, in the case of CCDP, to the different strain path followed, in relation to the present ones.
Table 1 indicates that both yield strength (YS) and hardness (HV), as well as dislocation density (see Table 2), increase monotonically as total strain (ɛt) rises, for both MDF0.075 and MDF0.50. It is however surprising that starting from the 2nd MDF0.50 compression, higher values of HV than for ɛt = 3.6 under MDF0.075 (HV = 1072 ± 31 MPa) lead to lower values of YS than those reported for MDF0.075 (YS ≈ 300 MPa), even though the dislocation densities in MDF0.50 are higher than those for MDF0.075!
Both YS and HV values result from tests in a direction orthogonal to the last compression stage in MDF, but YS is measured at a deformation of 0.2% (ɛ = 0.002) in the compression stress-strain curve following the previous compression, while HV corresponds to a much higher average deformation of 8% (ɛ = 0.08).45–48 Figure 7 displays data relating the flow stress at a strain of 0.08 (σ0.08) with HV, exhibiting a linear relationship with a slope ≈ 0.39, similar to those for UTS (Ultimate Tensile Strength) vs HV relationships for several metals reported in the literature.46,48 The slope of the YS vs HV curve for MDF0.075 is ≈ 0.38, similar to that for the UTS vs HV relationship, but only ≈ 0.10 for MDF0.50, quite lower than that for the σ0.08 vs HV relationship. It can also be seen in Figure 7 that the difference in the stress level between the curves for σ0.08 and YS increases remarkably as strain amplitude rises from 0.075 to 0.50. This fundamental difference in effective strain partially explains the mismatch between HV and YS trends.
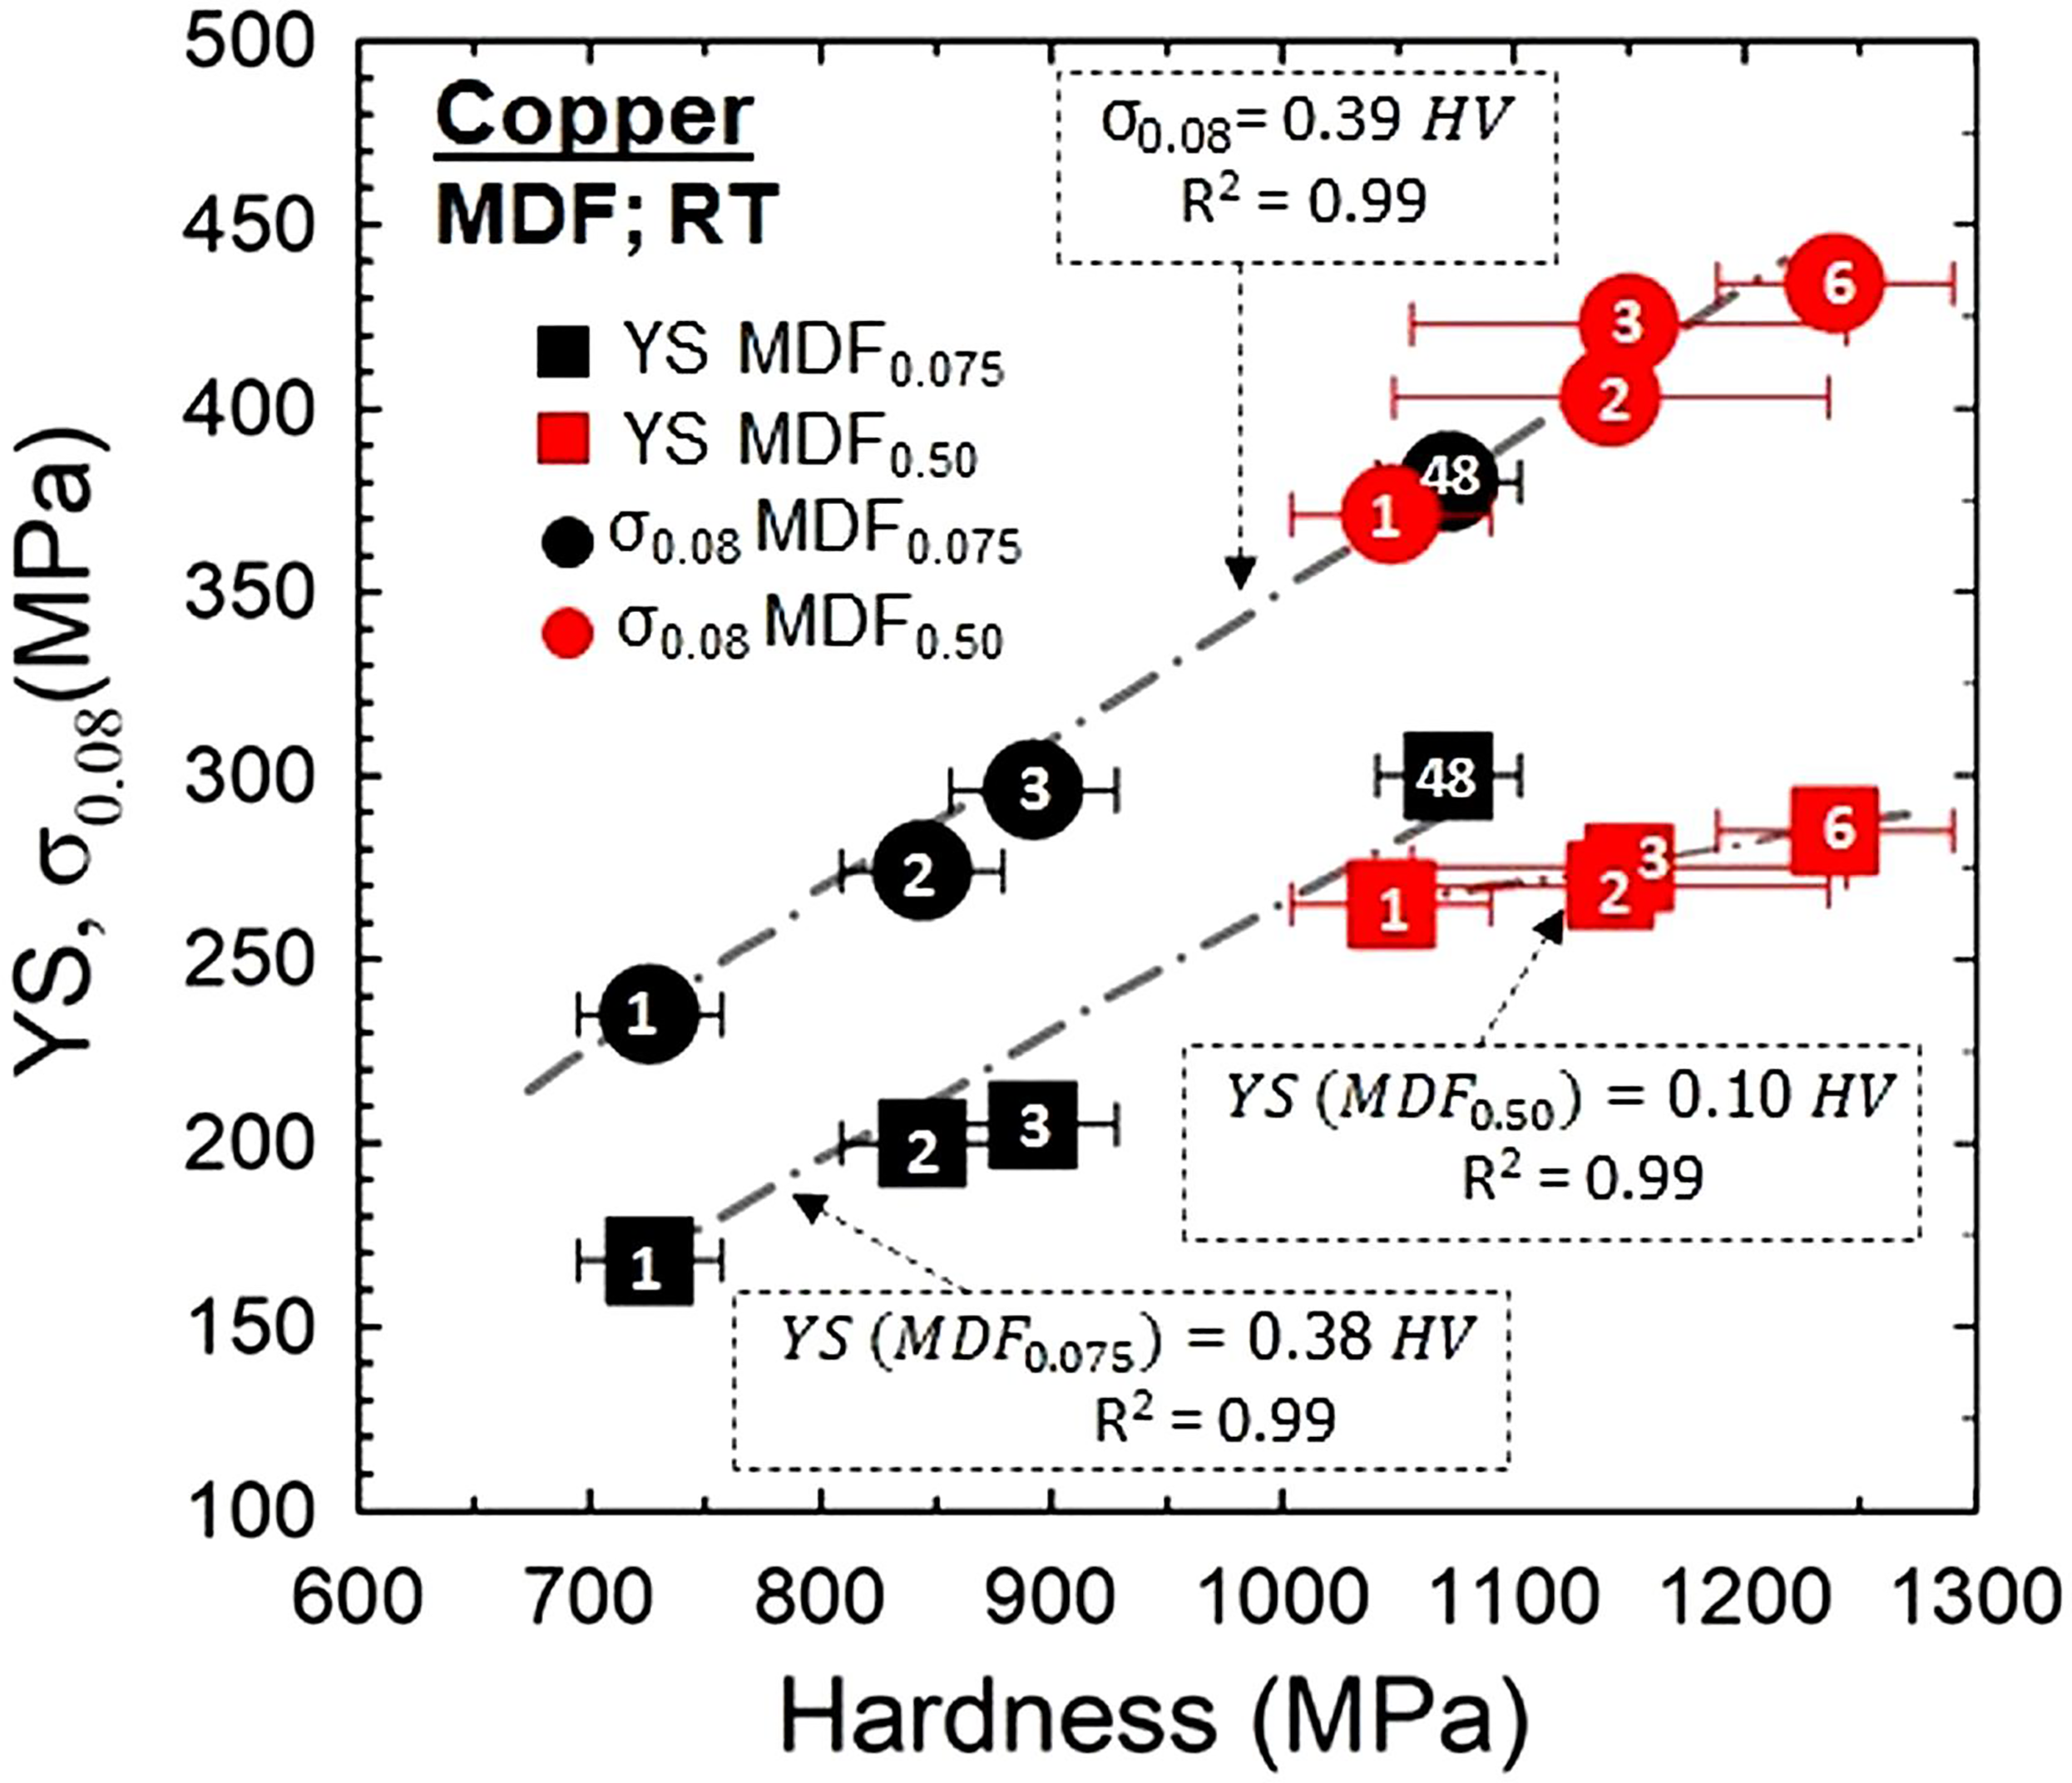
Vickers microhardness (HV) vs. yield strength at a strain of 0.2% (YS) and flow stress at a strain of 8% (σ0.08) in the processing of 99.8% Copper by MDF0.075 and MDF0.50. The numbers inside the markers indicate the number of MDF passes.
The evaluation of σ0.08 for MDF0.075 involved a visual extrapolation of the stress-strain curves after a strain ≈ 0.05–0.07, as described previously 24 ; at higher strains, the lateral walls of the die start interfering with the experimental results, leading to inflections in the experimental curves (see Figure 2(a)). This was not necessary for MDF0.50, where strains of 0.08 correspond to compressions without these interferences of the lateral die walls, as displayed in Figure 2(b).
The results in Figure 7 demonstrate strong statistical correlations in all cases, with R2 = 0.99 for both MDF0.075 and MDF0.50 conditions. The correlation between HV and flow stress at 0.08 strain (σ0.08) also yielded R2 = 0.99, reinforcing the reliability of σ0.08 as a parameter representative of the hardening state of the material. These high R² values validate the robustness of the hardness–strength relationship for the investigated copper conditions and support the assertion that σ0.08 better captures the actual material resistance under compressive loading than YS, which is sensitive to strain path changes and reverse shearing mechanisms.
Moreover, the slight differences in slope between YS vs. HV for MDF0.75 (0.26) and MDF0.50 (0.24) are consistent with the greater influence of cross-Bauschinger effects at higher strain amplitudes, which delay re-hardening upon orthogonal reloading. These findings highlight the importance of considering effective strain levels and deformation anisotropy when interpreting mechanical responses in cyclic or multiaxial loading conditions such as MDF.
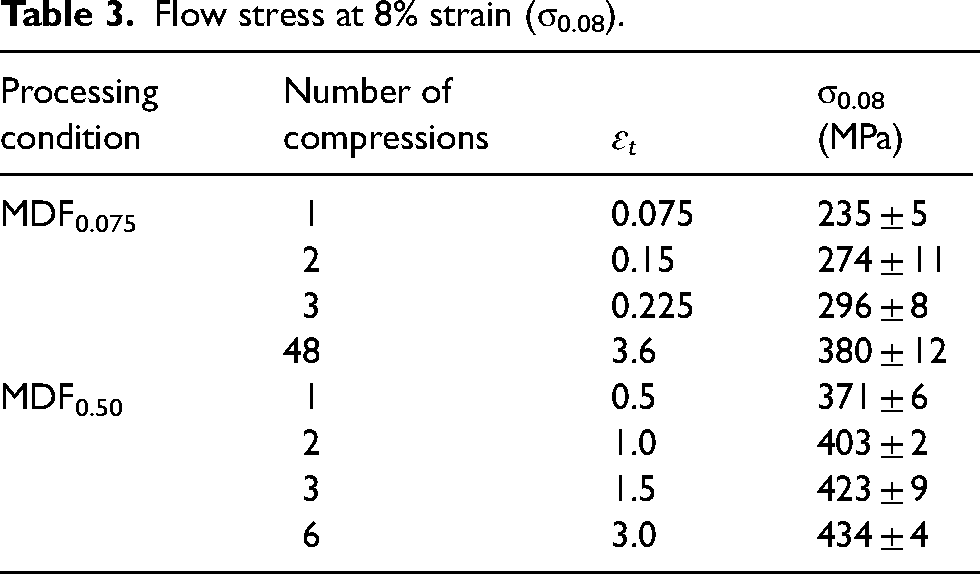
Successive MDF stress-strain curves exhibit a behavior similar to those observed in the tension-compression Bauschinger effect, where the YS of a material after a strain path change is lower than the end-flow stress in the previous deformation (the so called cross-Bauschinger effect), and further deformation is necessary for the return of the stress level to that compatible with the previous deformation. In addition, this YS lowering increases as the imposed strain increases,23,49 and should thus be more important in MDF0.50 than in MDF0.075. As a consequence, if one considers the flow stress at a 8% strain (σ0.08) instead of YS (which is measured at a strain of 0.2%, ≈ 0.002) in the present situation, the previously noted contradiction concerning the behavior of YS and HV in MDF0.075 and MDF0.50 (Δɛ) is eliminated, as indicated through the data for σ0.08 shown in Table 3 and Figure 6, and as already mentioned in the literature. 24 MDF0.50 consistently leads to higher σ0.08 than MDF0.075 for all processing conditions. The increase in the difference between σ0.08 and YS, indicated in Figure 6 is also a direct consequence of the increased cross-Bauschinger effect as the strain amplitude (Δɛ) in MDF rises.
Flow stress at 8% strain (σ0.08).
In addition to the intrinsic differences between HV and YS measurement protocols, the observed dispersion can also be partially attributed to experimental uncertainties and to anisotropy induced by the strain path characteristic of Multi-Directional Forging. While Vickers hardness testing provides a localized yet statistically averaged measure over a plastically deformed volume, yield strength values are extracted from true stress–strain curves under uniaxial compression, which in MDF are applied sequentially along orthogonal directions. This causes the mechanical response to be direction-dependent, particularly after the first few compressions, as substructures such as elongated grains, dislocation cells, or texture components develop preferentially along previous deformation axes. Finally, instrumental and operator-dependent sources of error must also be considered: small deviations in sample alignment, surface flatness or indentation positioning can influence HV, while noise in the stress–strain data and uncertainties in 0.2% offset determination can affect YS. Nevertheless, the strong R2 values confirm that the overall trends remain statistically meaningful and robust across both metrics. An important conclusion is that higher strain amplitudes in MDF are detrimental to increases in YS of the material, due to the enhanced cross-Bauschinger effects caused by strain path changes.
In the present work, the analysis of the microstructural evolution (Figure 3–5 and Table 2) for the first cycle of MDF0.075 and MDF0.50 indicates that the strengthening mechanism is controlled by work hardening driven by increased dislocation density and substructure formation and a decreasing fraction of HAGBs. As already described, no significant grain refinement is observed at this stage, as demonstrated through Figure 8, displaying the evolution of the average grain size as total deformation (ɛt) under MDF0.075 and MDF0.50 is raised. Grain size curves for MDF0.075, MDF0.15, and MDF0.30, taken from the literature, 23 were also included. In the initial MDF0.075 compressions the amount of annealing twin boundaries decreases progressively, contributing to a reduction in the fraction of HAGBs (Figure 5(a) to (e)). As a result, the grain size appears to increase, which can be attributed to a kind of “coalescence” of grains due to the reduction of HAGBs and the introduction of LAGBs substructures. It has been previously found 23 that grain refinement in MDF0.075 as ɛt increases is much slower than for higher MDF strain amplitudes (Δɛ) and becomes somewhat relevant only after a total strain ɛt ≈ 3.6; this is confirmed through Figure 8, which shows that actually there is even some grain coarsening for the first 3 compressions.
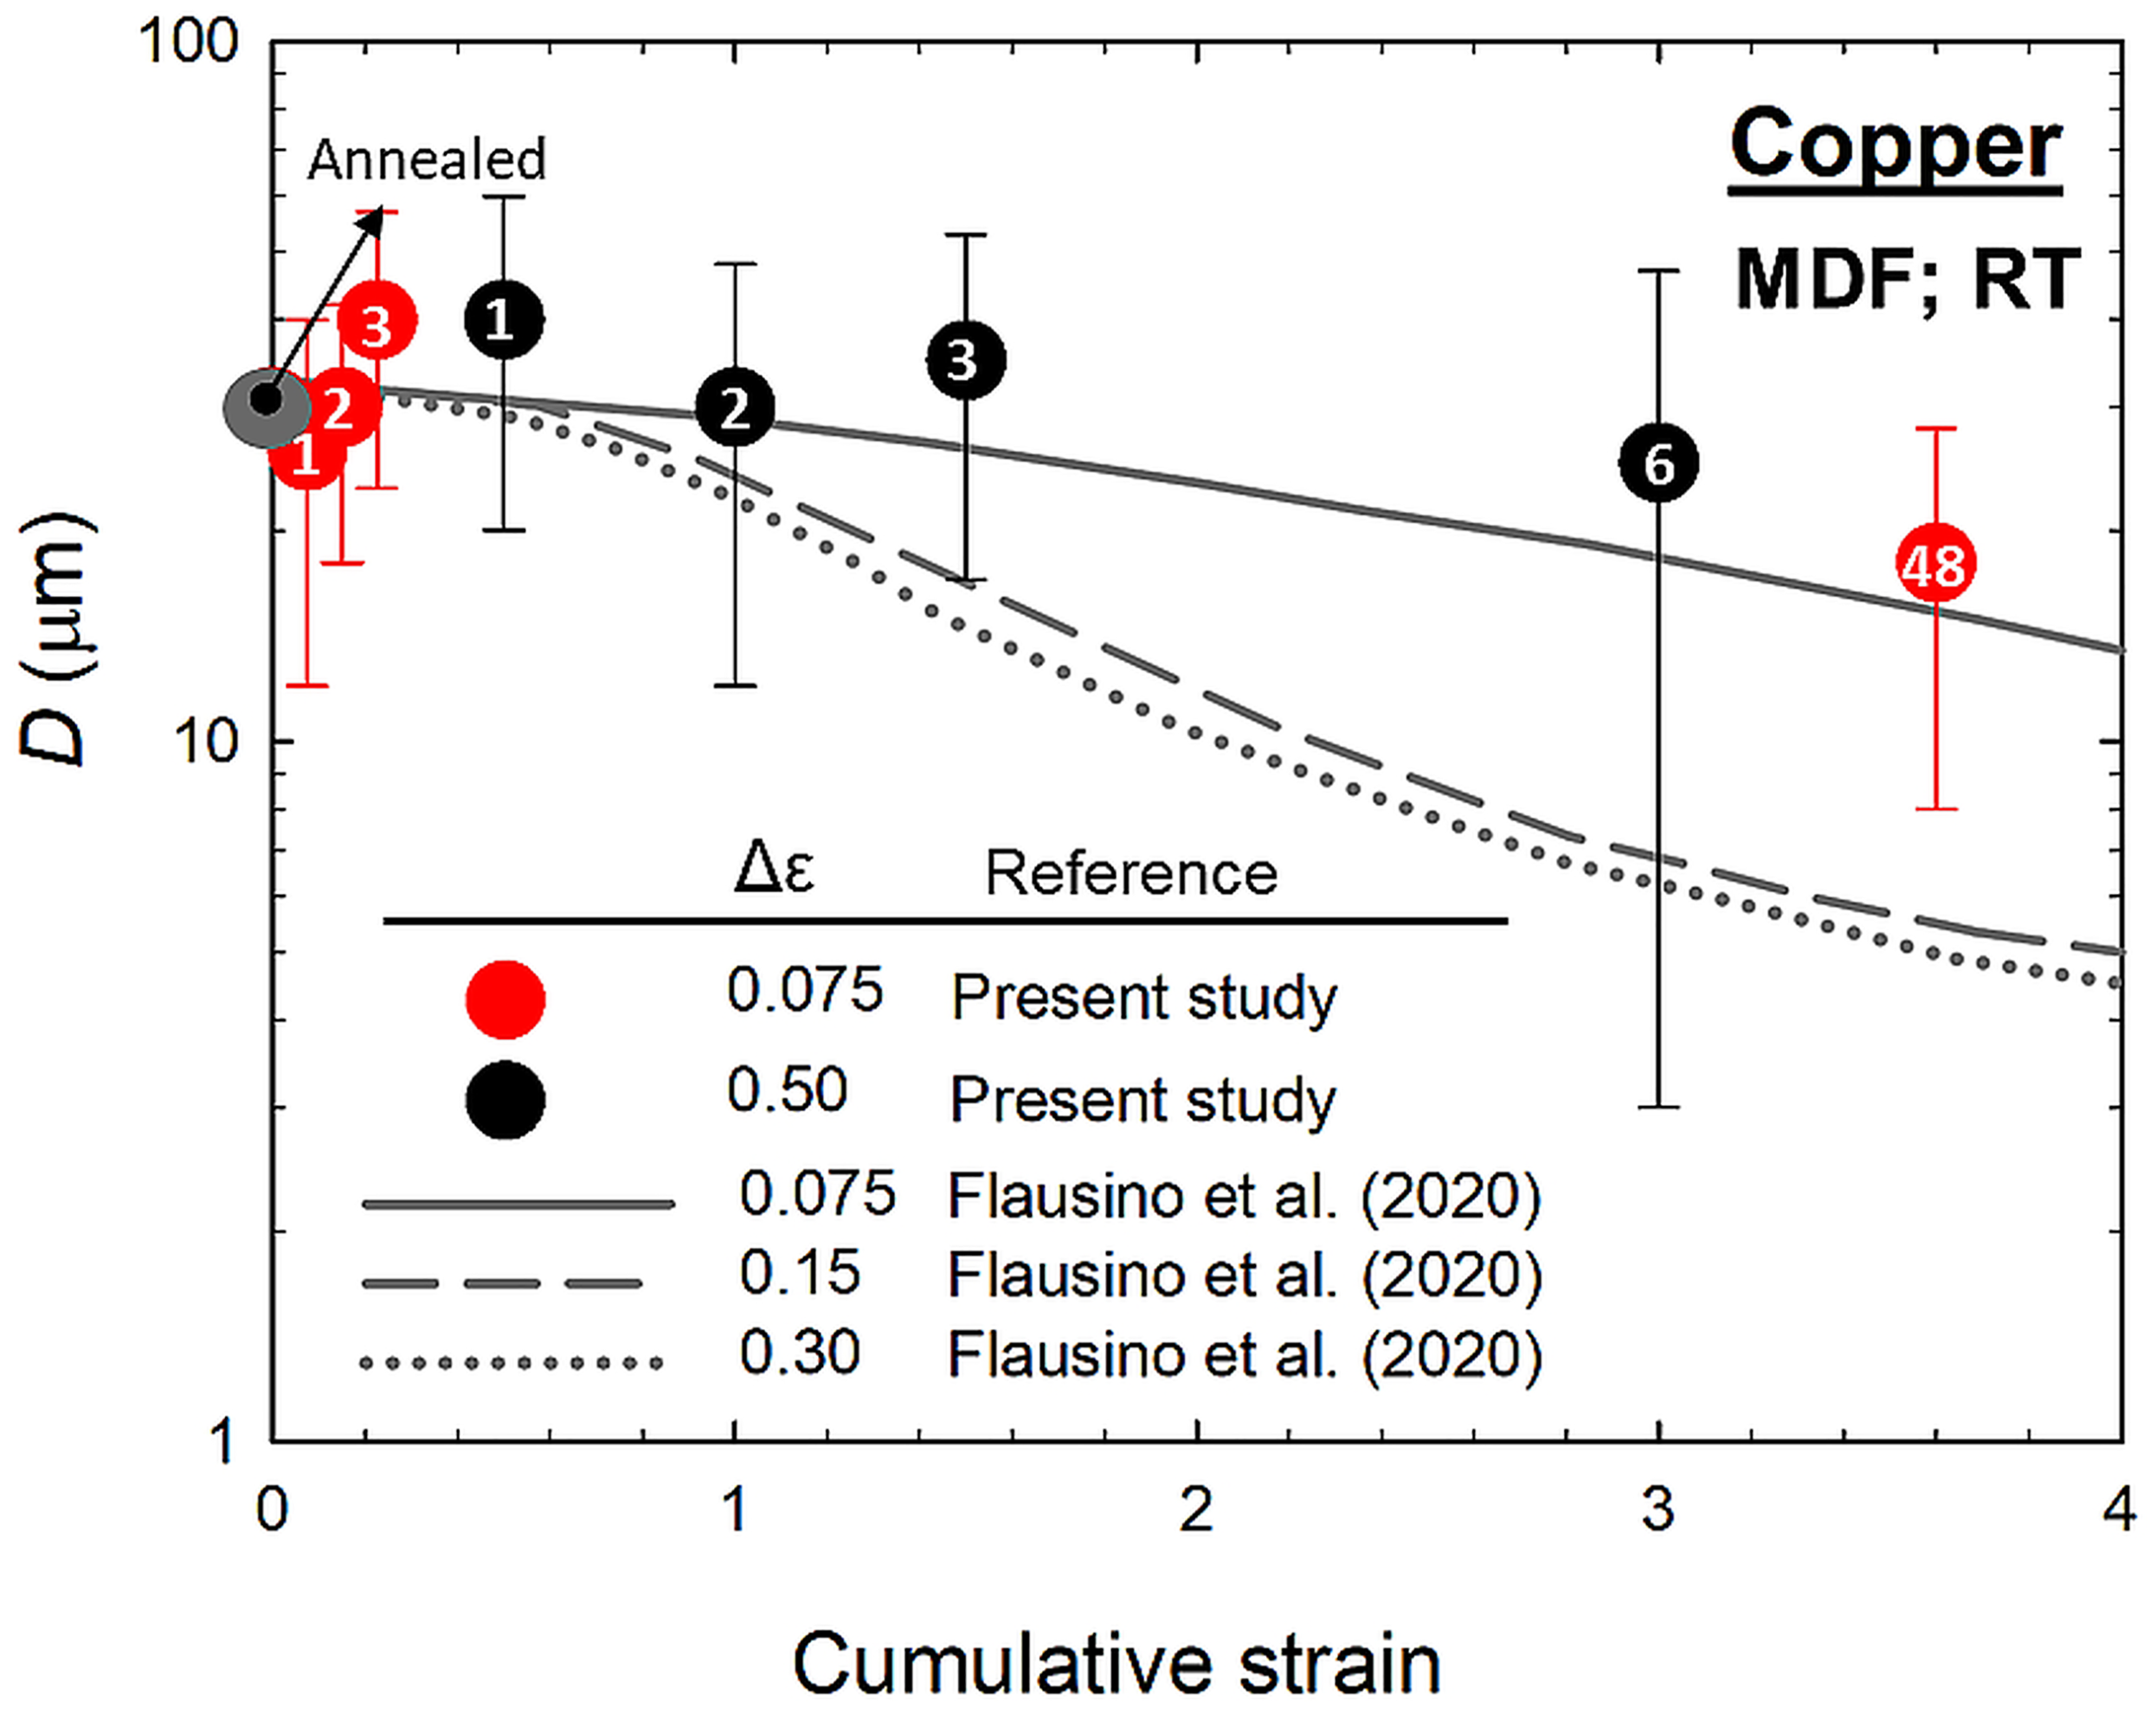
Effect of cumulative strain (ɛt) and of strain amplitude (Δɛ) on the evolution of the average grain size in the processing of 99.8% Copper by MDF0.075, and MDF0.50; Curves for MDF0.075, MDF0.15, and MDF0.30 were taken from the literature. 23 The numbers inside the markers indicate the number of MDF compressions.
The higher strain per pass in MDF0.50 enhances dislocation activity and the decrease in twin type boundaries, in comparison with MDF0.075, resulting in a faster (in terms of number of compressions) development of dark areas within the grains, as can be seen from Figure 3(b) to (g). Figure 5(b) to (d) confirm the dominance of dislocation-mediated mechanisms in the early stages of deformation in MDF0.50. The formation of these dark areas, associated with localized strain concentrations and grain fragmentation, 32 can be more clearly observed through Figure 9.
EBSD pattern quality maps of copper after 2 and 3 compressions of MDF0.075 (a, c) and MDF0.50 (b, d).
As deformation progresses, the substructures initially dominated by LAGBs gradually evolves to HAGBs, resulting in grain refinement. This transition is driven by the process of continuous dynamic recrystallization (CDRX),7,19,20,22,32,50–56 the dominant grain refinement mechanism in metals deformed at low homologous temperatures by severe plastic deformation (SPD). Thus, the initial mechanical properties are largely influenced by dislocation-mediated processes, setting the foundation for subsequent microstructural changes with further deformation. Previous studies 23 thus showed that for strain amplitudes Δɛ ≈ 0.15 and 0.30, a total MDF strain ɛt ≈ 3.6 leads to an appreciable grain refinement, from an initial size of ≈31 µm down to ≈5 µm. In addition, there is a corresponding increase in the fraction of submicrometric grains. On the other hand, Figure 8 indicates no such refinement for ɛt ≈ 3.0 by MDF0.50!
Figure 5(h) indicates that for ɛ ≈ 3.0 in MDF0.50, a complex microstructure is observed, characterized by the coexistence of different features. There is a deformed matrix, which retains the deformation-induced microstructure displaying a higher fraction of HAGBs than for a total strain ɛt ≈ 1.5 (Figure 5(f)), as well as equiaxed submicrometric grains, observed alongside polygonal grains free of dislocations and containing twins, suggesting that certain regions have undergone partial discontinuous recrystallization, leading to the formation of new, strain-free grains. 57
Although classical discontinuous dynamic recrystallization (dDRX) is generally associated with high-temperature deformation, the present results suggest that localized and partial dDRX may occur in copper at room temperature (RT) under specific MDF conditions. As evidenced by the grain size distribution histograms (Figure 6), the MDF0.50 condition - imposing a higher strain amplitude - exhibits isolated peaks at coarser grain sizes, deviating from the expected refinement trend. These features may indicate the incipient nucleation and growth of recrystallized grains, consistent with spatially limited dDRX. Similar phenomena have been reported for copper processed with ECAP and HPT at room temperature when strain localization and energy gradients are significant, but has not been reported previously in the literature for MDF, as far as the authors are aware of.
From a thermodynamic standpoint, even at RT, the local accumulation of stored energy (mainly from dislocations) may be sufficient to trigger boundary migration in highly strained volumes. When compared to conventionally grained materials, the volume fraction of grain boundaries and low-angle grain boundaries (LAGBs) increases by orders of magnitude in metals processed by severe plastic deformation (SPD). 58 This introduces greater disorder into the system, resulting in an increase in entropy and Gibbs free energy, with important thermodynamic implications, as previously discussed.26,59
Copper displays a stacking fault energy (SFE) level that hinders cross-slip and thus dynamics recovery, 59 eventually connected to sufficient stored energy for triggering localized discontinuous dynamic recrystallization (dDRX), even under cold working conditions.60,61 In this context, the limited grain refinement observed for a total strain of ɛt ≈ 3.0 in the MDF0.50 condition (Figure 6), along with the noticeably slower refinement kinetics when compared with MDF0.15 and MDF0.30 within the analyzed strain range (Figure 7), may be associated with the activation of partial discontinuous recrystallization (dDRX), which competes with substructure fragmentation and can locally promote grain growth, especially under high strain amplitudes.
Regarding mechanical properties, the results in Tables 1, 3 and Figure 6 indicate that increasing total deformations in MDF0.50 up to ɛt ≈ 3.0 increase the hardness and σ0.08 of the material; hardening mechanisms in the substructural matrix in Figure 5(h) seem to dominate the material hardening, despite the softening associated with the localized recrystallized regions. On the other hand, the low YS of these regions can provide softening contributions in addition to those already mentioned in cross-Bauschinger effects to the YS reported in Table 2.
One could argue that the grains associated with dDRX originated from adiabatic heating caused by deformation. Such heating was very limited, due to the slow utilized compression rates (0.05 mm/s) allowing ample heat dissipation, especially through the contact with the metallic die walls at room temperature. In addition, there are major specimen cooling conditions during the time interval between successive MDF compressions, where specimens are extracted and reinserted in the compression die in order to change the compression direction, which takes at least ≈ 300 s. Manual contact with the specimen during these situations never revealed specimen heating, and it is considered that adiabatic heating is irrelevant in the present circumstances.
Summary and conclusions
This work examined the mechanical behavior and microstructural evolution of commercially pure Copper (99.8%) processed at room temperature along 1, 2 and 3 compressions in the first MDF cycle of MDF0.075 (strain amplitude Δɛ ≈ 0.075) and MDF0.50 (strain amplitude Δɛ ≈ 0.50) and by 48 compressions (16 MDF cycles, ɛt ≈ 3.6) and 6 compressions (2 MDF cycles, ɛt ≈ 3.0) under of MDF0.075 and MDF0.50, respectively. The following conclusions were drawn from the study:
The cumulative flow curves for MDF0.075 and MDF0.50 are similar to those associated with deformation processes where dynamic recovery predominates; saturation stresses increase as Δɛ is raised, reaching ≈ 360 MPa for MDF0.075 and ≈ 400 MPa for MDF0.50. Although no significant grain refinement was evident after the first cycle of MDF0.075 and MDF0.50, an increase in the material microhardness and yield strengths at 0.2% plastic deformation (YS), which is higher as Δɛ and ɛt rise, is observed. This behavior indicates that the strengthening mechanism is controlled by work hardening driven by increased dislocation density and substructure formation, as demonstrated by EBSD and DRX analysis. MDF0.50 causes enhanced cross-Bauschinger effects in relation to MDF0.075 and thus to lowered material yield strengths (YS), compared with the YS for ɛt ≈ 3.6 in MDF0.075. In addition, ɛt ≈ 3.0 in MDF0.50 led to a bimodal microstructure, displaying separate regions with either polygonal recrystallized grains or severely deformed structures. Such bimodal microstructure was not observed after ɛt ≈ 3.6 in MDF0.075. Differences in the strain amplitude (Δɛ) and total strain (ɛt) in the MDF of commercial purity copper (99.8%) affect the resulting microstructures and strength of the material. These results demonstrate that adjusting Δɛ and ɛt allows tailoring the microstructure and strength of the material.
Footnotes
Acknowledgments
The authors would like to thank FAPEMIG (Fundação de Amparo à Pesquisa do Estado de Minas Gerais), CNPq (National Council for Research and Technological Development) and CAPES (Coordenação de Aperfeiçoamento de Pessoal de Nível Superior - Brasil). The authors thank the Microanalysis Laboratory (LMic/UFOP), a member of the Microscopy and Microanalysis Network of Minas Gerais (RMic/Brazil/FAPEMIG), for the support.
Author contribution(s)
Data availability
Data will be made available on request.
Declaration of conflicting interests
The authors declared no potential conflicts of interest with respect to the research, authorship, and/or publication of this article.
Funding
The authors disclosed receipt of the following financial support for the research, authorship, and/or publication of this article: This investigation was financed in part by FAPEMIG (Fundação de Amparo à Pesquisa do Estado de Minas Gerais) Grant APQ-02133-22, CNPq (National Council for Research and Technological Development) Grant 301758/2022-0 and the Coordenação de Aperfeiçoamento de Pessoal de Nível Superior - Brasil (CAPES) - Finance Code 001.