
Abstract
Rolling contact between wheels and rails causes various types of damage to the contact surface. To reduce this damage, the rim, which includes the contact surface of the wheel, is subjected to heat treatment to generate compressive residual stress(CRS). However, the generation of this stress causes tensile residual stress(TRS) in the web plate, leading to equilibrium and accelerating crack initiation and propagation. Damage to wheels mostly originates from the contact surface where rolling contact occurs. Nevertheless, there are cases in which wheels are damaged by cracking in the web plate. In this study, the characteristics of fatigue crack growth in defects that occur in the web plate of a high-speed railway wheel were evaluated. The residual stress generated during manufacturing was evaluated through finite element (FE) analysis, and the characteristics of fatigue crack growth in terms of magnitude of residual stress were investigated using the extended finite element method. The FE analysis shows that residual stress generated during manufacturing significantly affects crack growth rate. In particular, the crack growth rate increased approximately 5.8 times compared to the case without residual stress.
Introduction
Railway vehicles are an eco-friendly means of mass transportation. Safety and reliability are critical because derailment accidents cause mass casualties. In particular, wheels are one of the parts that have the largest impact on the safety of railway vehicles, and ensuring their reliability is important. The most significant feature of railway vehicles is the wheel-rail interaction resulting from rolling contact. Therefore, various types of damage occur on the contact surface of wheels and rails. Representative damage categories include wear and rolling contact fatigue (RCF), both of which increase maintenance costs. Many studies have been conducted to reduce wear.1,2,3 In recent years, RCF damage has increased owing to the increase in traction and axial load caused by high-speed railway vehicles. Many studies have been conducted to reduce damage to the interface between wheels and rails.4,5,6
Damage to wheels is generally classified into damage that occurs due to the crack growth on the contact surface caused by RCF and damage that occurs due to the thermal crack caused by wheel tread braking. Various studies have been conducted on such damage.7,8,9,10,11 Ringsberg et al. 7 presented a two-dimensional finite element (FE) model to predict the RCF life of rails. Saint-Aime et al. 8 and Jaifu 9 presented three-dimensional (3D) FE models and analysis procedures to predict the RCF life of wheels and rails. G. Donzella 10 evaluated the thermal and residual stress caused by repeated braking heat and assessed thermal fatigue life based on the evaluation results. Caprioli et al. 11 proposed a critical size for the cracks caused by wheel tread braking and evaluated the impact of repeated heat cycles on cracks.
However, in some cases, cracks initiate in the web plate rather than the contact surface. Therefore, some studies have assessed the fatigue life of the wheel web plate.12,13 Ren et al. 12 analyzed the causes of damage to locomotive wheels fractured by the cracks generated in the wheel web plate. The study demonstrated, through experiments and finite element analysis, that the web plate of the wheel remains structurally safe even without shot peening, provided that corrosion-induced pitting does not occur. They reported that cracks start from the pit generated by corrosion. They proposed 300 µm as the critical depth of the corrosion pit according to corroded specimen tests and FE analysis. However, although they evaluated the crack initiation life in the wheel web plate using Sines’ criterion equation, they did not assess the crack propagation behavior. Evaluating the crack growth characteristics in the web plate of the wheel is essential for determining appropriate inspection intervals and assessing the critical crack length.
Ao et al. 13 presented a model to assess the remaining life of the web plate of high-speed railway wheels. They assessed the life at which cracks occur in wheels using the P-S-N curve and predicted the remaining life using the NASGRO model. However, they did not consider the residual stress generated during manufacturing for fatigue life assessment of wheels and crack growth analysis. In the case of railway wheels, residual stress has a significant effect on fatigue life and therefore must be considered. 14 Moreover, the crack growth analysis was limited to the stage before the surface crack propagated into a through-wall crack. However, since the wheel is a large-scale structural component, it is essential to evaluate the overall crack growth behavior even after the surface crack has progressed into a through-wall crack, in order to ensure effective crack monitoring and maintenance.
Wheels undergo wear and RCF damage due to repeated rolling contact with rails. The hardness of the contact surface needs to be increased to reduce wear, and CRS should be generated to reduce RCF damage. To this end, the wheel rim is subjected to heat treatment. EN 13262 15 specifies the heat treatment of wheels as well as the hardness and residual stress of the rim. Specifically, if the CRS is less than −200 MPa, the fatigue resistance of the web plate must be evaluated. Therefore, residual stress in the web plate from manufacturing should be considered when assessing its fatigue life.
In this study, a 3D FE analysis model was developed to evaluate crack propagation characteristics in high-speed railway wheel web plates. In addition, the residual stress characteristics of wheels were evaluated under various heat treatment conditions, and fatigue crack growth characteristics were investigated in terms of the magnitude of residual stress. The evaluation of crack growth characteristics in the wheel web plate was carried out under full-scale test conditions, considering only the lateral load, which is the dominant loading condition affecting fatigue crack growth.
Failure to high-speed railway wheels
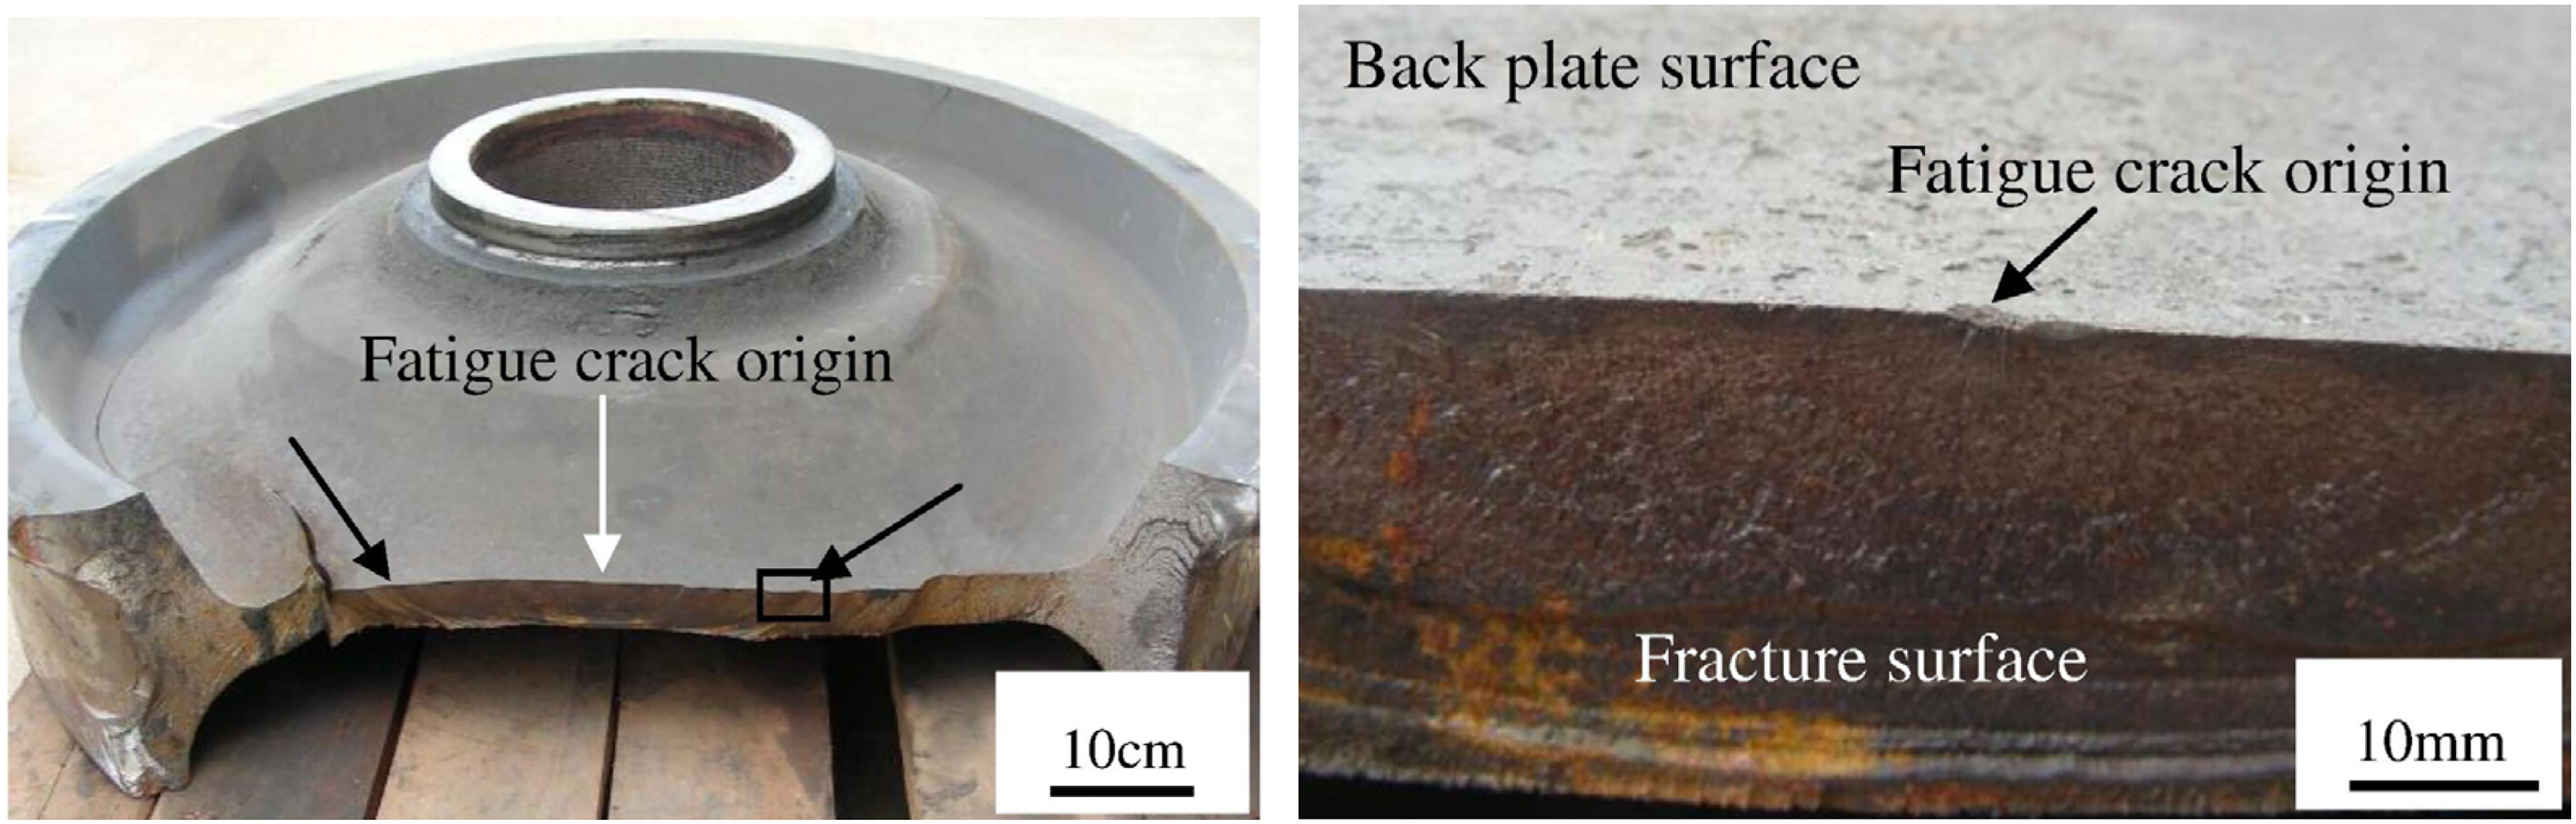
The wheels of railway vehicles are subjected to the cyclic contact loads caused by rolling contact with rails. For some vehicles, tread braking causes thermal loads. Damage to wheels mostly occurs in freight wagon wheels that use tread braking under a heavy axial load. 16 The damage to wheels is caused by the thermal cracks resulting from thermal loads and the contact fatigue cracks generated on the wheel contact surface by cyclic contact loads. However, there are cases in which high-speed railway wheels are fractured by cracking in the web plate as shown in Figure 1. 17 A fractured high-speed railway wheel does not make use of tread braking, and cracking starts from the web plate. Figure 2(a) shows the origin of cracking; note the beach mark caused by fatigue crack growth under cyclic loads. Figure 2(b) shows electron microscope images of the crack origin. The numerous voids in these images are supposed to develop into fatigue cracks due to cyclic loads on the wheel. 17
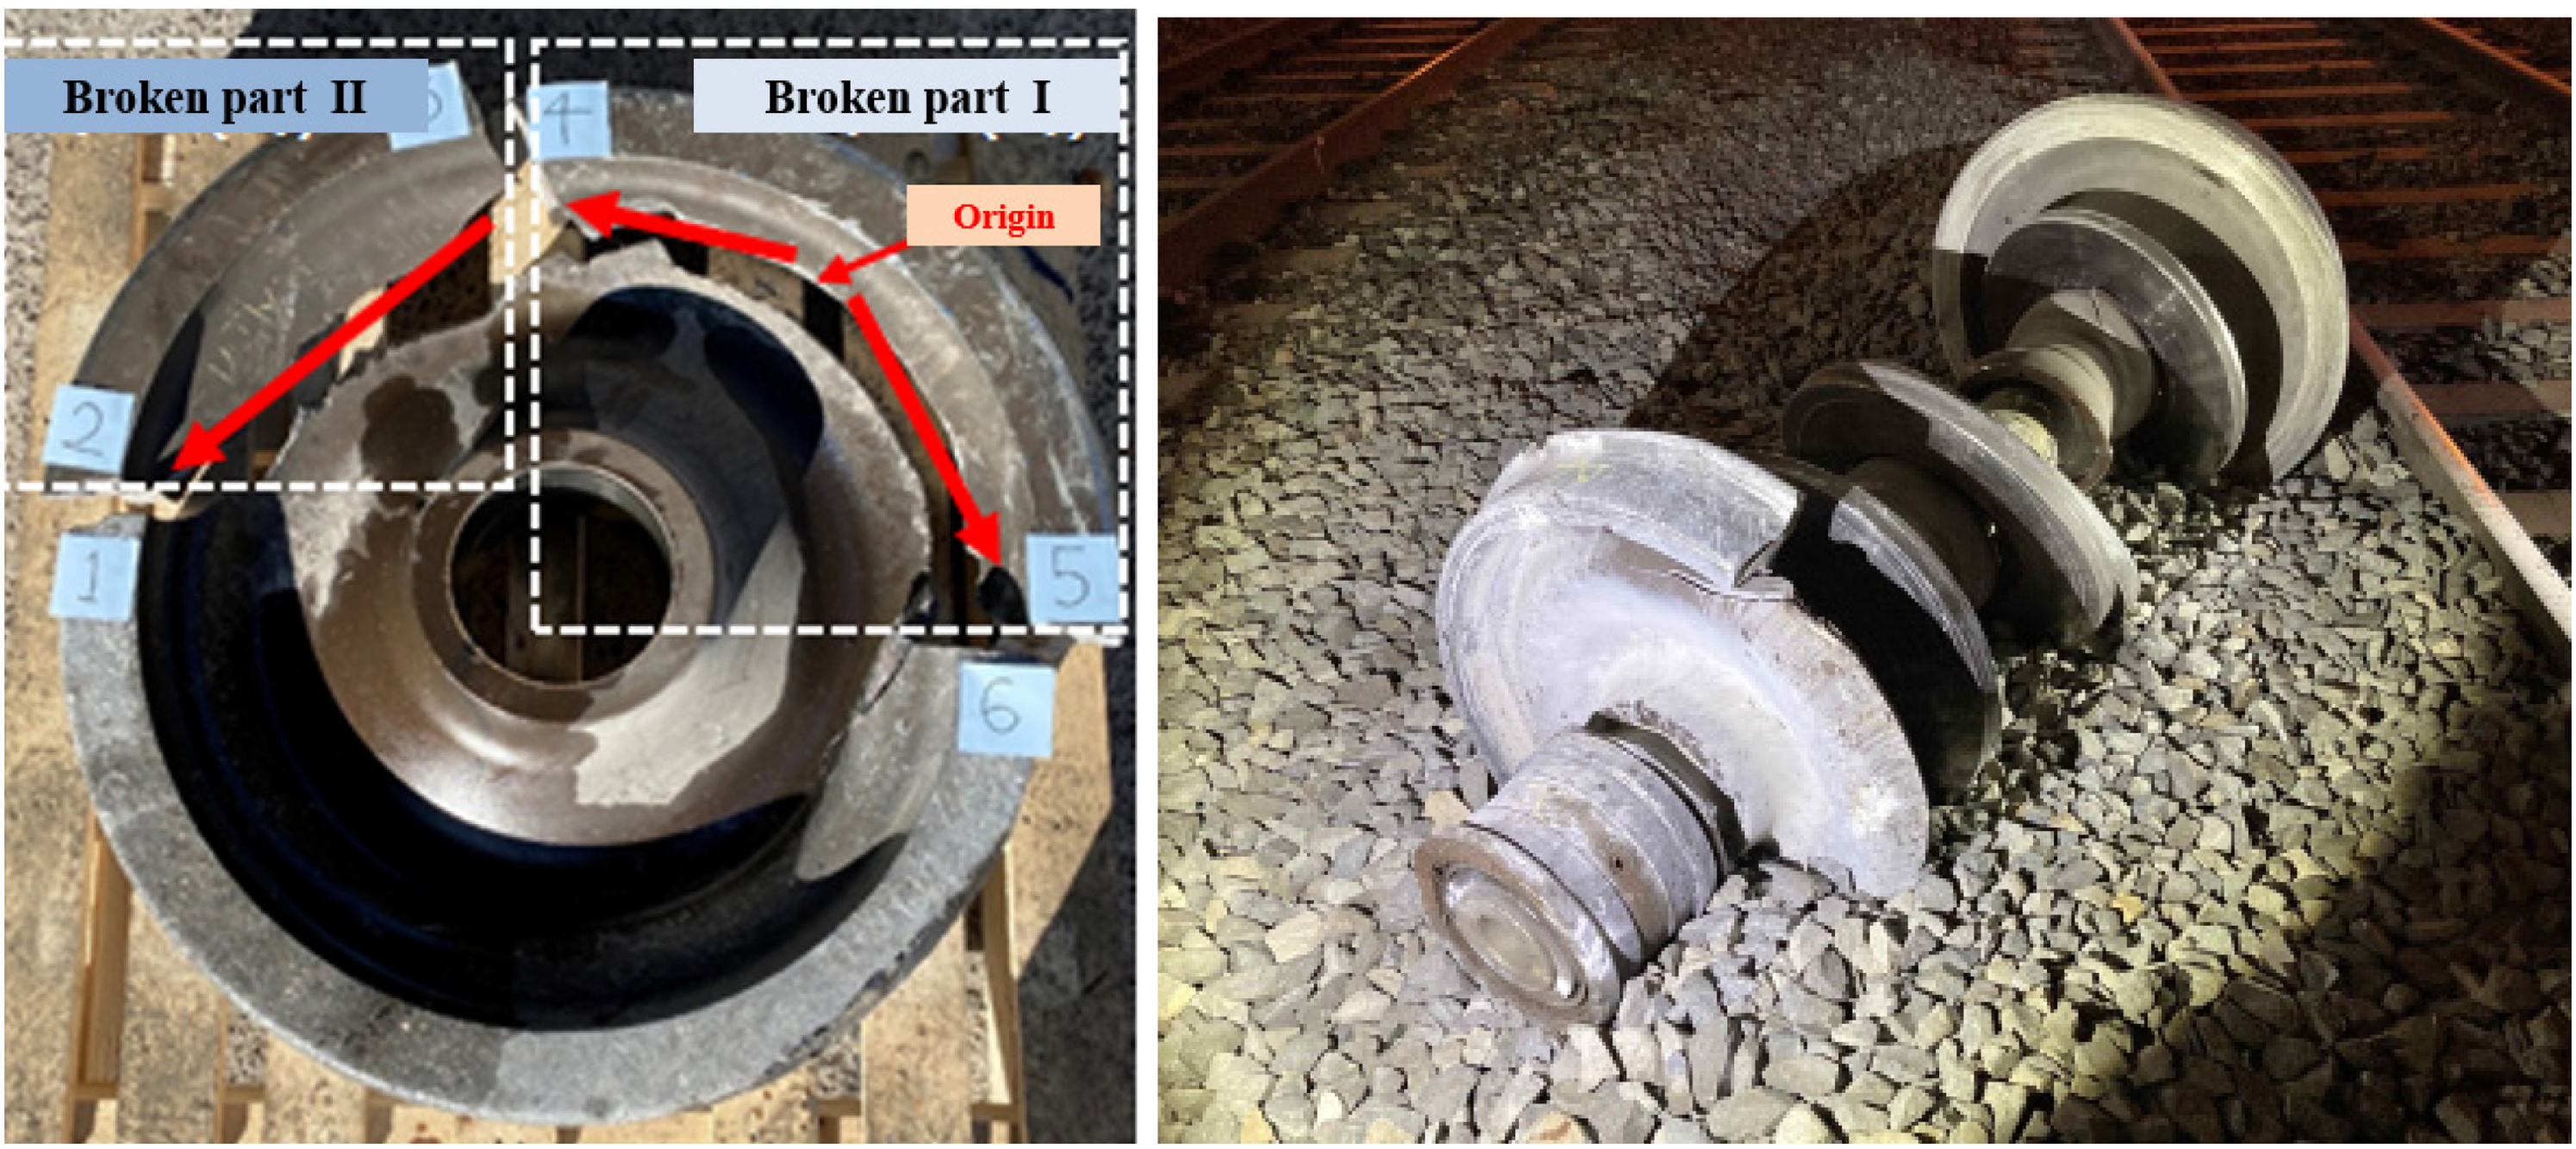
Damage to a high-speed railway wheel. 17
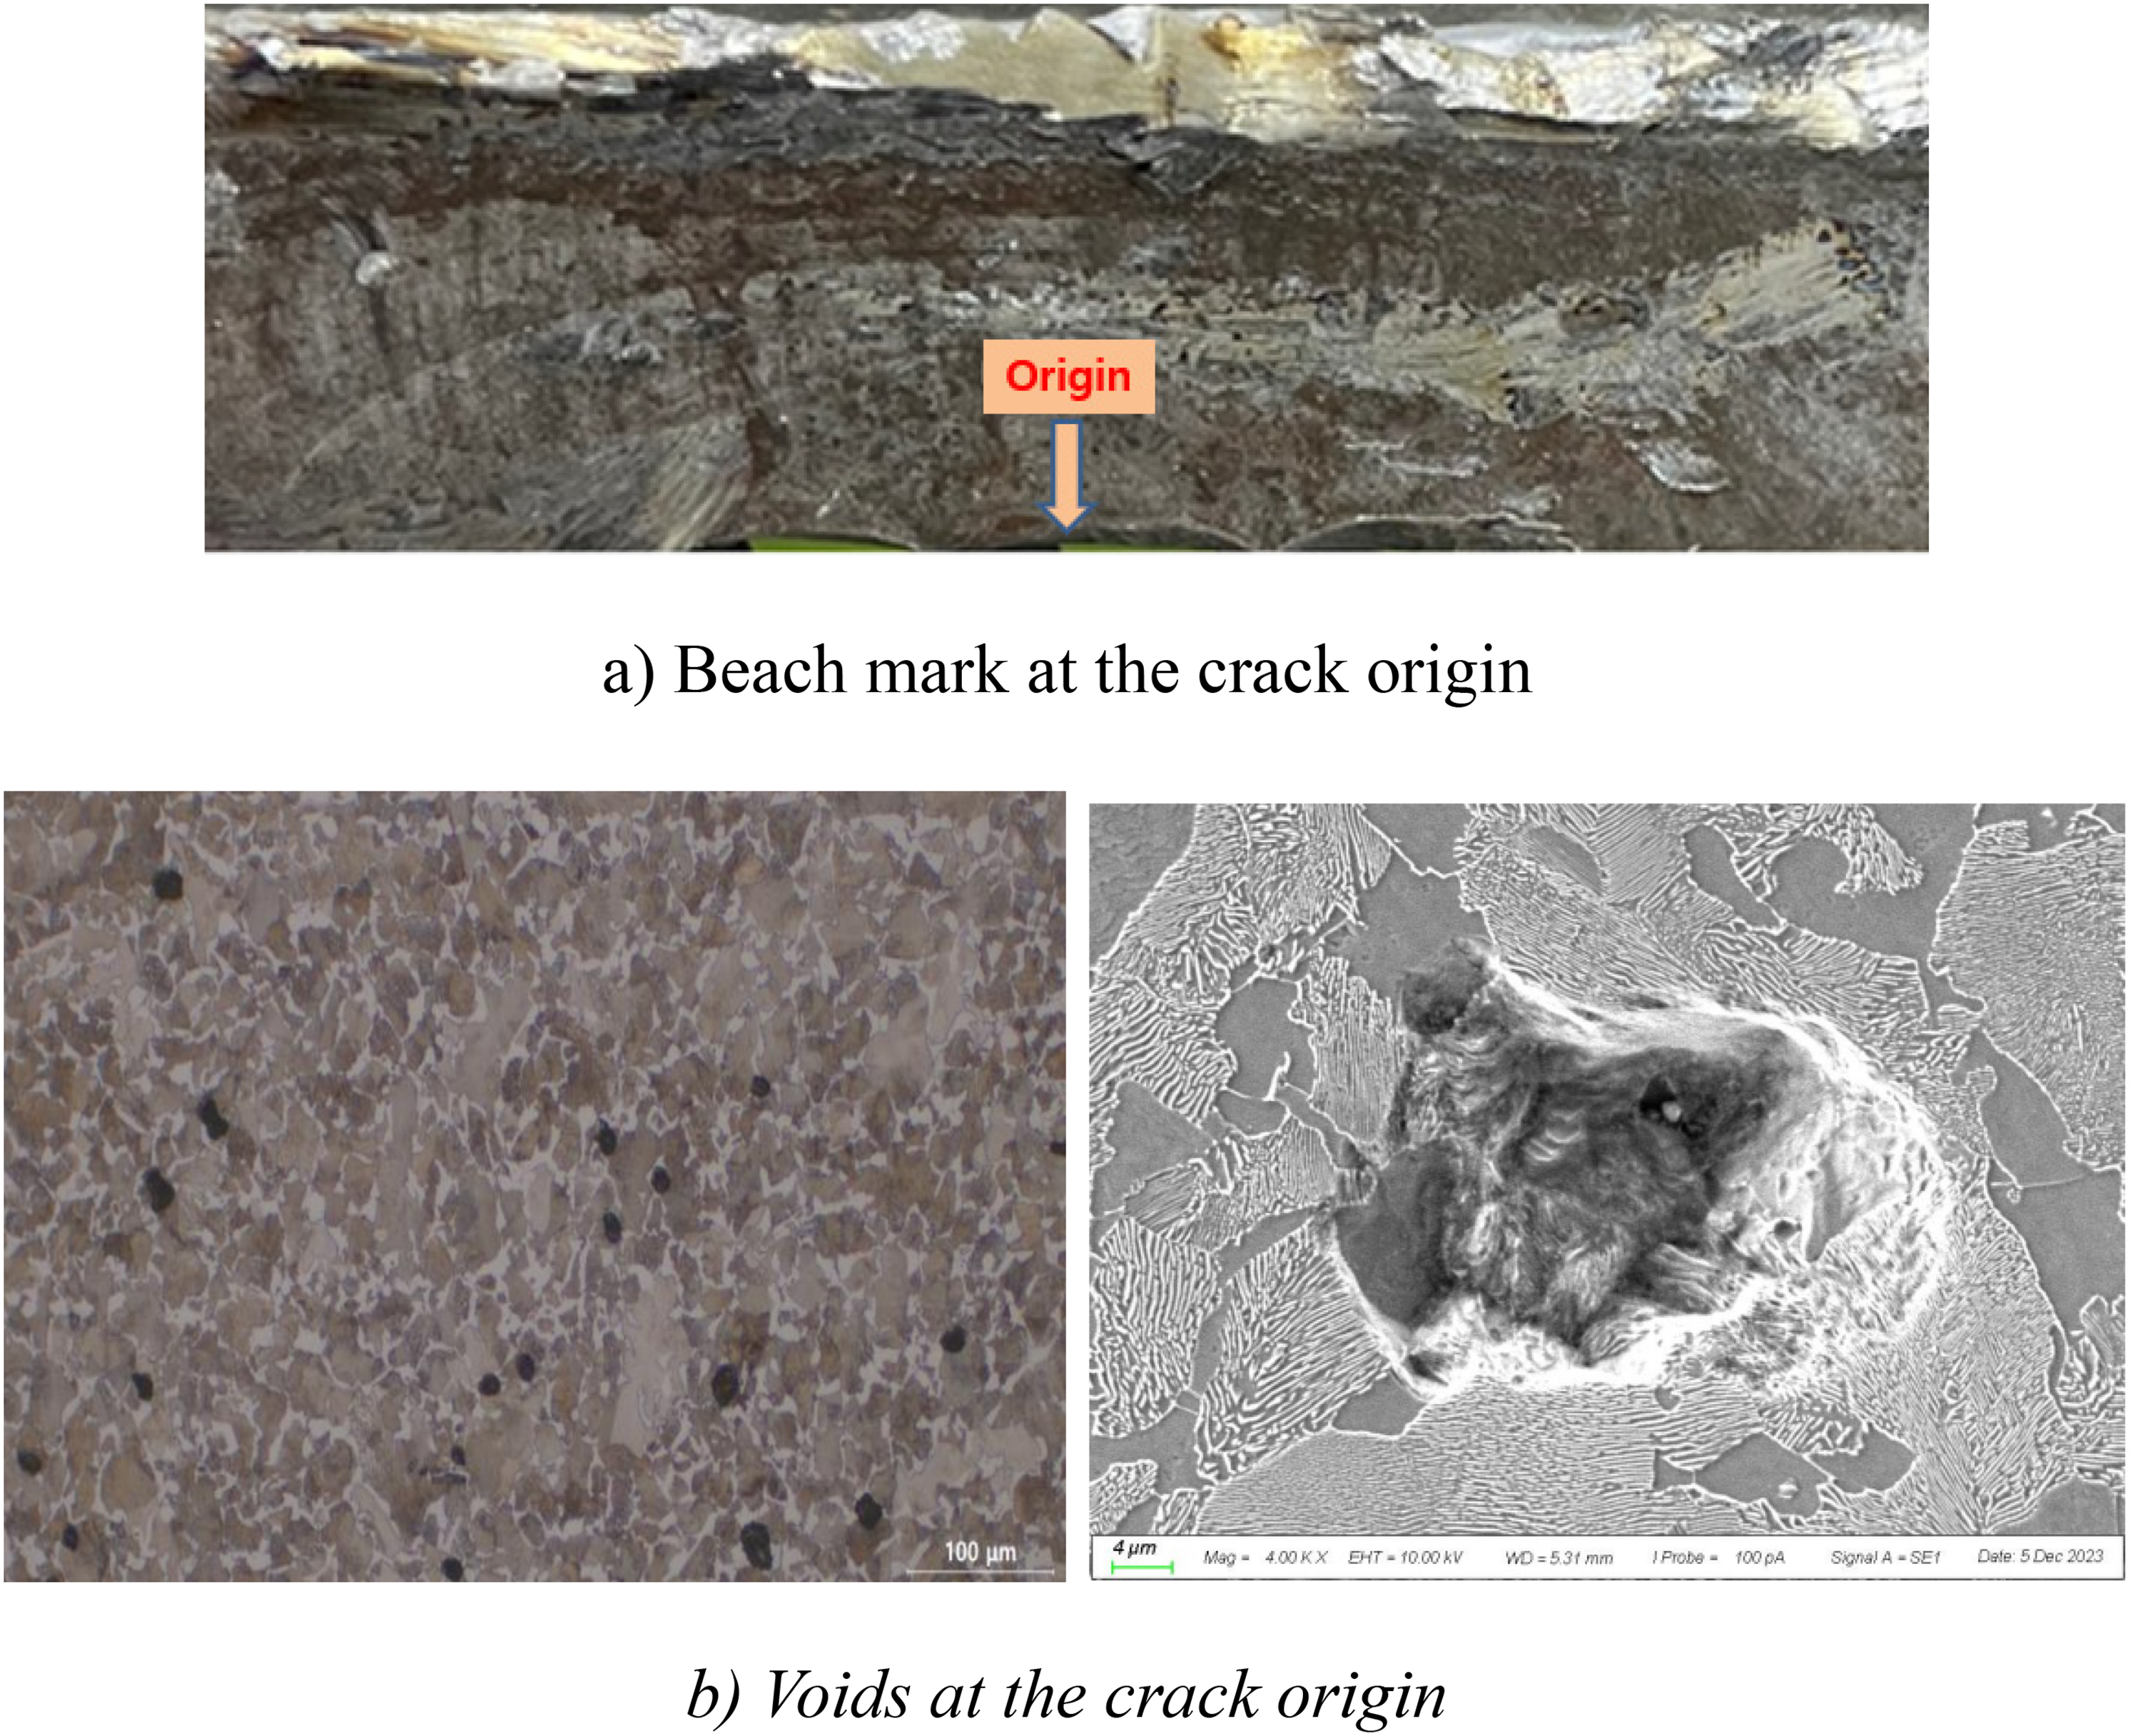
Crack origin and voids. 17
Cracks in the web plate are caused by lateral loads. Therefore, fatigue testing is conducted to evaluate the fatigue strength of the web plate according to EN 13262, as shown in Figure 3(a). Figure 3(b) shows the stress distribution under the application of lateral loads. The maximum stress occurs at the boundary between the boss part where the axle is pressed and the web plate. However, the crack location in the damaged wheel is the boundary between the rim and the web plate. Figure 4 shows the radial stress distribution under the application of lateral loads. Note that the crack location is not that of the maximum stress but the location of the second highest stress. In addition, owing to the special geometry of the wheel, the location of the maximum stress (outside) and the crack location (inside) are on opposite sides, but the stress direction is identical, as shown in Figure 4(a). The crack occurred at a location different from that of the maximum stress. It appears that the crack was caused by defects, such as voids. Figure 5 shows a locomotive wheel fractured by cracking in the web plate. Through SEM-based fracture surface analysis, it was concluded that the crack in the wheel web plate started from the pit caused by corrosion. 12 This indicates that the crack was caused by surface damage or defects along with cyclic loads.
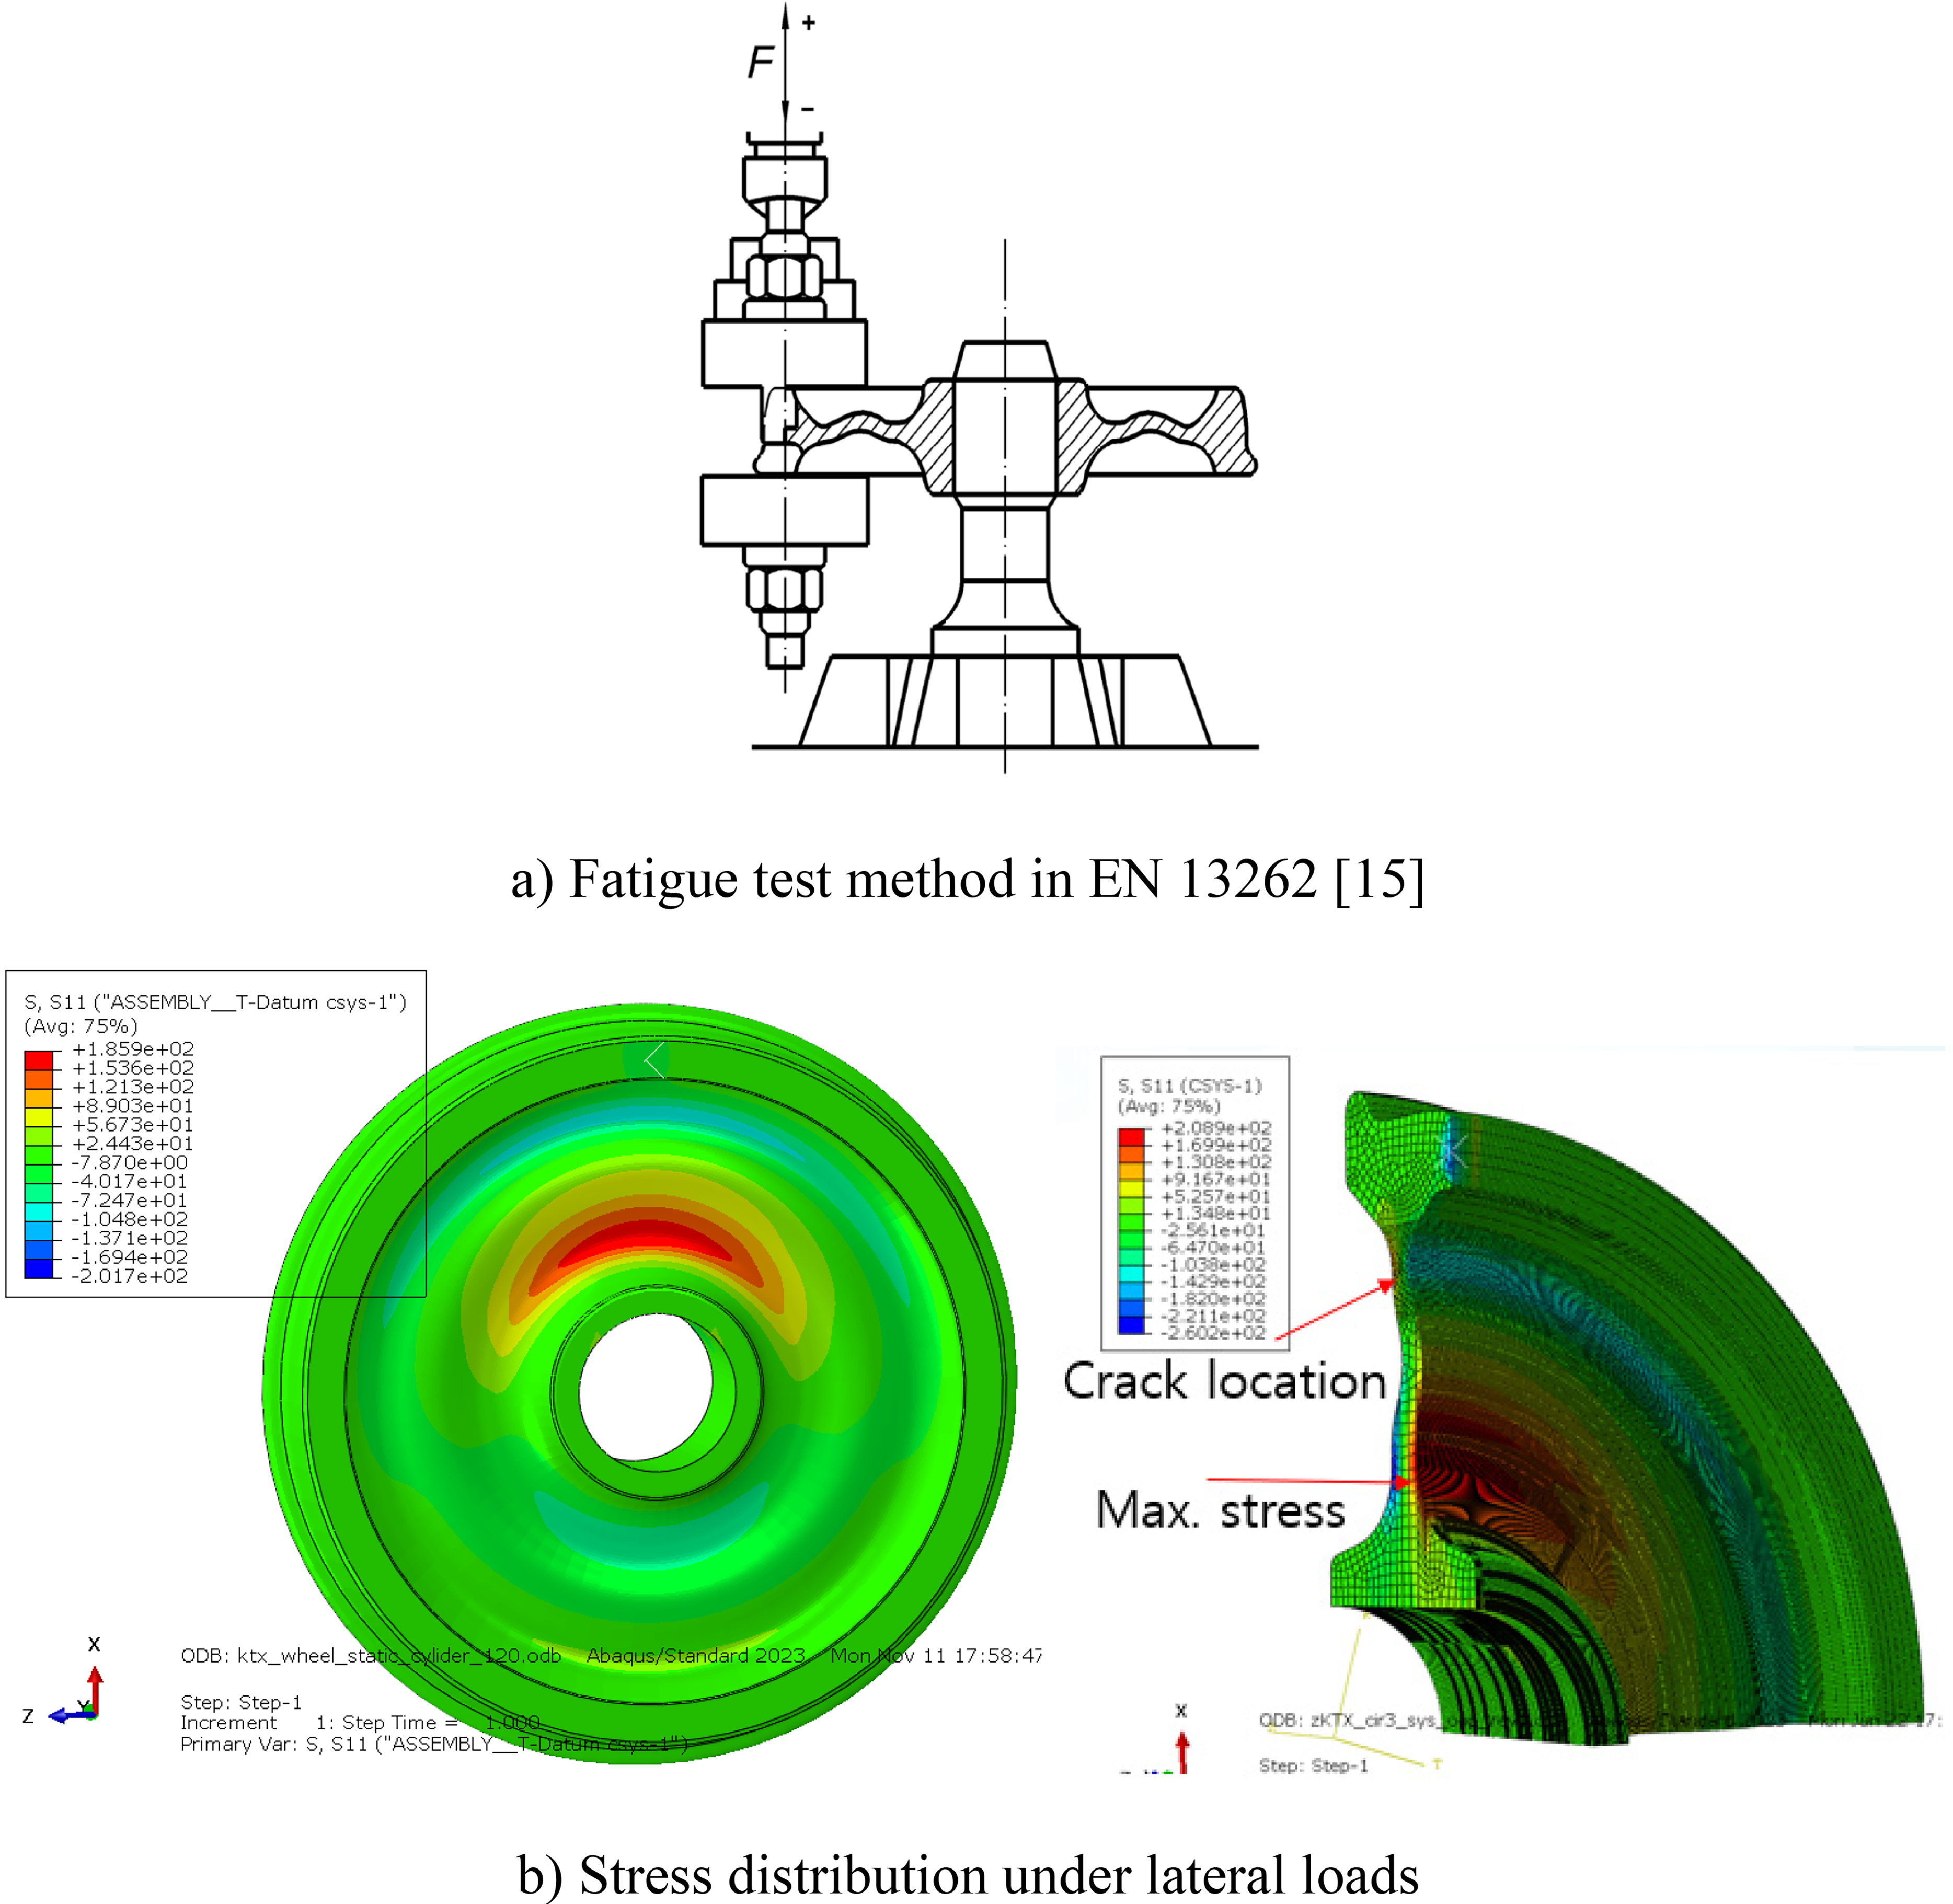
Fatigue test method in EN 13262 and stress distribution under lateral loads.
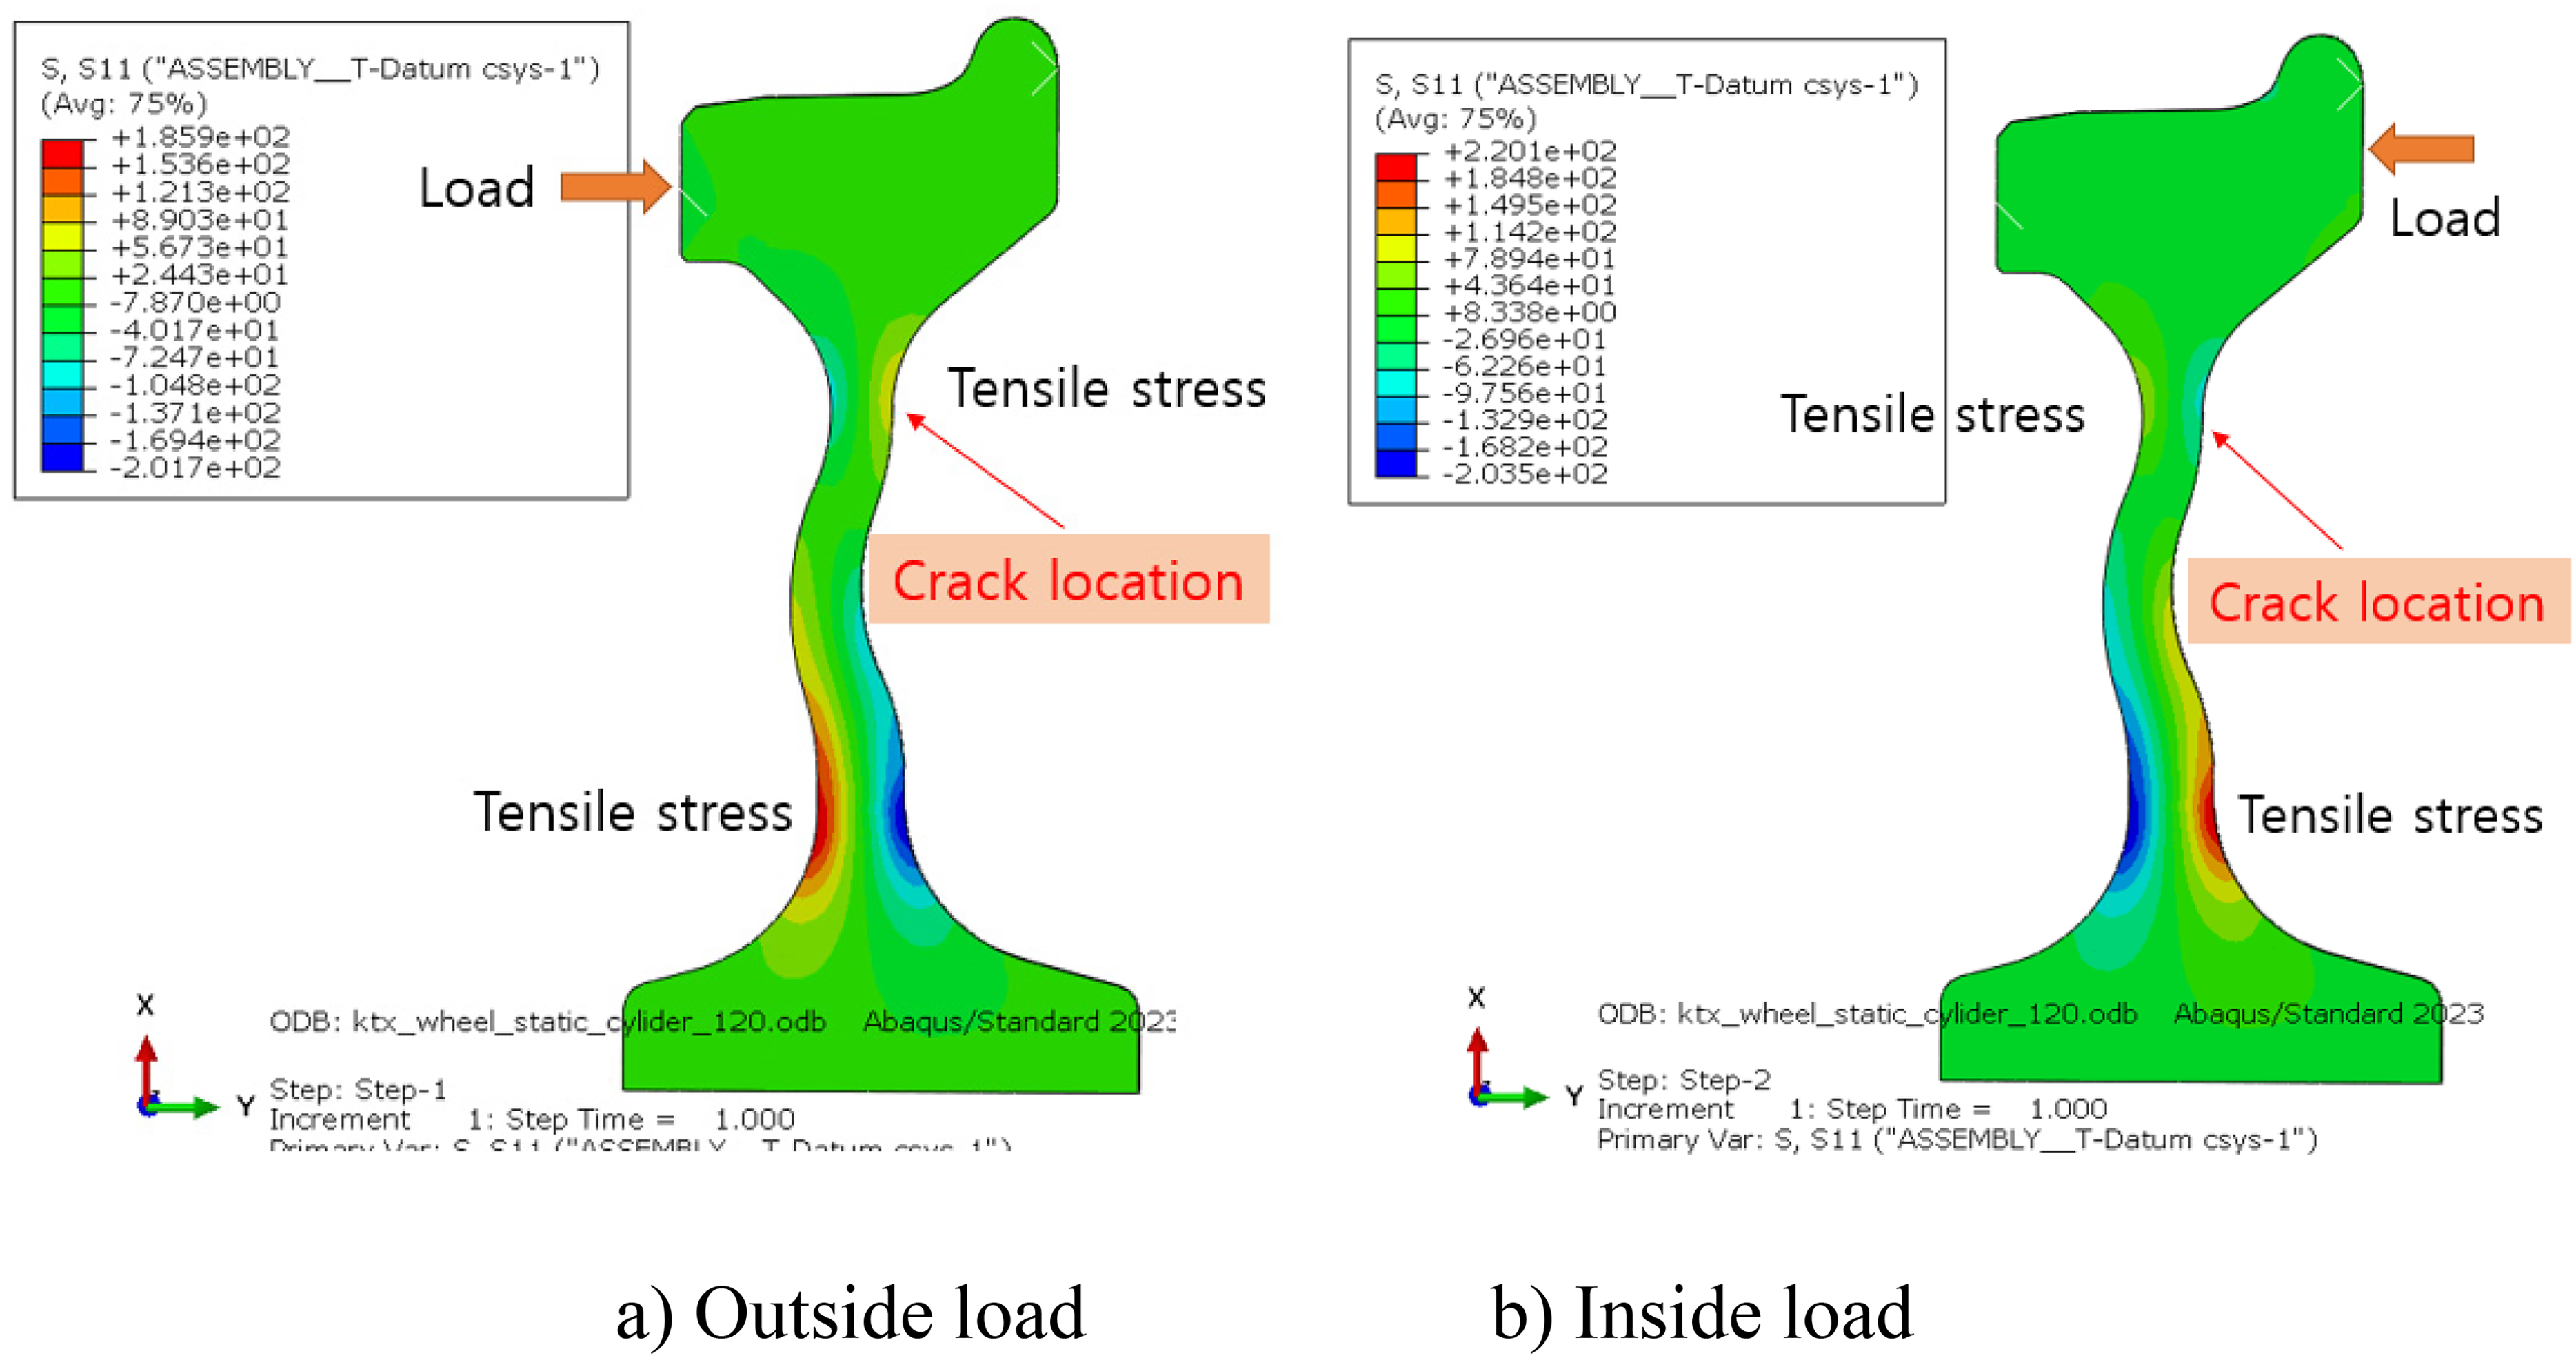
Stress distribution according to the lateral load direction.
An example of crack in the wheel web and its growth. 12
Residual stress analysis
FE model
Wheels are subjected to heat treatment to reduce wear and contact fatigue damage to the contact surface with rails. CRS in the rim generates TRS in the web plate. Figure 6 shows the heat treatment process for typical wheels. In this process, quenching is performed on the wheel contact surface using water cooling after heating, and tempering is applied to the entire wheel, as shown in Figure 6(a). Figure 6(b) shows the temperature change and time in the heat treatment process. To evaluate the residual stress generated during the manufacturing of the wheel, the entire heat treatment process was simulated using FE analysis. Figure 7 shows the high-speed railway wheel geometry for residual stress analysis. Figure 8 shows the FE model for residual stress analysis. A quarter of the wheel was modeled using the symmetry of the loads and boundary conditions. The number of elements used for FE analysis was 242,624, and the number of nodes was 271,361.
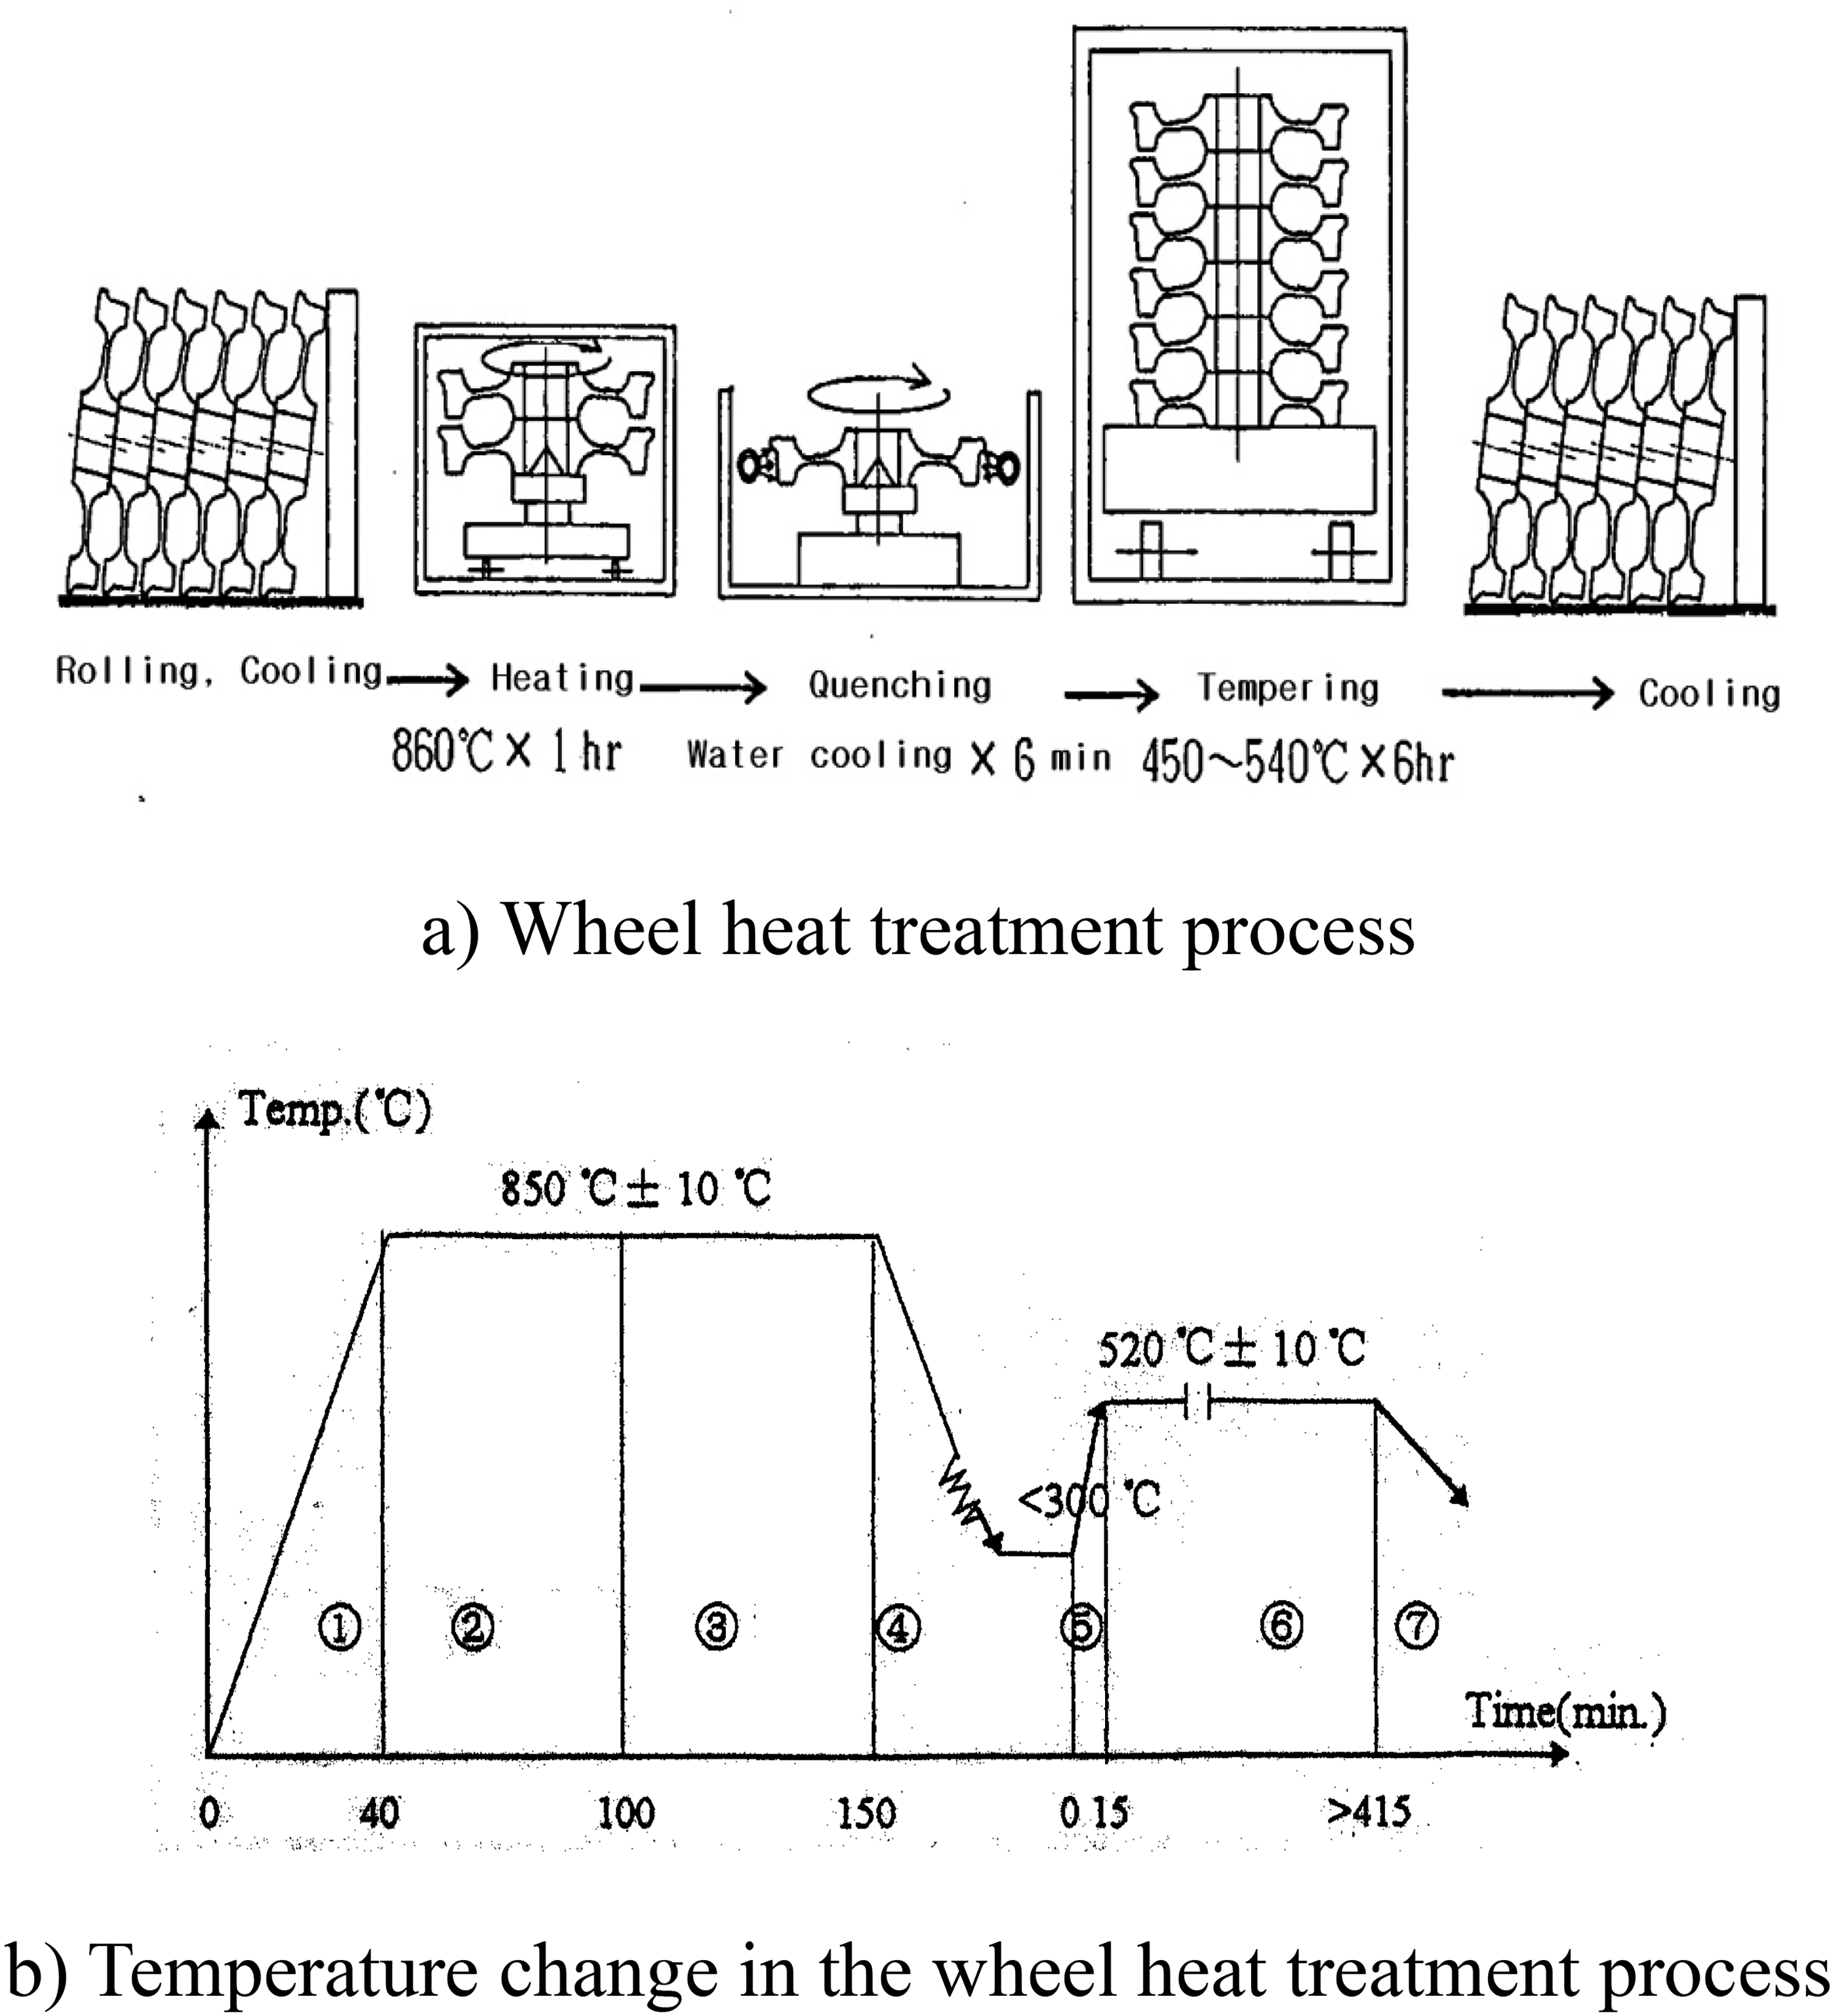
Wheel manufacturing process and heat treatment procedure. 18
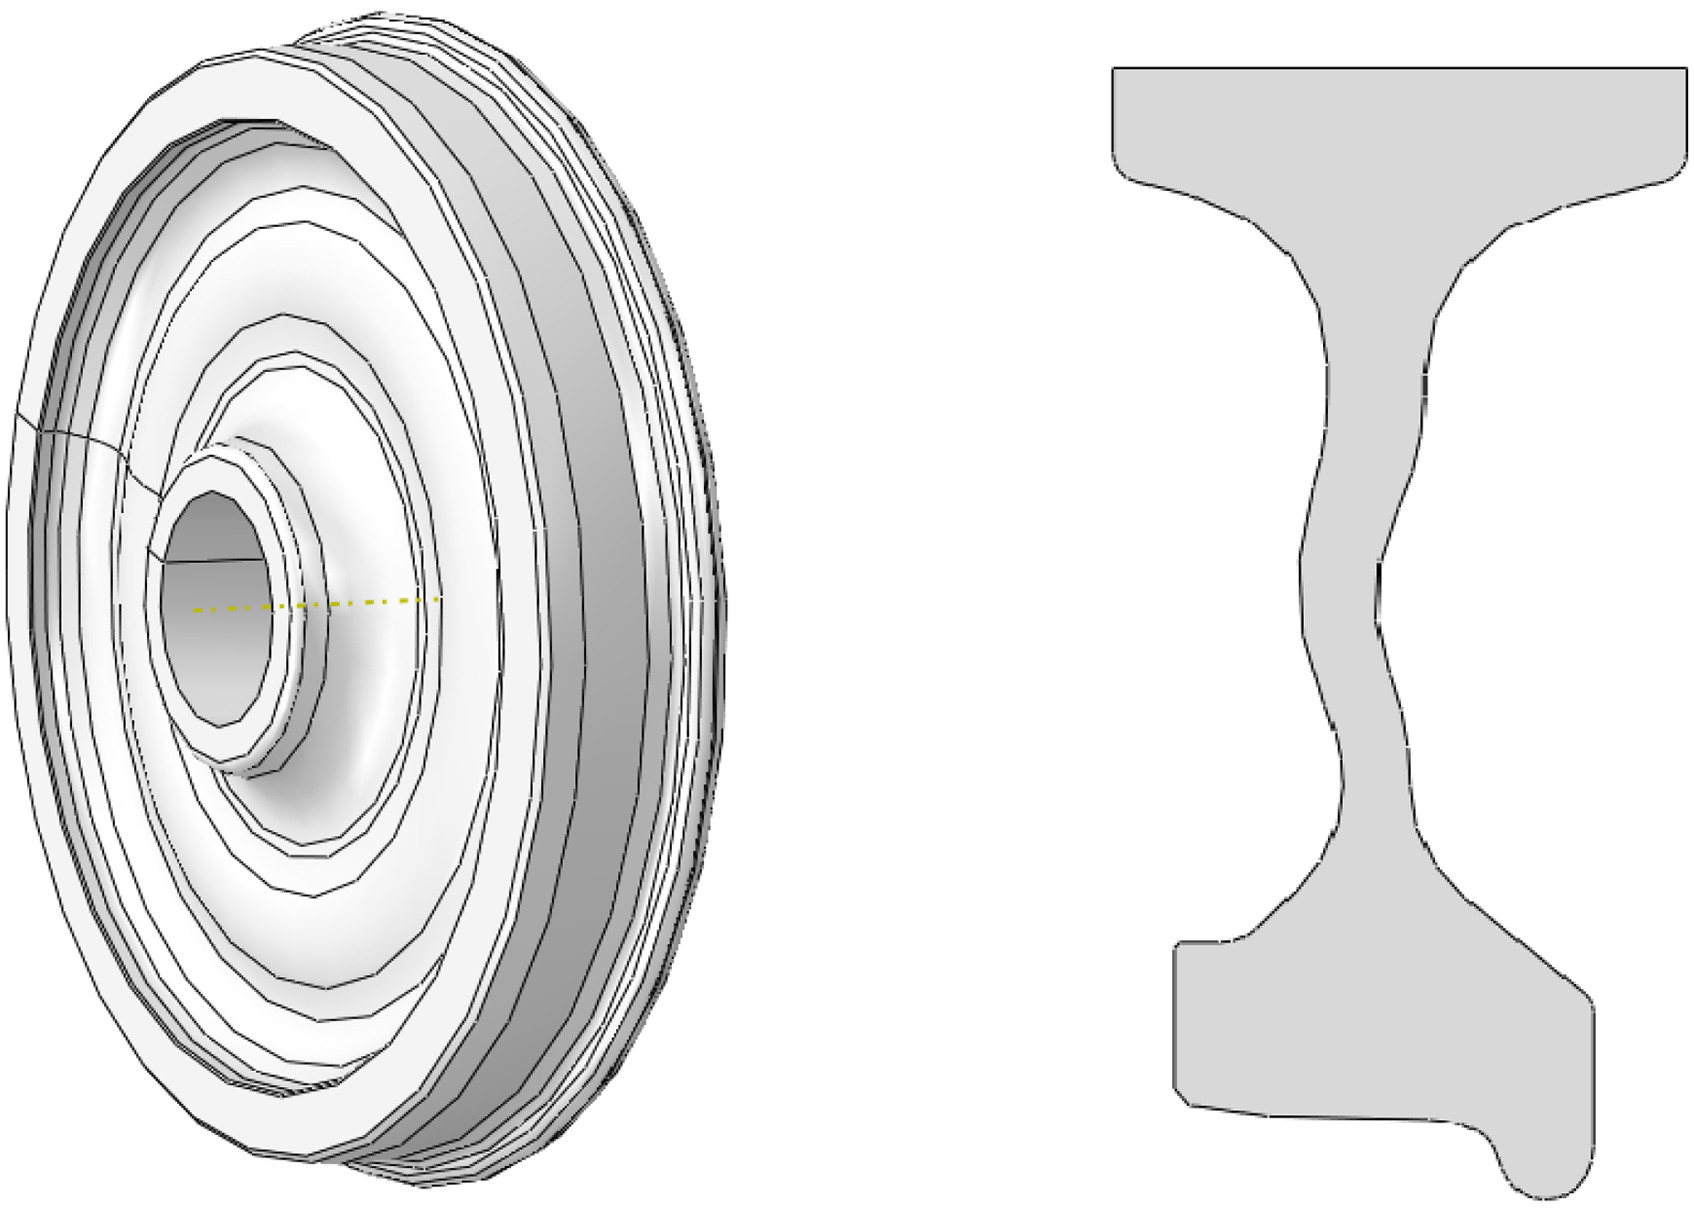
Wheel and tread geometries for residual stress analysis.
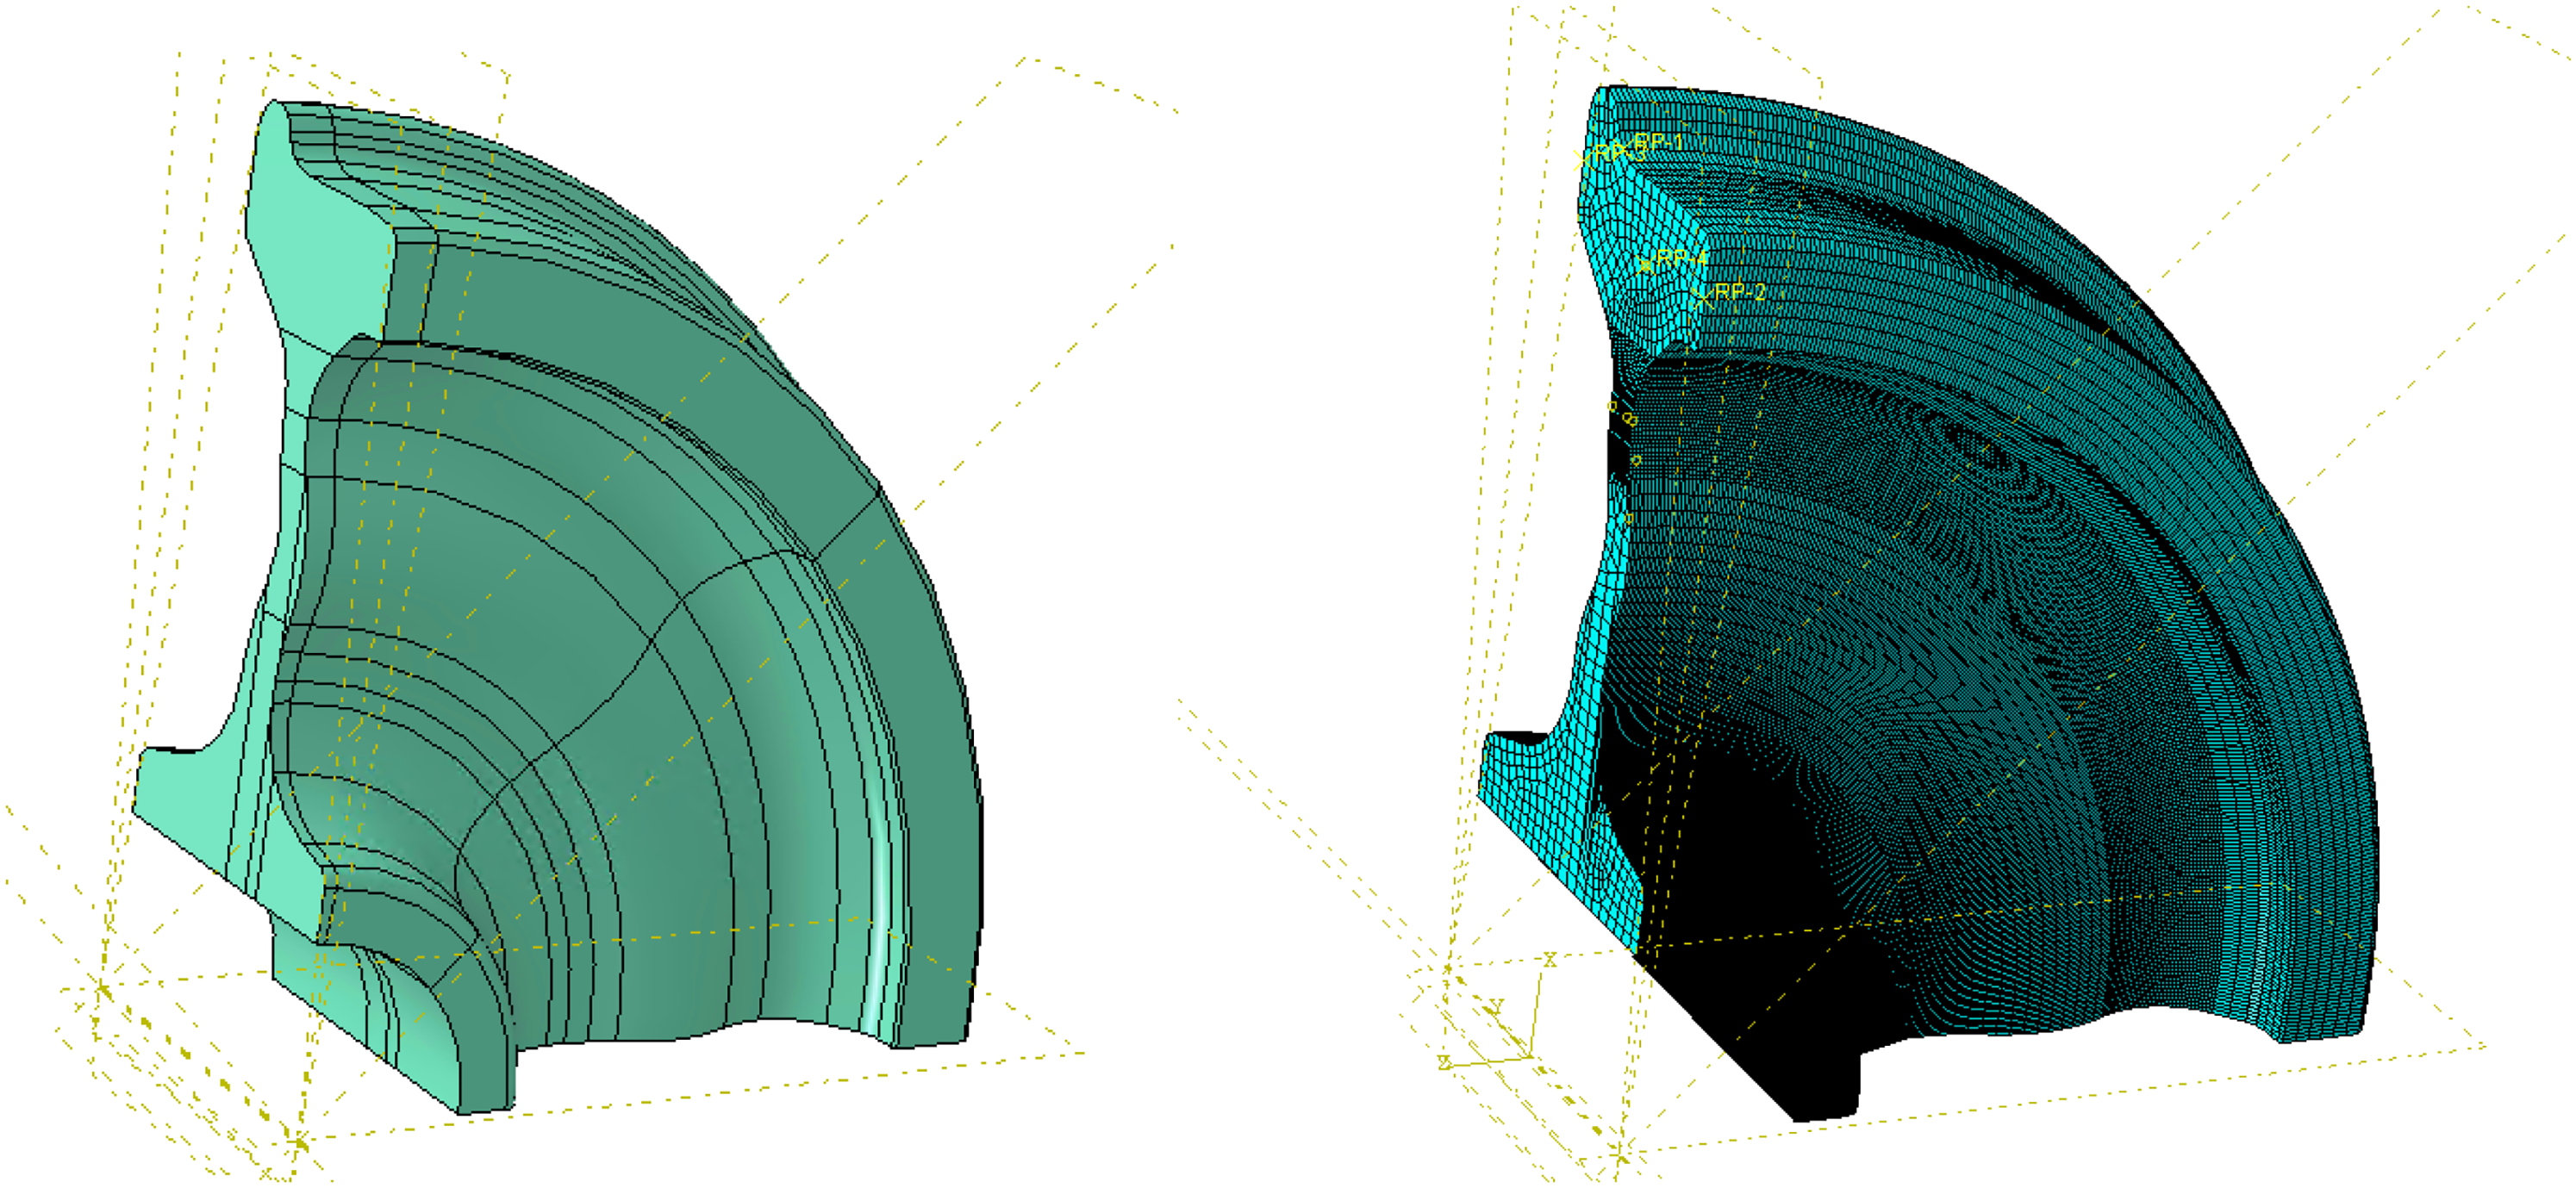
Fe model for residual stress analysis.
FE analysis method
Heat transfer analysis was conducted to evaluate the residual stress of a wheel. Based on this, thermal stress analysis was also conducted. The heat treatment process of a wheel is divided into heating, quenching, and tempering. In this instance, creep effects of the material should be considered.19,21 Without considering creep effects, residual stress is overestimated. Creep behavior was incorporated into the analysis using the formulation given in equation (1).
21

Where
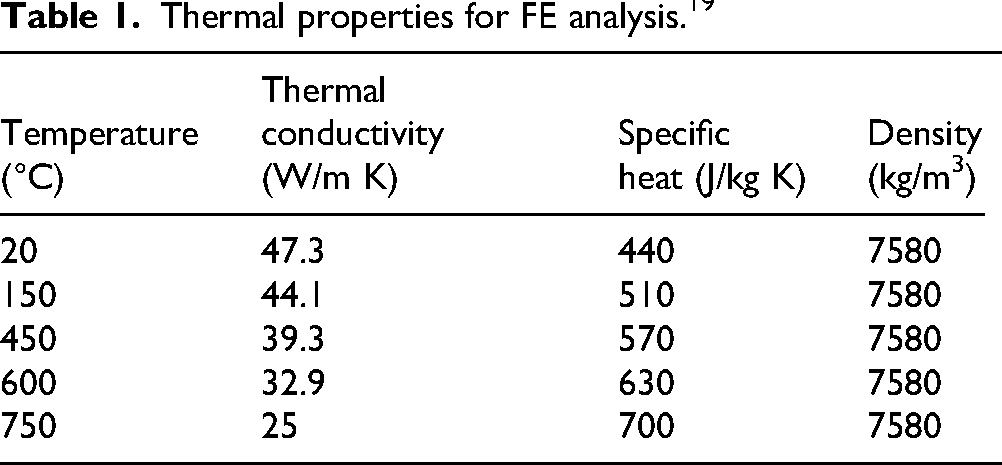
Material properties that depend on temperature must be considered for heat transfer and thermal stress analysis. The material properties used for heat transfer analysis are listed in Table 1 and those used for thermal stress analysis in Table 2. ABAQUS, a commercial FE analysis software program, was used for residual stress analysis.
Thermal properties for FE analysis. 19
Material properties for FE analysis. 19
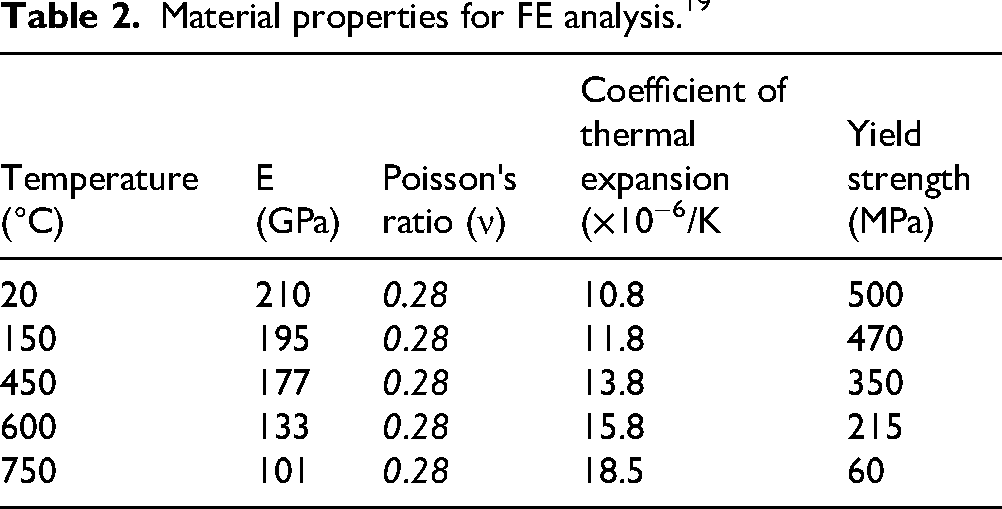
Figure 9 illustrates the heat transfer analysis process. The same stages as those of the wheel heat treatment process can be seen. Figure 10 shows the temperature changes of the rim and web plate during heat transfer analysis. Note that the temperature variation of the wheel from FE analysis is identical to that resulting from the heat treatment process (Figure 6(b)). Figure 11 shows the temperature variation during the quenching of the wheel contact surface. The temperature of the quenched rim sharply decreased while that of the web plate slowly decreased.
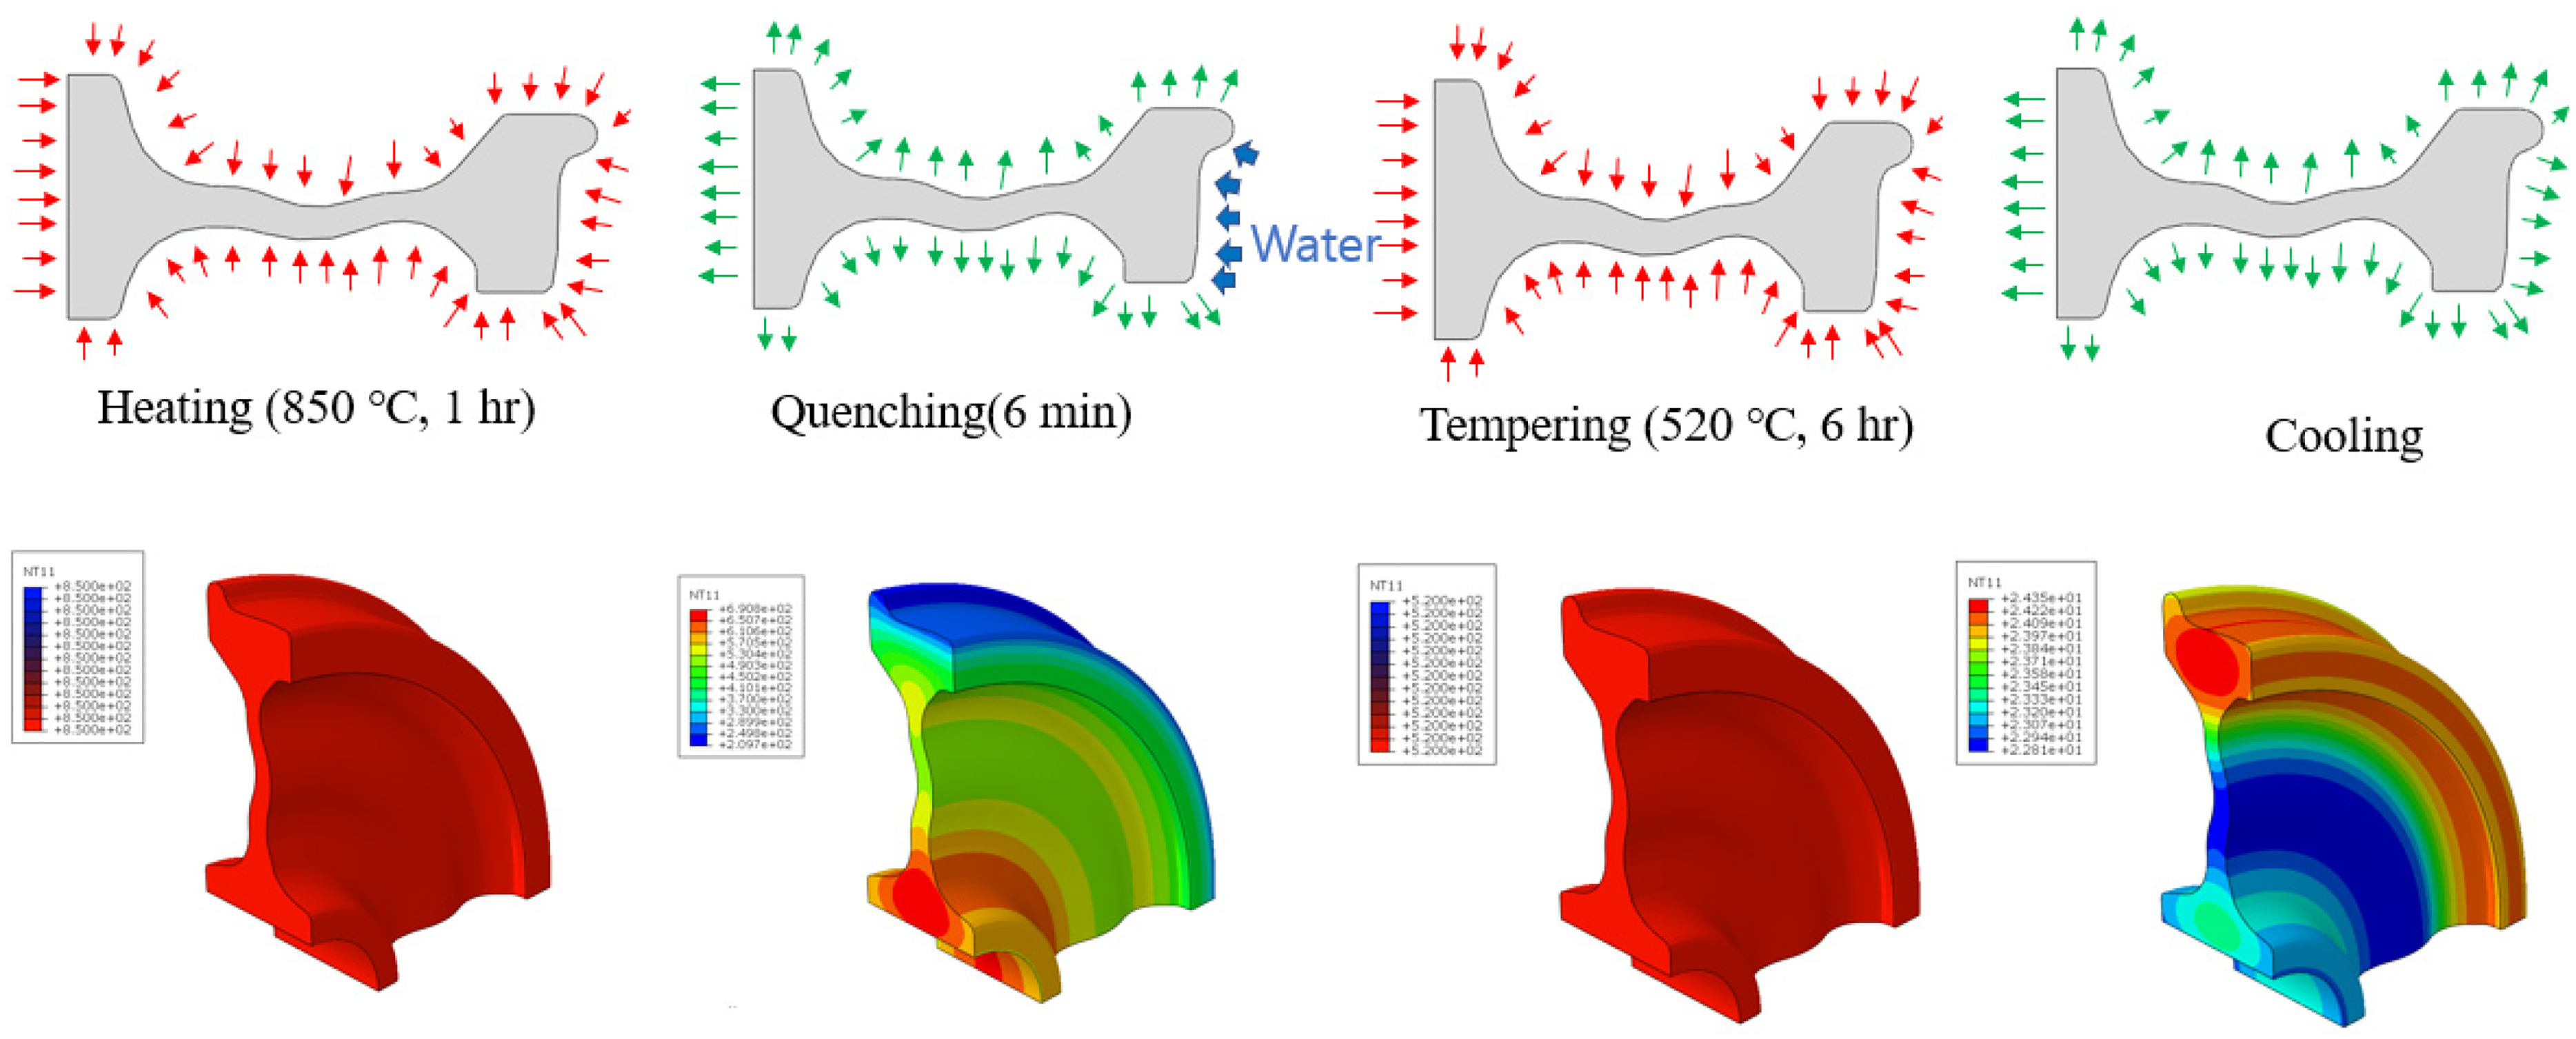
Heat transfer analysis method.
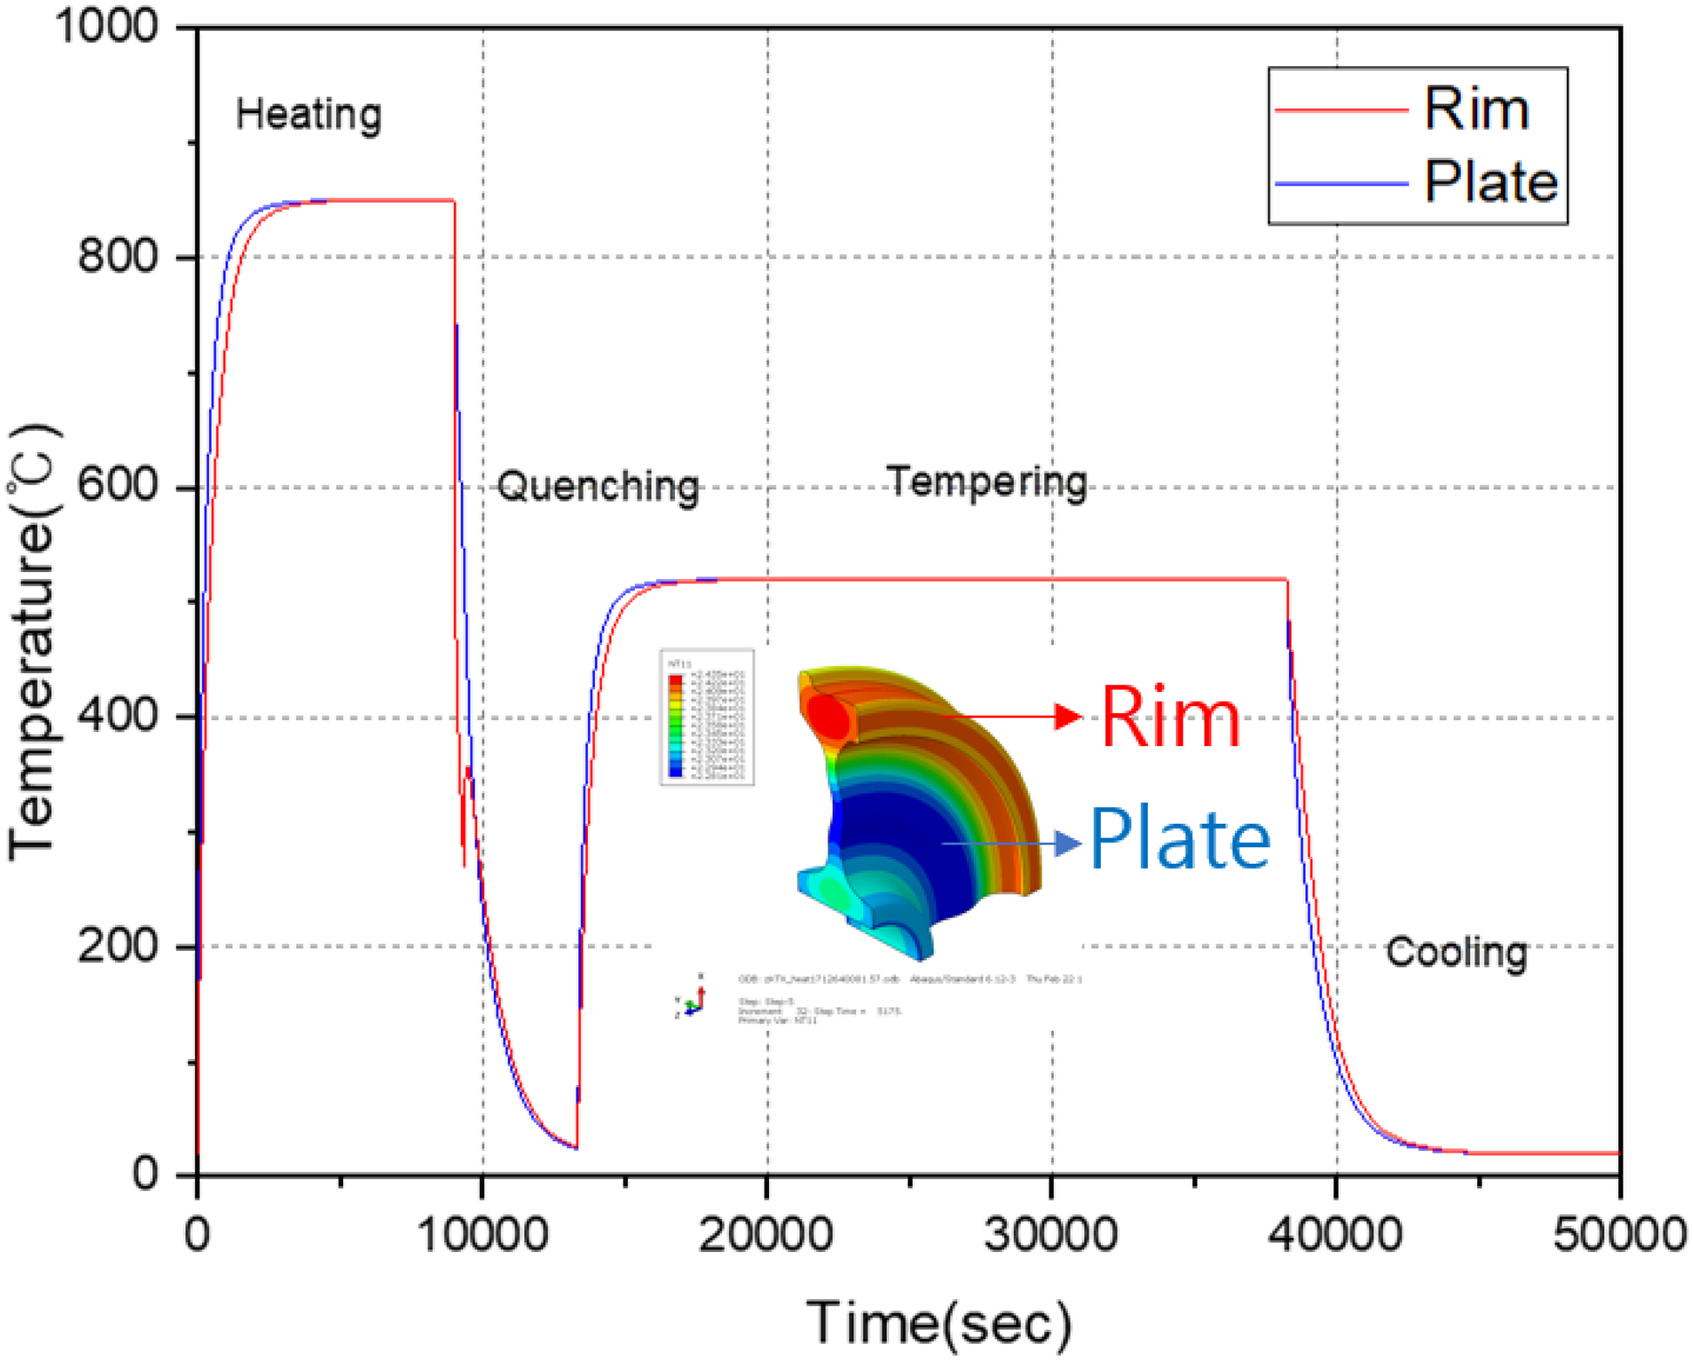
Temperature variation from wheel heat transfer analysis.
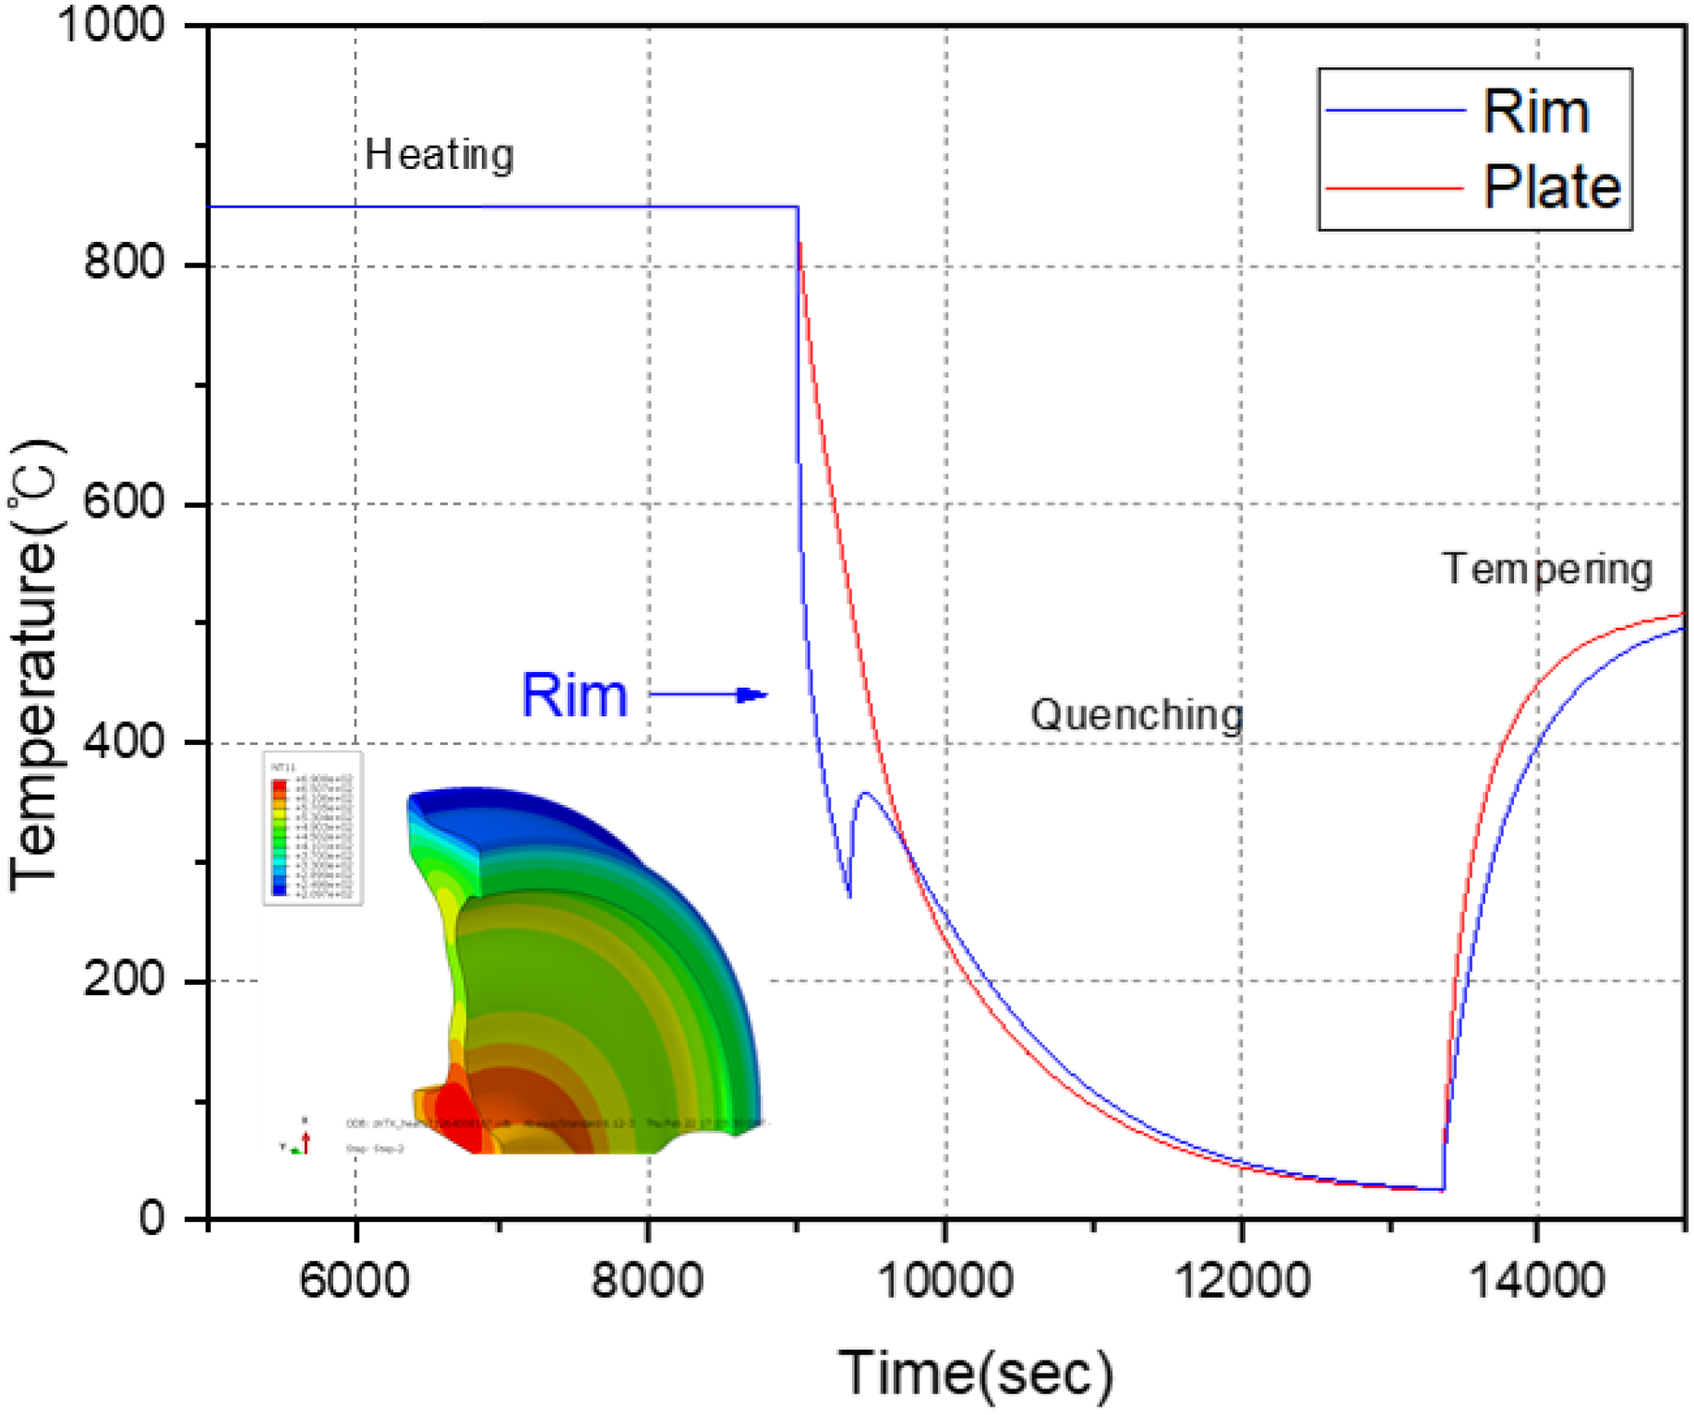
Temperature variation from wheel heat transfer analysis (quenching).
FE analysis results
Figure 12 shows the residual stress analysis results induced during the manufacturing process of the wheel, comparing the cases with and without the consideration of creep effects. Although the overall residual stress distributions are similar in both cases, a significant difference is observed in the magnitude of the stresses. CRS occurs at the wheel–rail contact surface, while tensile stress is generated at the center of the rim. Both TRS and CRS can be observed in the web plate. The overall distribution of residual stress is similar to that from the analysis results reported by Brunel et al., 19 despite the different geometry of the wheel web plate.
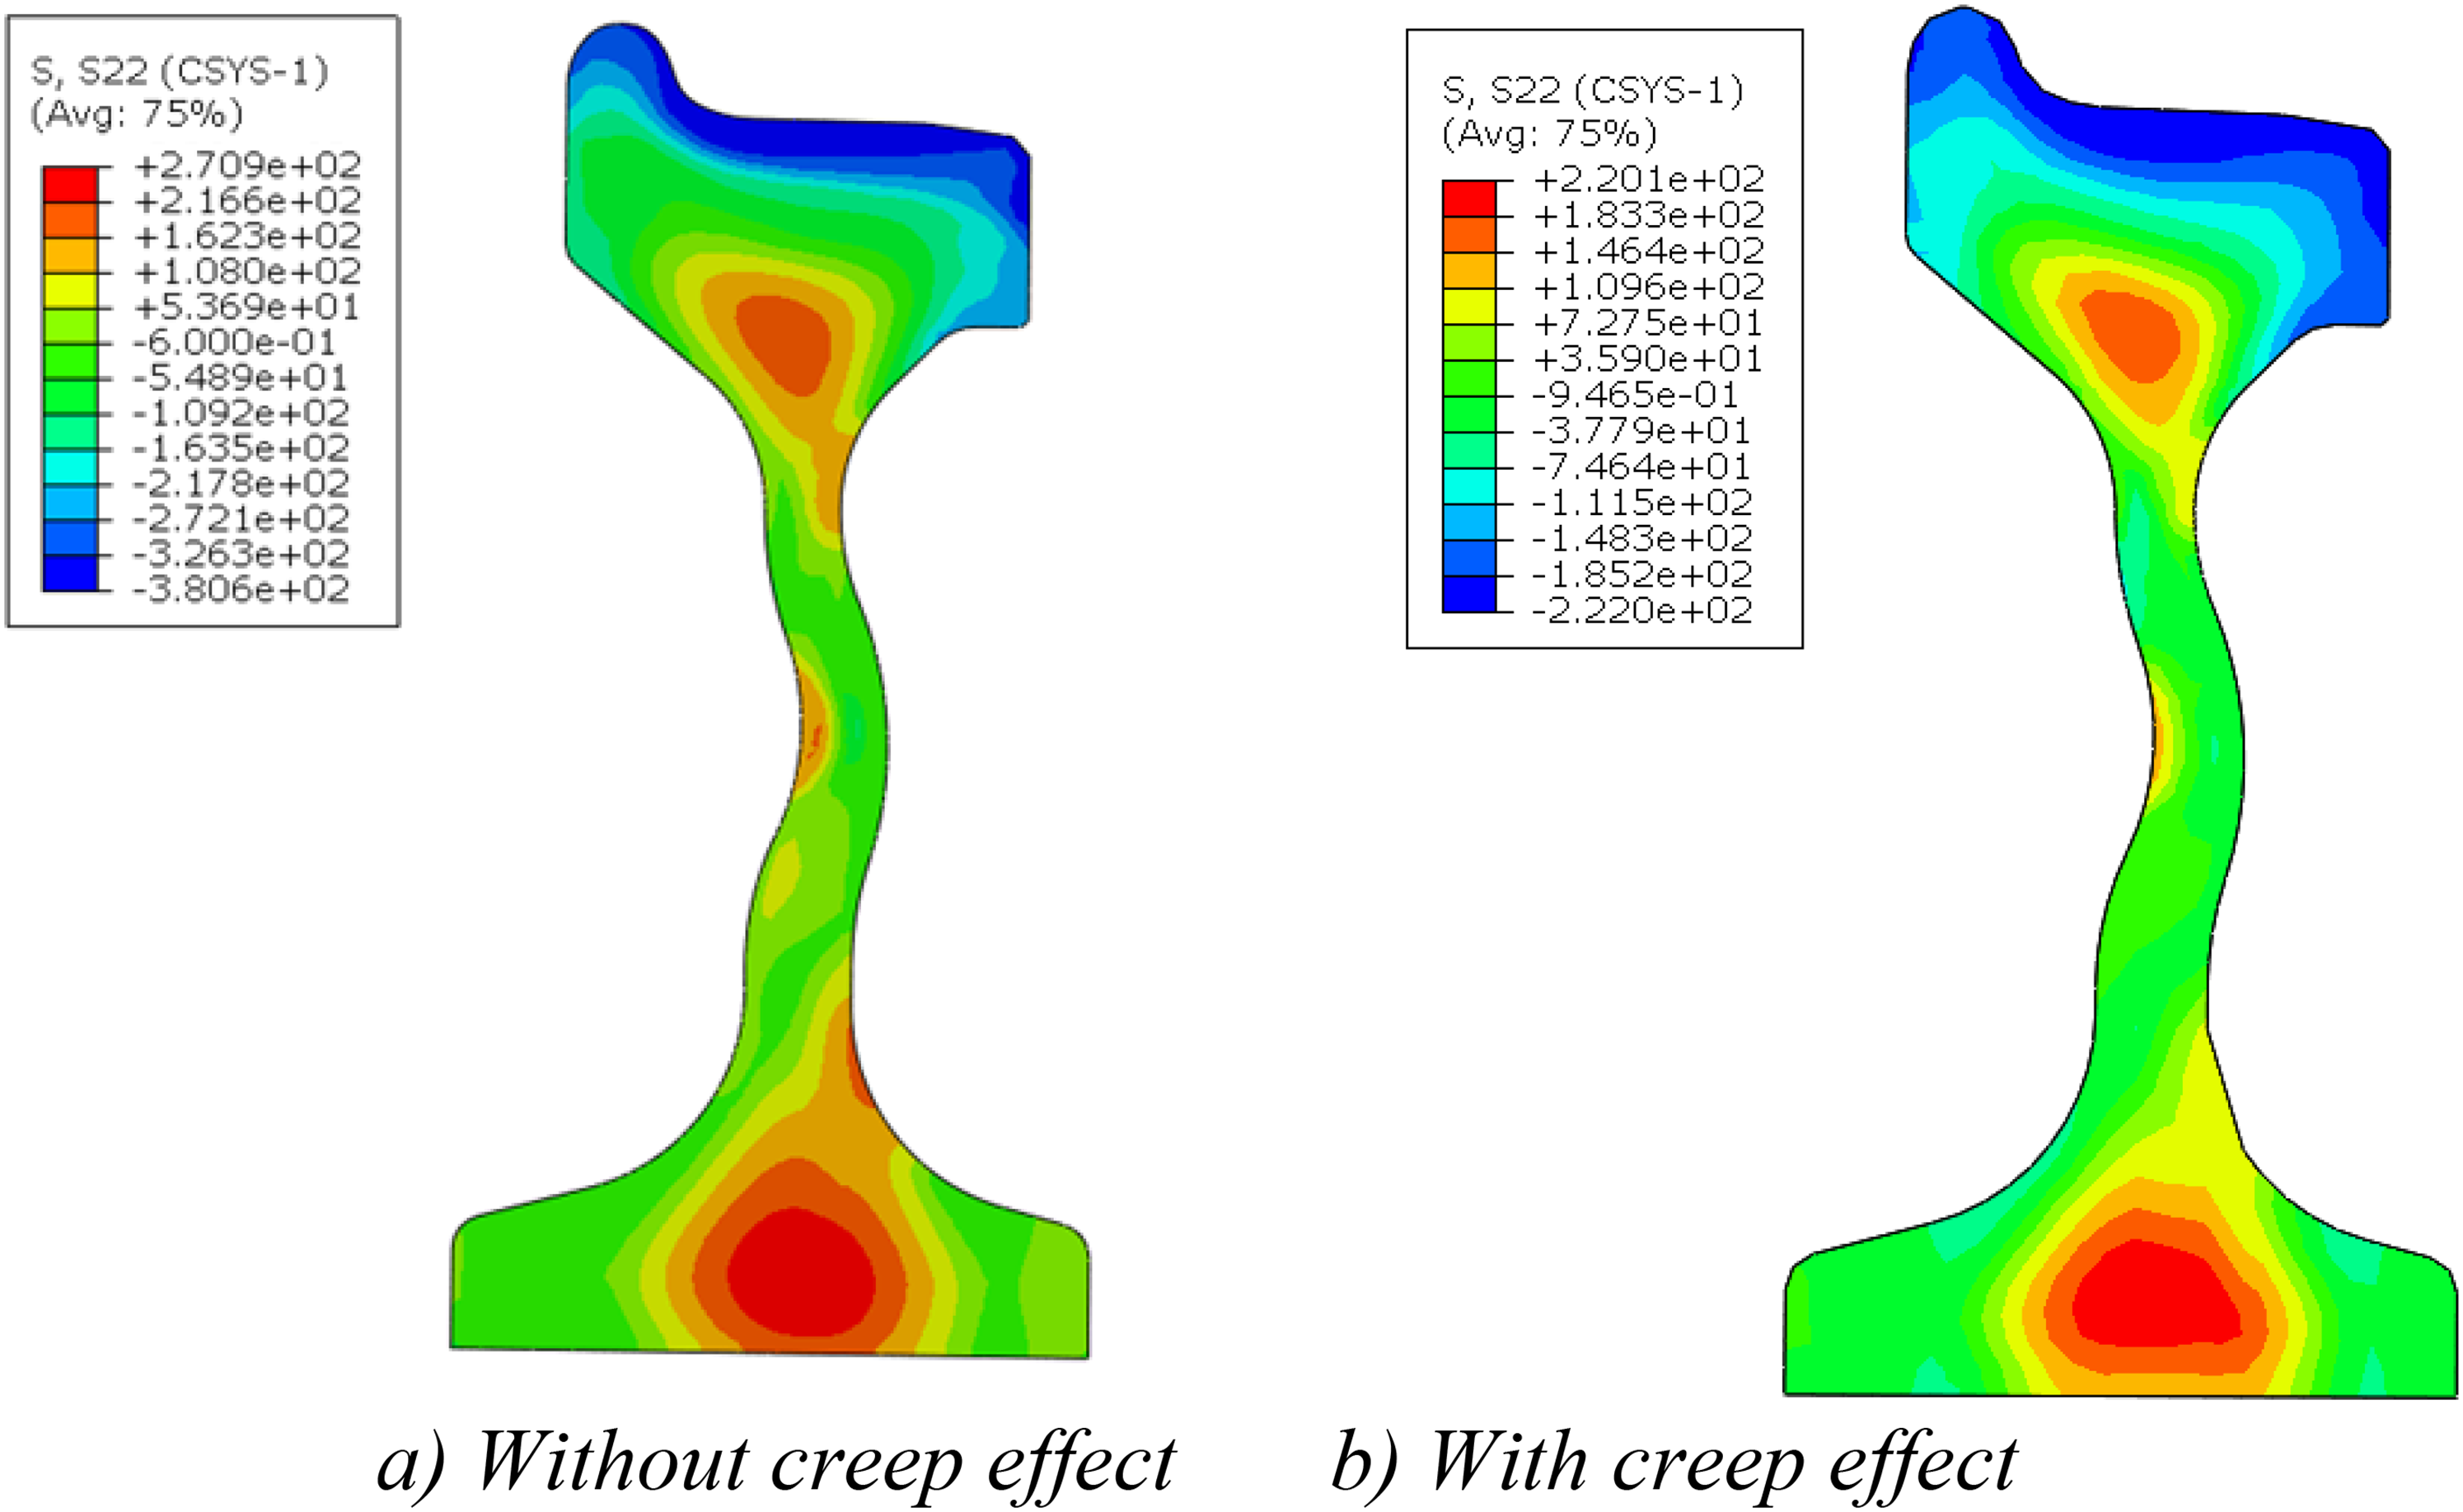
Residual stress analysis results with and without consideration of creep effects (circumferential stress).
Figure 13 presents the residual stress distributions along the depth direction of the wheel rim, comparing the cases with and without the consideration of creep effects. In both cases, the maximum CRS occurs at the wheel–rail contact surface and transitions to TRS at a depth of approximately 40 mm. The magnitude of the maximum CRS at the contact surface is −148 MPa when creep effects are considered, whereas it is −338 MPa without considering creep. These results indicate that the residual stress is overestimated when creep effects are not considered. When creep effects are included, the magnitude of the maximum CRS at the contact surface is comparable to that of the maximum TRS at the center of the rim. The circumferential CRS generated by the heat treatment of the wheel is important because it suppresses the cracks caused by rolling contact. Therefore, EN 13262 specifies the maximum CRS of the contact surface and the depth at which CRS changes into TRS. It also presents methods for measuring the magnitude and depth of residual stress.
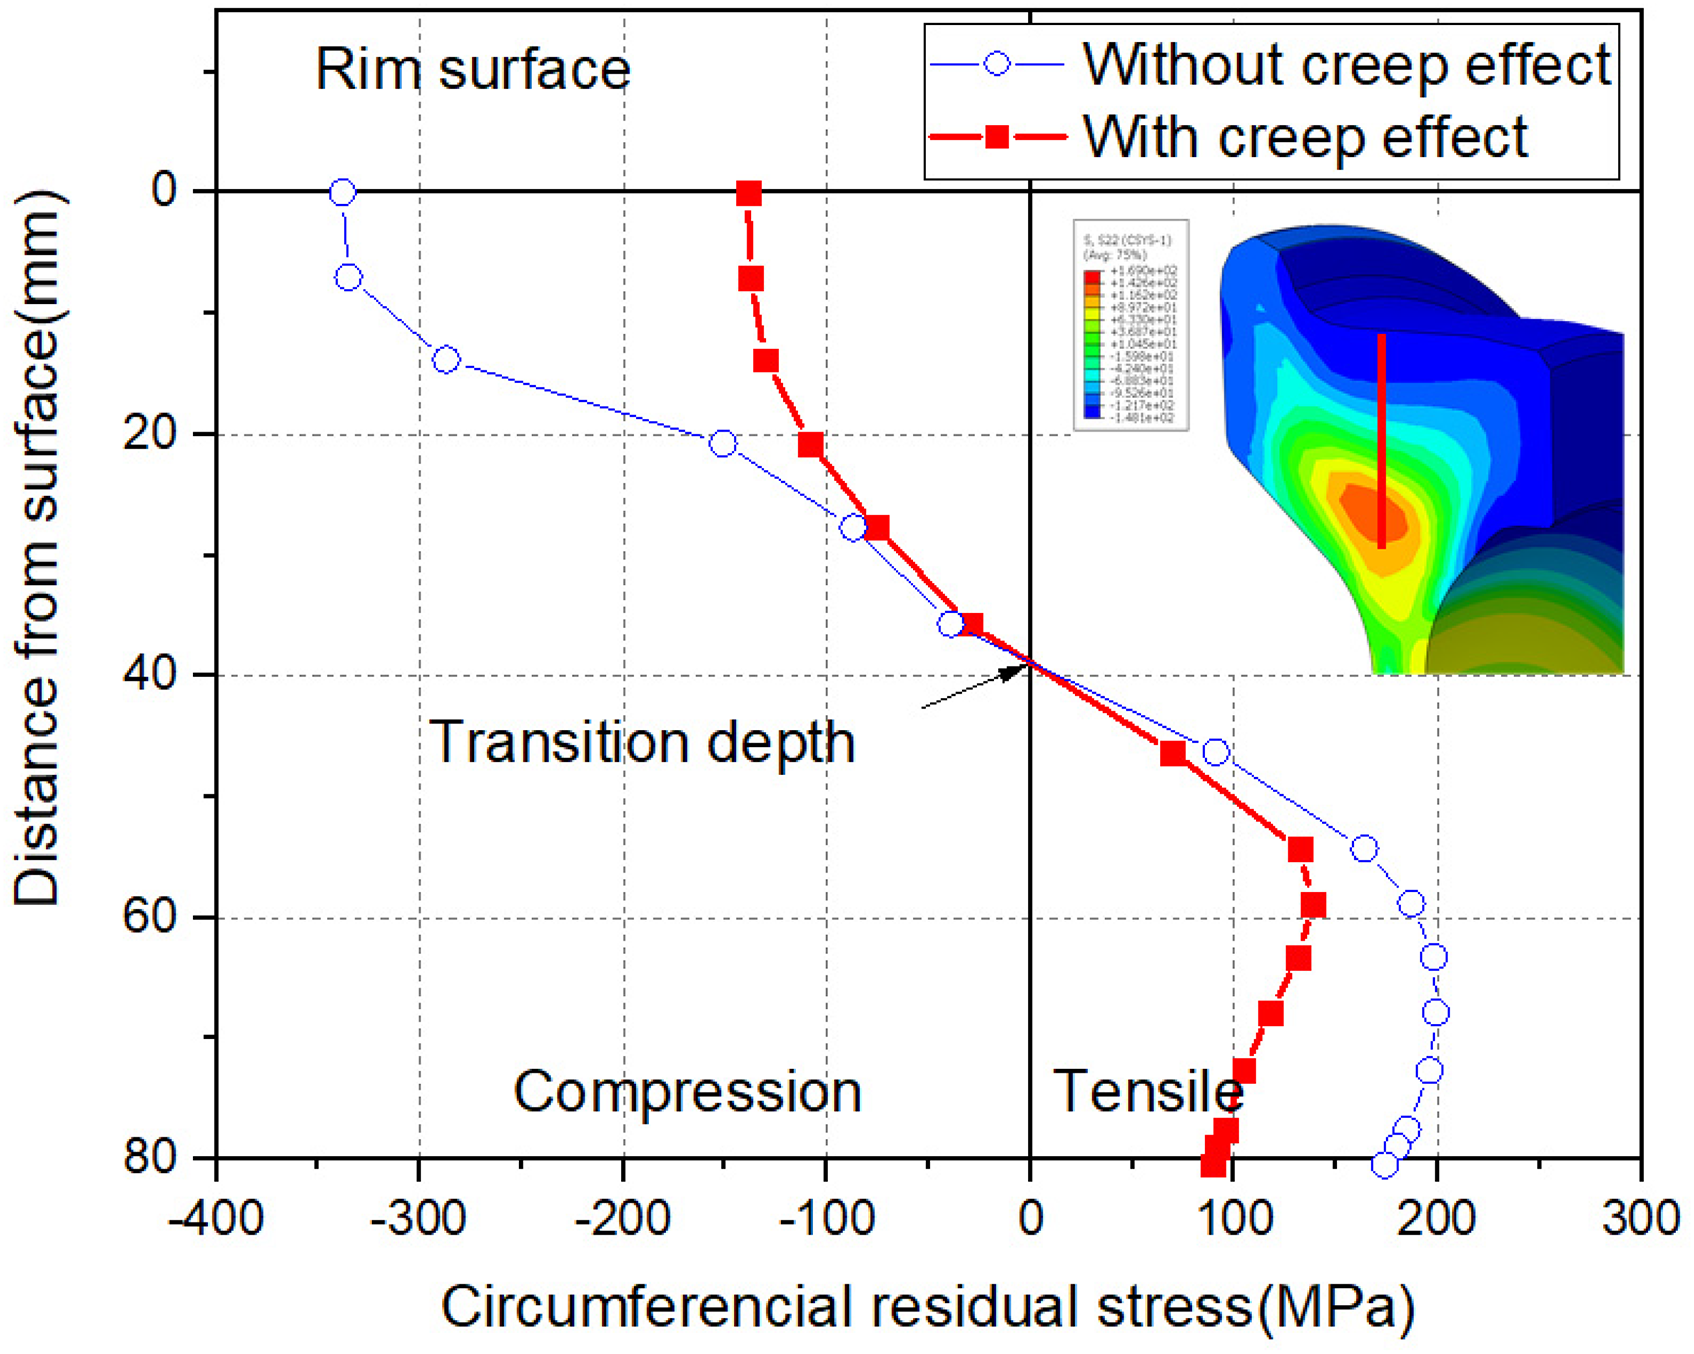
Residual stress distribution induced during manufacturing with and without consideration of creep effects.
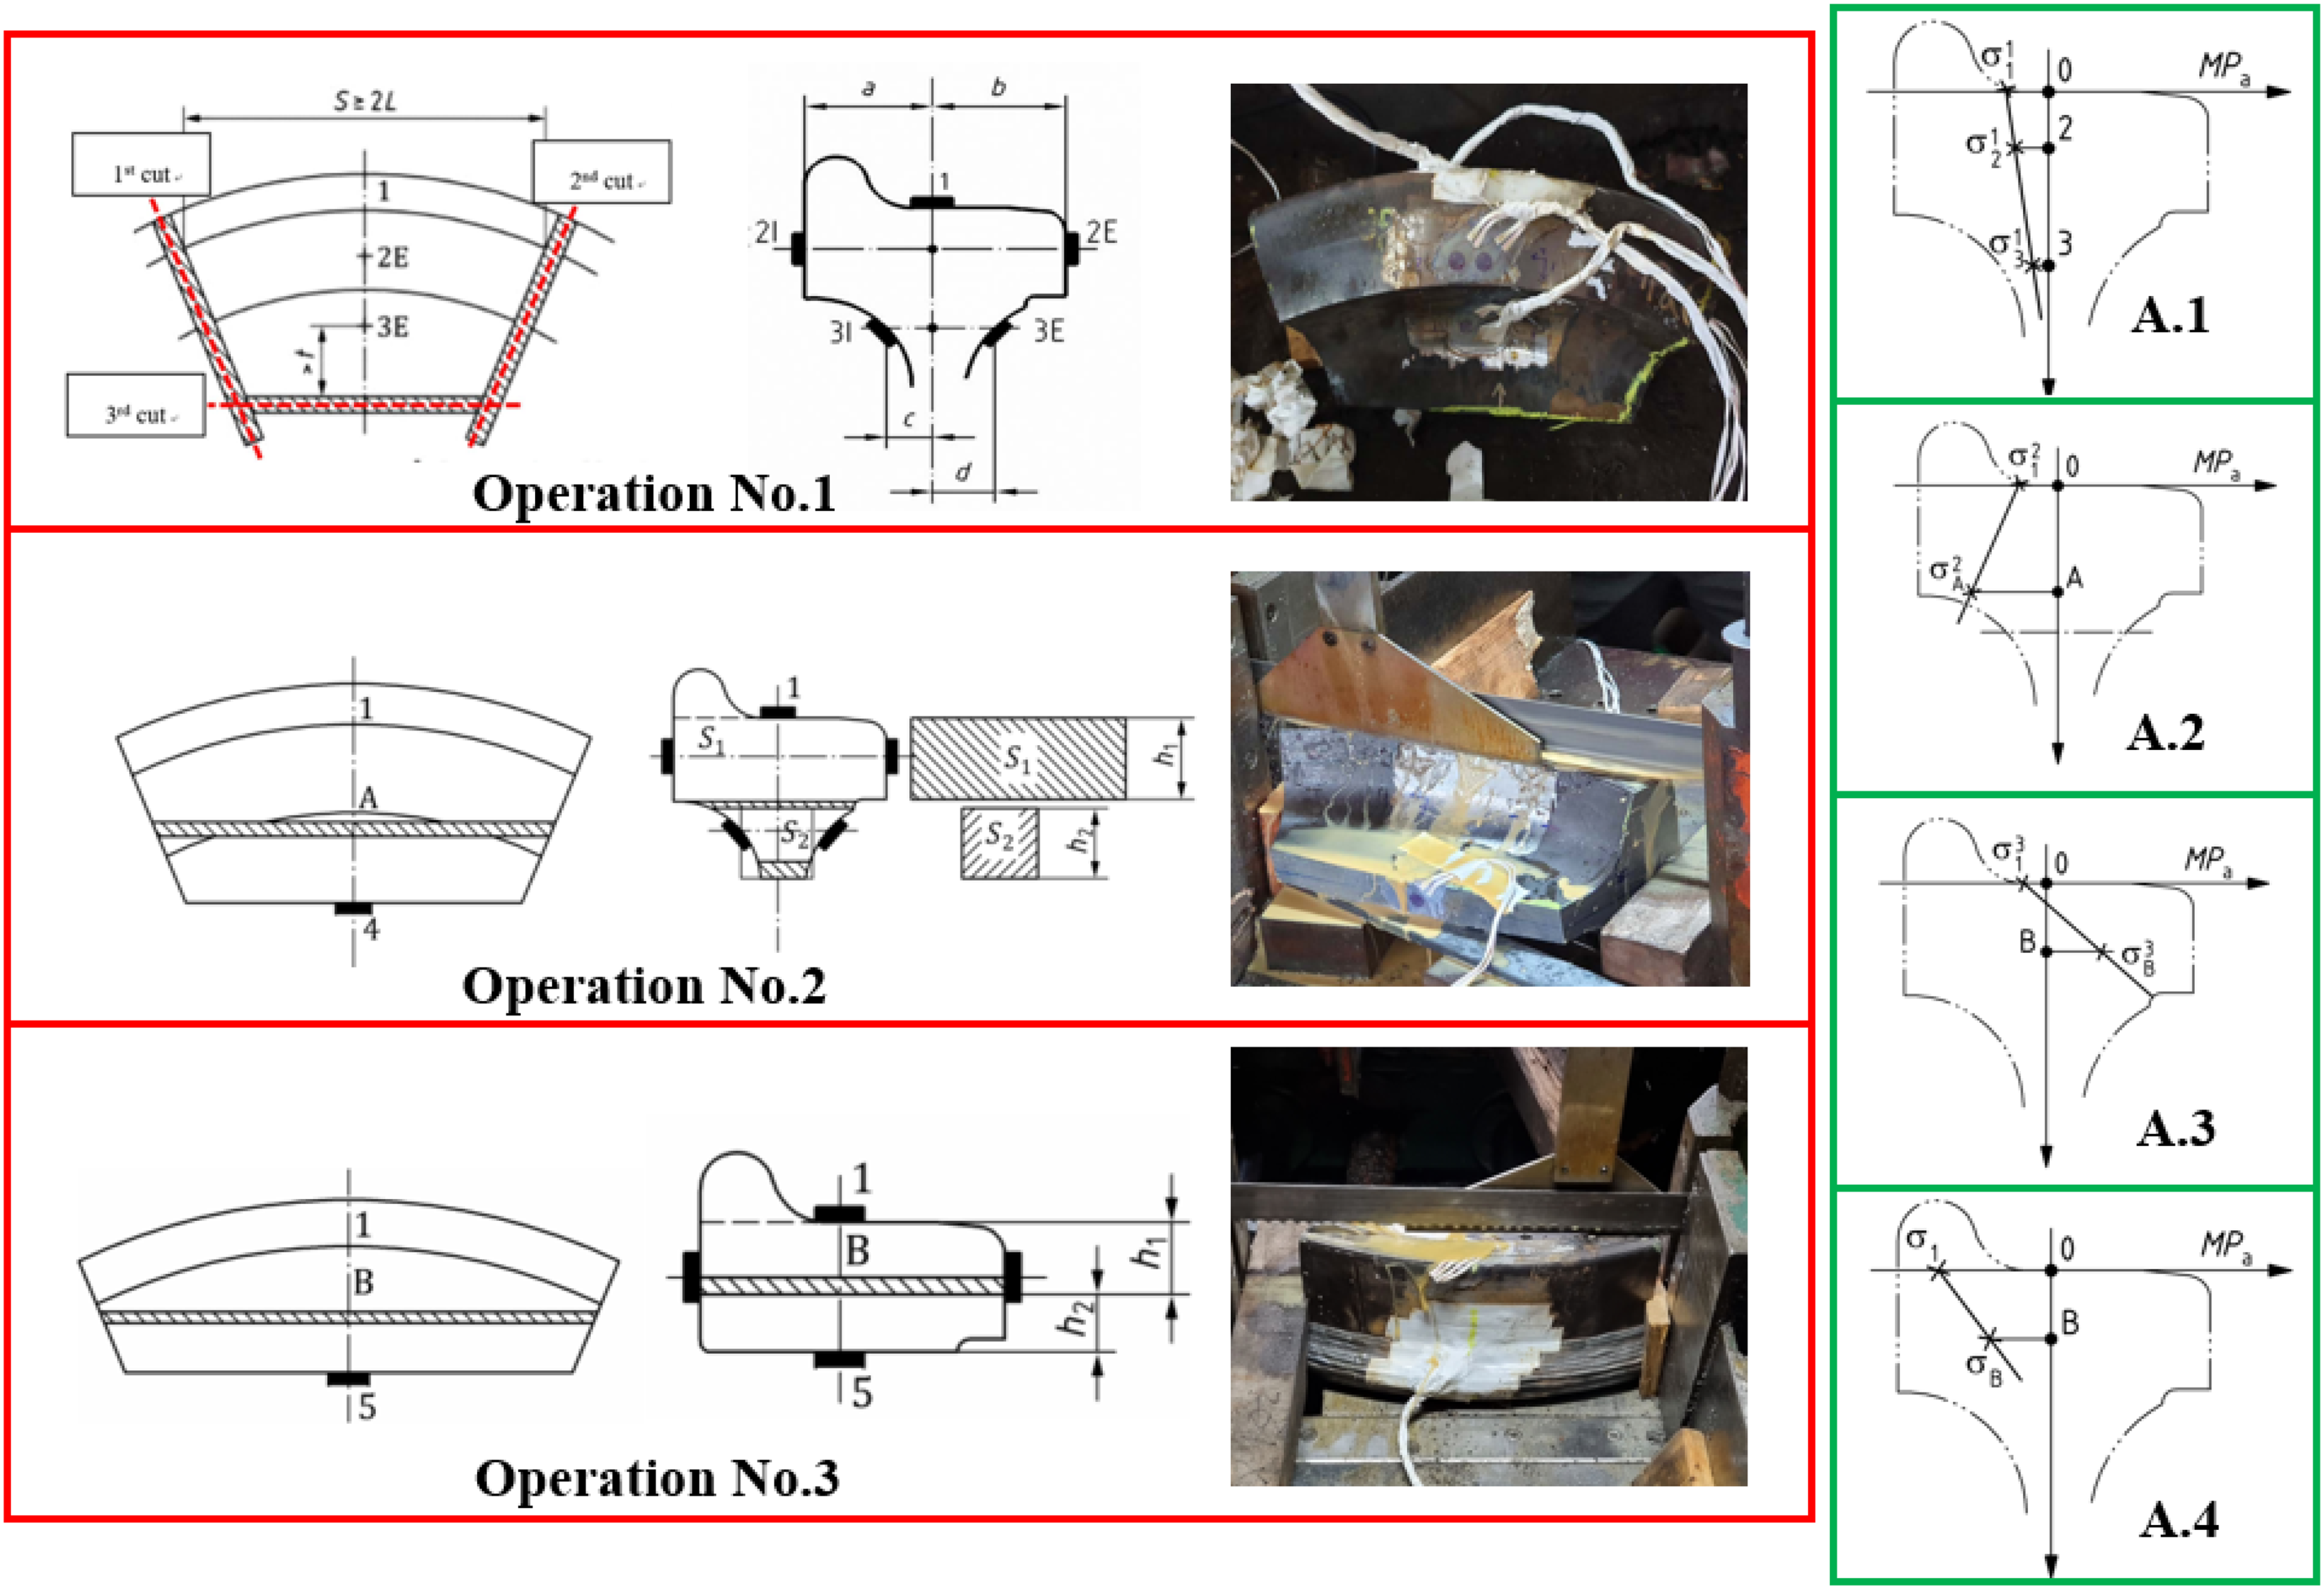
Figure 14 illustrates the residual stress measurement method in accordance with EN 13262. This method involves performing a series of cuts to progressively relieve the residual stresses present in the rim. The change in the residual stress state that occurs with each cut is measured using strain gauges. The variation in the internal stress state of the rim is then inferred by linear interpolation based on the surface measurements.
Method and procedure for measuring residual stresses in wheels according to EN 13262.
Residual stress measurement consists of three steps. At each step, the circumferential stress is determined using equation (2)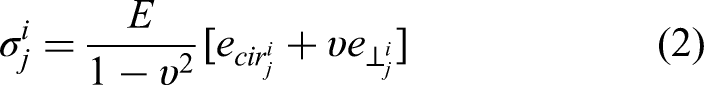
Where
First, five strain gauges are attached to the rim and cutting is performed. Using equation (2), the stresses corresponding to variables 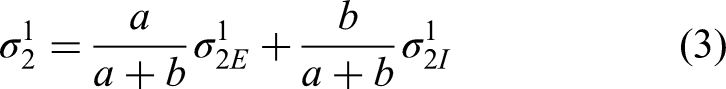
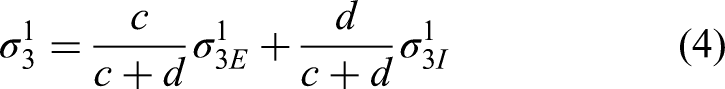
Second, two additional strain gauges are attached and cutting is performed. Using equation (2), the stresses corresponding to variables 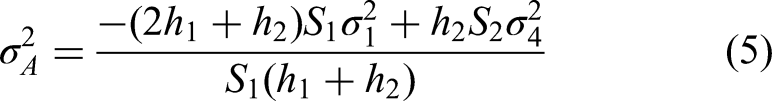
Third, one more strain gauge is attached and cutting is performed. Using equation (2), the stresses corresponding to variables 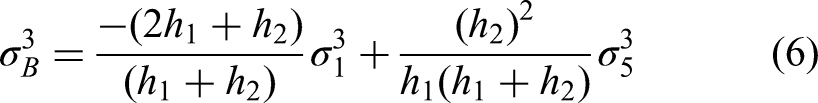
The stresses 

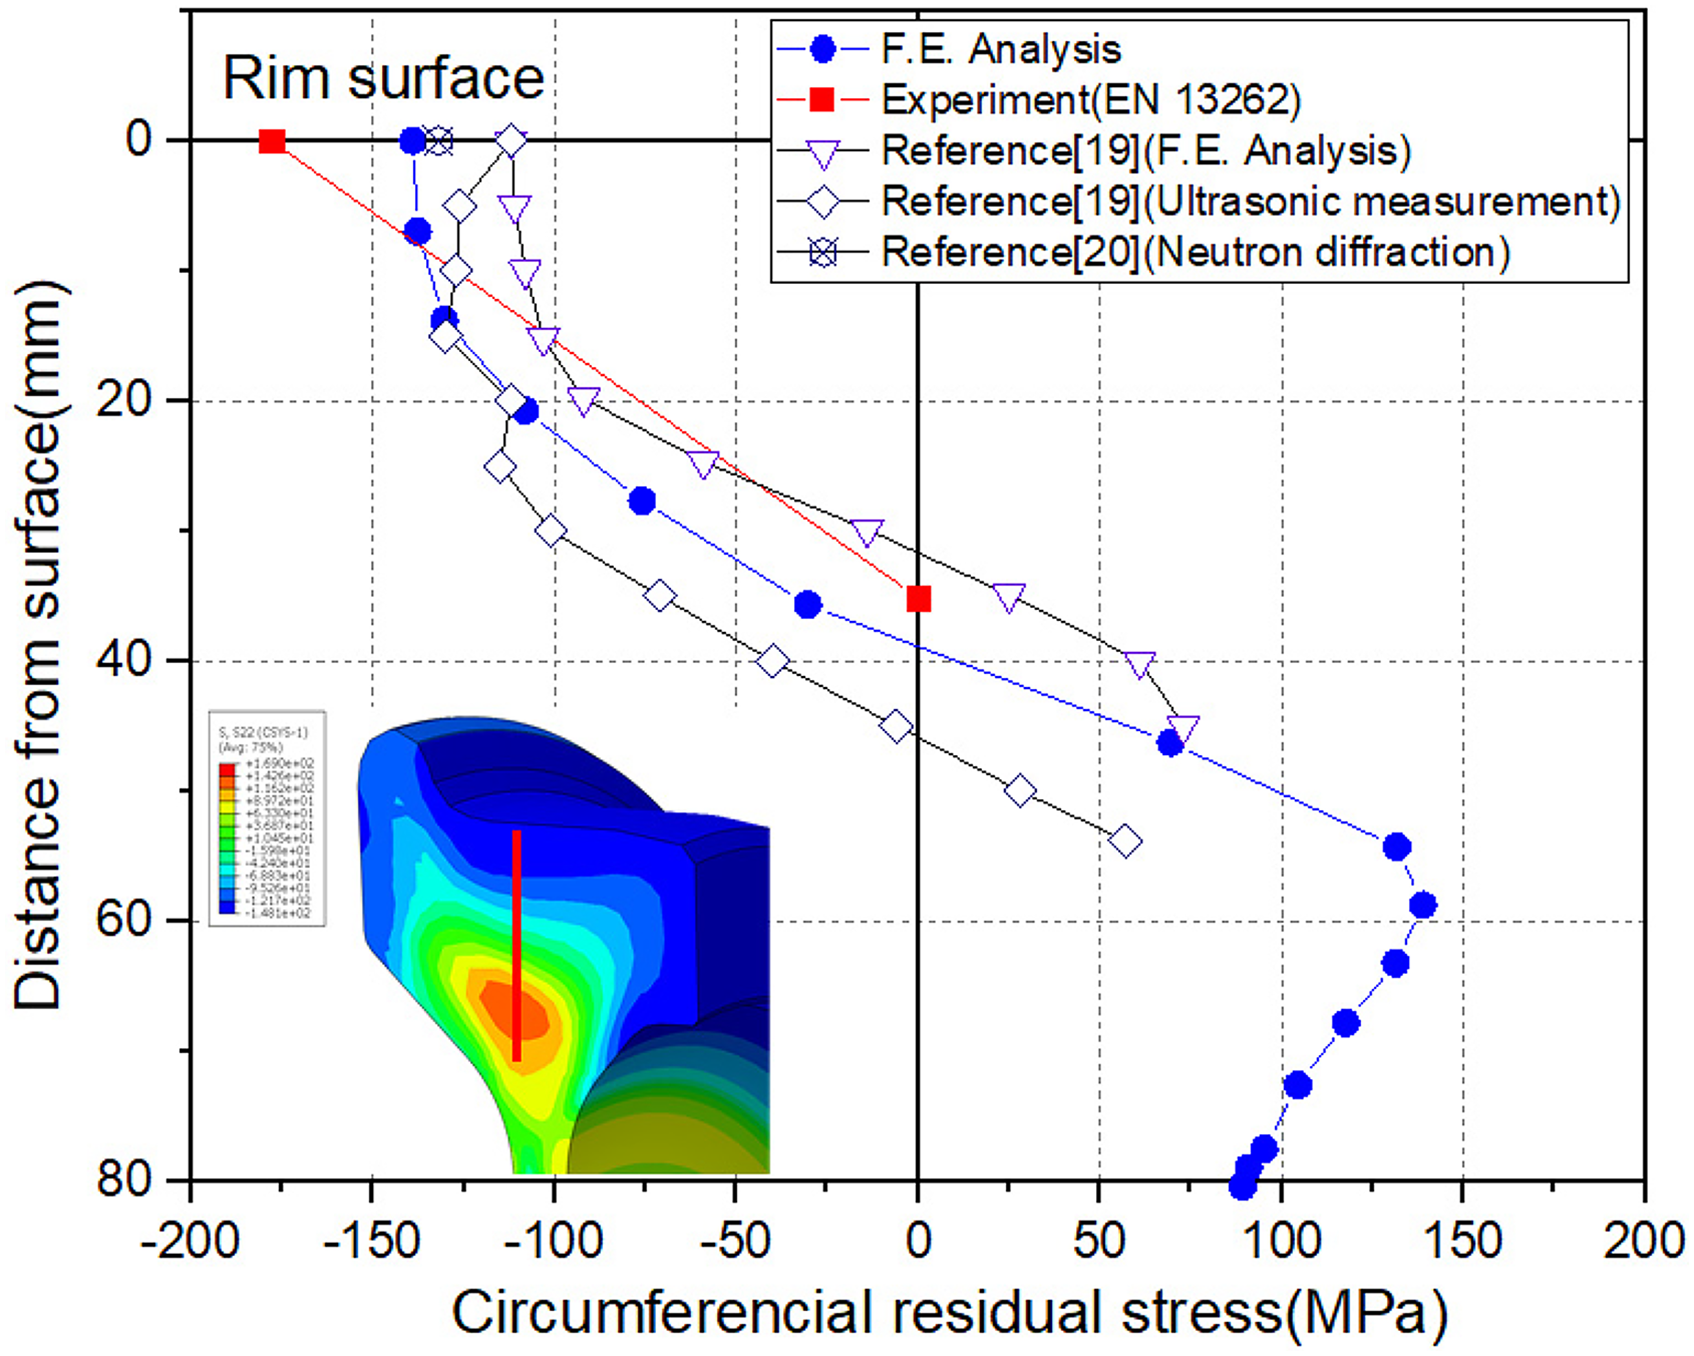
Figure 15 compares the residual stress measurement results from the EN 13262 method with the FE analysis results. In the measurement results, the maximum CRS was −178 MPa and the depth of transition to tensile stress was 35 mm, similar to the FE analysis results. Two types of residual stress were generated to evaluate the effect of residual stress on fatigue crack growth. Figure 16 shows the distribution of the two types of residual stress generated by changing the analysis conditions. A circumferential residual stress of approximately −150 MPa was generated on the contact surface in the first case while approximately −200 MPa was generated in the second case. Note that the magnitude of the maximum residual stress changed but the depth of transition to TRS remained the same.
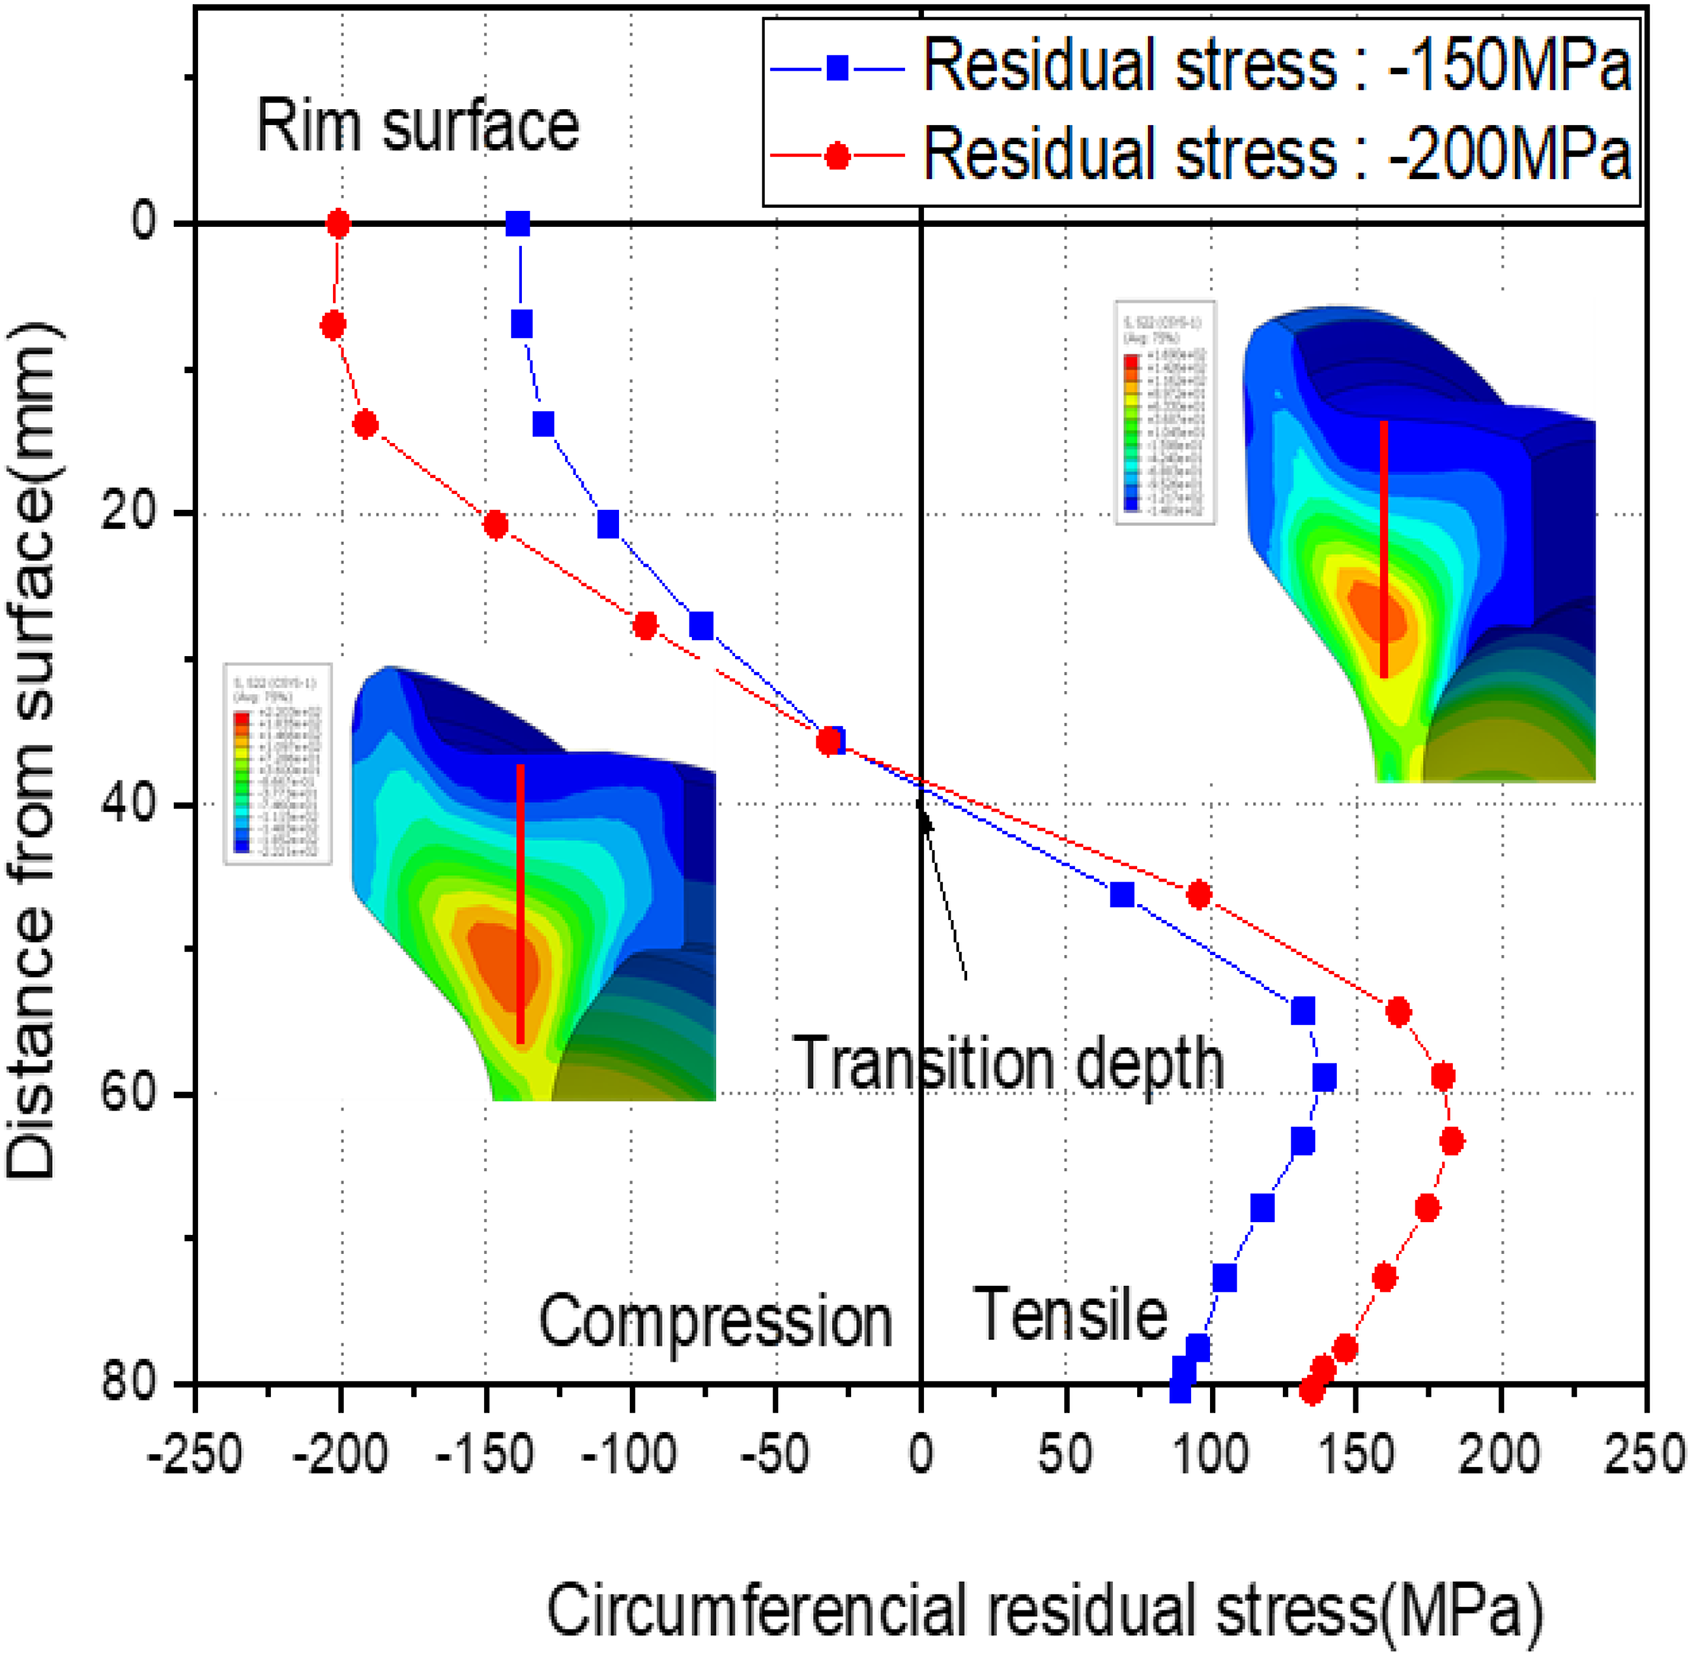
Residual stress distribution according to the heat treatment analysis conditions.
Crack growth analysis
XFEM-based analysis
Crack growth analysis of a wheel is based on the crack growth properties of the material. The fatigue crack growth test through load control was conducted in accordance with ASTM E647. Figure 17(a) shows the specimen geometry. The Paris constant C and exponent m were obtained using the crack growth test data and the following expression: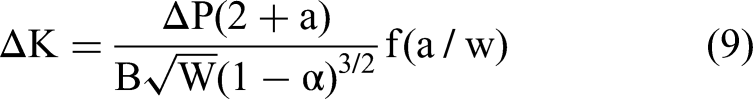
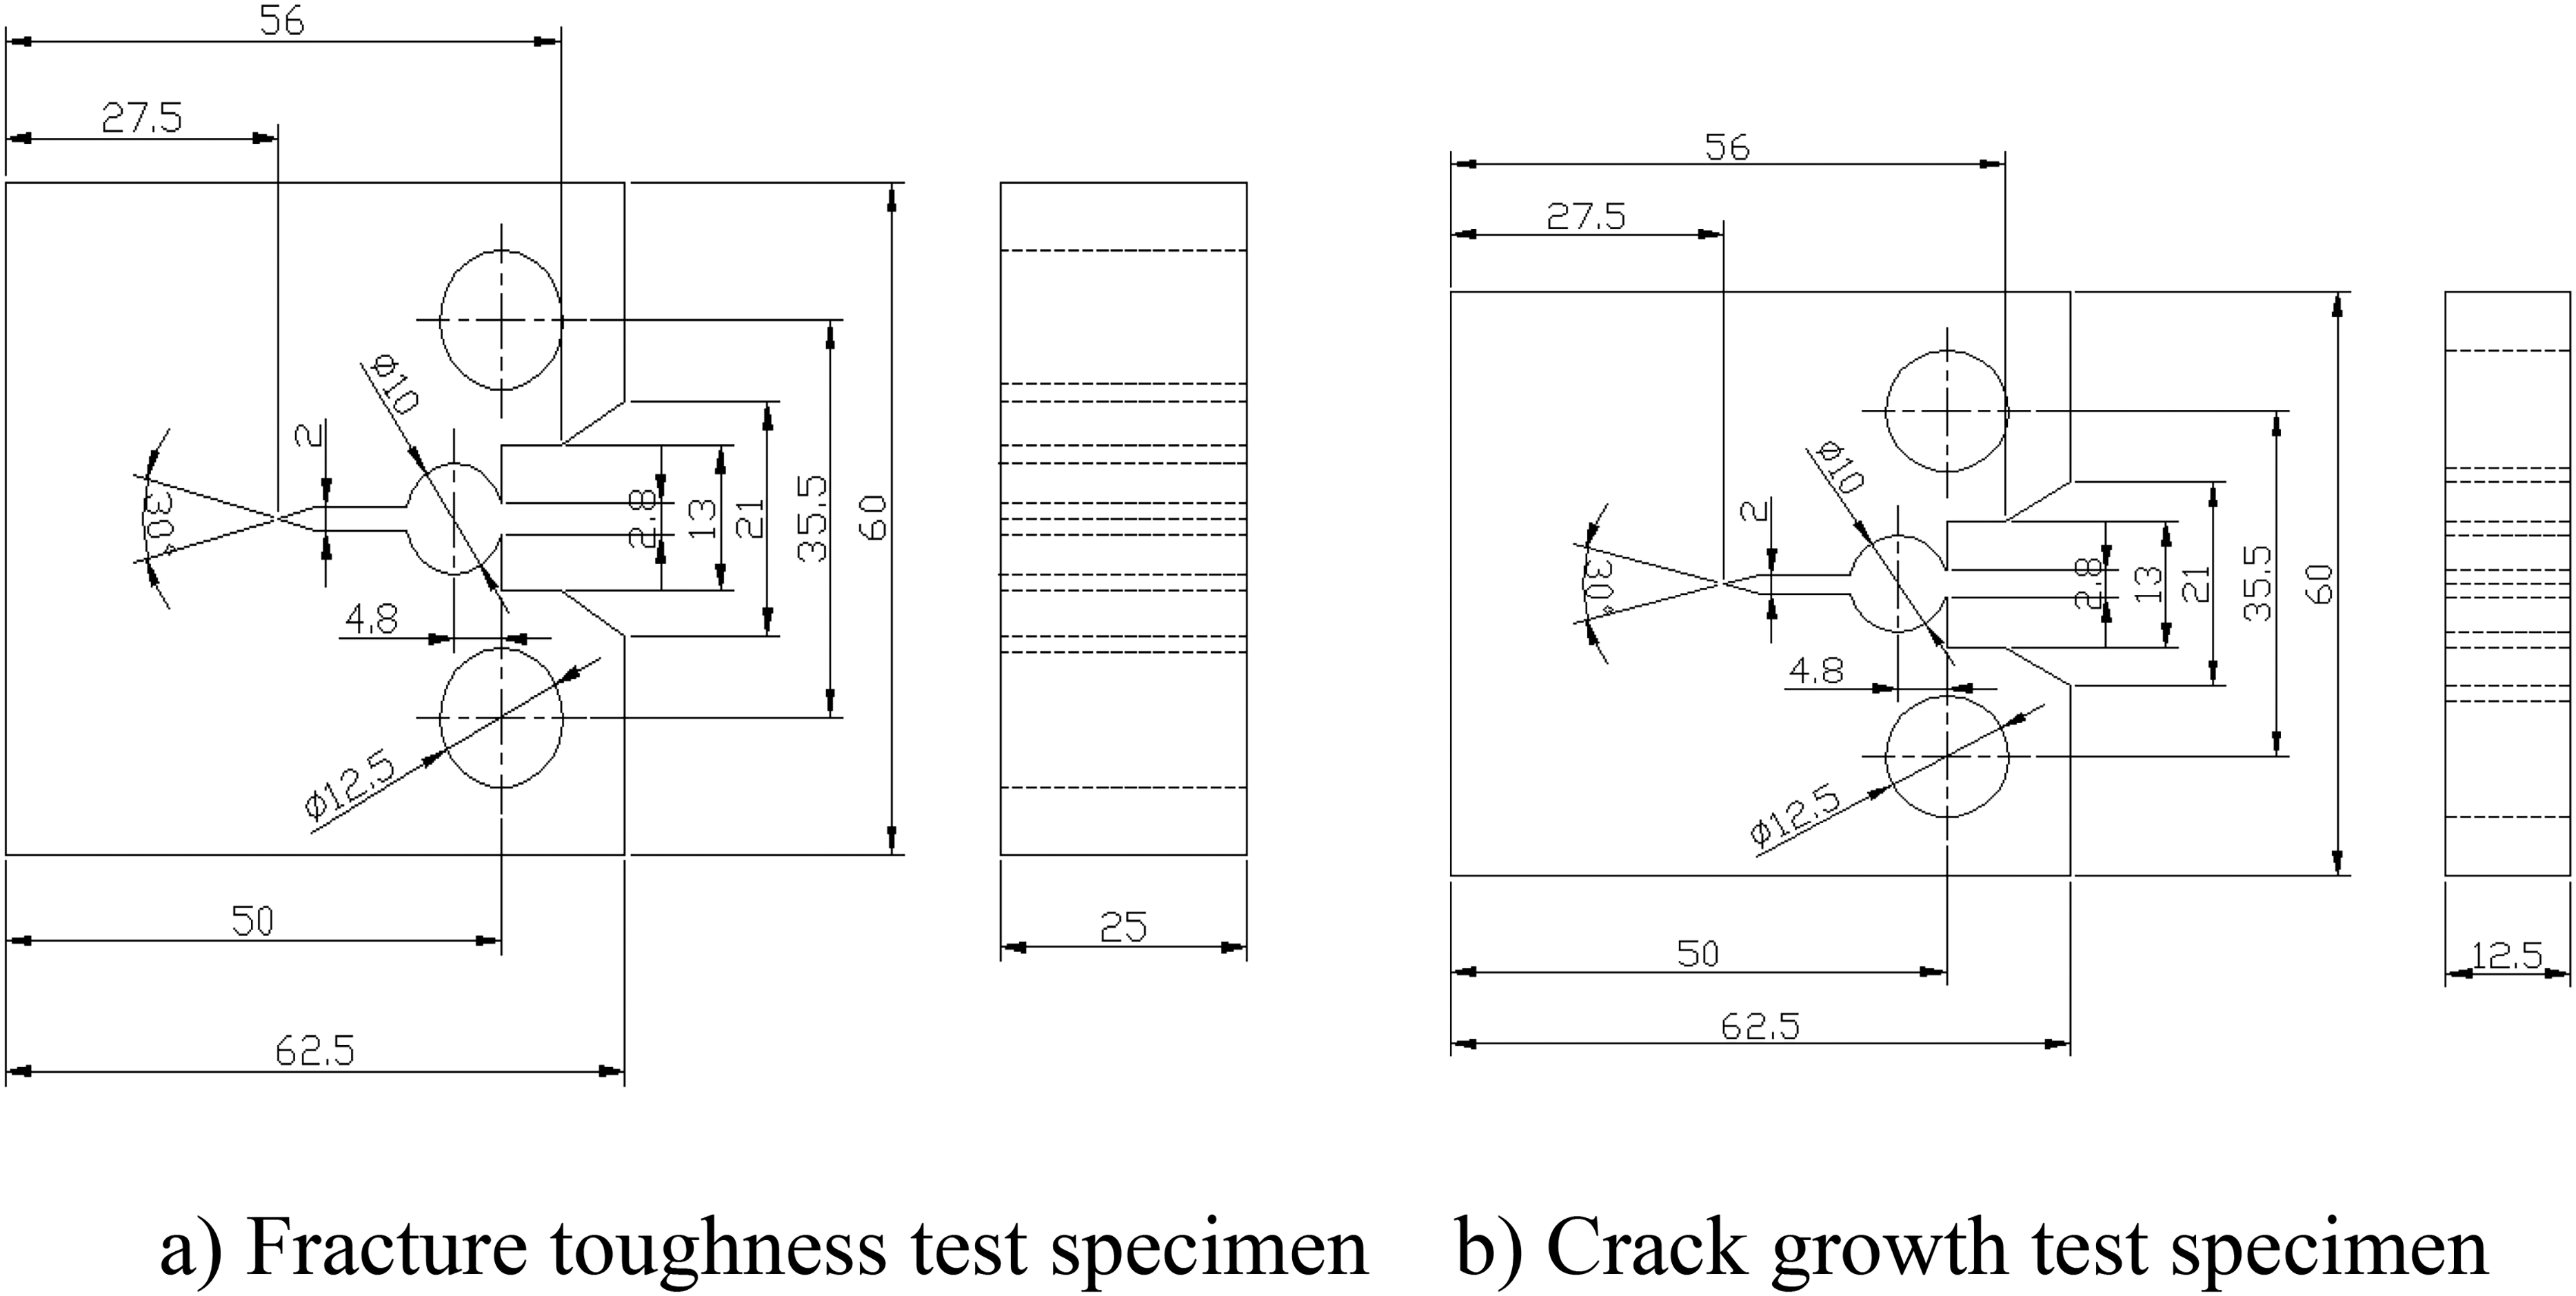
Test specimen for fracture toughness and crack growth tests of wheels.
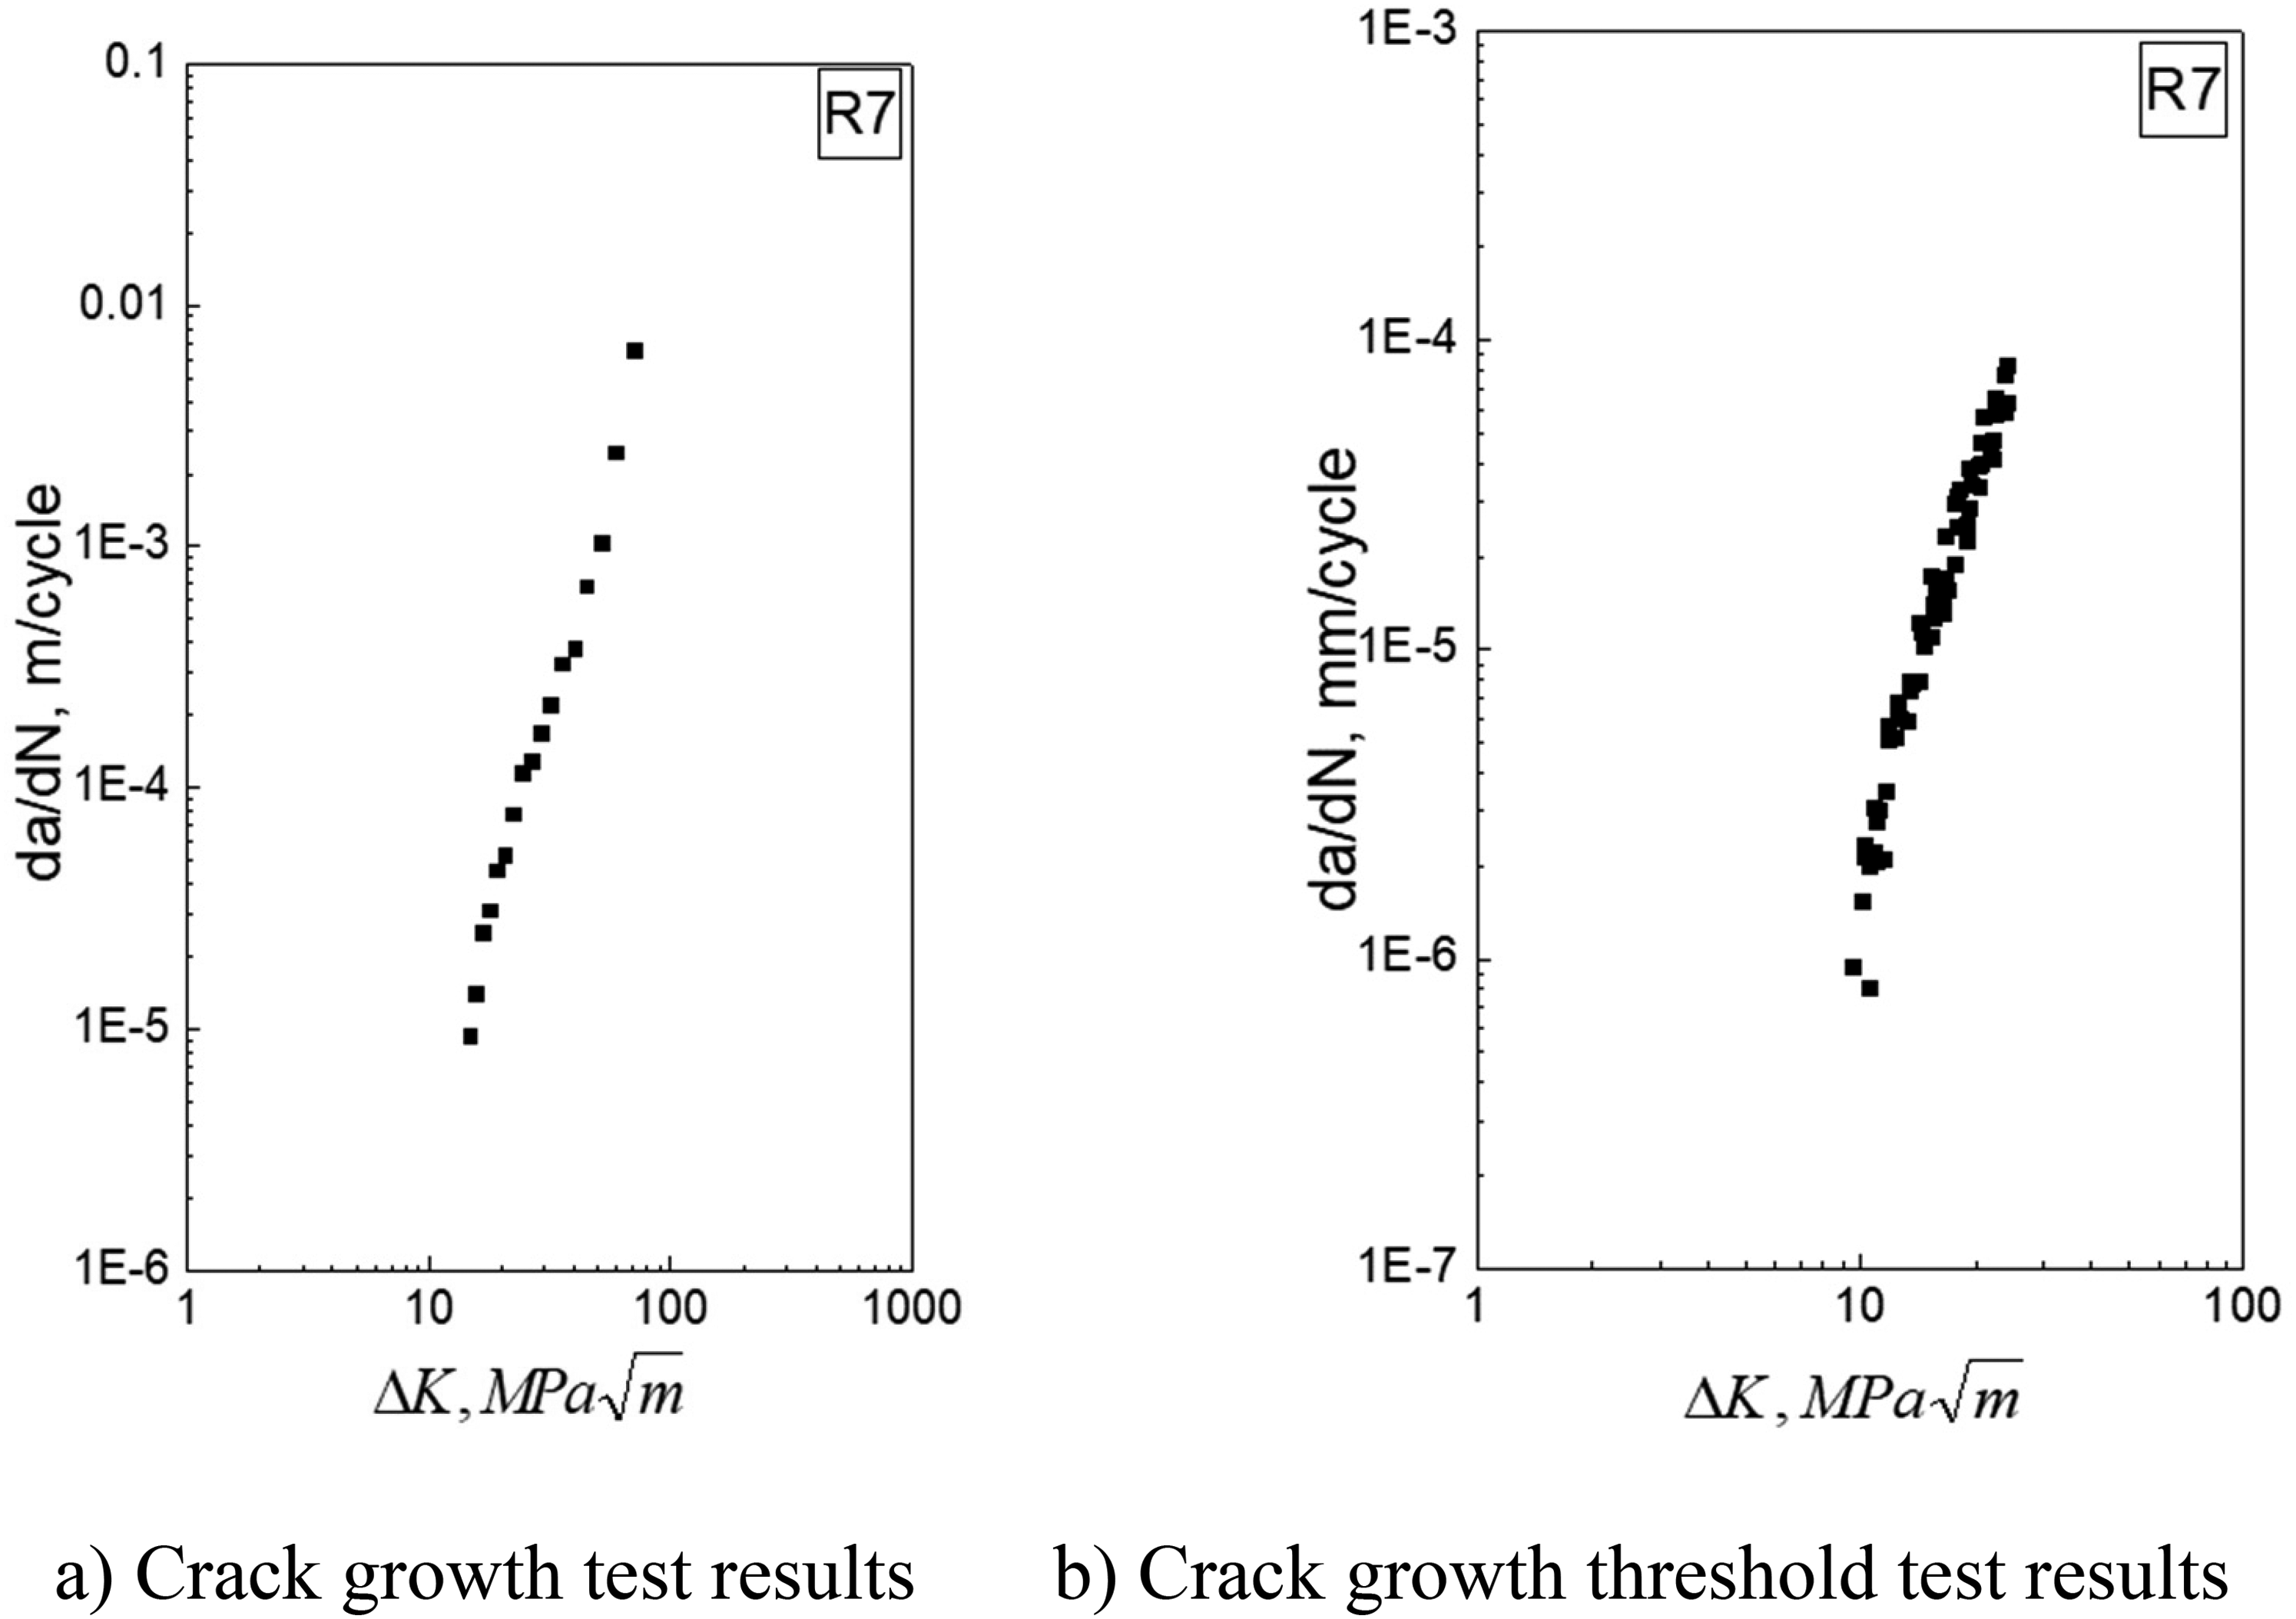
Test results from crack growth and crack growth threshold.
Crack growth analysis of a wheel was conducted using the extended FE method (XFEM), a method within the framework of FE analysis. The stress intensity factor calculation and fatigue crack growth analysis using the XFEM-based linear elastic fracture mechanics (LEFM) approach in ABAQUS have been verified.22,23
In this study, the stress intensity factor and crack growth results were also verified using XFEM. A finite element analysis model was developed using a CT (compact tension) specimen for which the theoretical solution is available. Since XFEM utilizes enriched displacement functions, re-meshing around the crack tip is not required. XFEM is composed of a combination of the continuous displacement functions used in conventional FEM and additional discontinuous enrichment functions. The stress intensity factor is usually calculated using the J-integral method, which requires a special mesh configuration, as shown in Figure 19(b). However, the XFEM model has a simple square configuration, as shown in Figure 19(a). In the XFEM-based crack model, first-order three-dimensional continuum hexahedral elements (C3D8) were employed. The initial crack in the compact tension (CT) specimen was introduced using rectangular finite elements. The crack propagation was simulated using the Paris law, expressing the crack growth rate (da) as a function of the number of loading cycles (dN). A constant-amplitude cyclic fatigue load was applied throughout the analysis.
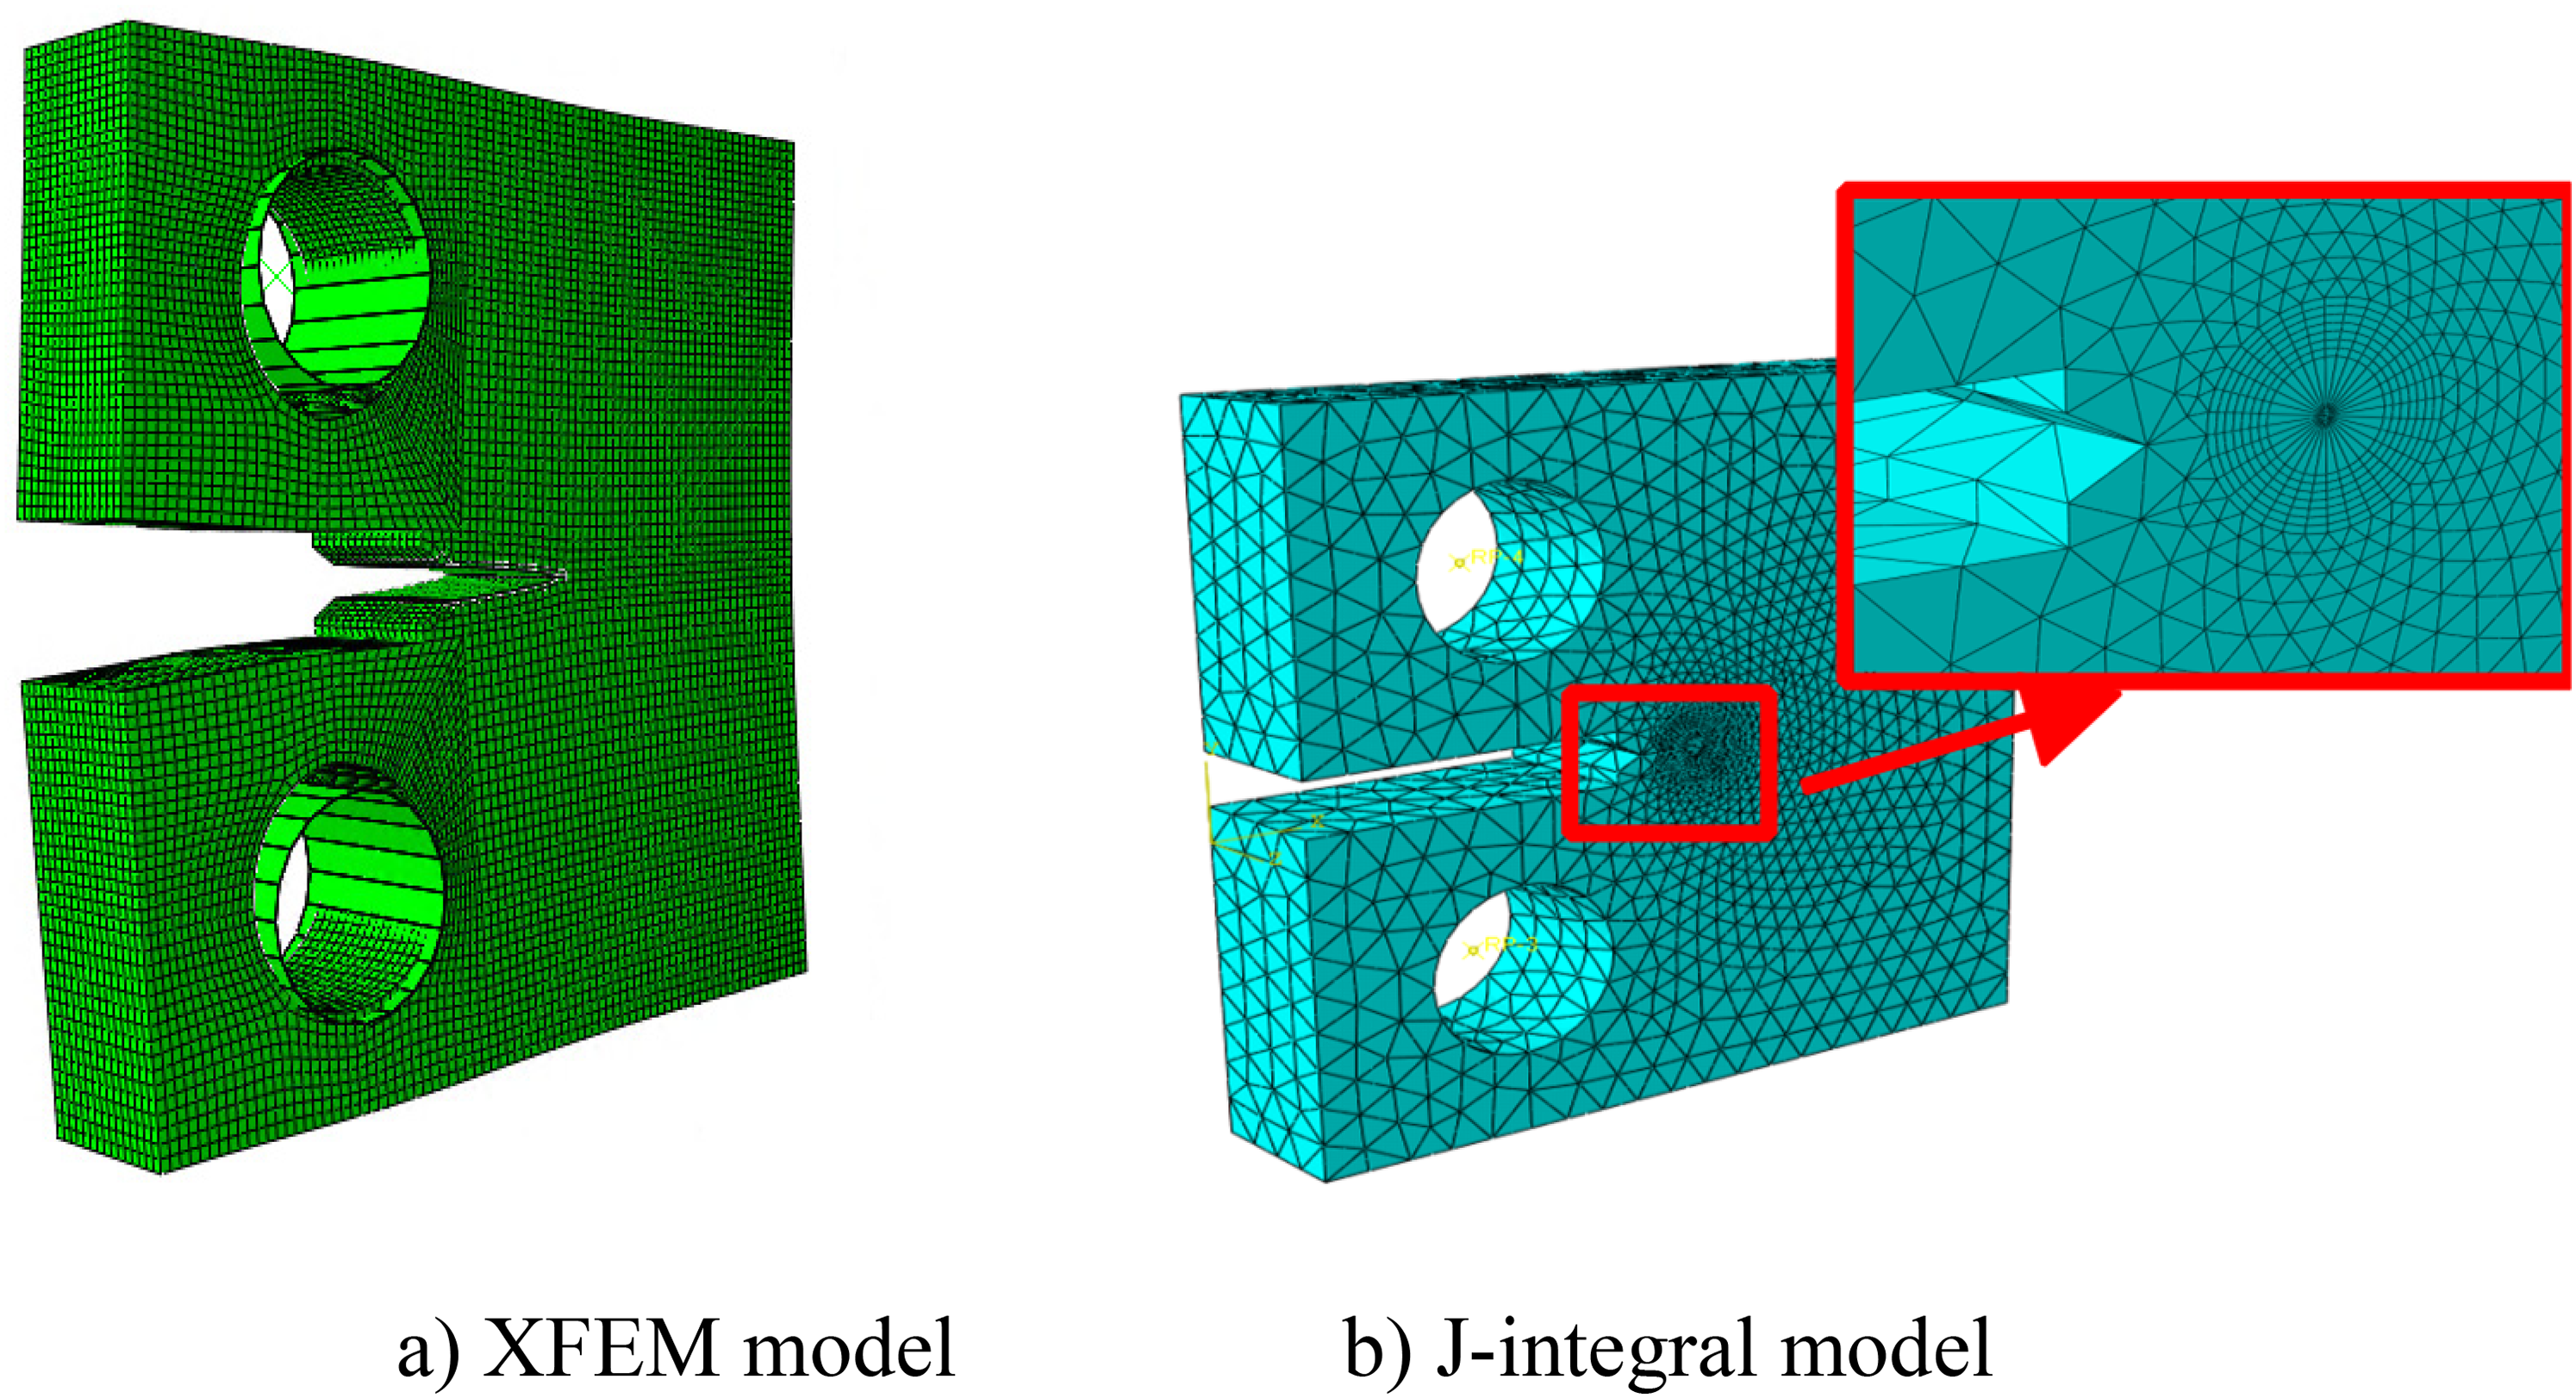
Comparison between the XFEM and J-integral models.
Figure 20(a) compares XFEM, J-integral, and theoretical solutions. The results show a good agreement given that the differences with respect to theoretical solutions are less than approximately 5%. Figure 20(b) compares the stress intensity factor as a function of the crack length with theoretical solutions. The results show a good agreement given that the differences are less than approximately 5%. Theoretical solutions exist for standard tests, such as CT specimens, allowing crack length determination as a function of the load conditions. To this end, AFGROW 24 was used as a commercial software program for predicting fatigue crack growth. Figure 21 compares the results from crack growth analysis using XFEM and AFGROW. When the crack length is represented as a function of the number of cycles, the results are in good agreement, as shown in Figurre 21.
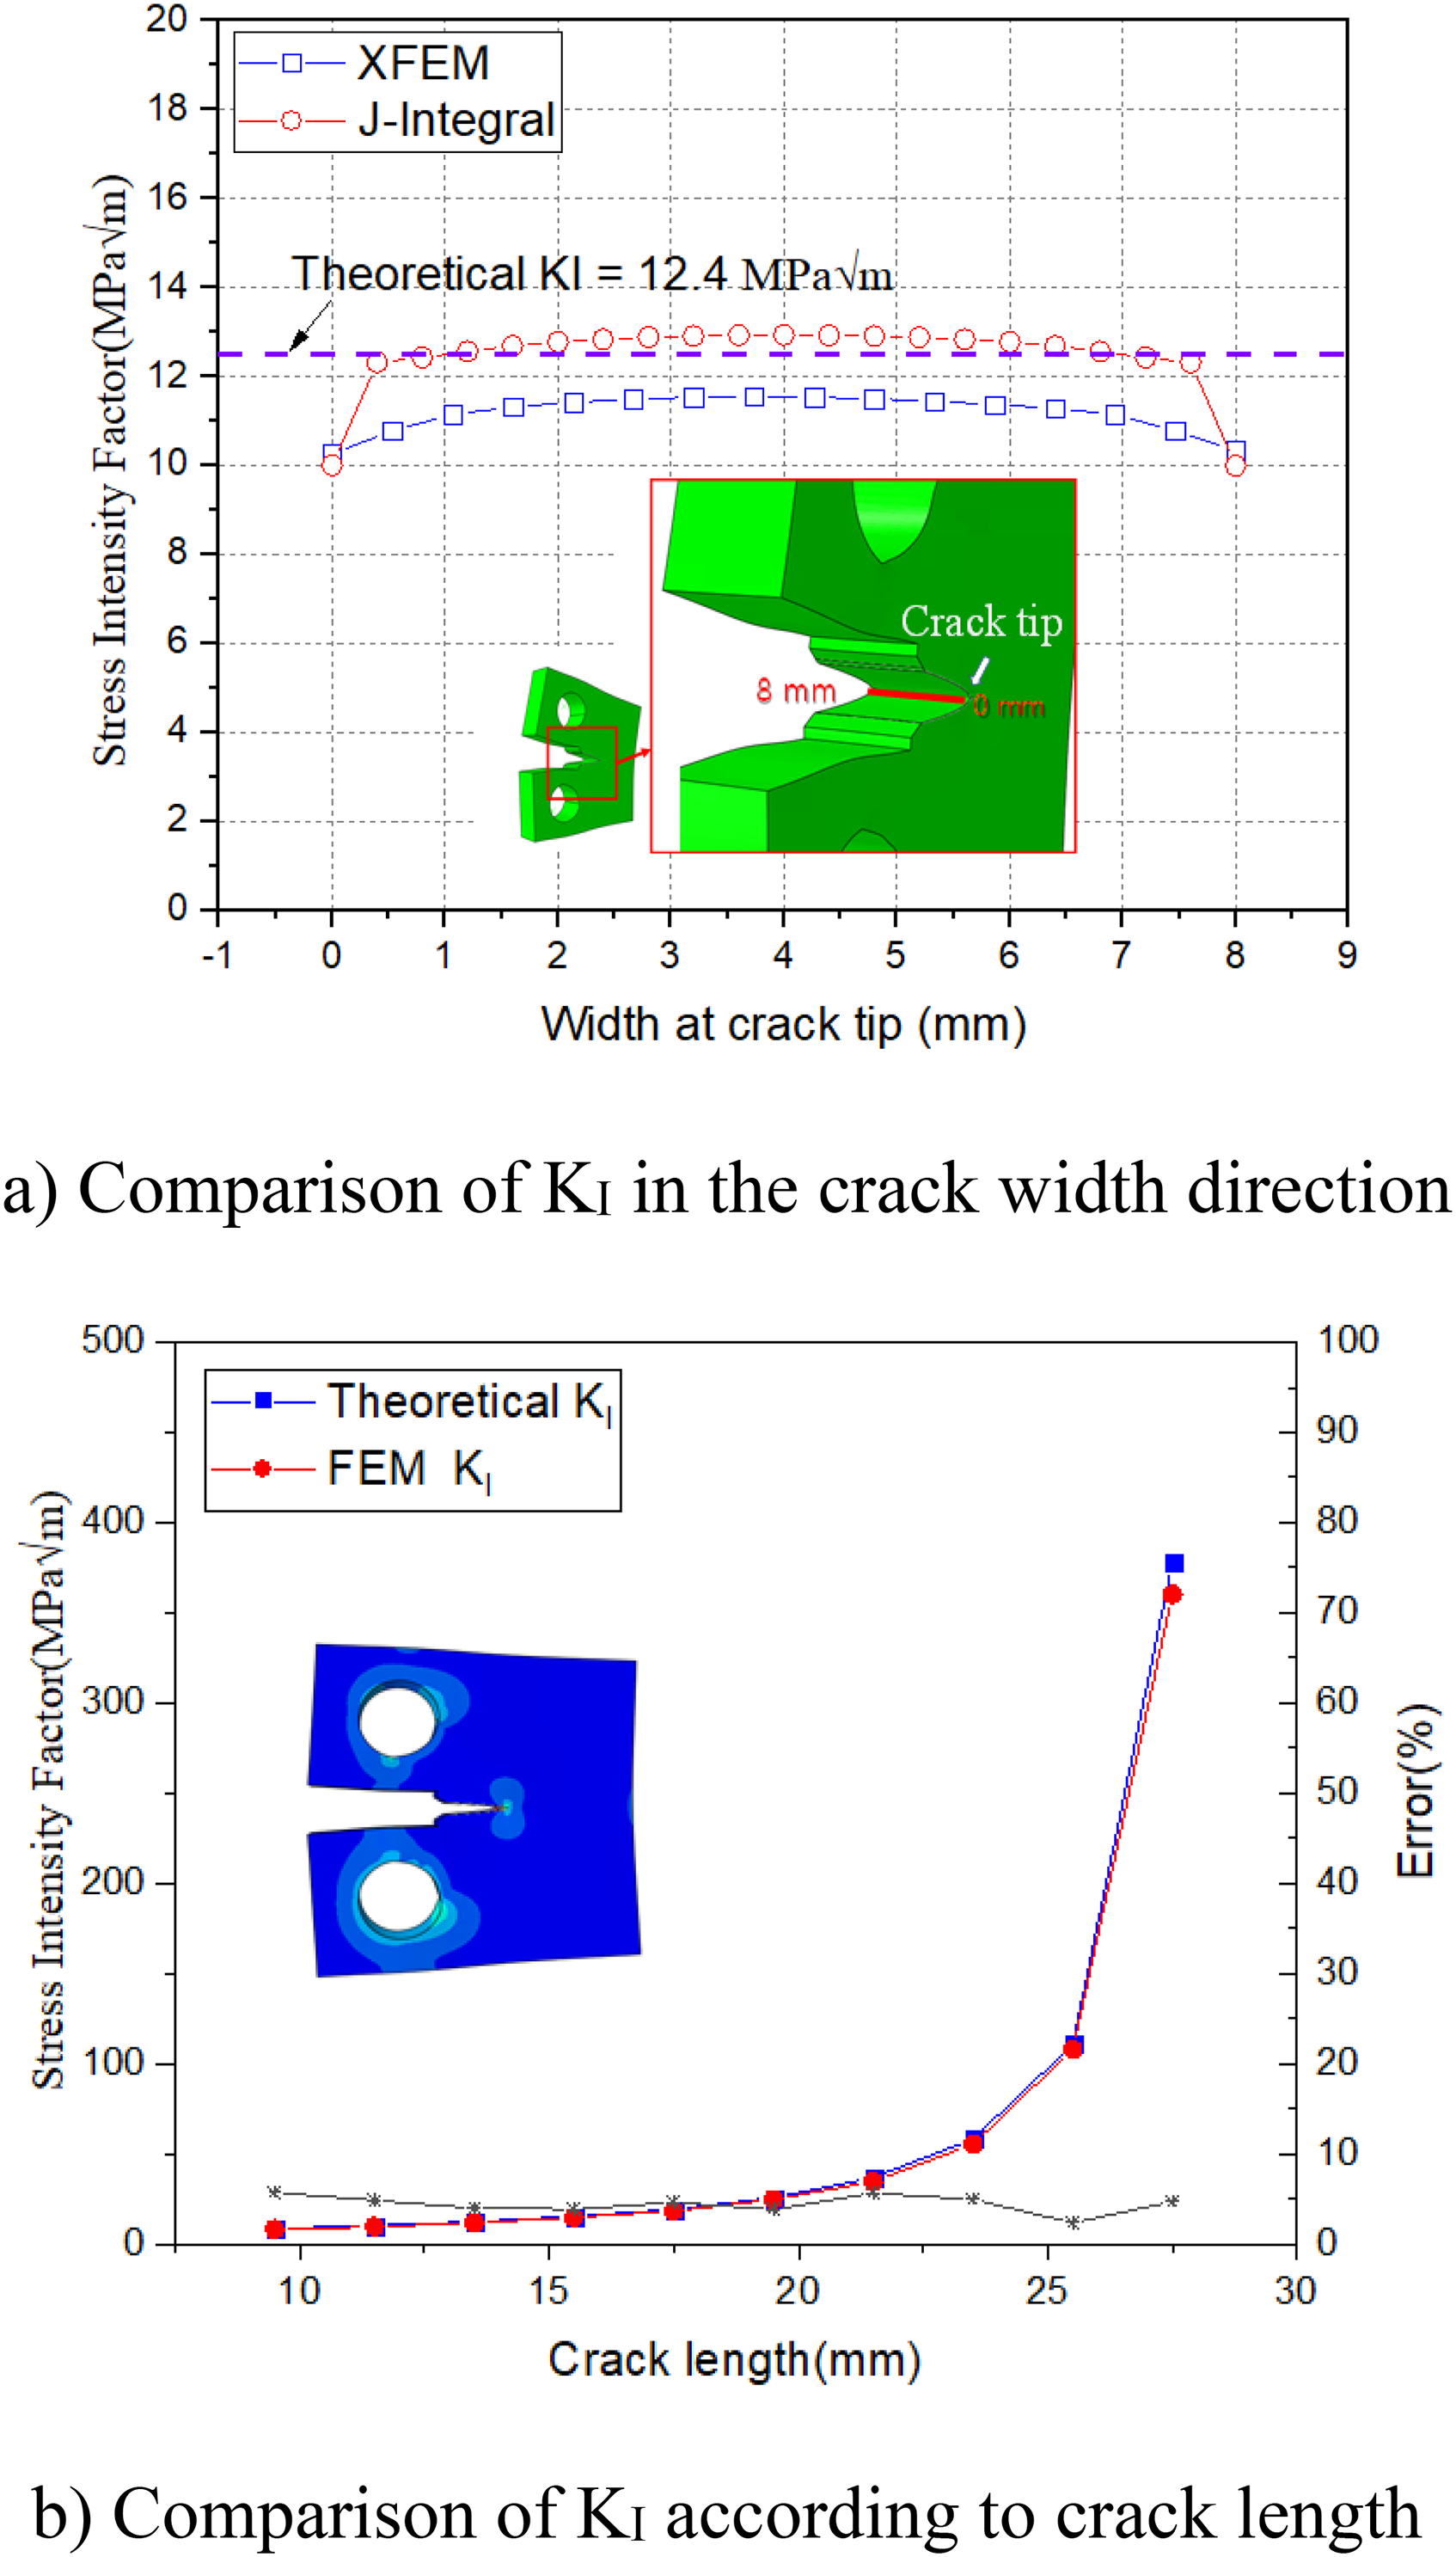
Comparison of stress intensity factor(KI) results between XFEM and theoretical solutions.
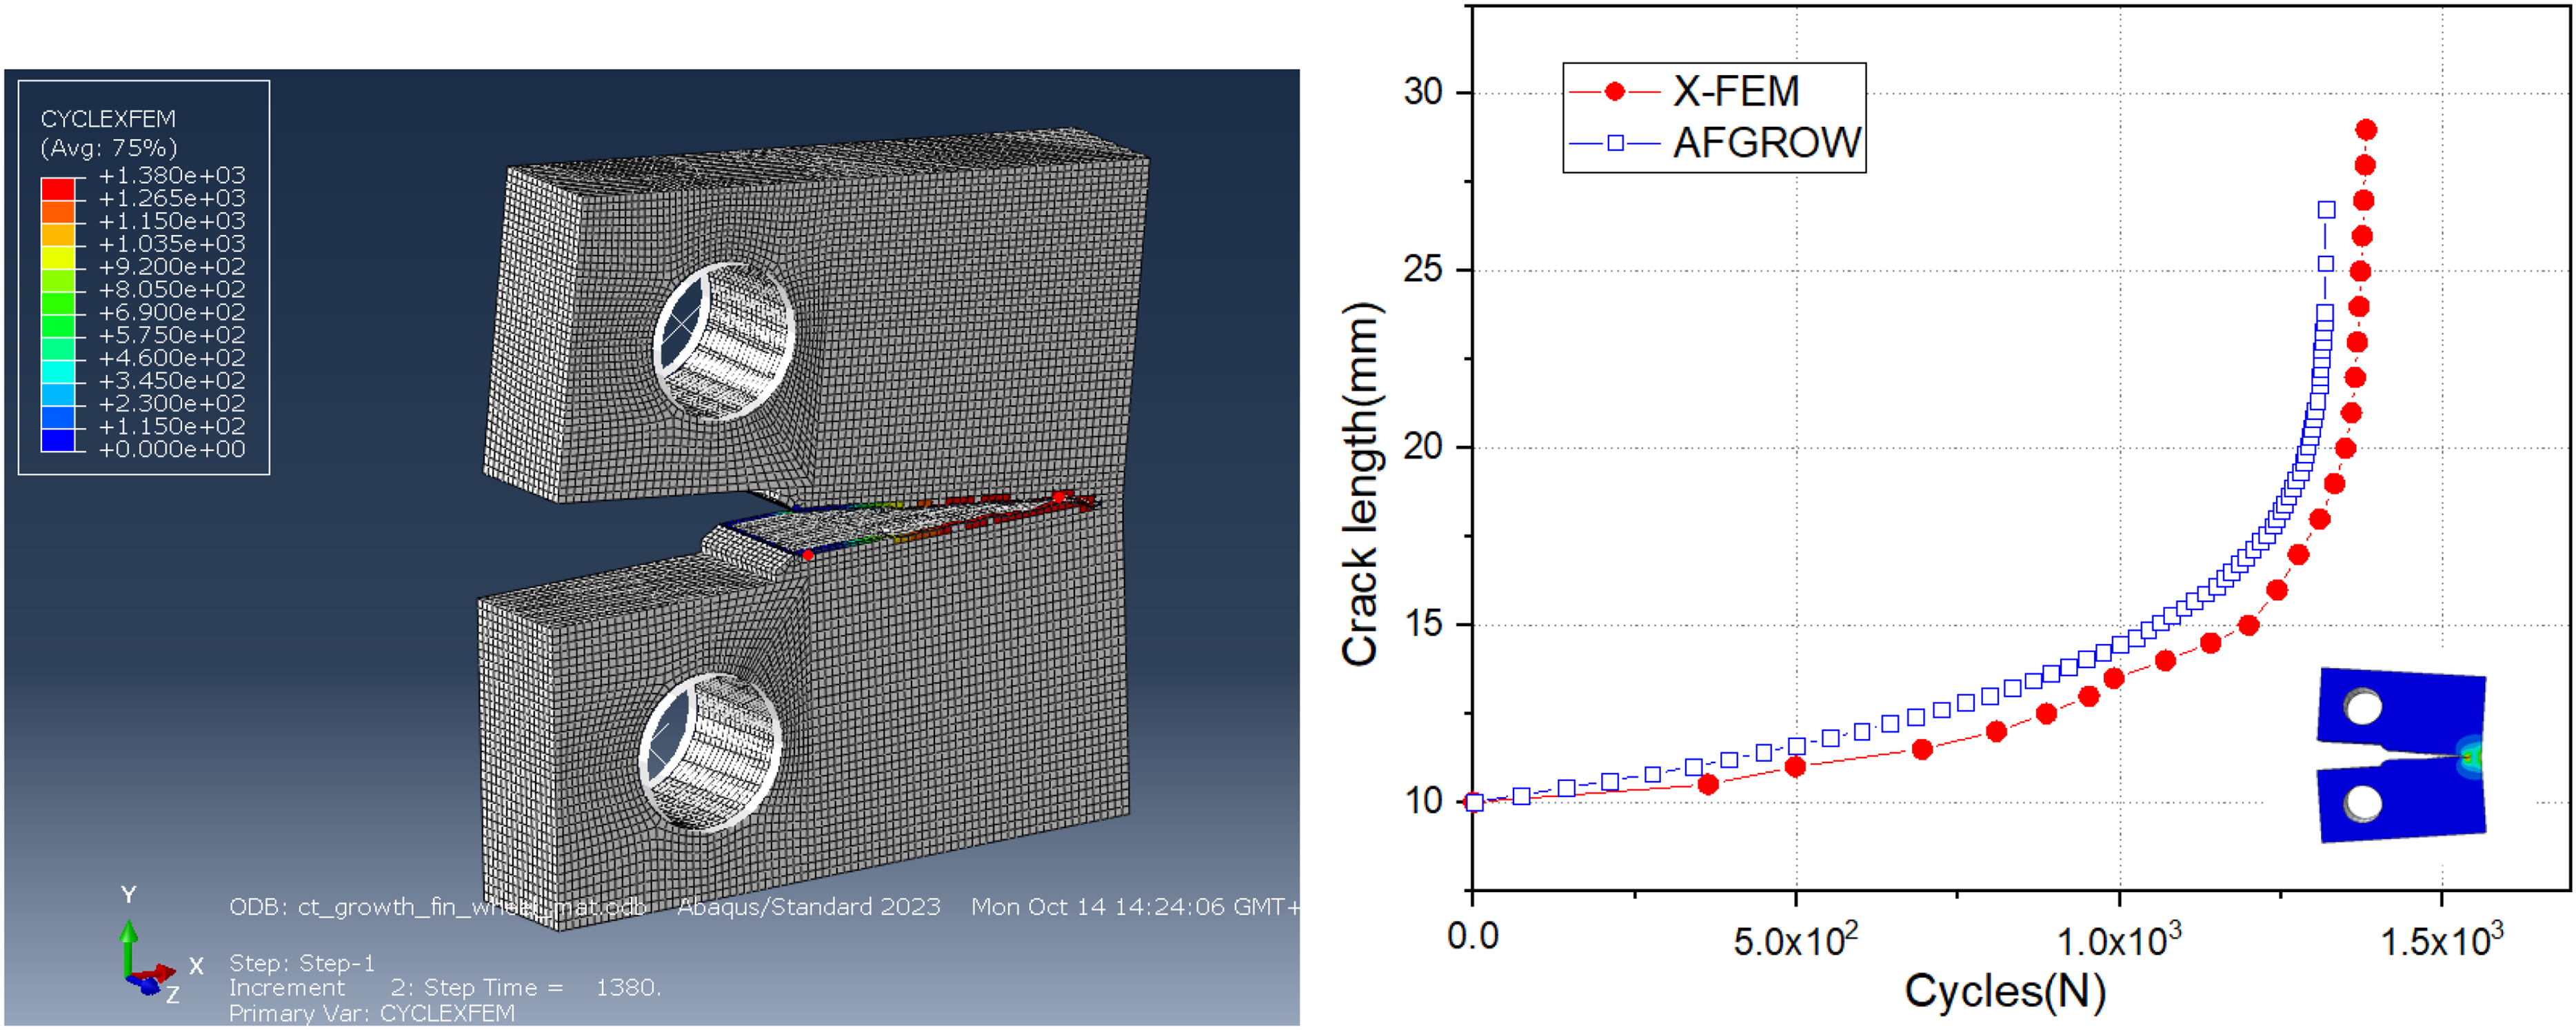
Comparison of crack growth analysis results between XFEM and AFGROW.
Model for crack growth analysis of a wheel
XFEM was used to analyze crack growth in the web plate. Figure 22 shows the FE model and boundary conditions for crack growth analysis. The fatigue test method for wheels presented in EN 13262 (Figure 3(a)) was used. A quarter of the wheel was modeled using the symmetry of the loads and geometry. The part with the axle pressed was fixed, and loads were applied to the rim of a wheel. Modeling was performed so that the crack direction could be the same as the part under the loads. Figure 23 shows the results from crack growth analysis for the web plate of the wheel. The initial crack was located on the inside of the web plate of the wheel, as shown in Figure 23(a). Figure 23(b) shows the initial crack growth. It can be seen that the crack propagated only on one side. The crack propagated to the outside after penetrating the thickness, as shown in Figure 23(c). Figurre 24 shows the crack length as a function of the number of cycles. The crack propagated only on one side initially. Then, it propagated from the inside to the outside at approximately 2 × 10⁶ cycles. Subsequently, the crack growth rate decreased inside while increasing outside.
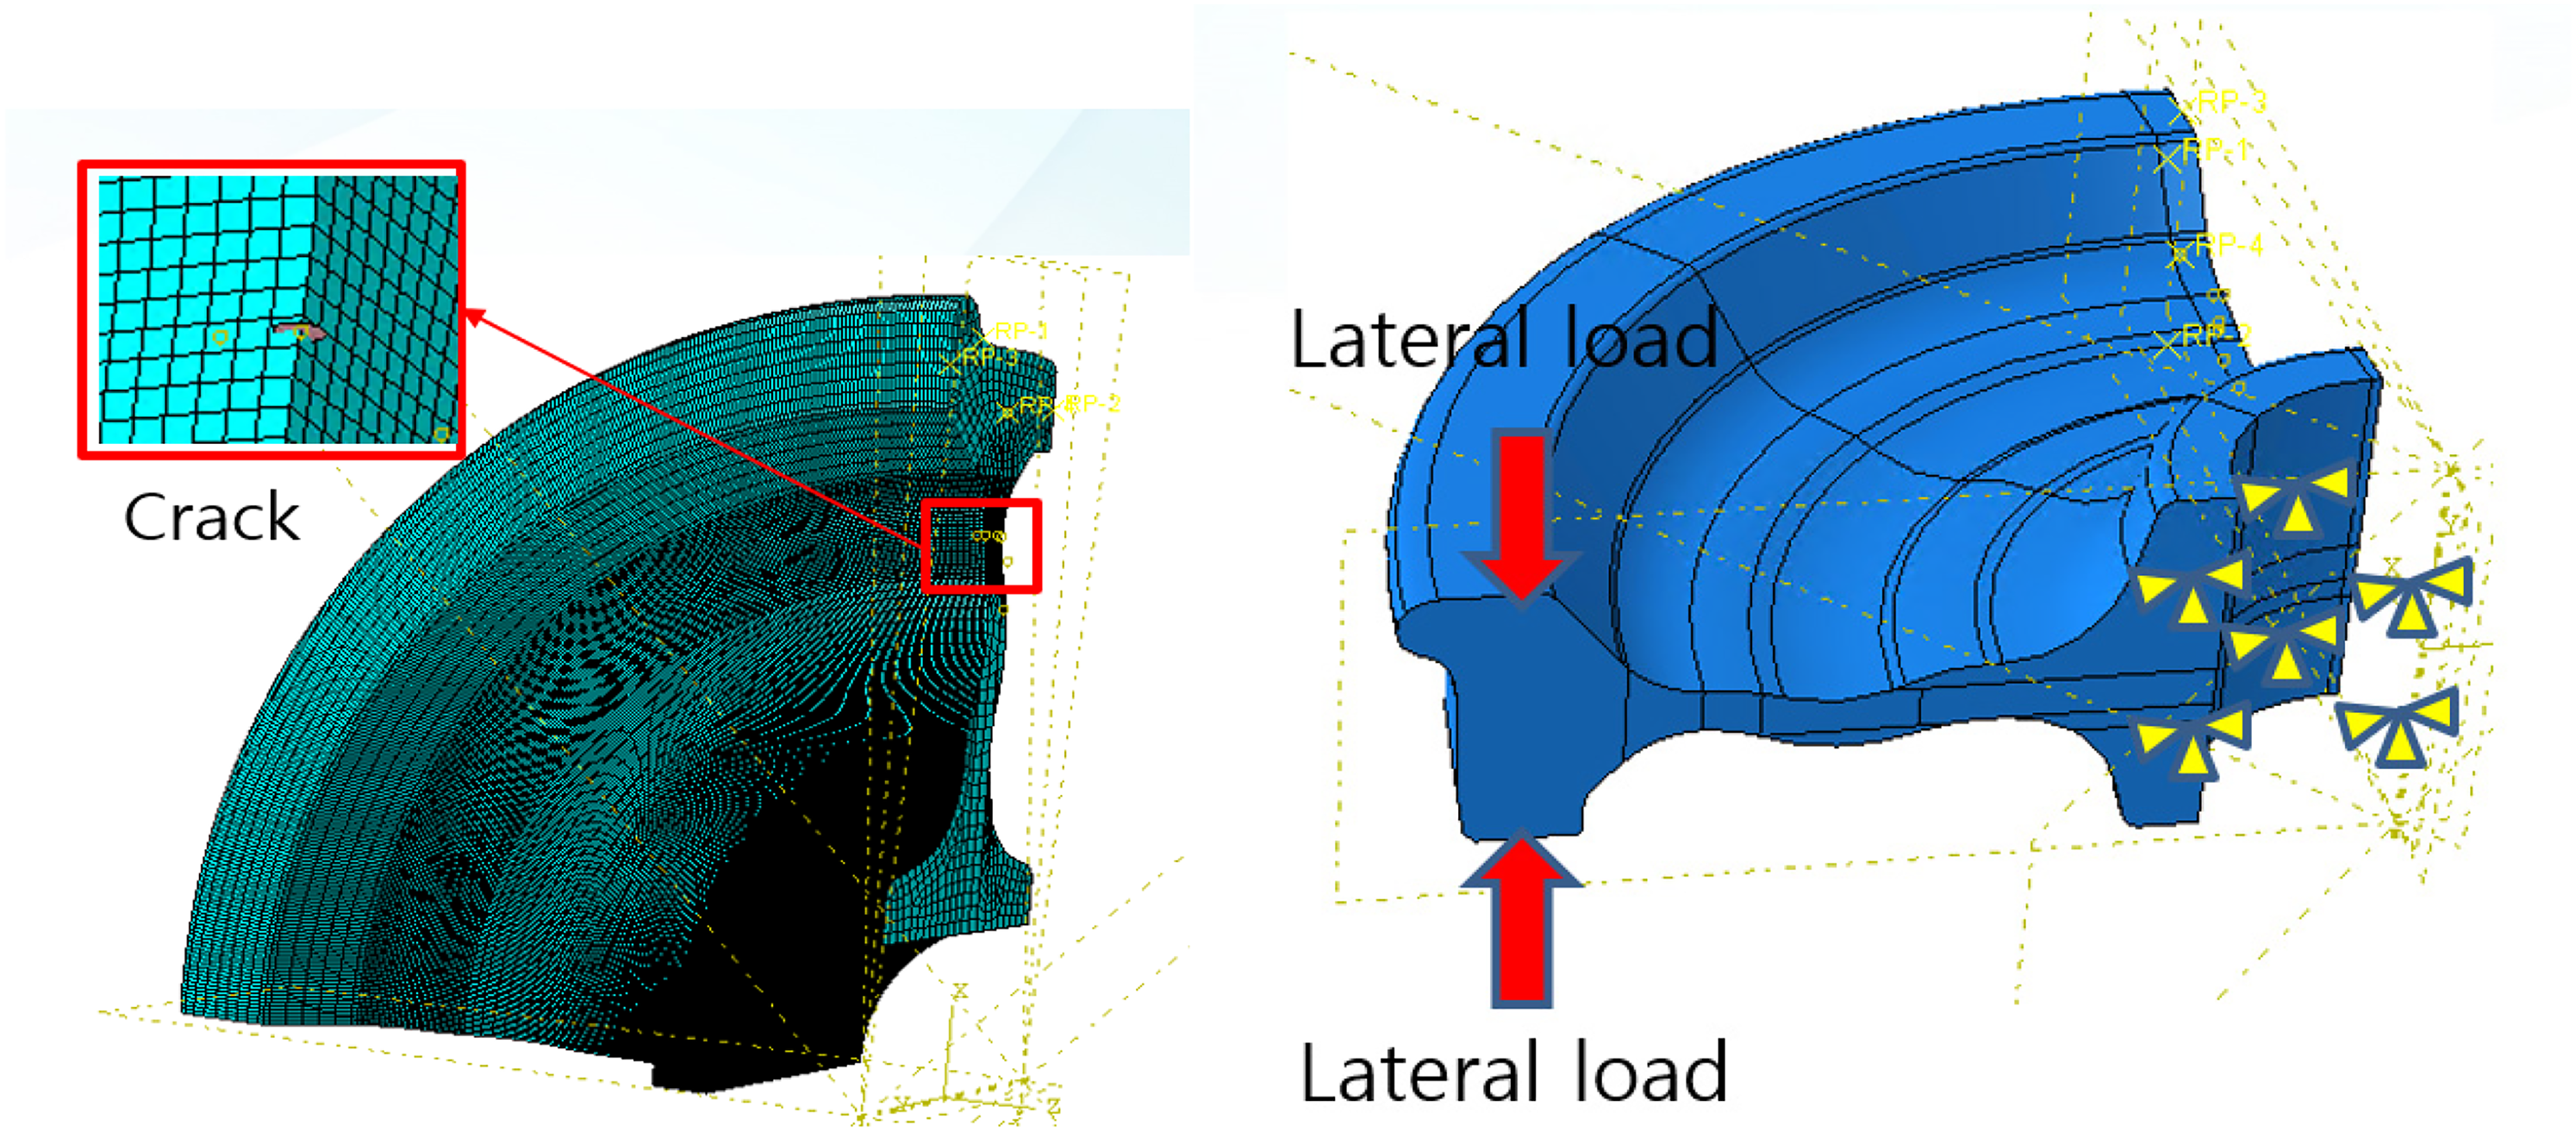
Fe model and boundary conditions for crack growth analysis.
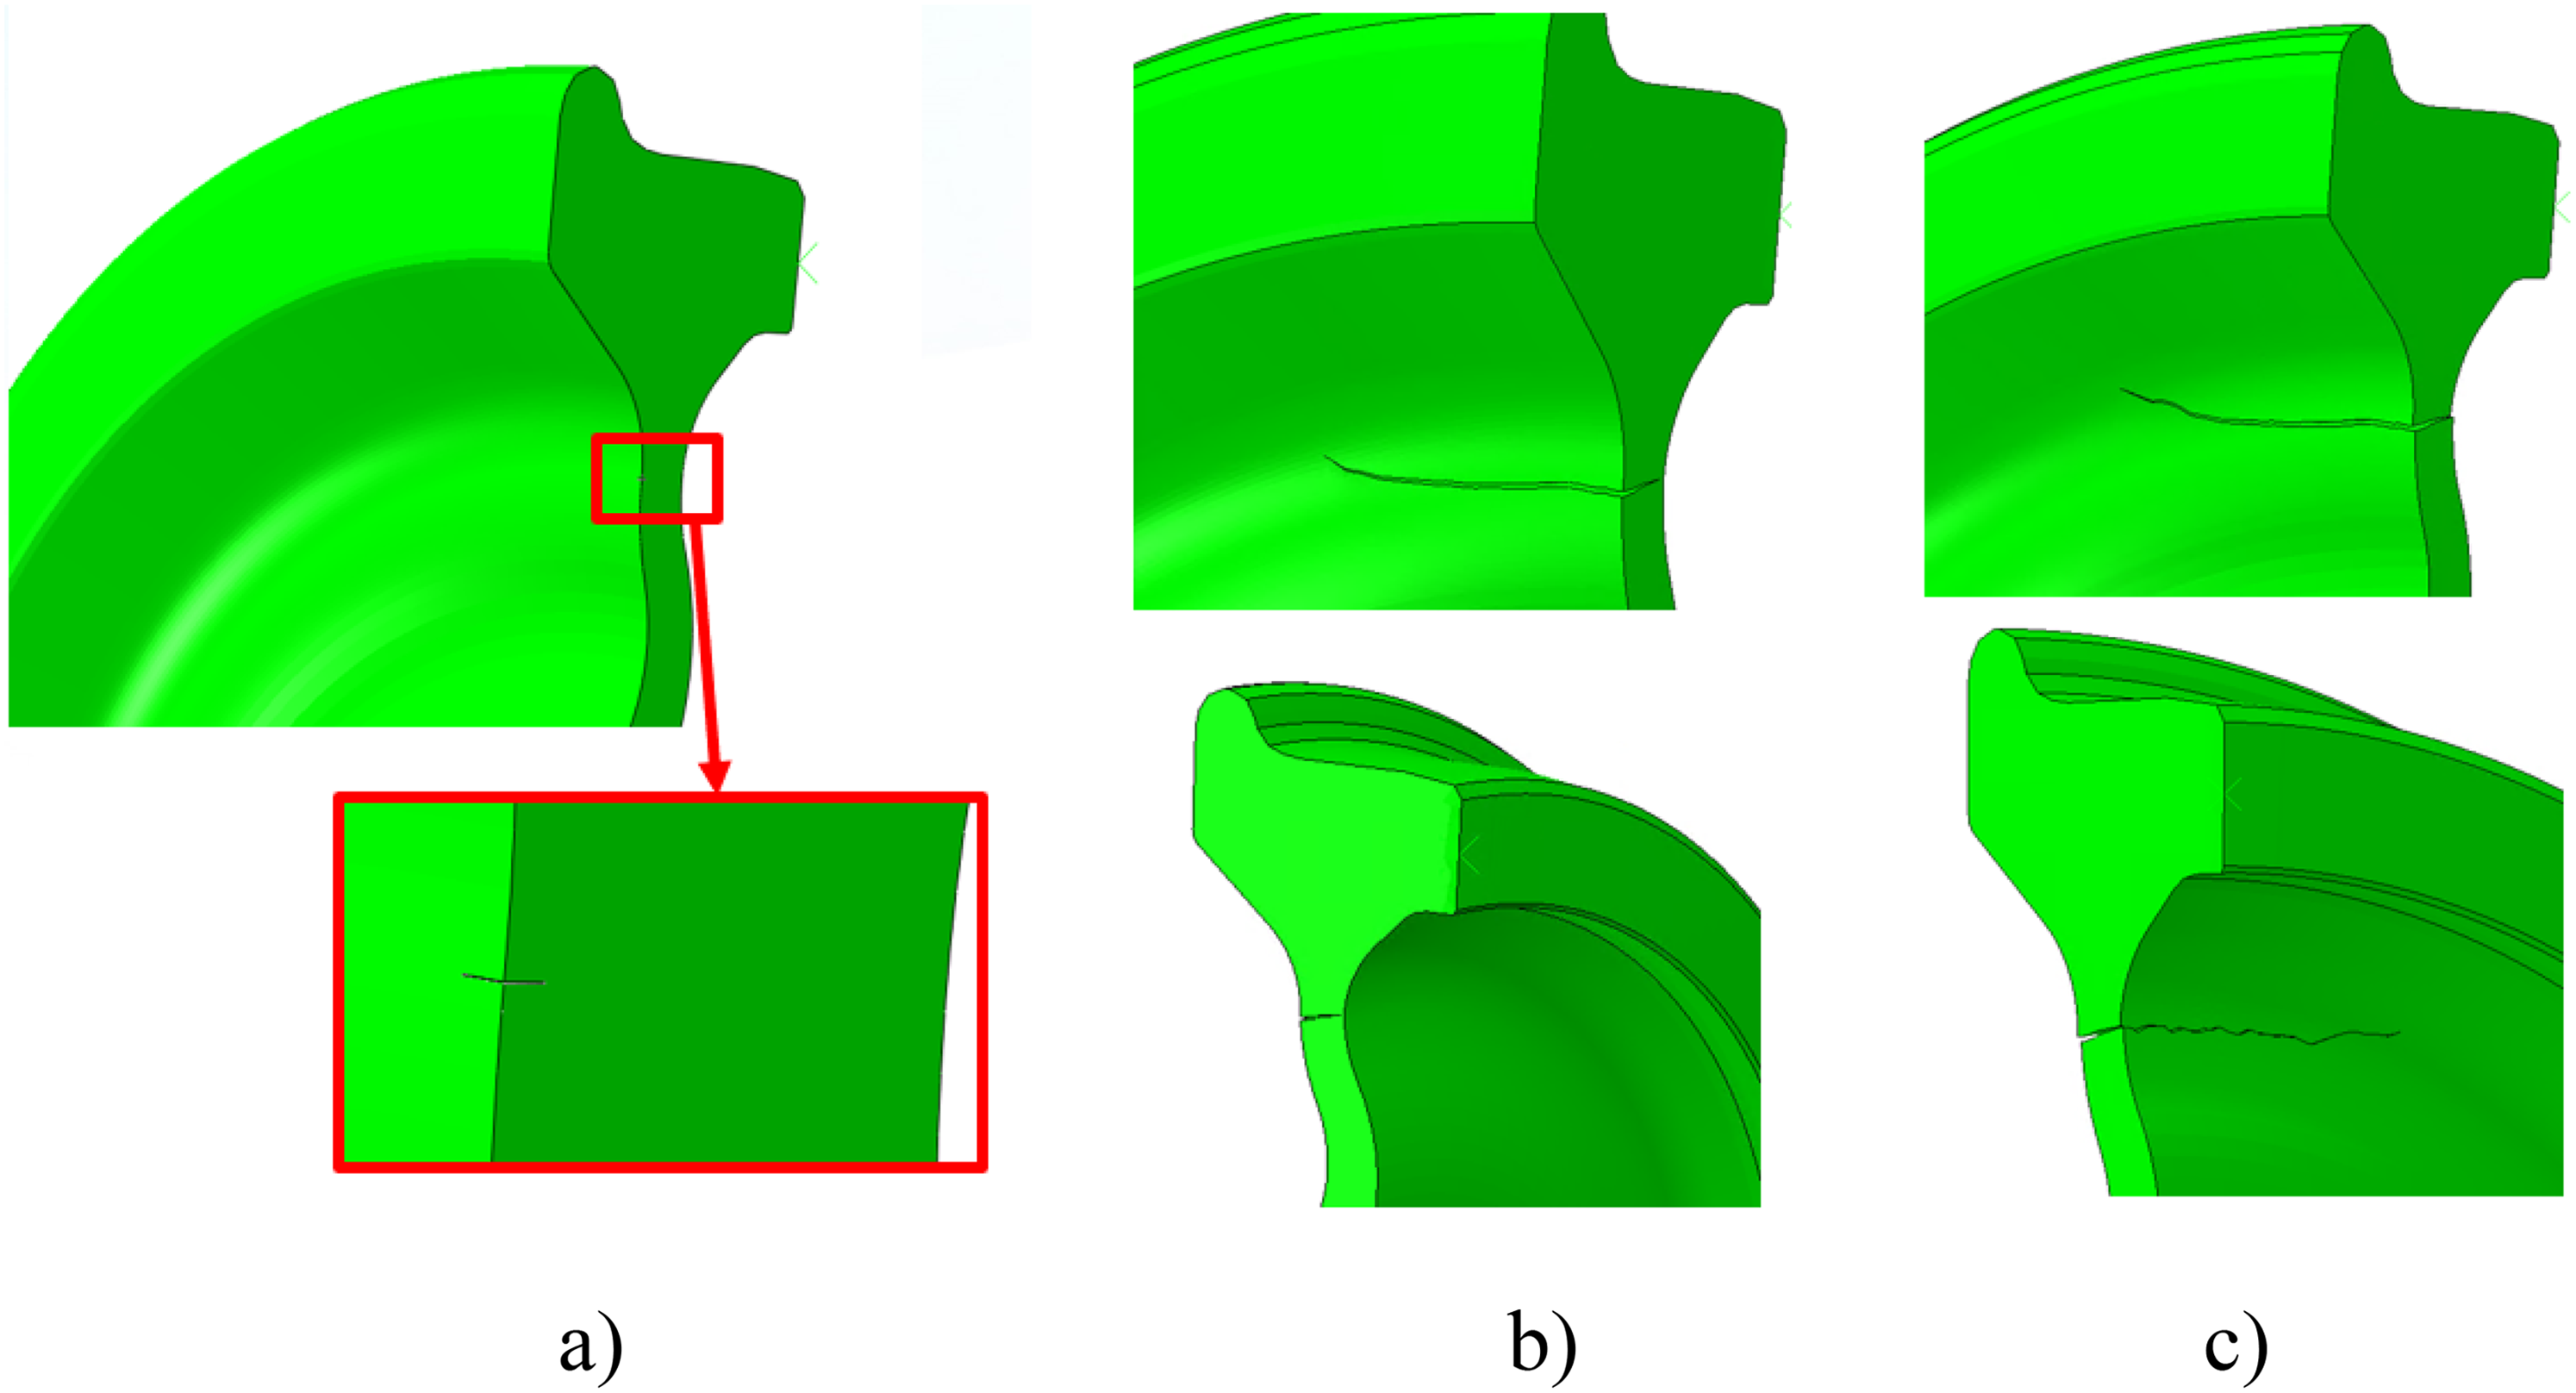
Results from crack growth analysis for a wheel. (a) Initial crack (b) Initial crack growth (c) Crack growth after through-wall crack.
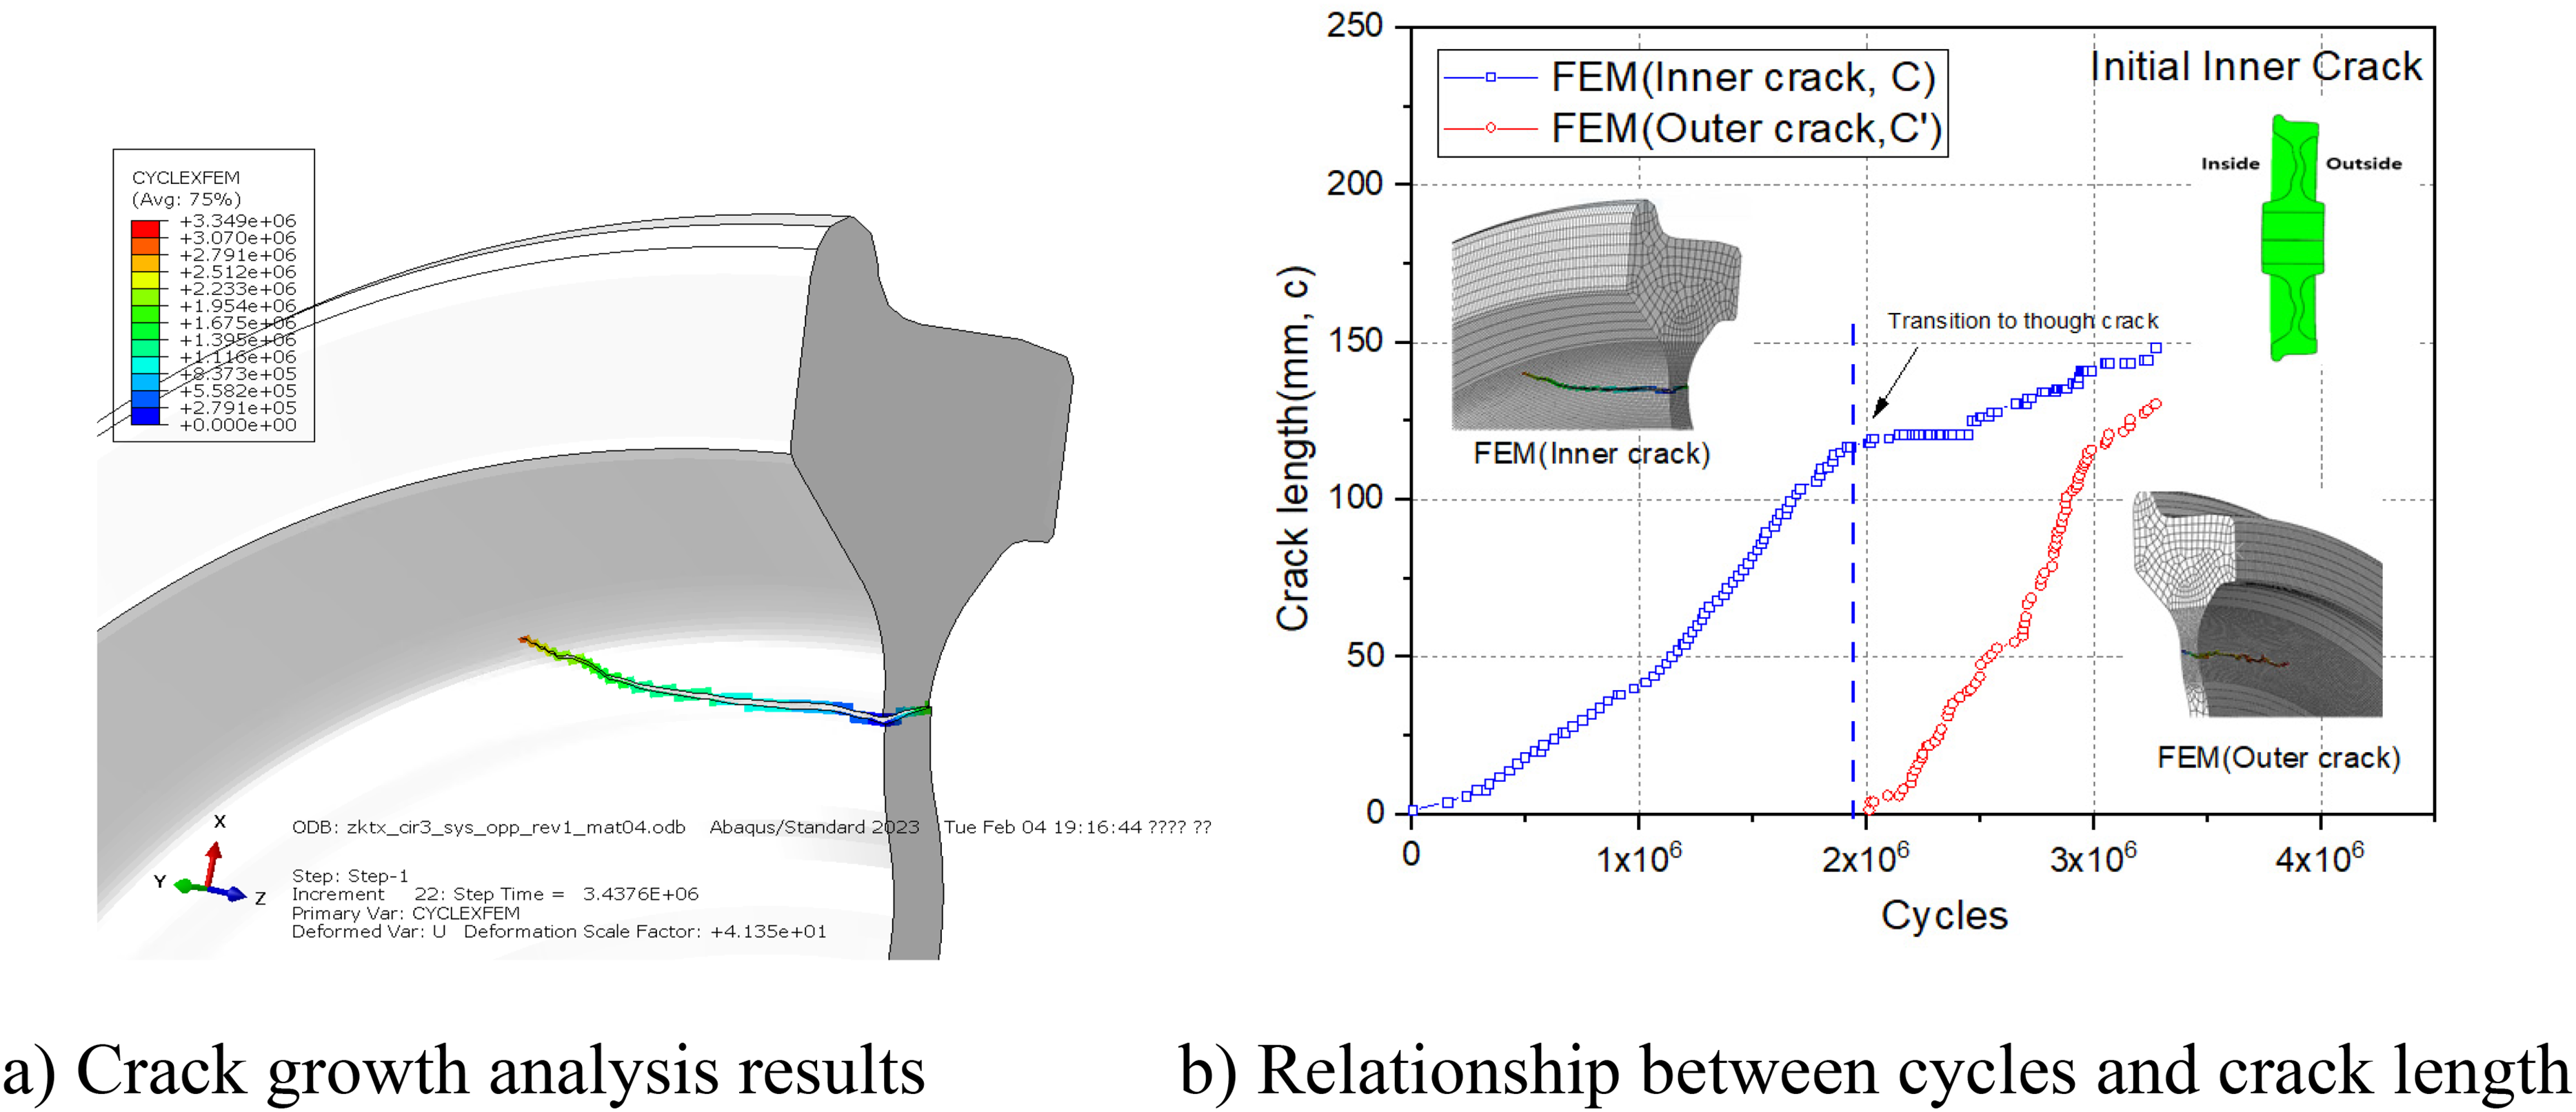
Crack growth curve as a function of the number of cycles.
Results from crack growth analysis and discussion
Crack growth characteristics of the wheel web
Crack growth analysis of a simple flat specimen verified the crack growth characteristics of the wheel web plate. Figure 25(a) shows the standard specimen geometry provided by AFGROW. An elliptical crack was inserted at the center. A bending load with a sinusoidal wave was applied to the specimen. Note that the crack grew only on one side before penetration. Figure 25(b) shows the crack length as a function of the number of cycles. This Fig. shows a curve presenting a typical curve geometry. Figure 26(a) shows the crack growth curve of the wheel web plate. The crack grew only on one side initially in the same manner as the crack growth pattern of the simple specimen, and it rapidly propagated on the other side after penetration. Figure 26(b) shows the wheel geometry and crack growth direction. The simple specimen had a constant thickness, but the thickness of the wheel varied depending on the crack growth direction. The crack grew in the circumferential direction along the web plate of the wheel initially, but the crack growth direction changed toward the rim with a higher thickness under the influence of the loads. Initially, these conditions caused a crack growth pattern similar to the simple specimen, but the results differed after the through-wall crack.
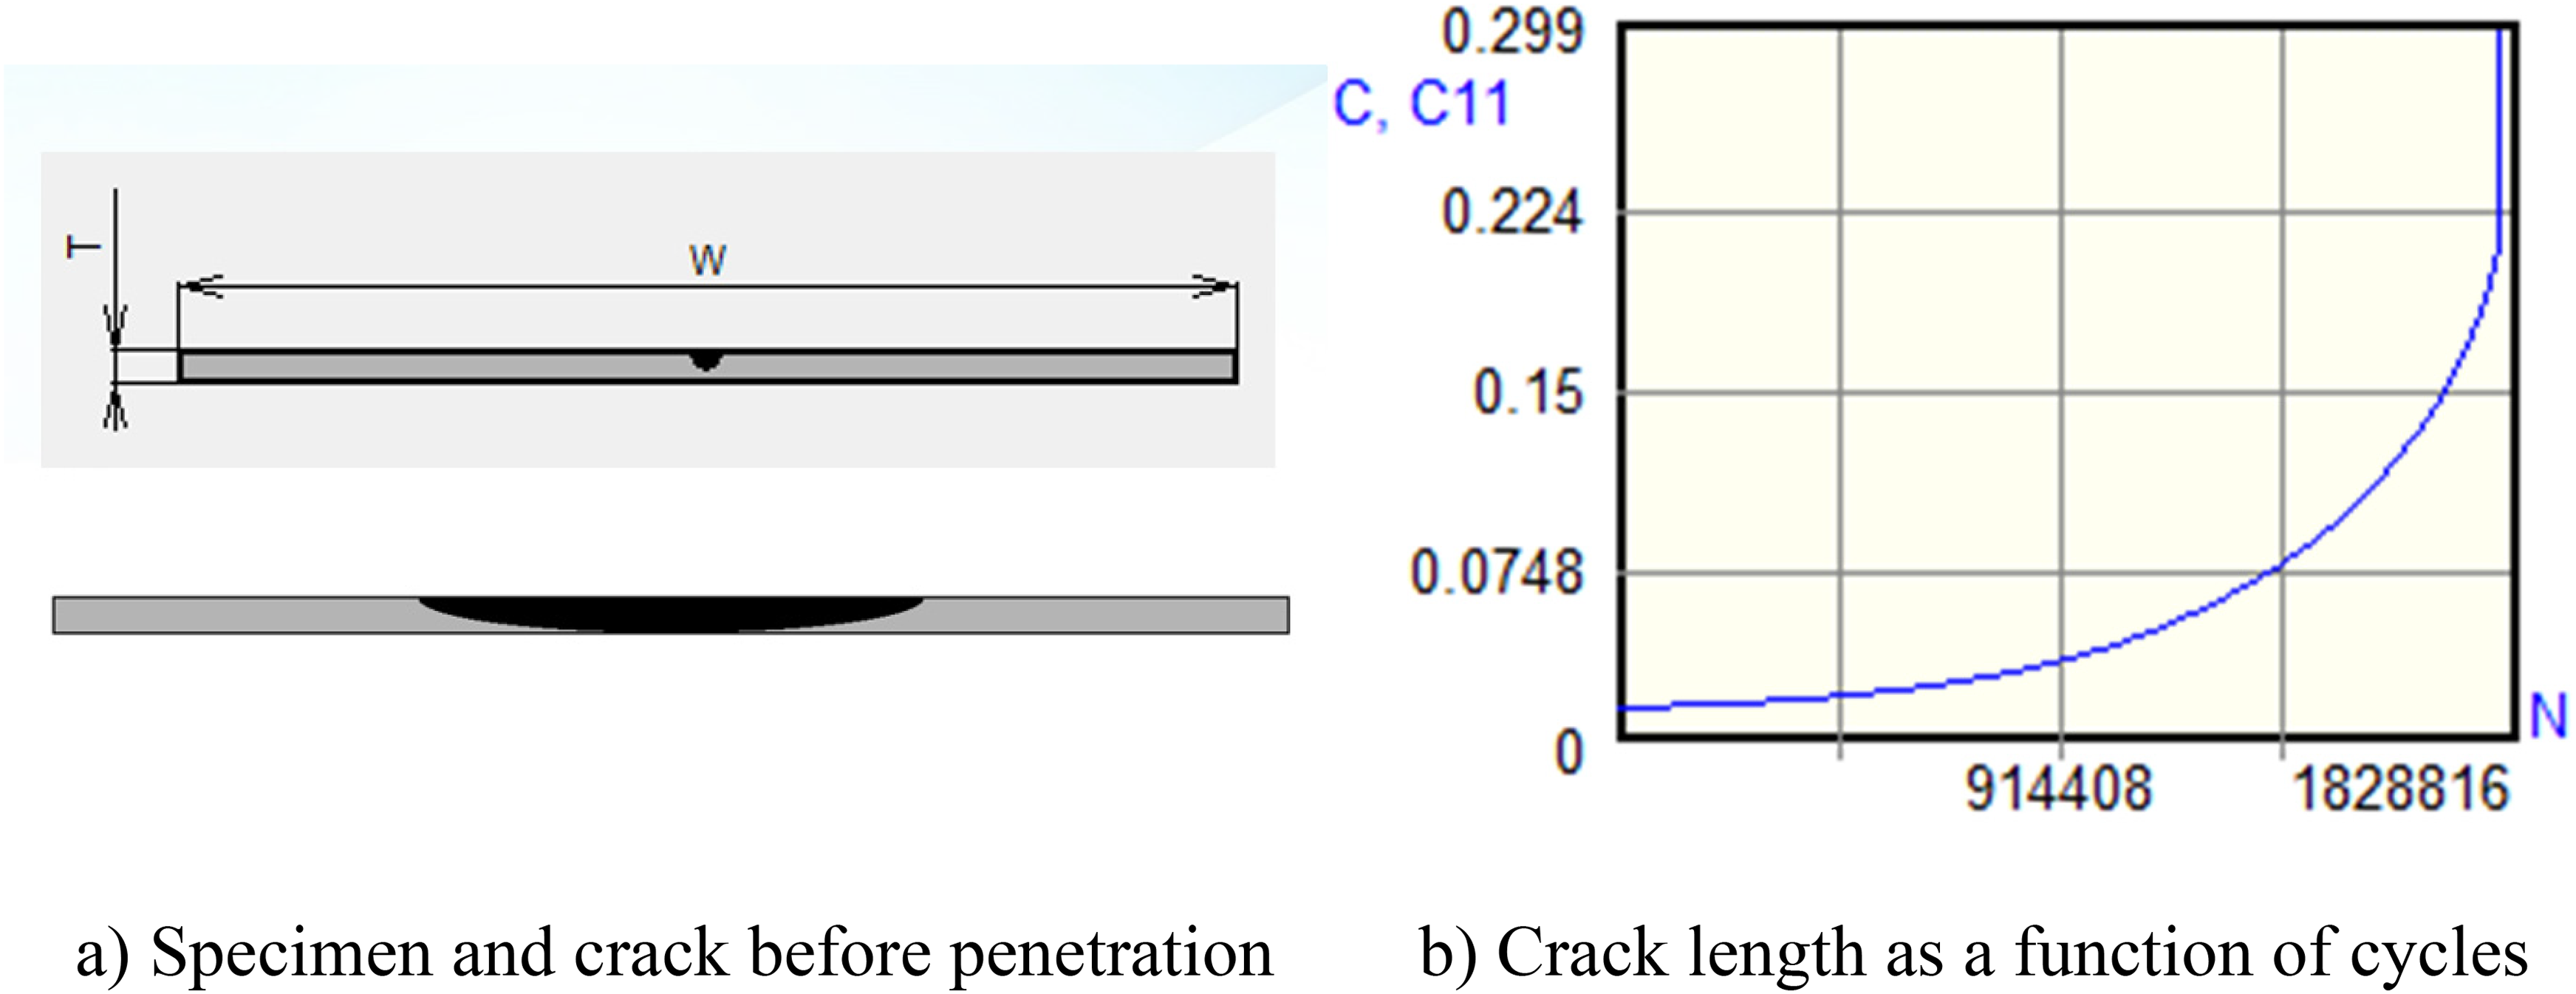
Results from crack growth analysis for a simple specimen (AFGROW).
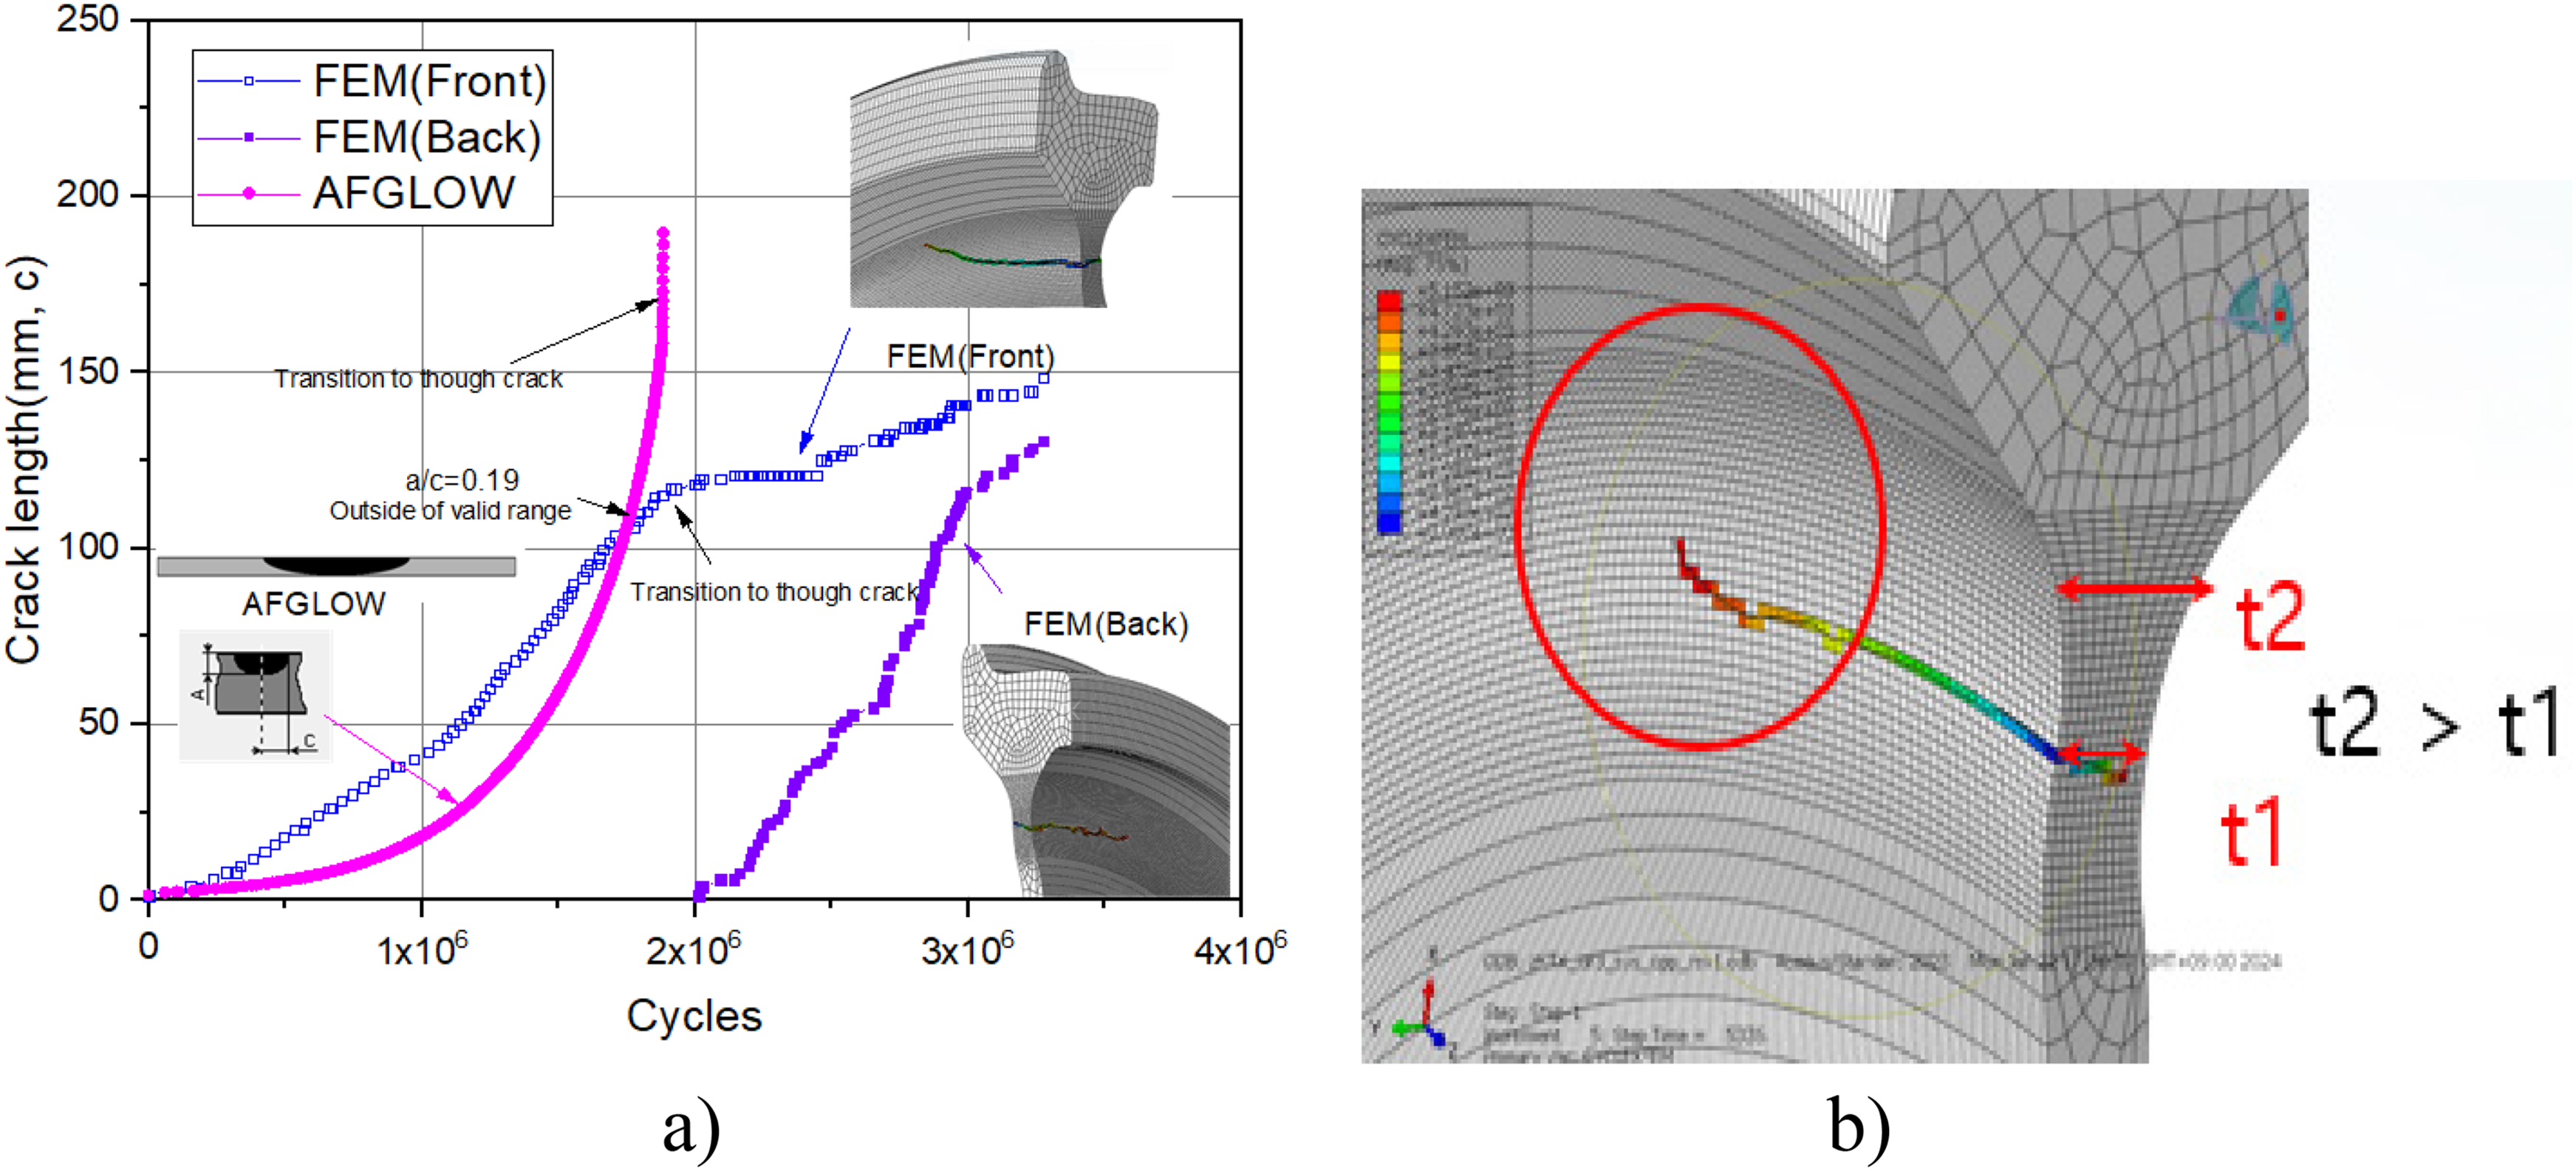
Crack growth characteristics of the wheel web plate. (a) Comparison of crack growth results between the specimen and the wheel (b) Crack growth in the wheel.
Figure 28 shows the fracture surface of the high-speed railway wheel and the beach mark generated by crack growth. Figure 27(a) shows the fracture surface of the wheel; note the beach mark caused by crack growth at the crack origin. The fracture surface of the wheel shows a pattern similar to that of Figure 27(b). When a crack occurred in the web plate of the wheel, the crack grew only on one side and then changed into a through-wall crack. These results align with the crack growth characteristics of the wheel derived through FE analysis. Figure 27(c) shows the results from crack growth analysis based on FE analysis; note the crack before penetration. The crack ratio (a/c) immediately before the occurrence of the through-wall crack was 0.17 for FE analysis and approximately 0.15 for the actually damaged wheel.
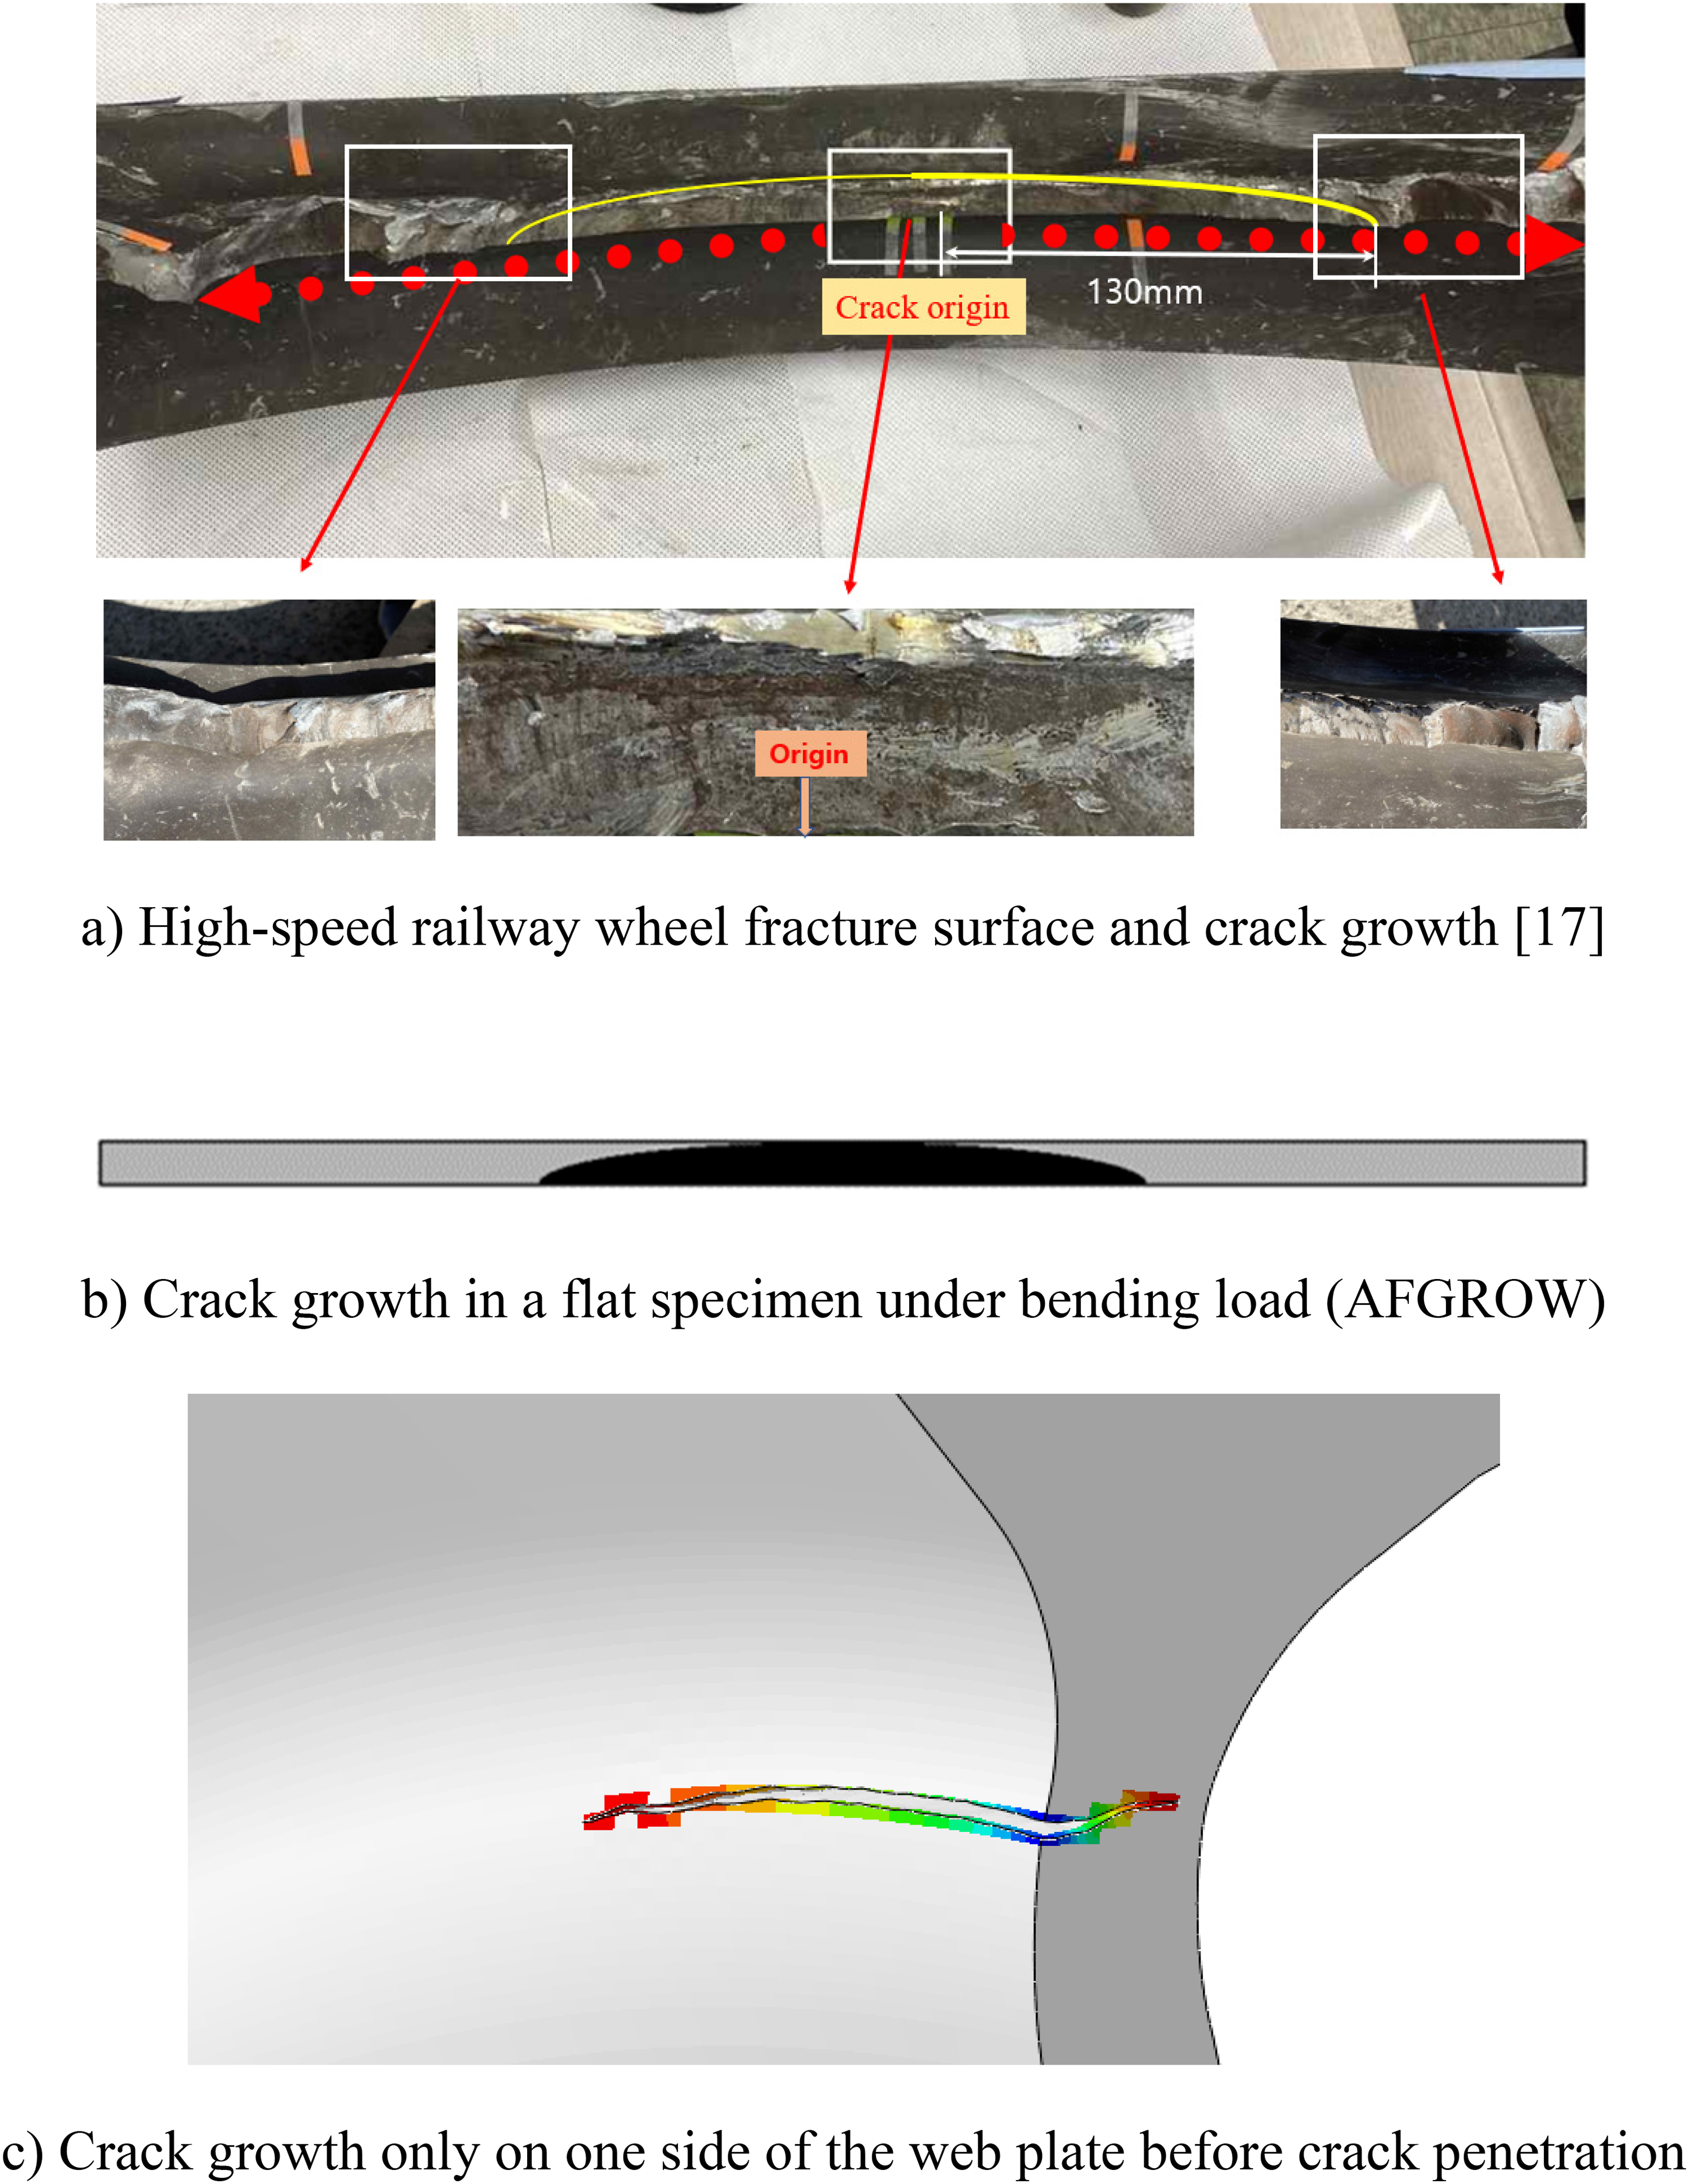
High-speed railway wheel fracture surface and crack growth beach mark.
Crack growth characteristics of the wheel web plate in the presence of initial residual stress (−150 MPa).
Effect of residual stress during manufacturing on crack growth
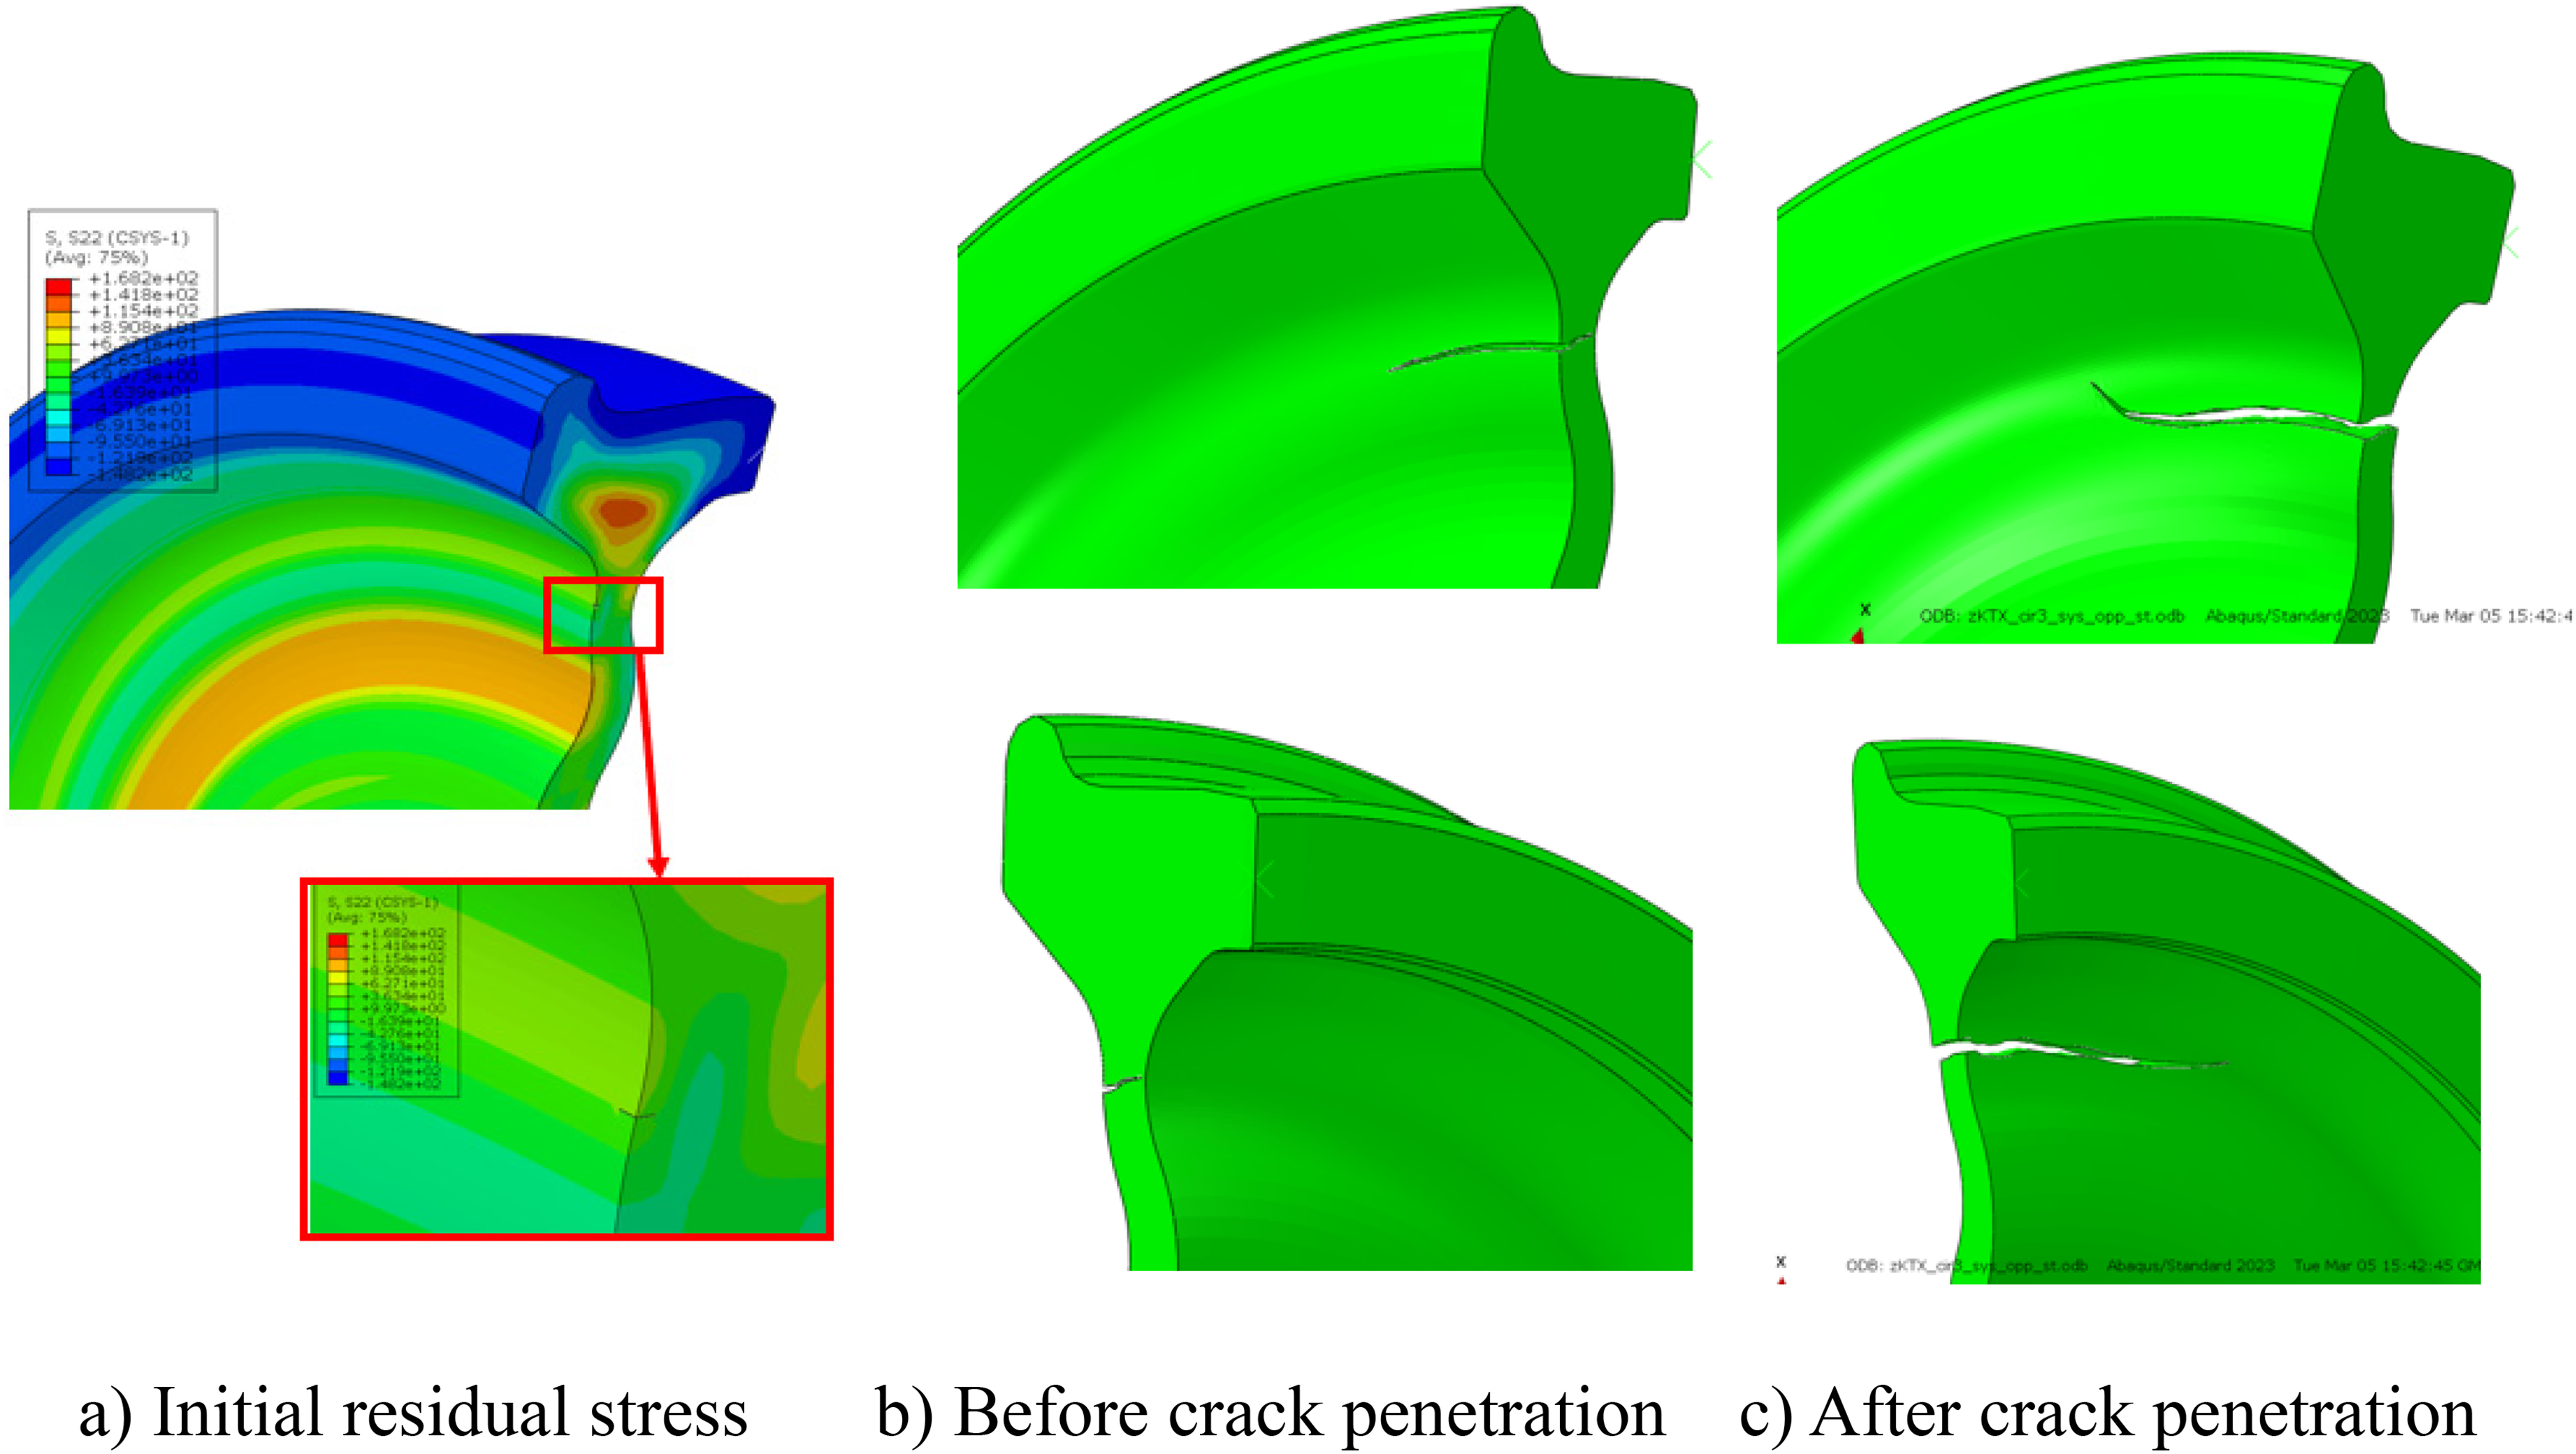
The rim of a wheel is subjected to heat treatment to reduce the wear and contact fatigue damage from rolling contact with the rail. Heat treatment causes CRS in the rim and TRS in other areas to reach equilibrium. Figure 28 shows crack growth characteristics with CRS during manufacturing. Figure 28(a) shows the initial residual stress state for conducting crack growth analysis. The CRS of the rim is −150 MPa. Figure 28(b) shows the crack growth on one side immediately before penetration. Figure 28(c) shows the final crack growth after penetration. Crack growth characteristics similar to those in the absence of initial residual stress can be observed in the figure.
Figure 29 shows the crack growth curve in the presence of the initial residual stress during manufacturing. The crack growth curve patterns are similar to those without initial residual stress (Figure 24(b)). Figure 30 compares the crack growth curves considering the residual stress during manufacturing with those that do not take this stress into account. Note that residual stress from manufacturing significantly affects the crack growth rate. The difference was approximately 5.8 times when comparing the cycles with a crack length of 100 mm.
Crack growth curves in the presence of initial residual stress (−150 MPa).
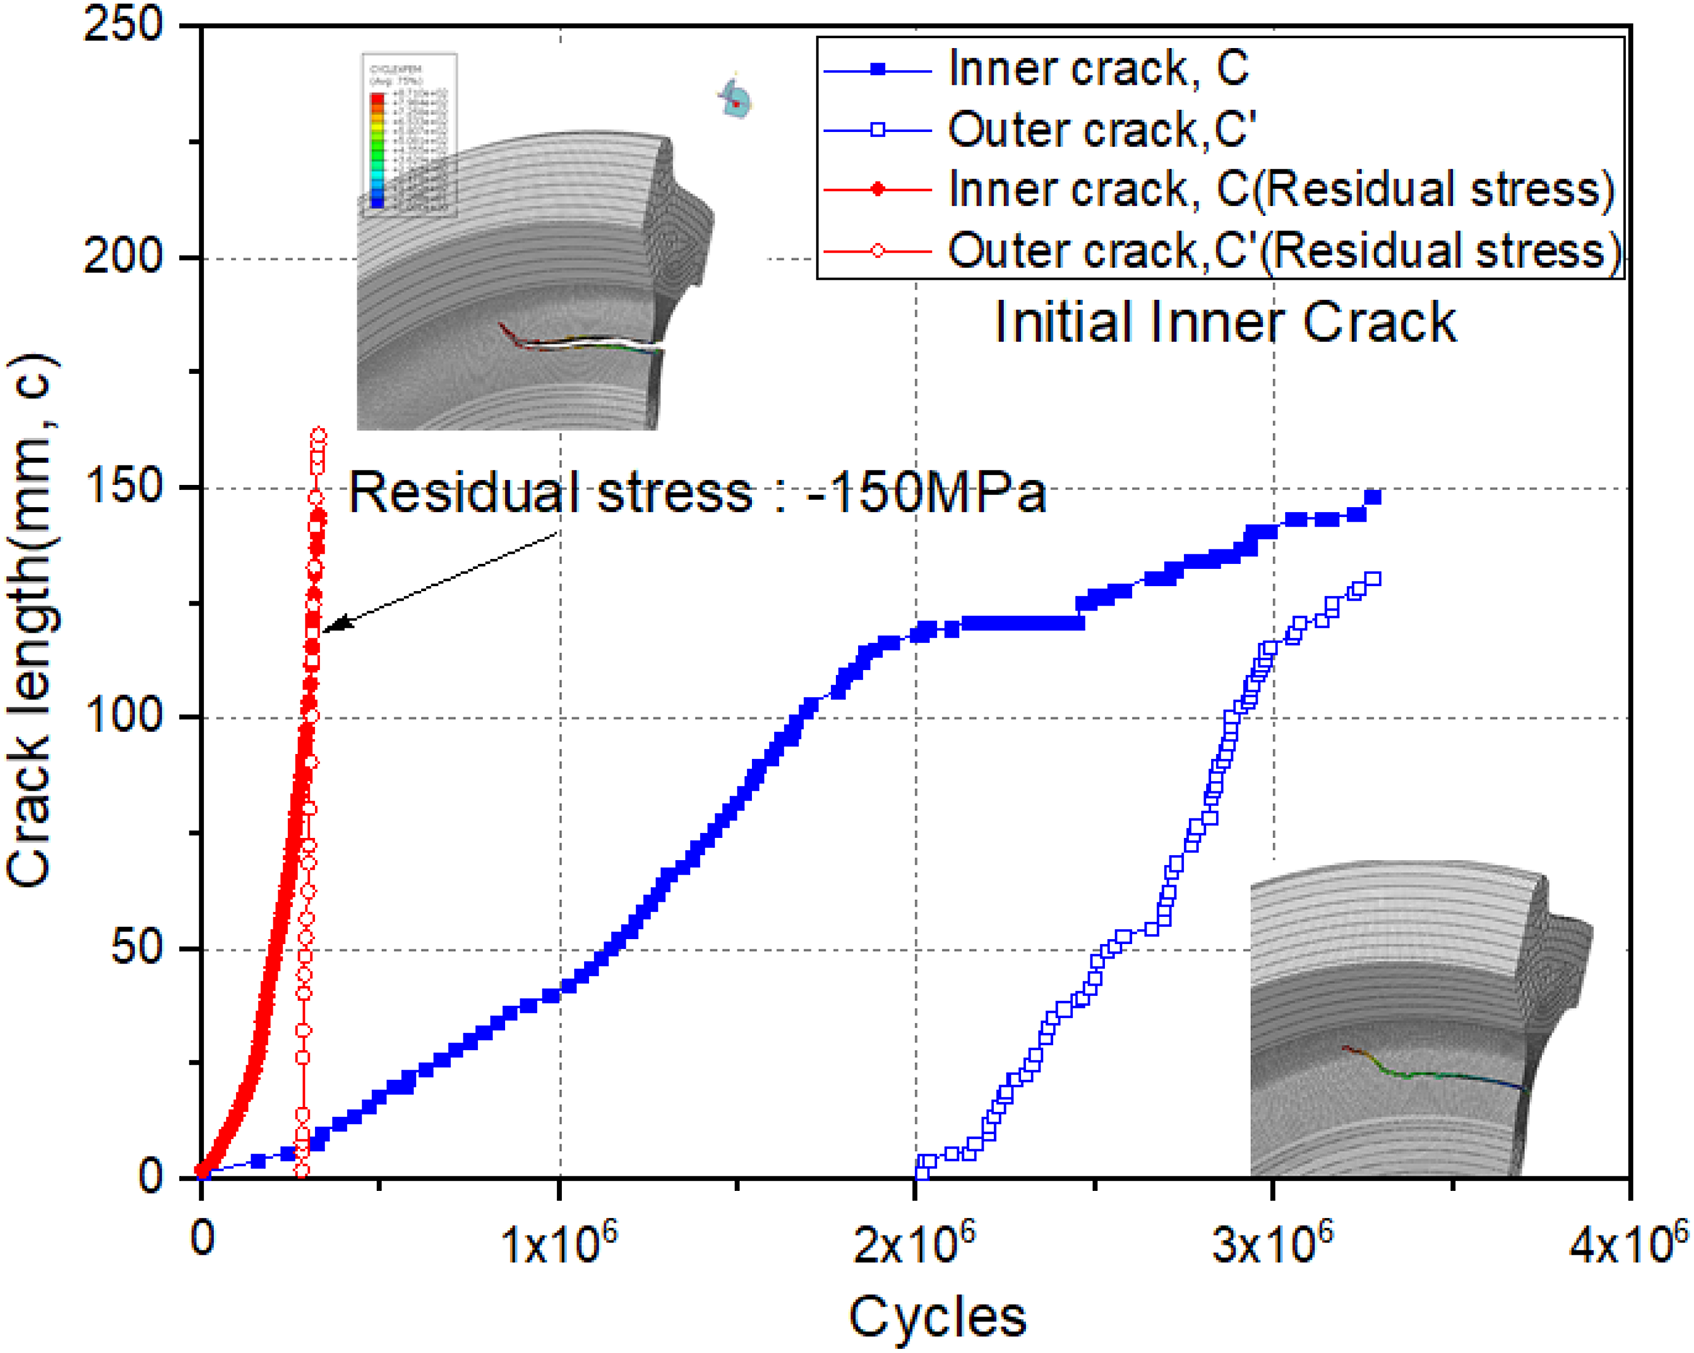
Comparison of crack growth characteristics with and without initial residual stress.
Crack growth characteristics considering residual stress and crack location
Residual stress from wheel manufacturing varies depending on heat treatment. Therefore, evaluating crack growth characteristics based on the magnitude of residual stress is important. Two model types were created by varying heat treatment to generate residual stress of approximately −150 and −200 MPa. In addition, cracks in the wheel web plate may occur on both the inside and outside of the wheel. Therefore, a total of four models were created considering the magnitude of residual stress and the crack location as follows: inner crack and a residual stress of −150 MPa (case 1); inner crack and a residual stress of −200 MPa (case 2); outer crack and a residual stress of −150 MPa (case 3); and outer crack and a residual stress of −200 MPa (case 4). The residual stresses of −150 MPa and −200 MPa represent CTS generated at the contact surface during manufacturing. In regions where cracks occur, TRS develop in proportion to the magnitude of the CRS. Accordingly, among the four models, the one with the higher CRS at the contact surface also exhibits greater TRS at the crack initiation site.
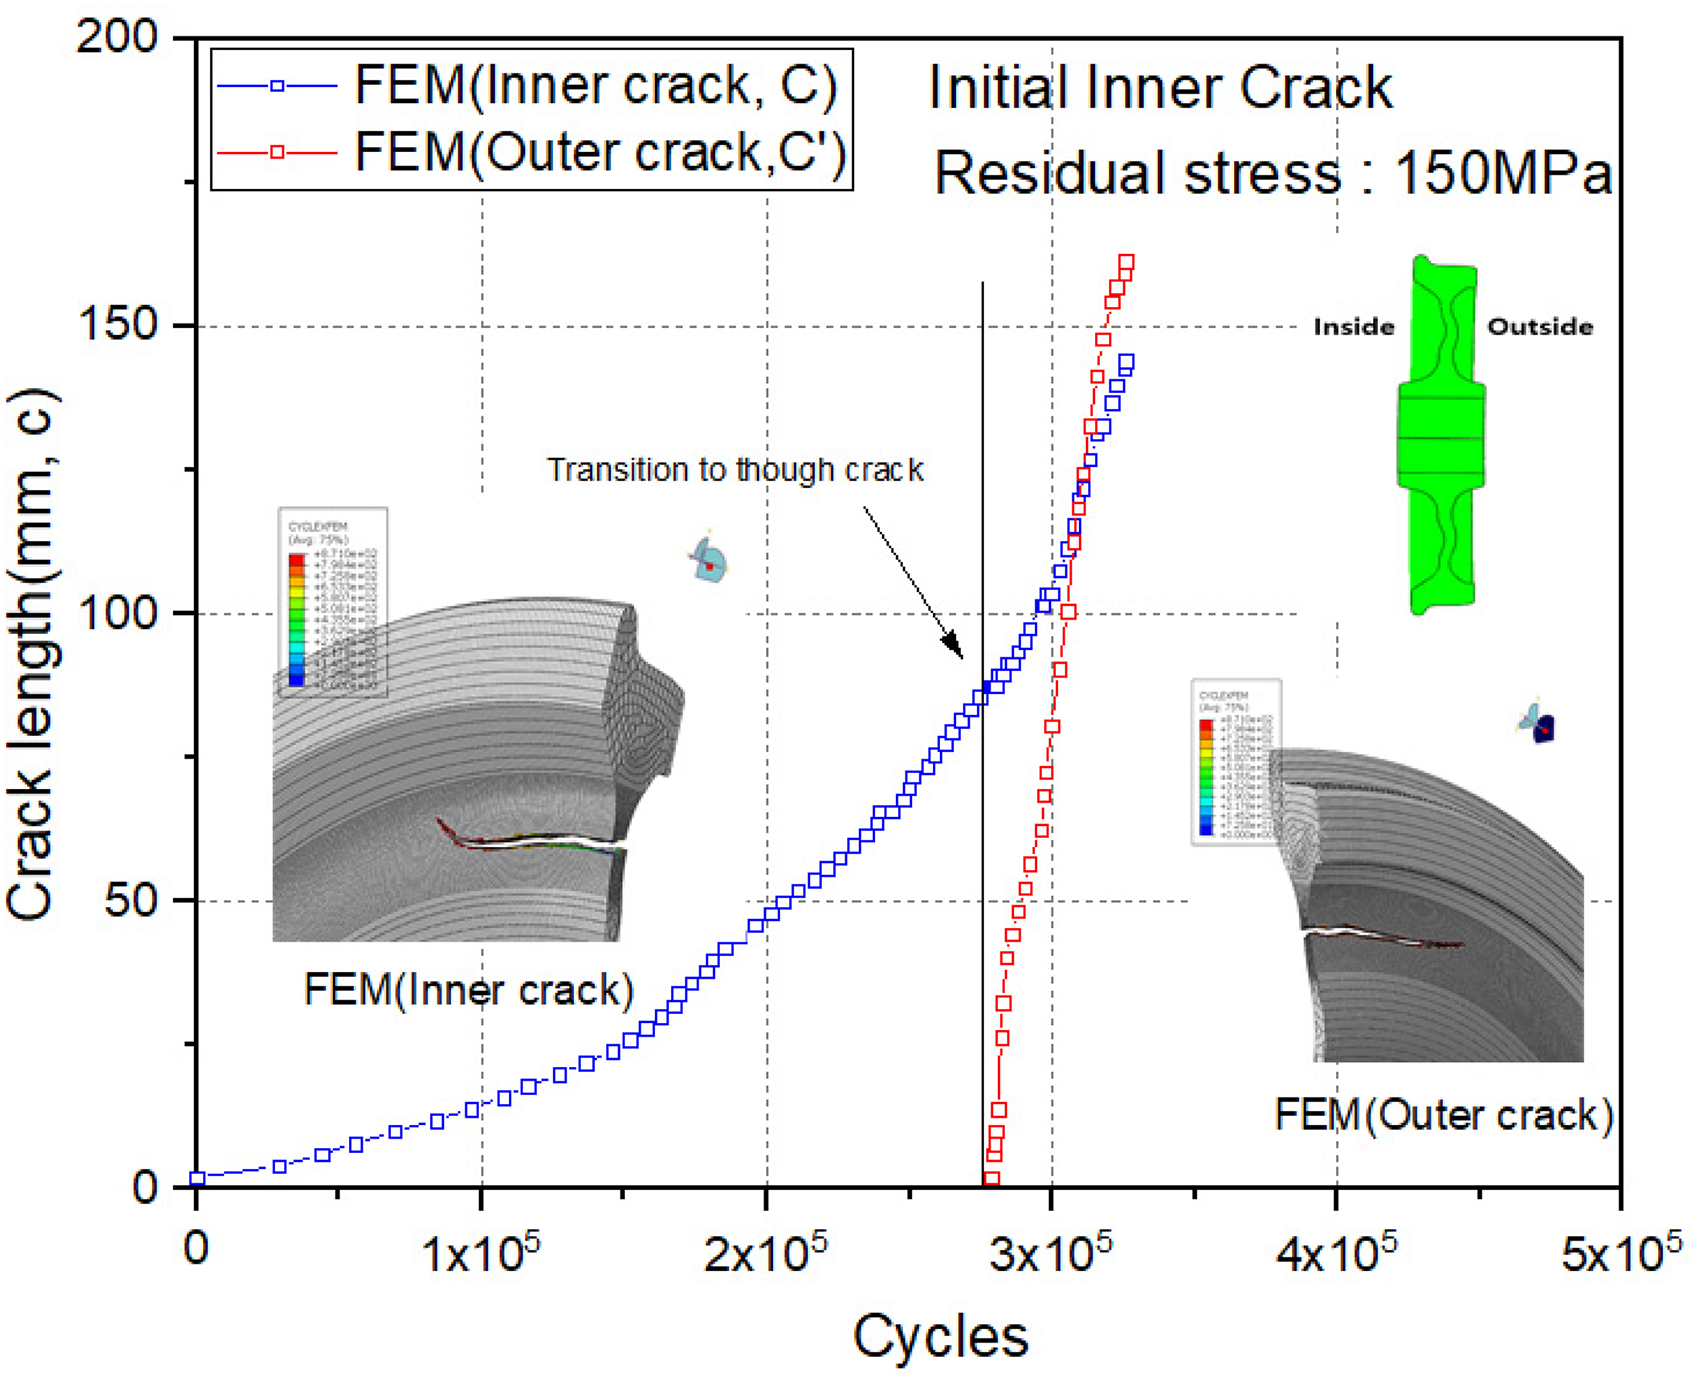
Figure 31 compares crack growth patterns as a function of the magnitude of initial residual stress. Two models (cases 1 and 2) exhibit similar crack growth patterns, but the crack lengths differ. Figure 32 compares the crack growth curves for both models. It can be seen that the model with higher TRS at the crack location (Case 2) exhibits a higher crack growth rate. The length of the through-wall crack is also different for the two models: 115 mm for the model with lower CRS (case 1) and 157 mm for the other model (case 2). When the TRS at the crack location is high, the crack tends to propagate more rapidly, and the crack length at which through-thickness cracking occurs becomes longer, potentially leading to sudden failure.
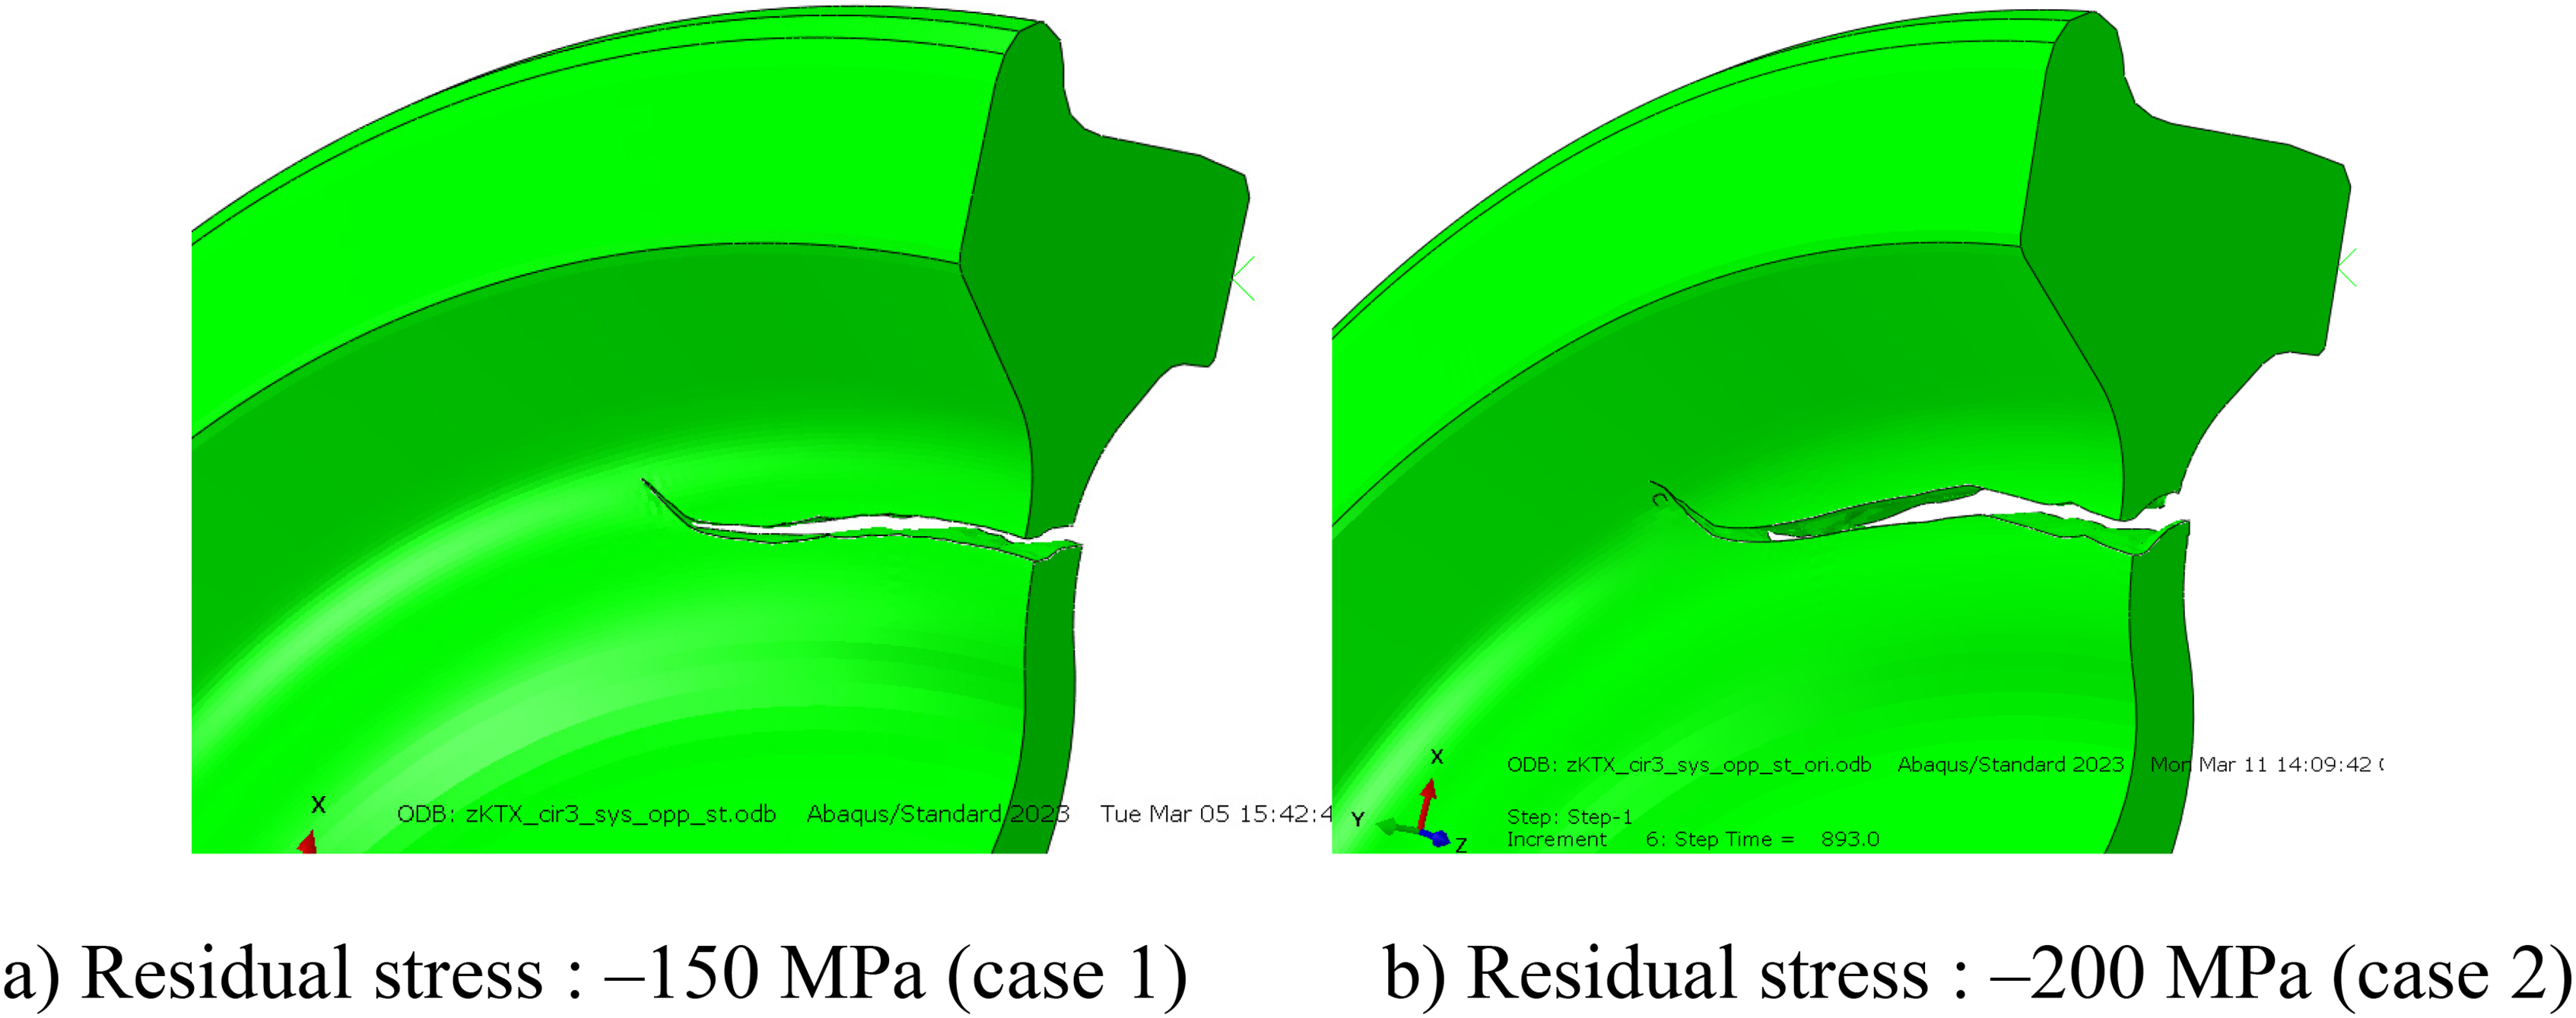
Comparison of crack growth patterns according to initial residual stress magnitude.
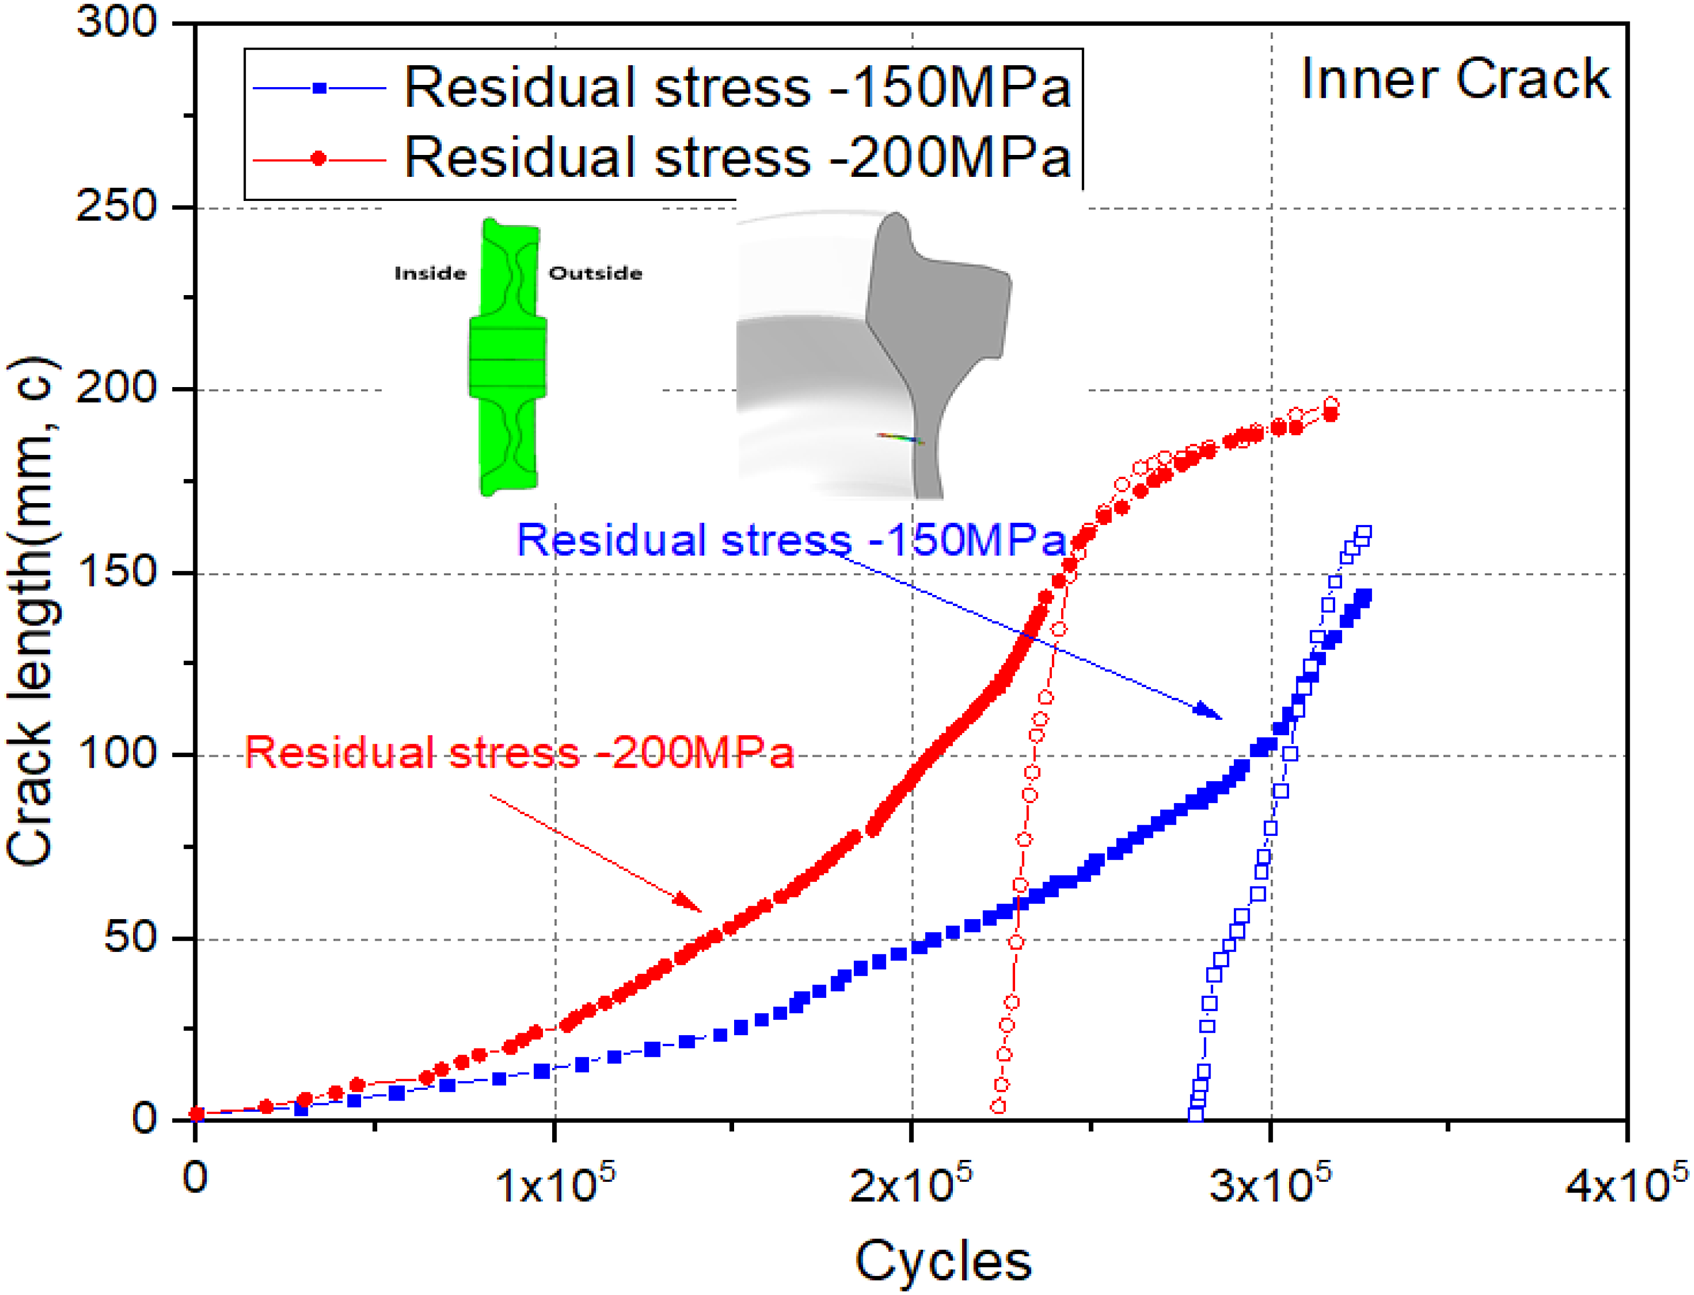
Comparison of crack growth characteristics according to initial residual stress magnitude.
Figure 33 compares the crack growth curves of the outer crack as a function of the magnitude of initial residual stress (cases 3 and 4). The curves exhibit patterns similar to those of the crack growth curves of the inner crack (Figure 32). It is observed that the model exhibiting higher TRS at the crack location shows a faster crack propagation rate, along with a longer resulting crack length. A difference given by a factor of 1.9 can be observed in terms of the magnitude of CRS when the cycles with a crack length of 100 mm are compared.
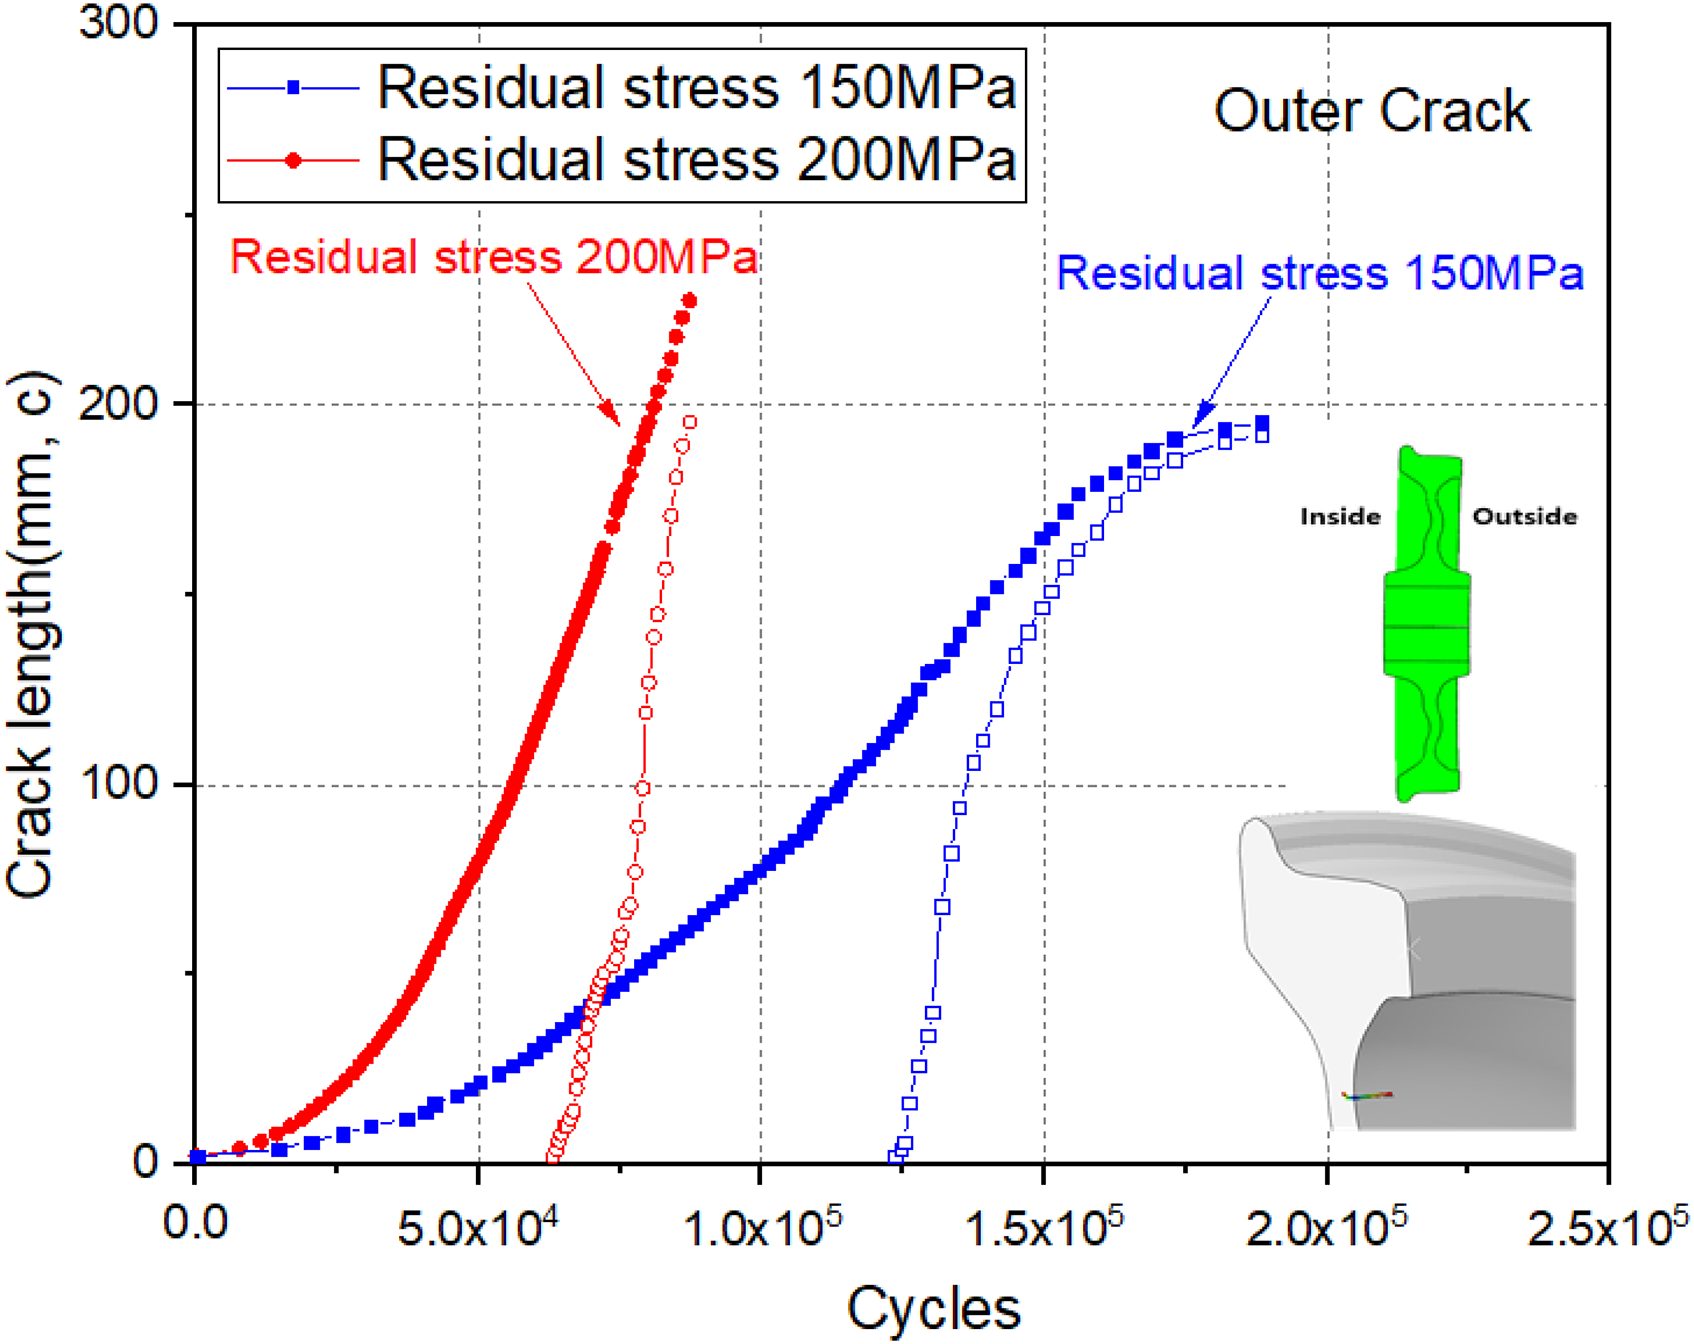
Crack growth characteristics of the wheel web plate according to initial residual stress magnitude (outer crack).
Figure 34 compares the crack growth curves as a function of the magnitude of initial residual stress and the crack location. Regardless of residual stress, the outer cracks (cases 3 and 4) have higher crack growth rates than the inner cracks (cases 1 and 2). When the cycles with a crack length of 100 mm are compared, the difference is given by a factor of 3.6 for a CRS of −200 MPa (cases 4/ 2) and 2.6 for −150 MPa (cases 3/ 1).
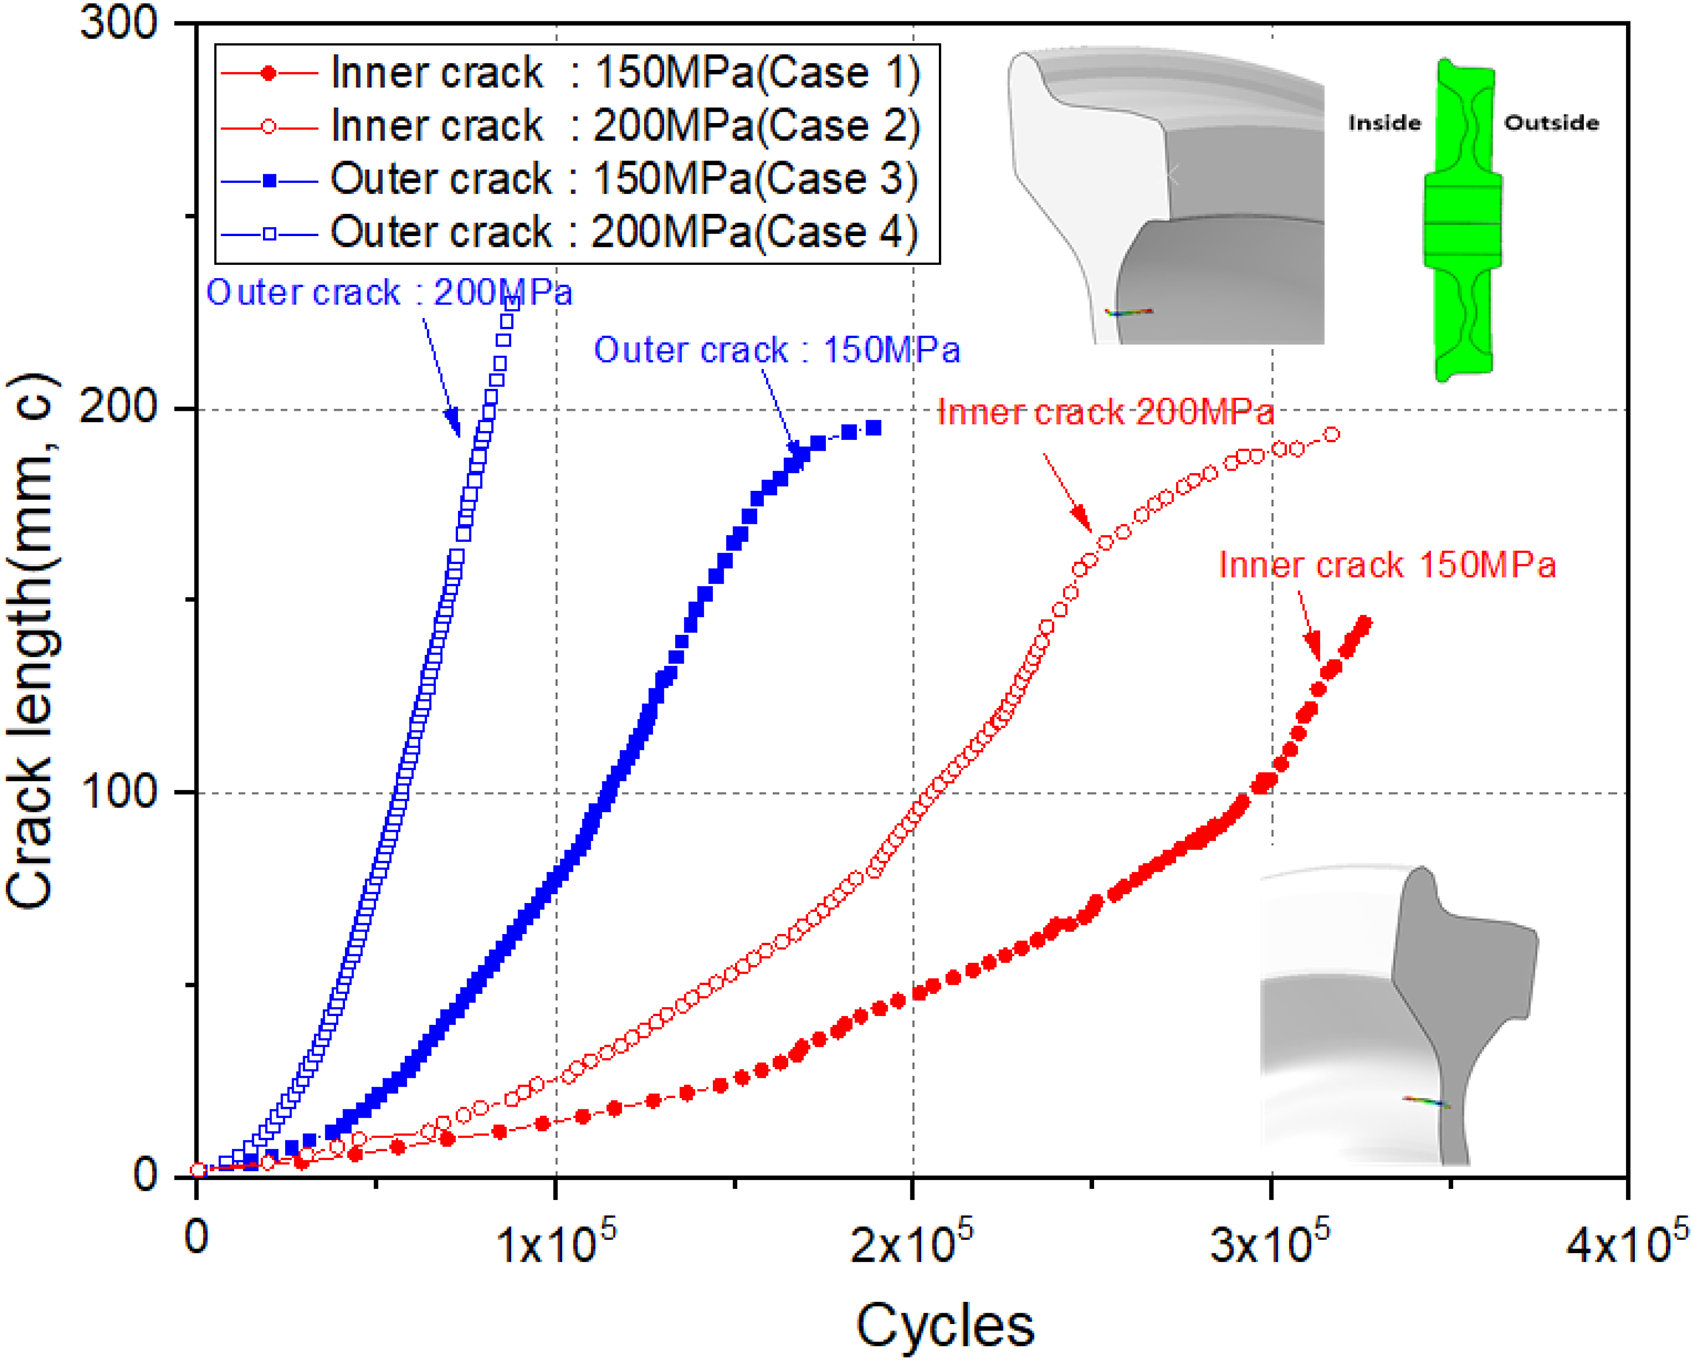
Comparison of crack growth characteristics according to initial residual stress magnitude and crack location.
In Figure 34, the crack growth rate for case 3 with lower CRS in the rim is higher than that of case 2 with higher CRS. This is because the inside and outside of the web plate have different magnitudes of residual stress despite the fact that the same CRS is applied in the rim. Figure 35 compares the distribution of residual stress during manufacturing as a function of the stress direction. Figure 35(a) shows the distribution of the circumferential CRS in the rim. It is used to determine the residual stress standards of wheels in EN 13262. However, in the case of the web plate, the magnitude of radial residual stress is important owing to the application of bending loads. Figure 35(b) shows the distribution of radial residual stress. A significant difference can be observed when the radial residual stresses of the inner and outer crack locations are compared. Given that the radial residual stress of the outside is higher, the crack growth rate is also higher. Figure 36 compares the magnitudes of radial residual stress as a function of the distance from the rim end. It can be seen that the radial residual stress can be significantly different depending on the crack location despite the fact that the same circumferential residual stress is applied in the rim. Figure 36(a) is the case in which the circumferential CRS was −150 MPa. The radial residual stress generated was 100 MPa on the inside (case 1) and 142 MPa on the outside (case 3). Figure 36(b) corresponds to the case in which the circumferential CRS was −200 MPa. The radial residual stress generated was 122 MPa on the inside (case 2) and 223 MPa on the outside (case 4). Therefore, as shown in Figure 34, case 4 exhibits the highest crack growth rate, followed by cases 3, 2, and 1, according to the magnitude of residual stress. The application of heat treatment for generating circumferential CRS in the wheel rim causes radial TRS with a similar magnitude in the wheel web plate. When the CRS in the rim was −150 MPa, a radial TRS of 142 MPa was generated in the web plate, which significantly affected the crack growth rate.
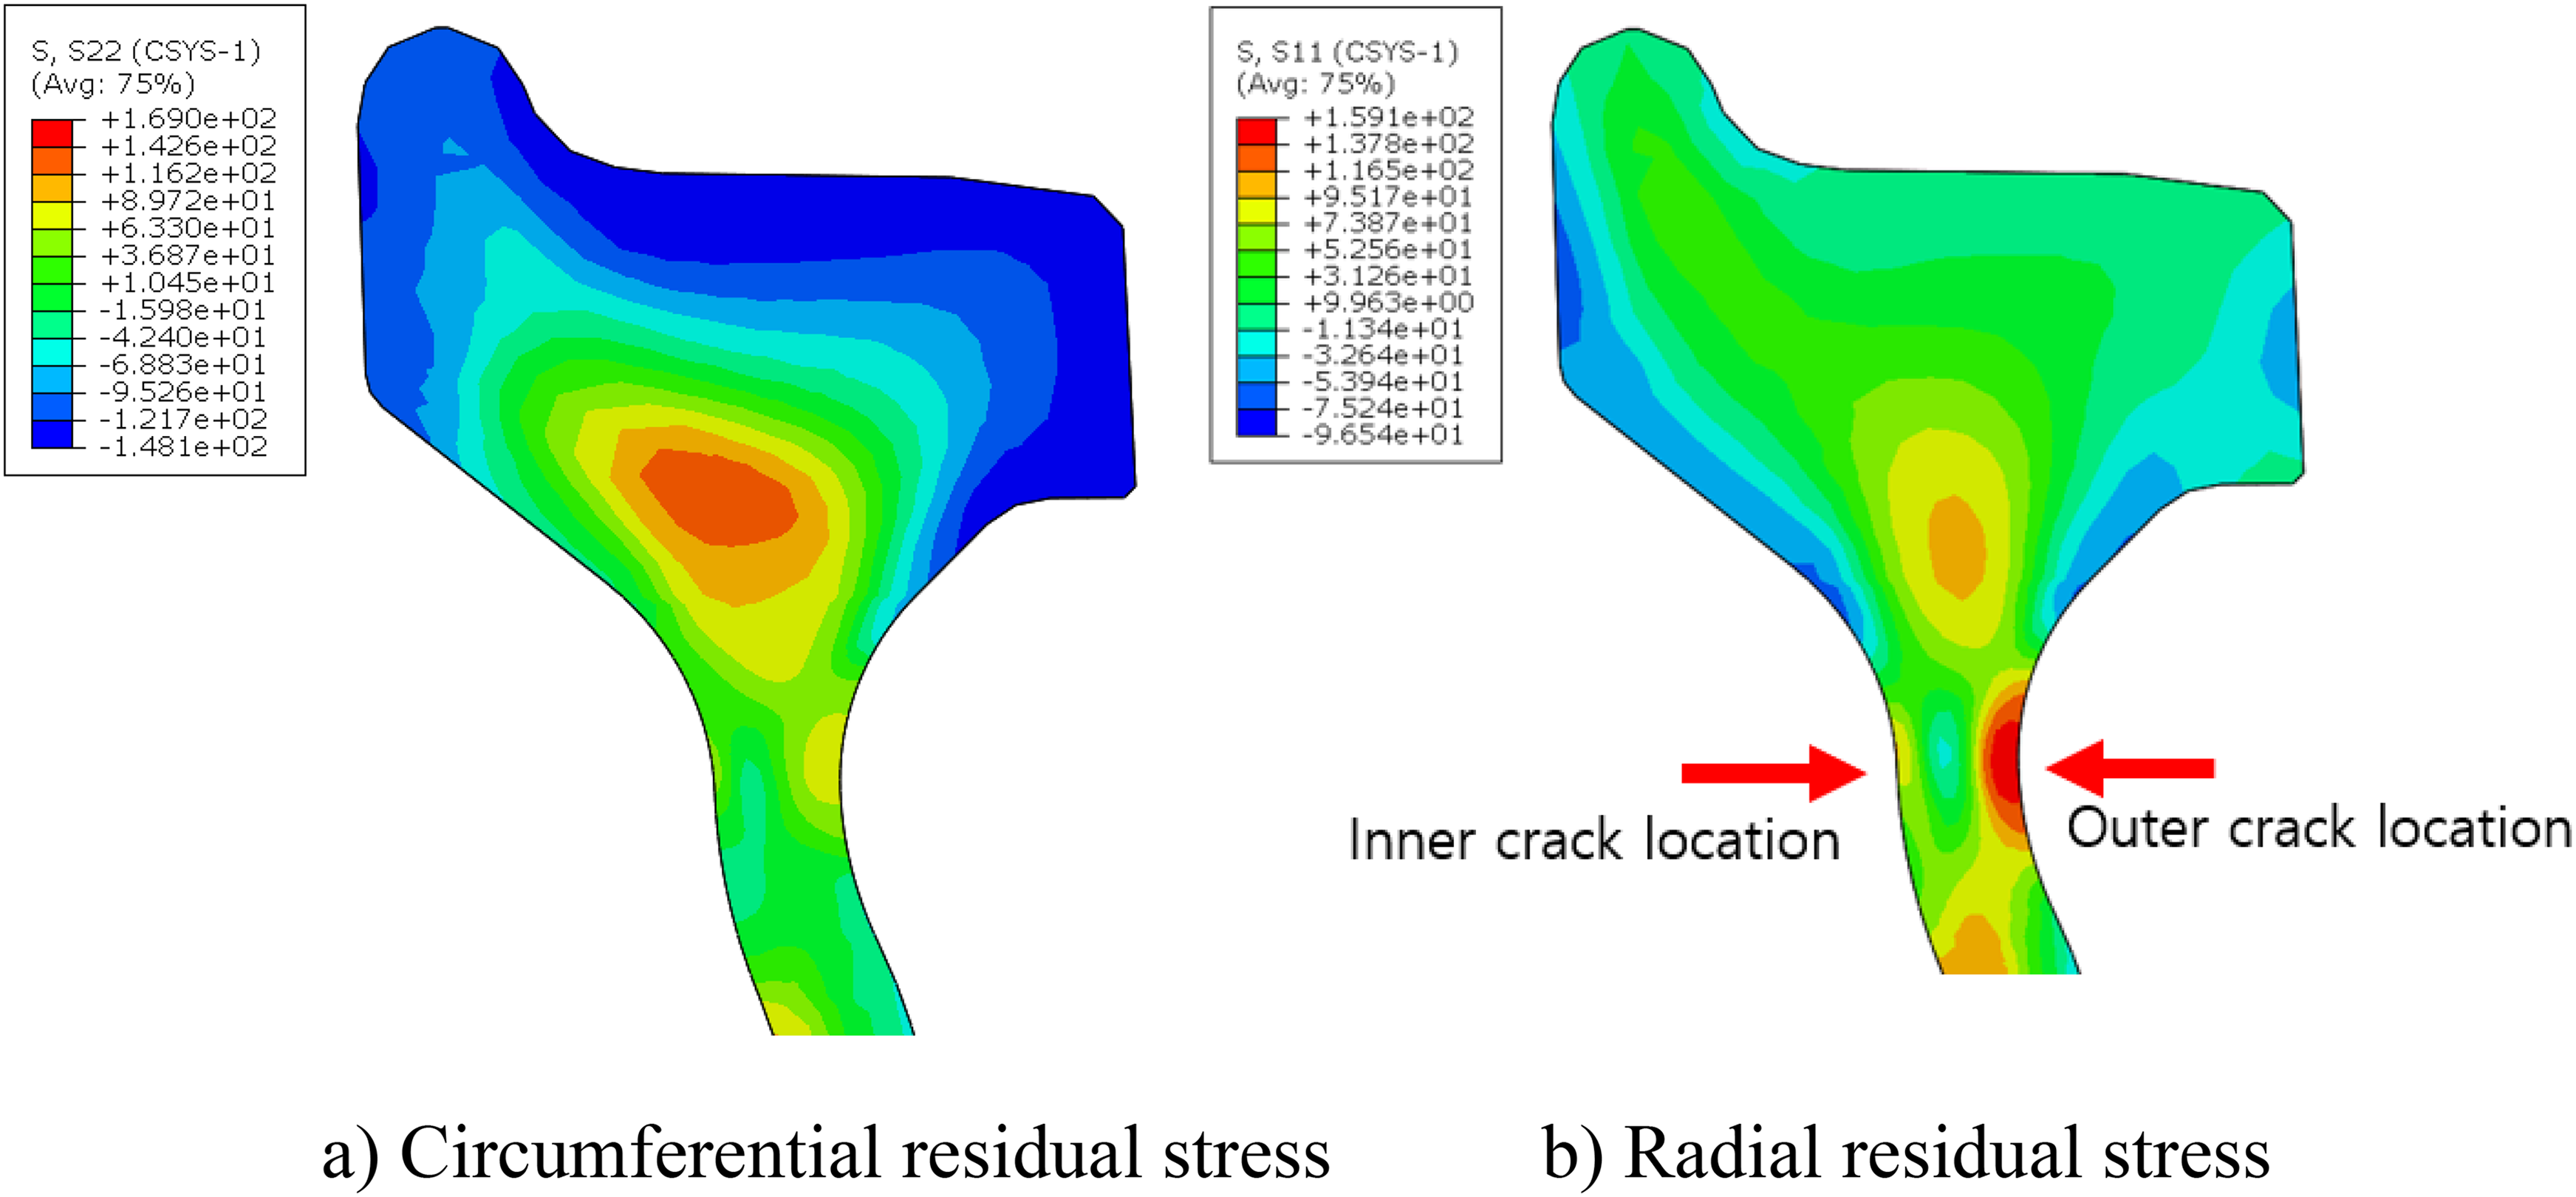
Comparison of residual stress distribution during manufacturing according to stress direction.
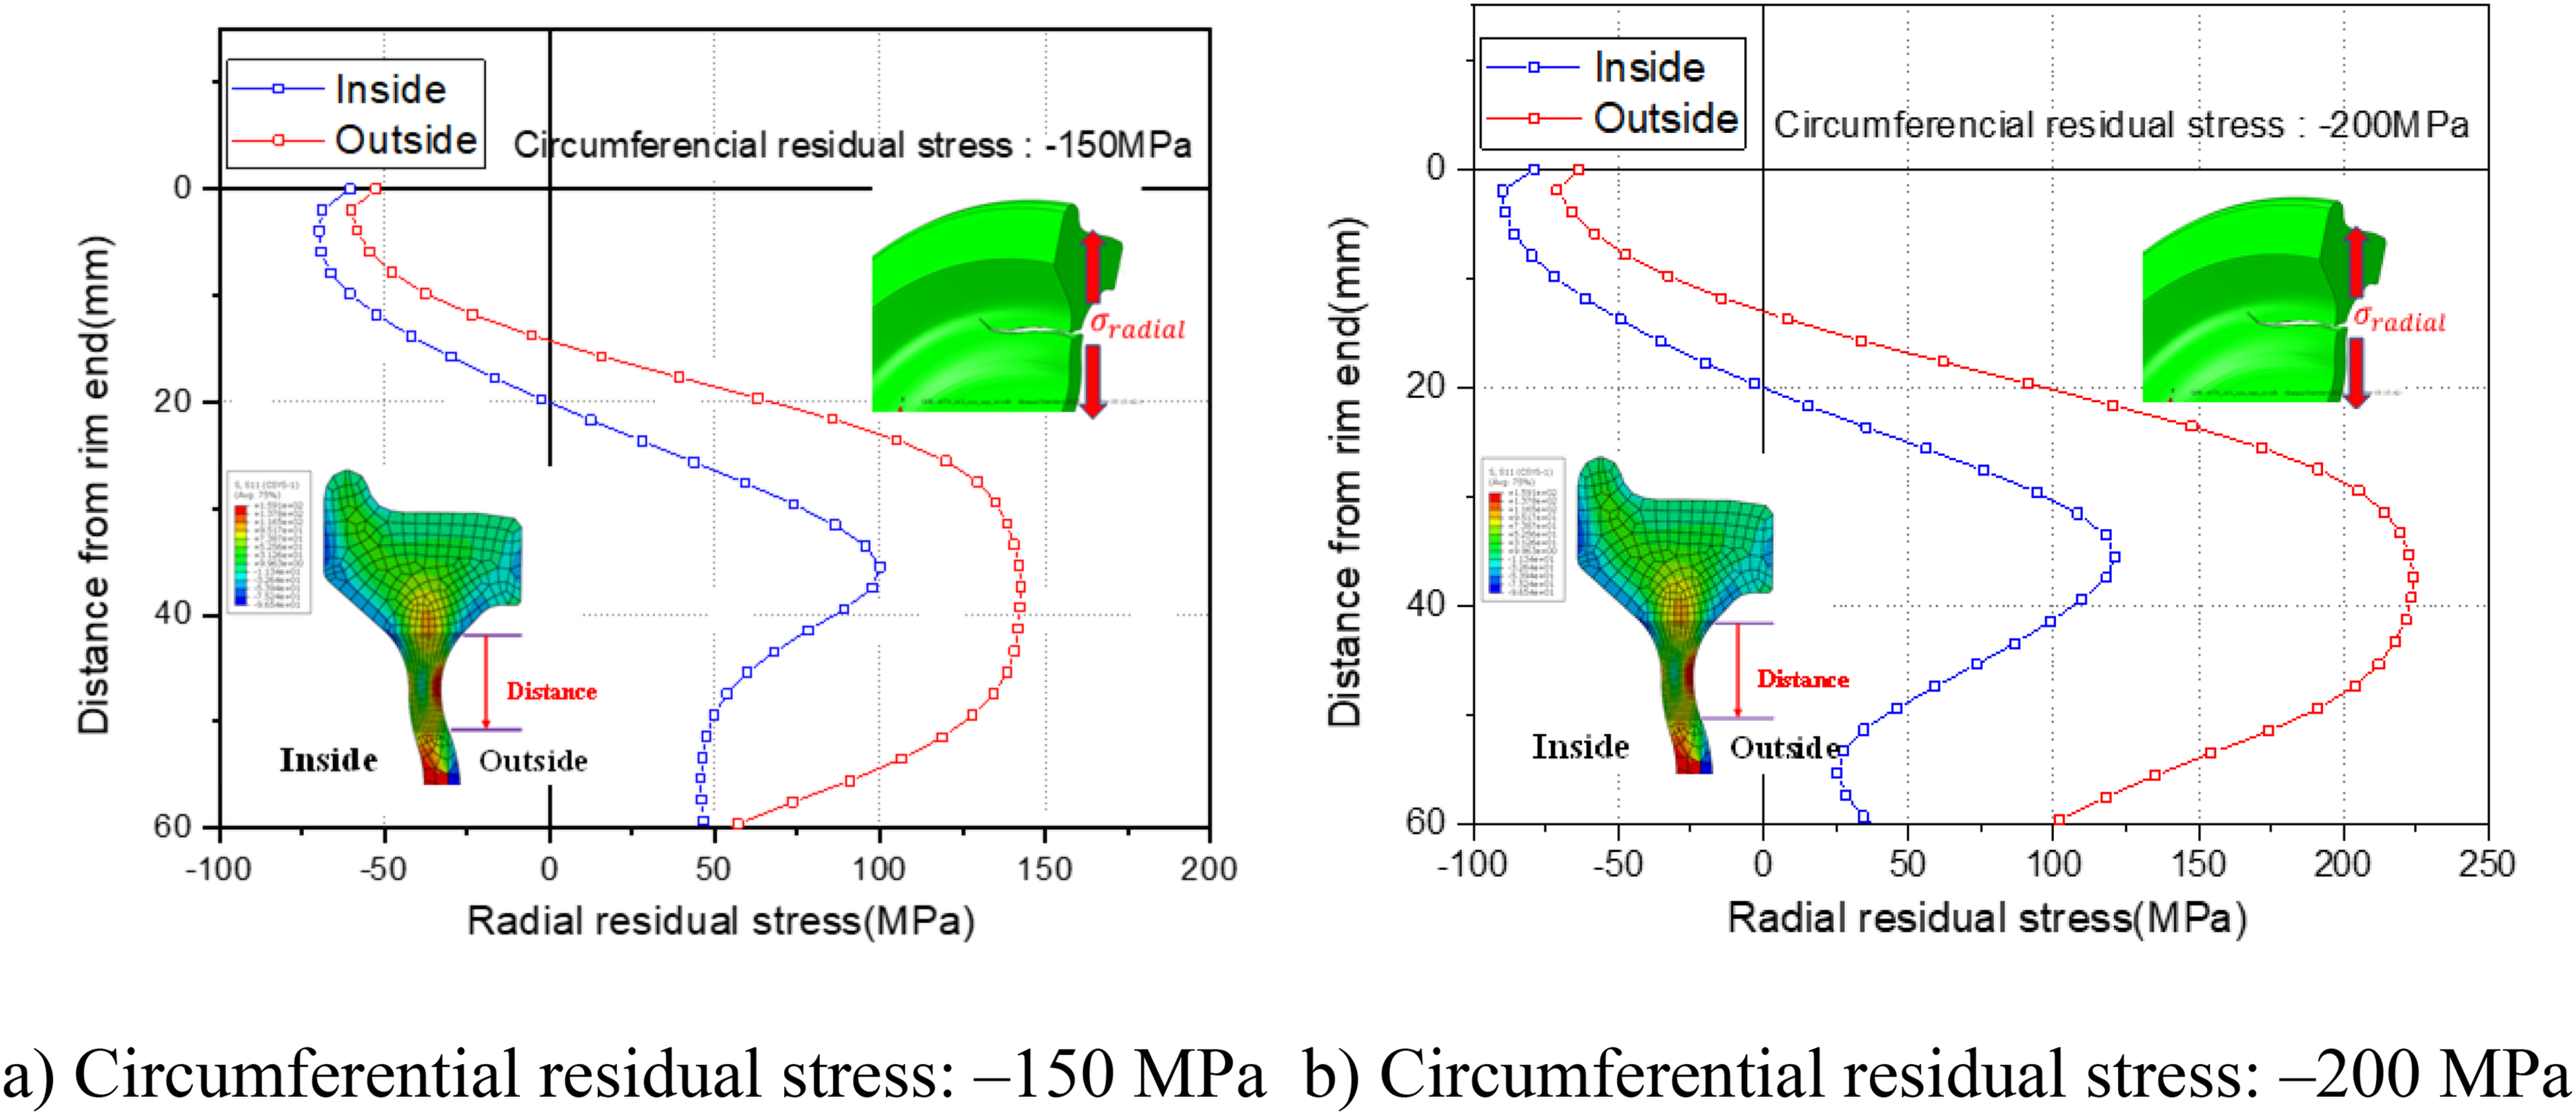
Comparison of radial residual stress at the crack growth location.
Conclusion
In this study, the crack propagation characteristics observed in the web plate of high-speed railway wheels were evaluated, and the following conclusions were drawn.
A crack initiated in the web plate of a high-speed railway wheel and led to the failure of the wheel. The origin of the crack was identified as a defect, such as voids. Consideration of creep effects is essential for accurately evaluating the residual stress in railway wheels using finite element analysis. The simulation results were in good agreement with the residual stress measurements obtained in accordance with EN 13262. The crack propagation behavior in the web plate of a railway wheel was evaluated using the XFEM method. The initial crack was observed to propagate on one side of the plate before transitioning into a through-thickness crack. The residual stress generated during manufacturing causes a significant difference in crack growth rate. Compared to the case that did not consider residual stress, the crack growth rate increased by approximately 5.8 times. Inducing CRS at the wheel–rail contact surface via heat treatment results in the formation of TRS of comparable magnitude in the web plate. Given that TRS strongly influences the crack growth rate in the web plate, careful control of residual stress levels during manufacturing is required.
Footnotes
Acknowledgment
This research was supported by a grant from the R&D Program of the Korea Railroad Research Institute, Republic of Korea
Author contribution(s)
Funding
The authors received no financial support for the research, authorship, and/or publication of this article.
Declaration of conflicting interests
The authors declared no potential conflicts of interest with respect to the research, authorship, and/or publication of this article.