
Abstract
This study investigates the influence of the Synchronous Scanning Strategy on the microstructural characteristics and corrosion behavior components fabricated via the LPBF process. Electrochemical corrosion tests in 3.5 wt.% NaCl solution demonstrates that SSS-fabricated samples, particularly samples, exhibit significantly improved corrosion resistance compared to their traditionally scanned counterparts. These improvements are attributed to the homogeneous microstructure and reduced potential difference between Al and Si phases, which minimizes local galvanic effects. The results establish a clear link between scanning strategy and corrosion resistance, underlining the potential of SSS for optimizing LPBF processes in applications where electrochemical stability is critical.
Introduction
With the constantly evolving market dynamics and shifting demand patterns, the distinct technological advantages offered by additive manufacturing (AM) are increasingly drawing global attention towards shaping future business strategies. Commonly known as 3D printing, AM is a technique that combines materials to create three-dimensional structures. This innovative methodology grants engineers the flexibility to design and produce customized parts that are often impractical to manufacture using traditional methods. Among the various AM techniques, metal-based AM, particularly laser powder bed fusion (LPBF), is the most favored by researchers in both academic and industrial settings.1–3
LPBF technology facilitates the creation of specialized industrial applications for component replacement or part customization. Its unmatched advantages, such as high material and resource efficiency, production flexibility, and enhanced mechanical performance, make it exceptionally well-suited for designing customized biomedical applications, tooling inserts with conformal cooling channels, and functional metallic geometries like lattice structures.4–8 The unique thermal history of AM parts, characterized by high solidification rates (dT/dt: 103–108 K/s), steep thermal gradients (dT/dx: 103–107 K/m), and significant thermal fluctuations during material deposition, leads to the development of critical microstructural features. These include solidification morphology, element segregation, secondary phase precipitation, grain formation, crystallographic texture, and defects, all of which can affect the mechanical and electrochemical properties of AM components.9,10 Consequently, controlling AM processing conditions is essential to achieving a desirable electrochemical response in additive components.
AlSi10Mg is a widely used alloy in selective laser melting (SLM) processes, prized for its rapid solidification rate and high yield strength, which is notably superior to that of its cast form.11–14 The alloy achieves a yield strength of around 300MPa, attributed to its microstructure, which features a network of α-Al (FCC)/Si eutectic within the inter-dendritic regions of a supersaturated α-Al matrix.15–17 There are several studies on its corrosion performance; for instance, 18 reported reduced Si-Mg segregation in LPBF AlSi10Mg alloy, leading to improved corrosion resistance in a 0.1M NaCl solution. Similarly, 19 noted fewer Fe-Mn segregations in LPBF AlSi10Mg samples exposed to a 3.5wt.% NaCl solution. High Si-Mg or Fe-Mn segregations can create multiple local galvanic cells, resulting in an increased corrosion rate. Analyzing the finer-grain microstructure of AlSi10Mg20,21 found a smaller potential difference between Al and Si phases in LPBF samples.
Furthermore, the impact of processing parameters on LPBF samples significantly affects the corrosion behavior of Al alloys. For example, 22 observed enhanced corrosion resistance in LPBF AlSi10Mg samples in a 3.5 wt.% NaCl solution when prepared at higher laser energy densities. This improvement is due to the reduced surface roughness achieved by forming cyclic small-large melt-pool structures. The refined microstructure produced under optimal LPBF laser processing conditions results in a smaller potential difference between Al and Si phases, thereby decreasing the alloy's susceptibility to pitting and selective corrosion attacks. 23 In a comparison of the corrosion behavior of the two planes of SLM AlSi10Mg in a 3.5 wt.% NaCl solution 24 found that the horizontal plane exhibited inferior corrosion resistance due to the cracking of deep Si shells by corrosion products, a phenomenon not observed in the vertical planes. Additionally, 25 noted that surface modification through mechanical post-processing treatments such as shot-peening or mechanical polishing can increase the pitting potential and reduce the corrosion rate.
This research focuses on the corrosion behavior in production using AM- Laser Powder Bed Fusion and AlSi10Mg synchronous scanning strategy (Figure 1). The novelty of the research is the investigation of corrosion resistance in products made with SSS and AlSi10Mg. This scope, which has not been addressed before, constitutes the third stage of a series of process parameter studies obtained with some previous research results on SSS and changing the material properties.
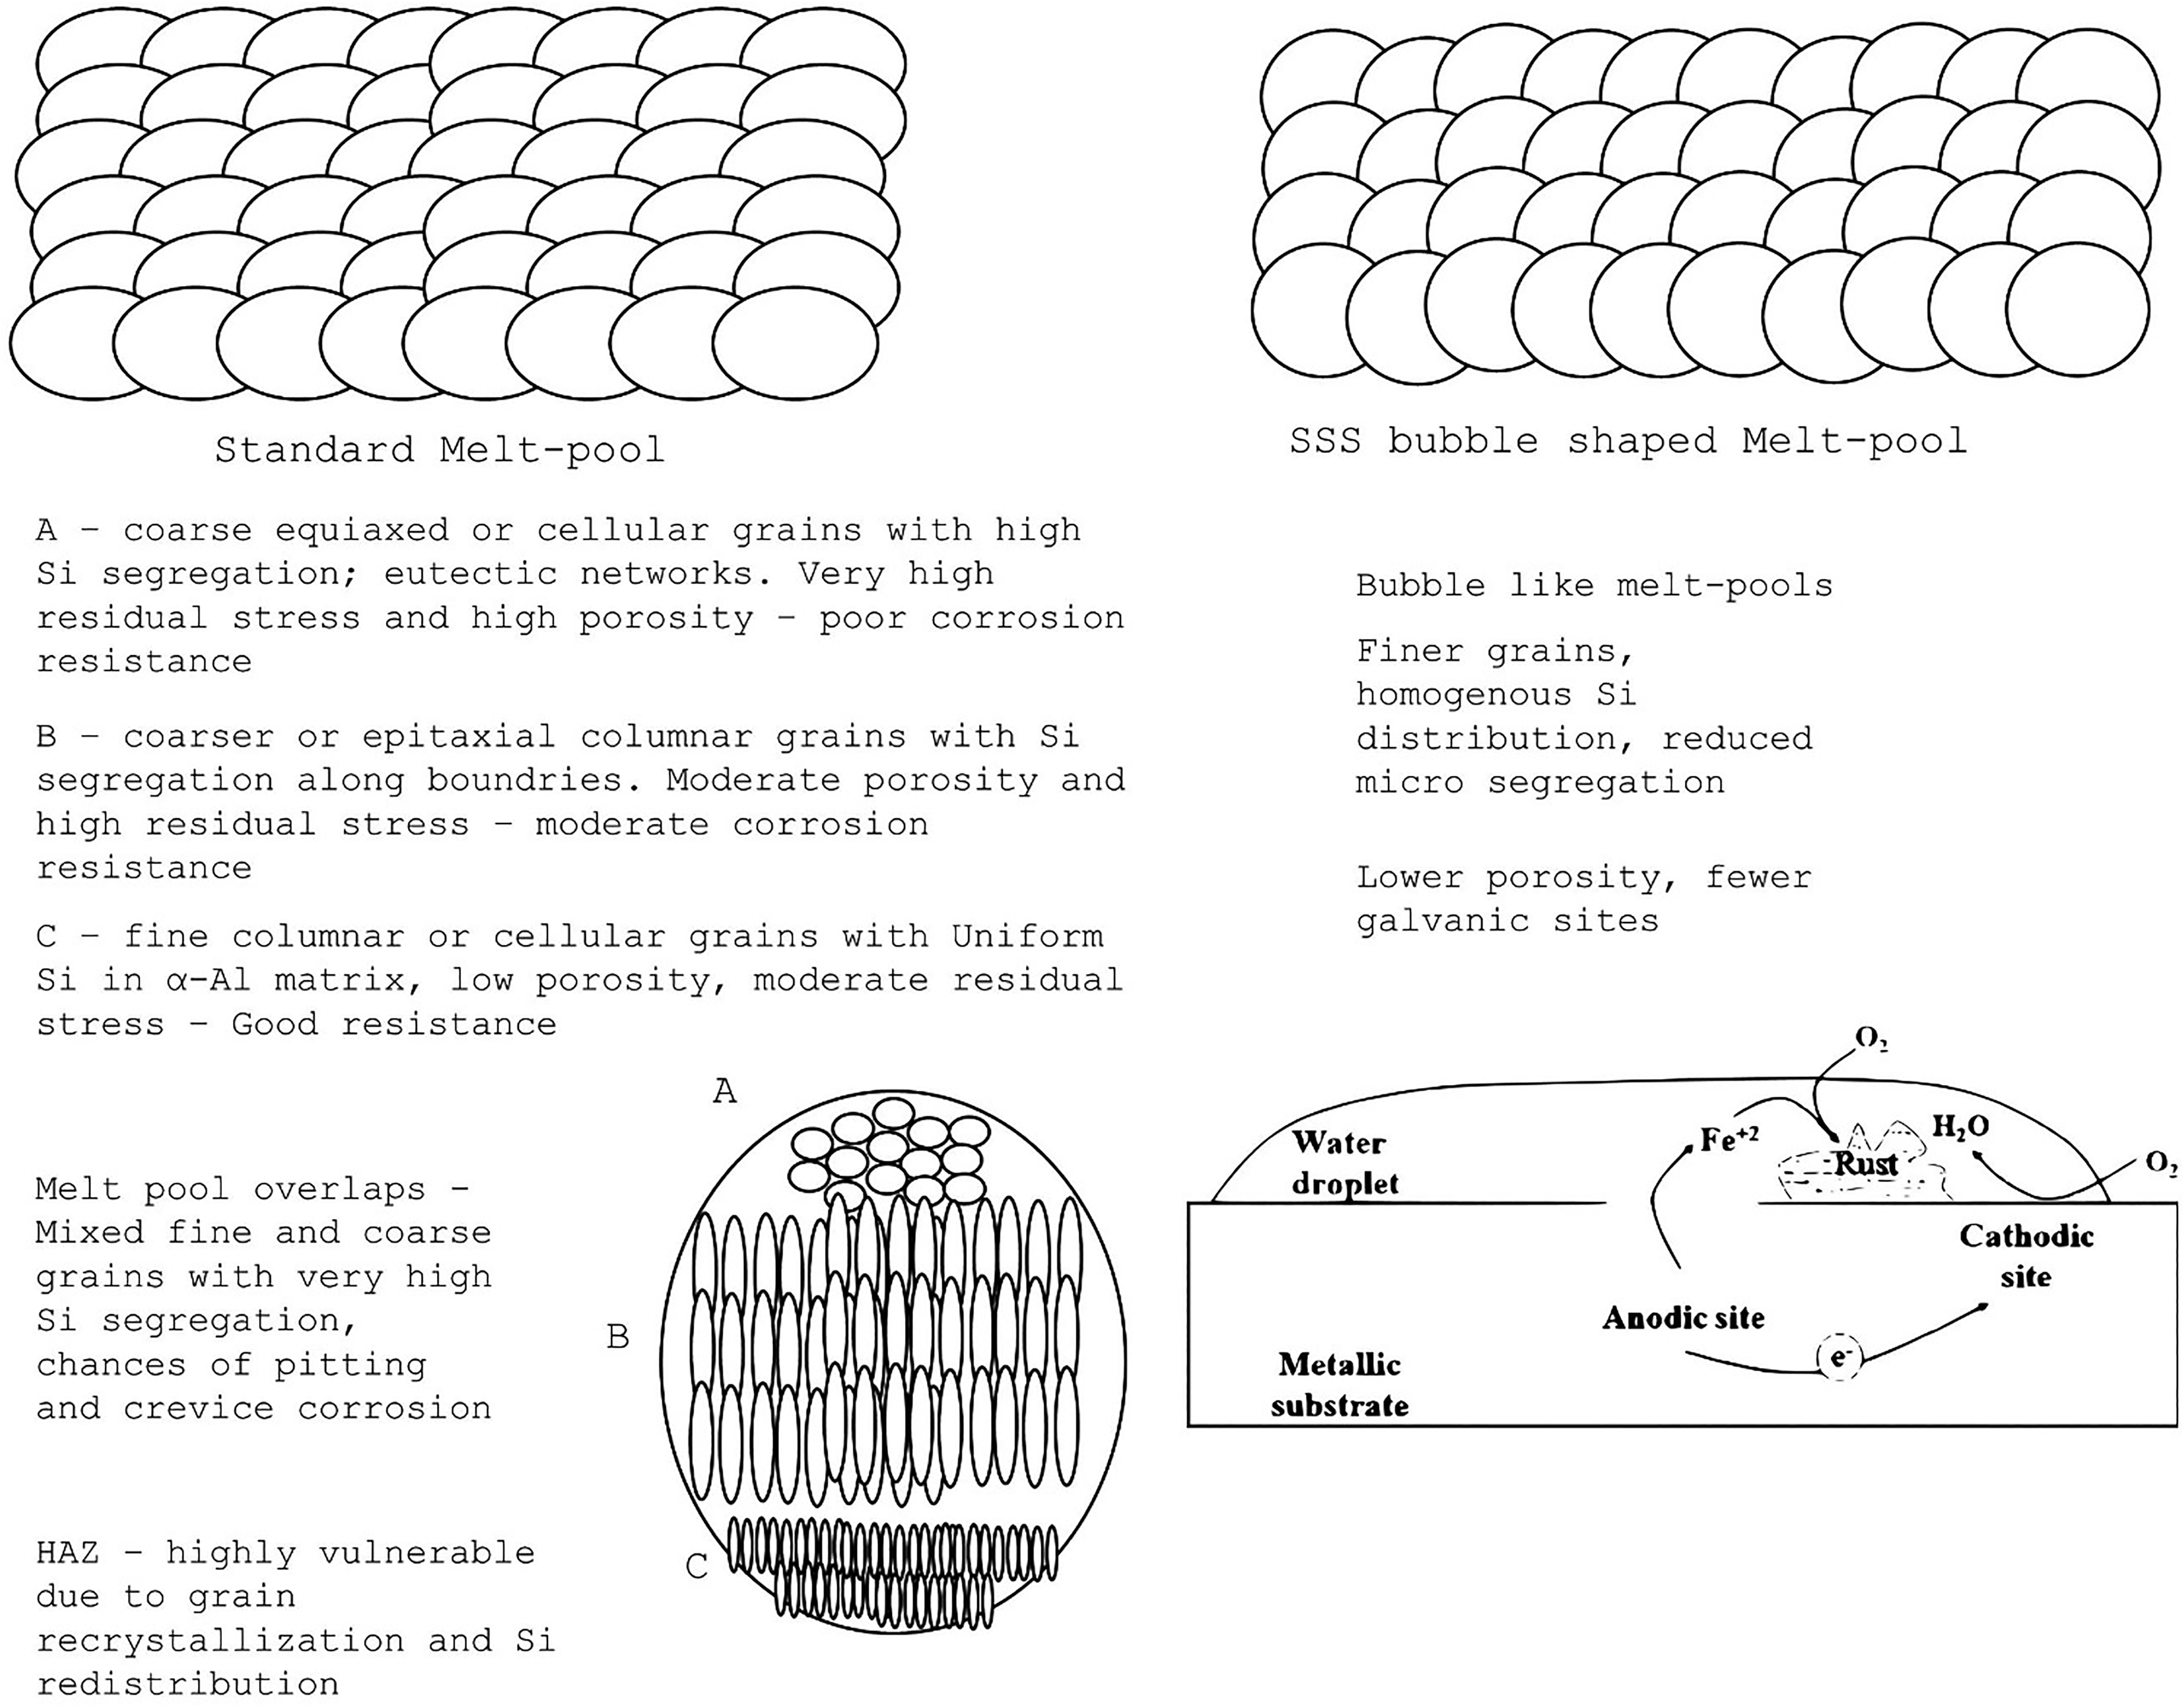
Corrosion process chart.
In the light of previous studies in the literature, the following can be stated about SSS: The concept of SSS refers to the synchronized use of LPBF process parameters. In this context, it is created by changing the layer thickness, hatch distance, and strip width parameters simultaneously. It is the subject of a study conducted within the scope of industrial gears where mechanical strength is increased by 25% in LPBF productions where SSS is applied. 26
In the study, it is stated that the lightweight gear forms produced with SSS provide higher strength with less material usage. In this study, the formation strategy of SSS in terms of material science, which was revealed by LPBF process parameter optimization studies, was not fully included, and it was stated that this scope could be addressed in future studies. 26 In this context, a second study can be mentioned in which the new microstructure formed by SSS is defined 27 : In the mentioned research, the conditions under which this new microstructure, defined as “bubble structure,” is formed are revealed in detail with metallographic tests. According to this study, the microform called SSS and found with the synchronized scanning strategy in the AM process parameters. The scanning strategy, defined as SSS, refers to the production strategy realized by equalizing the hatch distance, strip width, and layer thickness parameters and using the same value. In the two studies mentioned above, SSS, which provides the formation of the new microstructure defined as “bubble structure”, offers advantages such as increasing mechanical strength and weight optimization in industrial areas, and therefore, to address the corrosion behavior in case of its use, in the first stage of this research, the microstructure research was primarily given in detail in the sample productions carried out with LPBF. After the examinations where the bubble structure in similar forms to the previous studies was observed, a series of laboratory research was carried out within the scope of corrosion behavior. The obtained data and graphics are given in the results section. The main motivation of the research is to conduct a comprehensive investigation into whether this new microstructure, defined as the “bubble structure” obtained by producing with SSS and revealed by previous studies, provides a 25% increase in mechanical strength in the productions where it is used, and whether it brings an advantage or disadvantage in terms of corrosion resistance.
This study is motivated by the growing demand for corrosion-resistant, lightweight components in defense applications such as naval vessels, unmanned aerial vehicles (UAVs), and portable battlefield equipment. Components used in these applications are frequently exposed to aggressive saline or humid environments, where traditional materials degrade rapidly and compromise mission reliability. Additive manufacturing using the LPBF technique offers the design freedom and weight-saving advantages required for such applications; however, its effectiveness is often limited by microstructural defects and suboptimal corrosion resistance, particularly in AlSi10Mg alloys. To address this issue, we explore the influence of an SSS on the microstructural integrity and corrosion behavior of LPBF-fabricated AlSi10Mg parts. The scope of this work includes a detailed investigation of melt pool morphology, eutectic structure evolution, and corrosion resistance in 3.5wt.% NaCl solution. The results demonstrate that SSS leads to a unique, bubble-shaped melt pool geometry and a finer, more homogeneous Al–Si eutectic network, thereby significantly enhancing corrosion performance. By establishing a clear relationship between scan strategy and electrochemical behavior, this study provides actionable insights for the development of more durable, application-ready components for critical defense and marine systems.
Materials and methods
The EOS M290 3D printing system was used to produce AlSi10Mg corrosion samples. AlSi10Mg is a widely used material in LPBF technologies. Its microstructure is characterized by α-Al (FCC)/Si eutectic network within dendritic domains of supersaturated α-Al matrix. 28 The chemical composition of the powder is given in Table 1.
Chemical composition of AlSi10Mg powder (wt %). 29

In this study, several test samples were created using the LPBF production system. These samples were characterized by two different microstructural and layer thickness conditions, as described in Table 2. After the LPBF production, test samples were then prepared for corrosion testing.
Four definitions are used in the corrosion research.

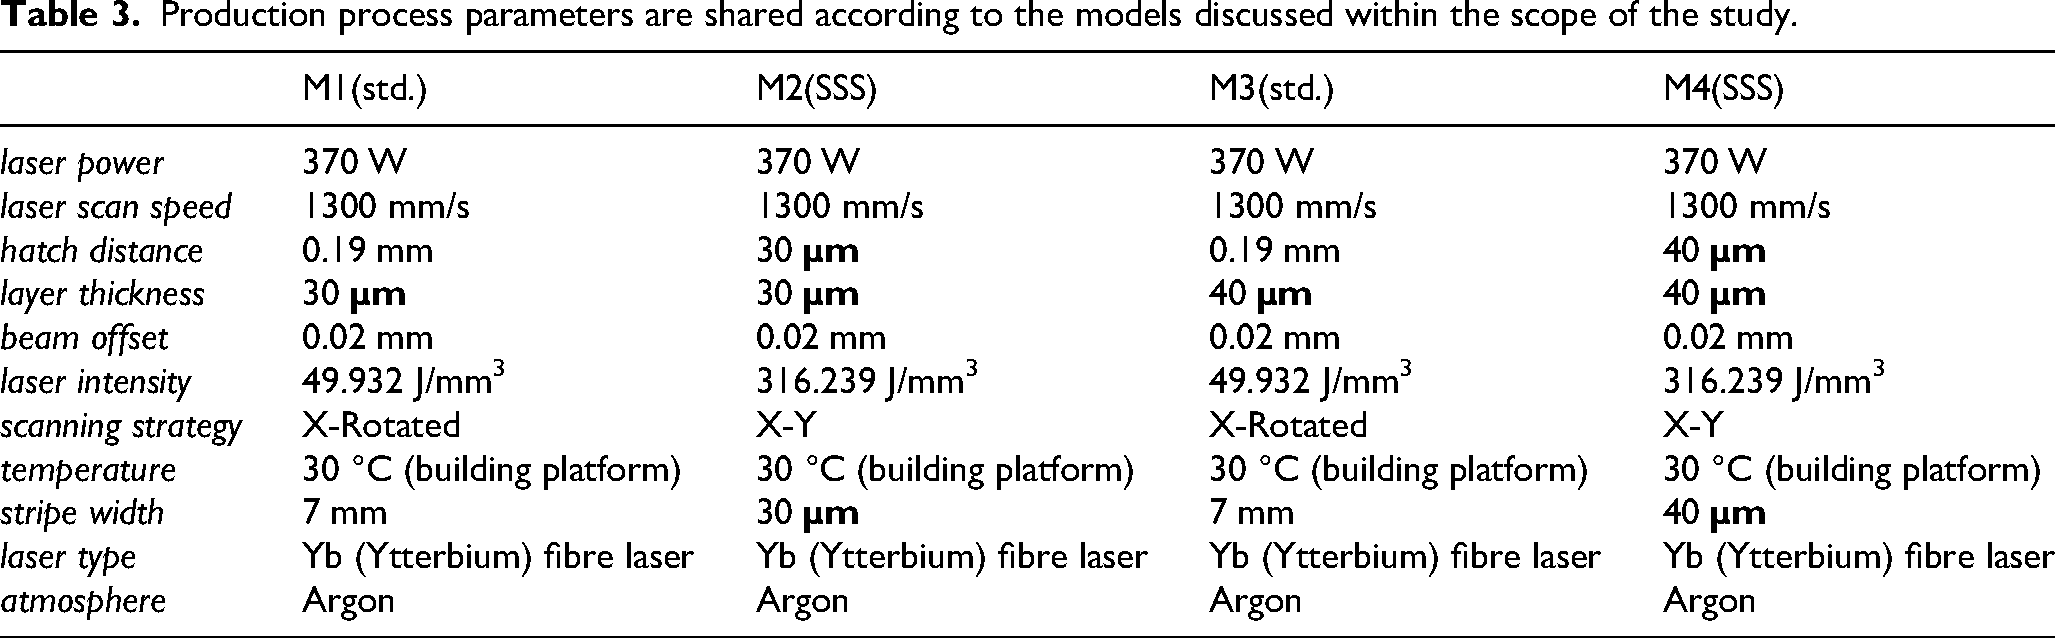
In this study, the standard laser processing parameters and SSS process parameters recommended by the EOS LPBF machine manufacturer were used. As shown in Table 2, sample M1 is prepared using standard laser processing parameters. M1 refers to the standard laser processing parameters for AlSi10Mg material with a layer thickness of 30 µm in several previous studies.30,31 M2, on the other hand, refers to the LPBF production using a special laser scanning strategy, called SSS. M2 samples were prepared with a layer thickness of 30 µm. 26 Additionally, samples M3 and M4 represent samples M1 and M2, respectively, albeit at a layer thickness of 40 µm. 27 The laser processing parameters used in the production of test samples are given in Table 3.
Production process parameters are shared according to the models discussed within the scope of the study.
The samples were prepared according to the standard metallographic sample preparation procedure and then etched with Keller (96.22% water, 2.59% nitric acid, 0.64% hydrochloric acid, and 0.55% hydrofluoric acid) for varying times. Optical microstructure images were taken with Zeiss Axio Lab. A1 light metal microscope. Scanning electron microscope (SEM) investigations were performed with Hitachi SU3500 T2. The Oxford XACT device carried out Electron Dispersion X-ray Spectroscopy (EDX) analysis. Hardness measurement was conducted using the Microvickers (HV) measurement method with a Shimadzu G21D device, a test load of 20 g, and an indentation time of 10 s. For phase identification, X-ray diffraction (XRD) measurements were made with a step size of 0.0131° across 2θ positions between 20 and 90°. The operating conditions for the Malvern Panalytical Emp3 model X-ray diffractometer with Cu-kα radiation (λ = 1.541874 Å) were 45 kV and 40 mA.
The sample surfaces were first polished to examine the samples’ corrosion behavior. Following these procedures, the area exposed to the solution on the sample surface during the corrosion test was determined as 1 cm2. A three-electrode cell system was used for the electrochemical study in corrosion experiments. Here, the Ag/AgCl electrode (SCE) was used as the reference electrode, the platinum wire was used as the counter electrode, and test samples were prepared as the anode. Electrochemical tests were performed in 3.5% NaCl solution at room temperature. After immersing the prepared samples in three-electrode cells, they waited for the open circuit potential (EOCP) to stabilize without applying any current. Subsequently, potentiodynamic polarization curves were obtained using an IVIUM Vertex EIS 1A/10 V potentiostat device. The scanning was conducted at a rate of 0.1 mV/s, within a range of EOCP ± 200 mV.
Results and discussion
Microstructure and phase analysis
Figure 2 depicts the samples’ microstructures as seen along the scanning direction, while Figure 3 shows the microstructures from a viewpoint perpendicular to the scanning direction. Figures 2 and 3 showcase the distinct differences in microstructures resulting from standard and innovative scanning techniques across different laser parametric settings.

Microstructure of samples a) m1, b) m2, c) m3, and d) m4 perpendicular to the scanning direction.

Microstructure of samples a) m1, b) m2, c) m3, and d) m4 parallel to the scanning direction.
In Figures 2 and 3, sample m1 and m3 exhibit the conventional melt pool shape, created with standard parameters at a 30 µm layer thickness. OM images of samples m1 and m3 show track overlaps with melt-pool widths ranging from 90 to 110 μm, aligning with the study's 100 μm laser spot size. The track edges feature columnar dendrites, transitioning to fine equiaxed grains towards the melt-pool's center, as confirmed by SEM in Figure 4(a) and (c). Differing from the horizontal view, the vertical cross-section reveals fish-scale-like melt-pools (seen in Figure 3(a) and (c)), with long columnar grains at the periphery and equiaxed grains centrally. The vertical plane's columnar grains are larger compared to the horizontal due to a sharper temperature gradient and slower cooling rates.
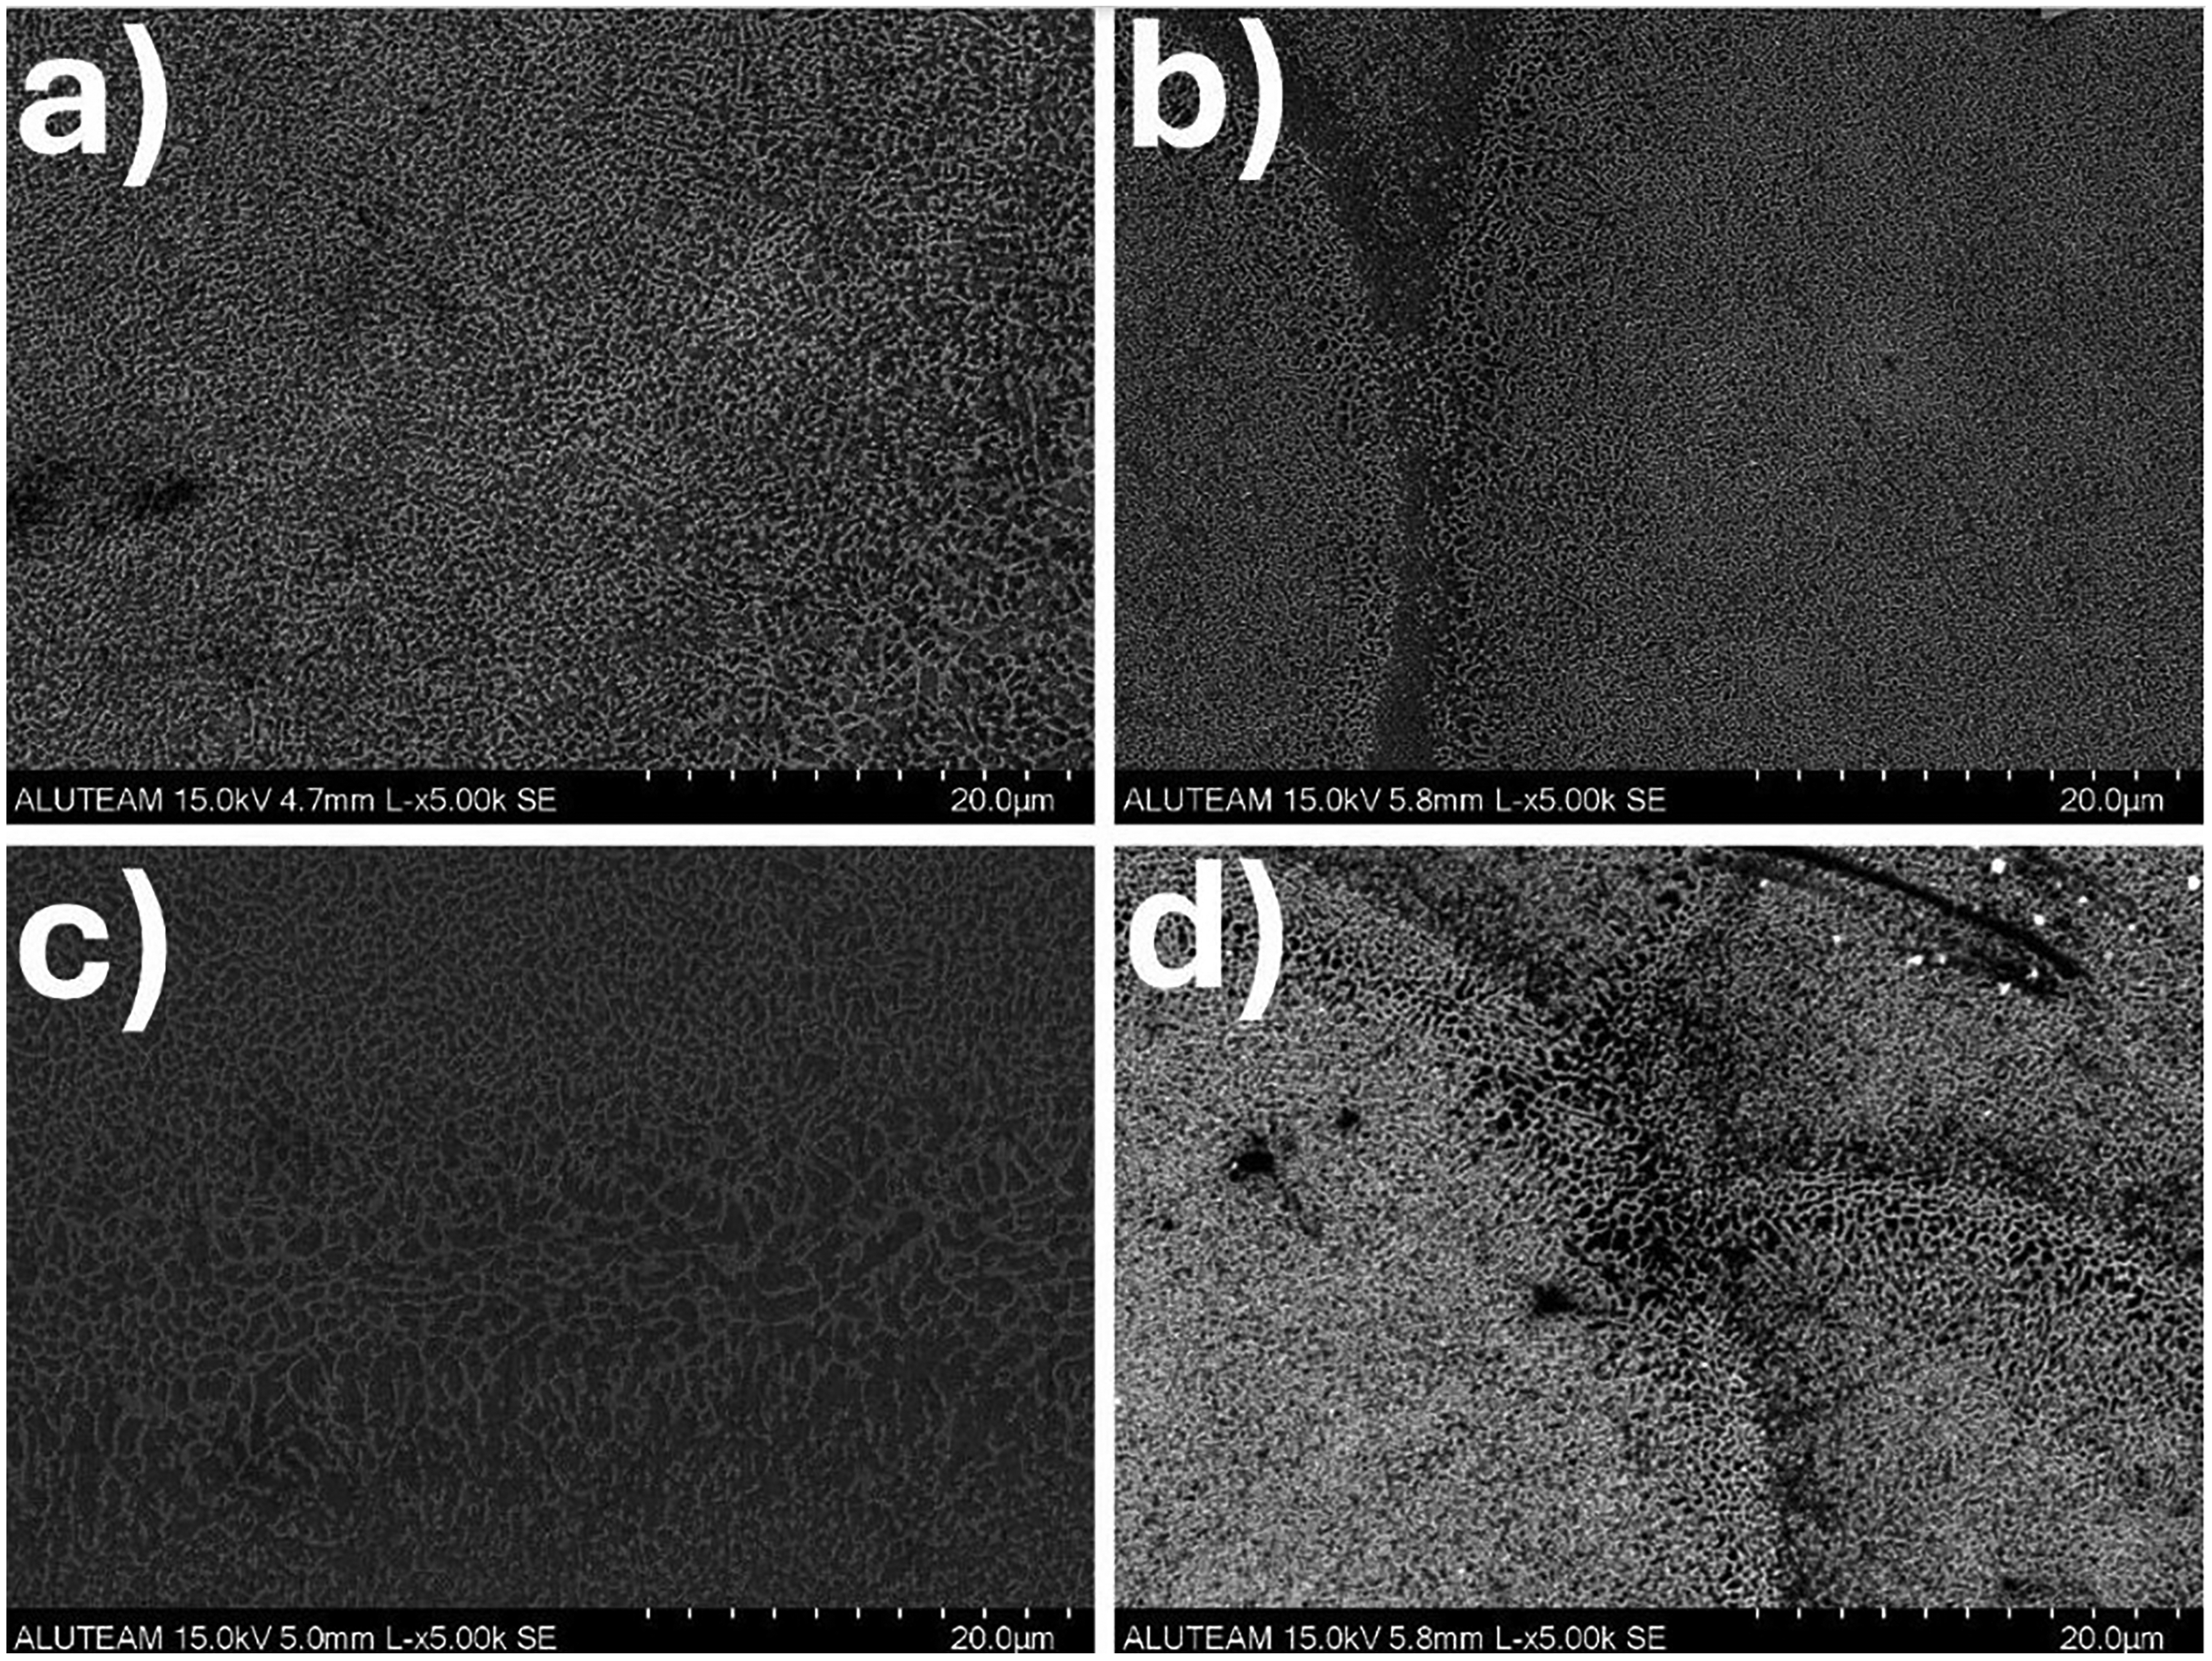
SEM micrographs of samples a) m1, b) m2, c) m3, and d) m4 parallel to the scanning plane.
On the other hand, Figure 2(b) and 3(b) reveal the unique 30 µm bubble structure in samples m2 and m4, demonstrating the impact of the synchronous scanning strategy (SSS). Compared to samples prepared at standard laser settings, SSS samples (m2 and m4) demonstrated smaller melt-pool configurations, as observed on both scanning and vertical planes. Furthermore, Figure 2(c) depicts the usual microstructure form in sample m3, produced with a 40 µm standard parameter set, which preserves the typical melt pool shape but with a thicker layer. Finally, Figure 2(d) shows sample m4's 40 µm bubble structure.
Figure 5 showcases an enlarged view of the microstructure in SSS-treated samples (m2 and m4), referred to as bubble microstructure. The microstructural design in SSS samples distinctly differs from conventional ones, exhibiting a round shape as opposed to the elongated form seen in traditional samples. The scanning tracks present in as-built structures are absent, replaced by a microstructure that mimics spherical bubbles. Moreover, the SSS creates a melt pool microstructure that is narrower and less extensive than that of the as-built structure, leading to a greater frequency of grain boundaries within the bubble microstructure.
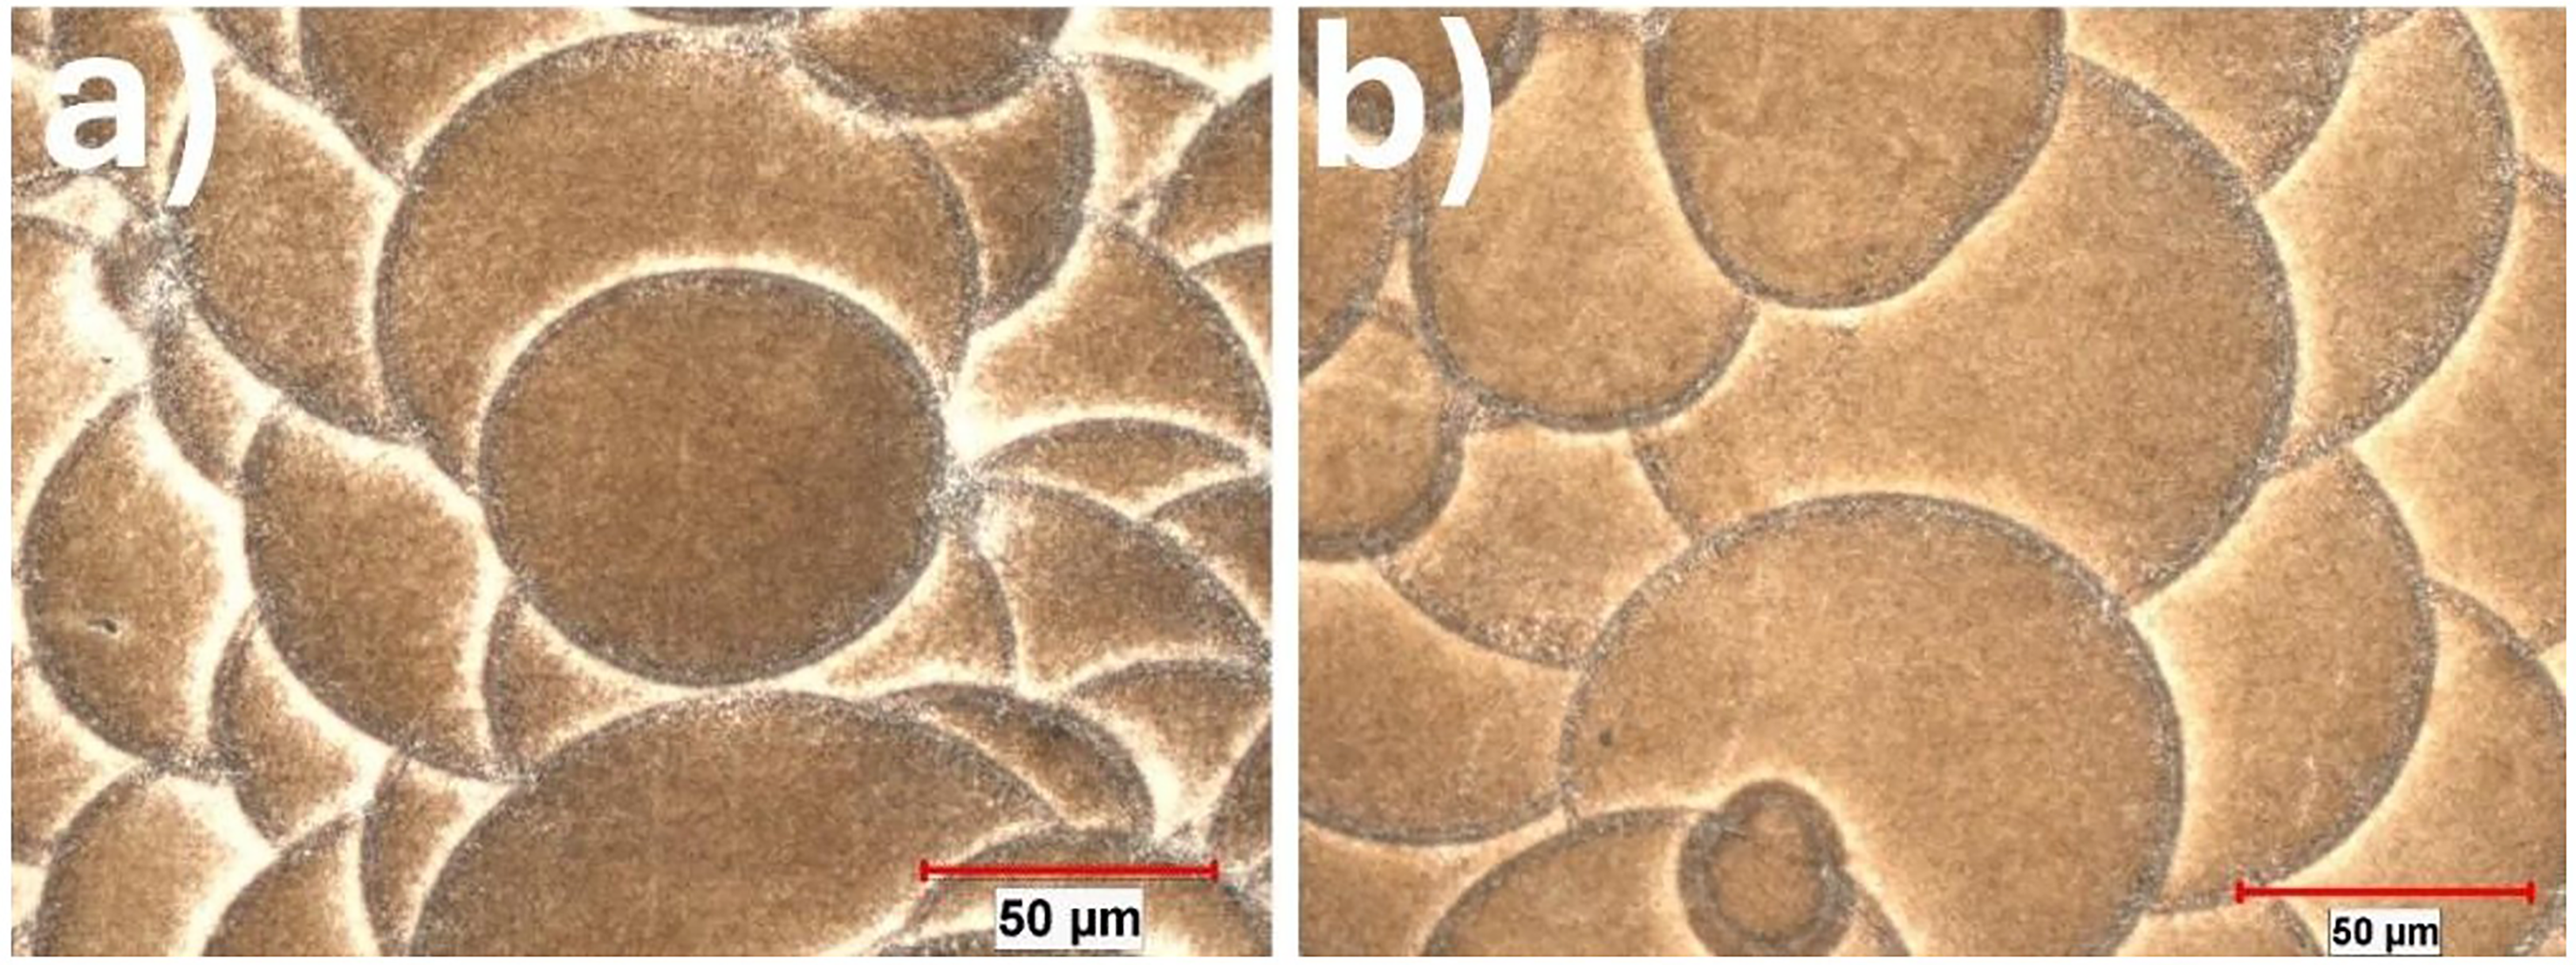
Magnified microstructural images of samples a) m2 and b) m4 parallel to the scanning direction.
To scrutinize the microstructural characteristics in greater detail, SEM was utilized for an in-depth analysis of the samples, as depicted in Figure 4. The SEM imagery reveals a eutectic Si network uniformly distributed within the as-built microstructure, corroborating findings from several prior studies.2,32 A closer look at the AlSi10Mg samples, specifically m2 and m4, unveils a unique spherical microstructure not previously reported. While the bubble structure shares similarities with known microstructures, its network is interrupted at the bubble grain boundaries, where a depletion of atoms is noticeable.
EDX spectroscopy analysis of the samples, focusing on the melt pool's edge areas within the bubble structure, showed an absence of the usual cellular silicon structure within the matrix between the bubbles. Additionally, as Figure 6 illustrates, these inter-bubble zones exhibited a silicon deficit, indicating a notable shift in chemical composition within the microenvironment of the bubble structure compared to conventional microstructures. The EDX examination of these silicon-depleted areas verified the breakdown of the Si network and a reduction in silicon content.
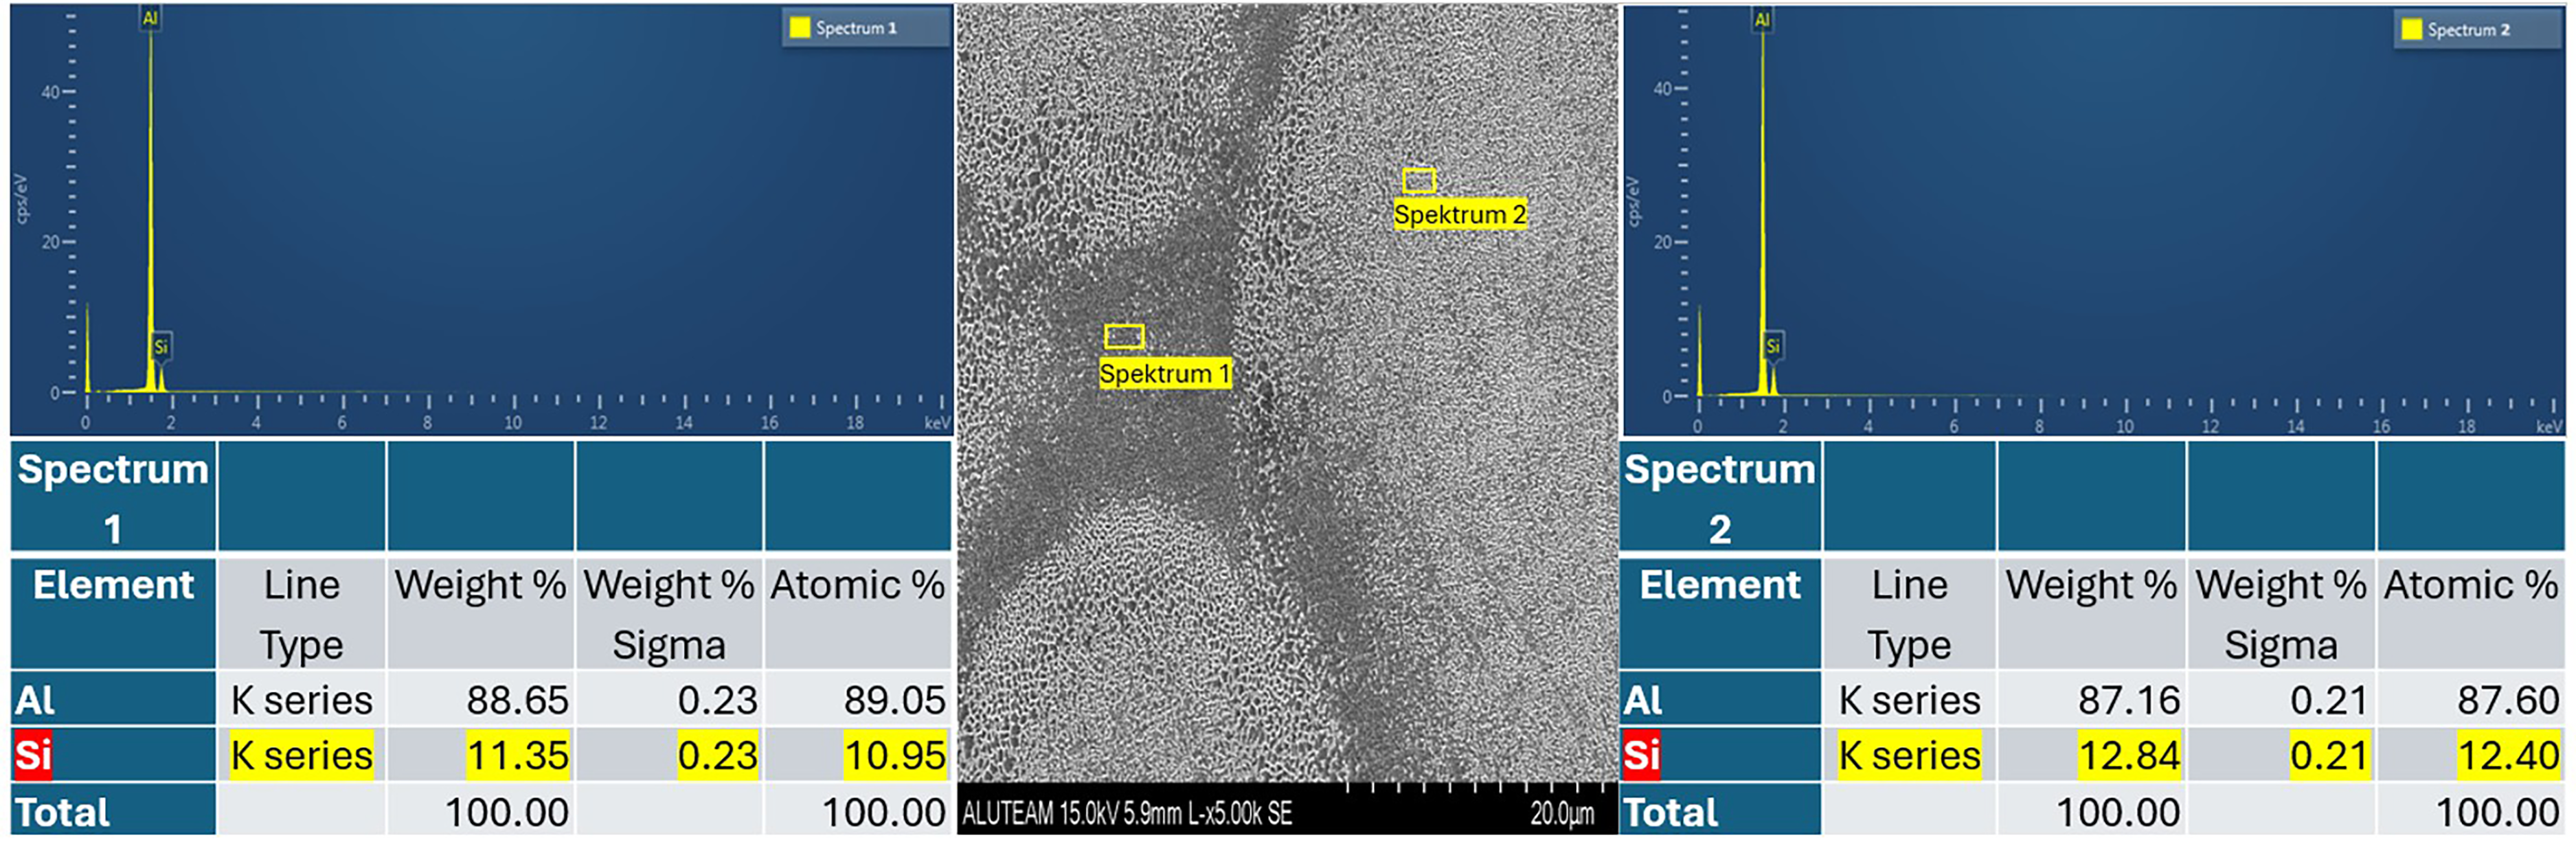
EDX analysis of bubble microstructure, grain boundary (Spectrum 1) region, and grain interior (Spectrum 2).
The adoption of the SSS scanning pattern in this research led to scanning spots undergoing optimal heating and cooling cycles, resulting in the formation of smaller melt-pools compared to the traditionally wider oval or fish-scale-like microstructures. This quick cooling process not only enhances grain refinement within the matrix but also boosts Si solubility. SEM-EDX analysis confirmed increased Si solubility in samples exhibiting a bubble microstructure. Additionally, X-ray diffraction (XRD) tests were conducted to investigate the Si peaks in the fabricated samples. The XRD results, as shown in Figure 7, revealed clear Al and Si peaks without any precipitate traces. Mg2Si was absent in the XRD peak patterns, which aligns with observations made in earlier research on LPBF samples.33–35 However, a notable shift in Si peak intensities was observed, particularly in the 30-μm bubble sample (m2), indicating a higher solubility of silicon within the aluminum matrix, especially around the bubble regions.
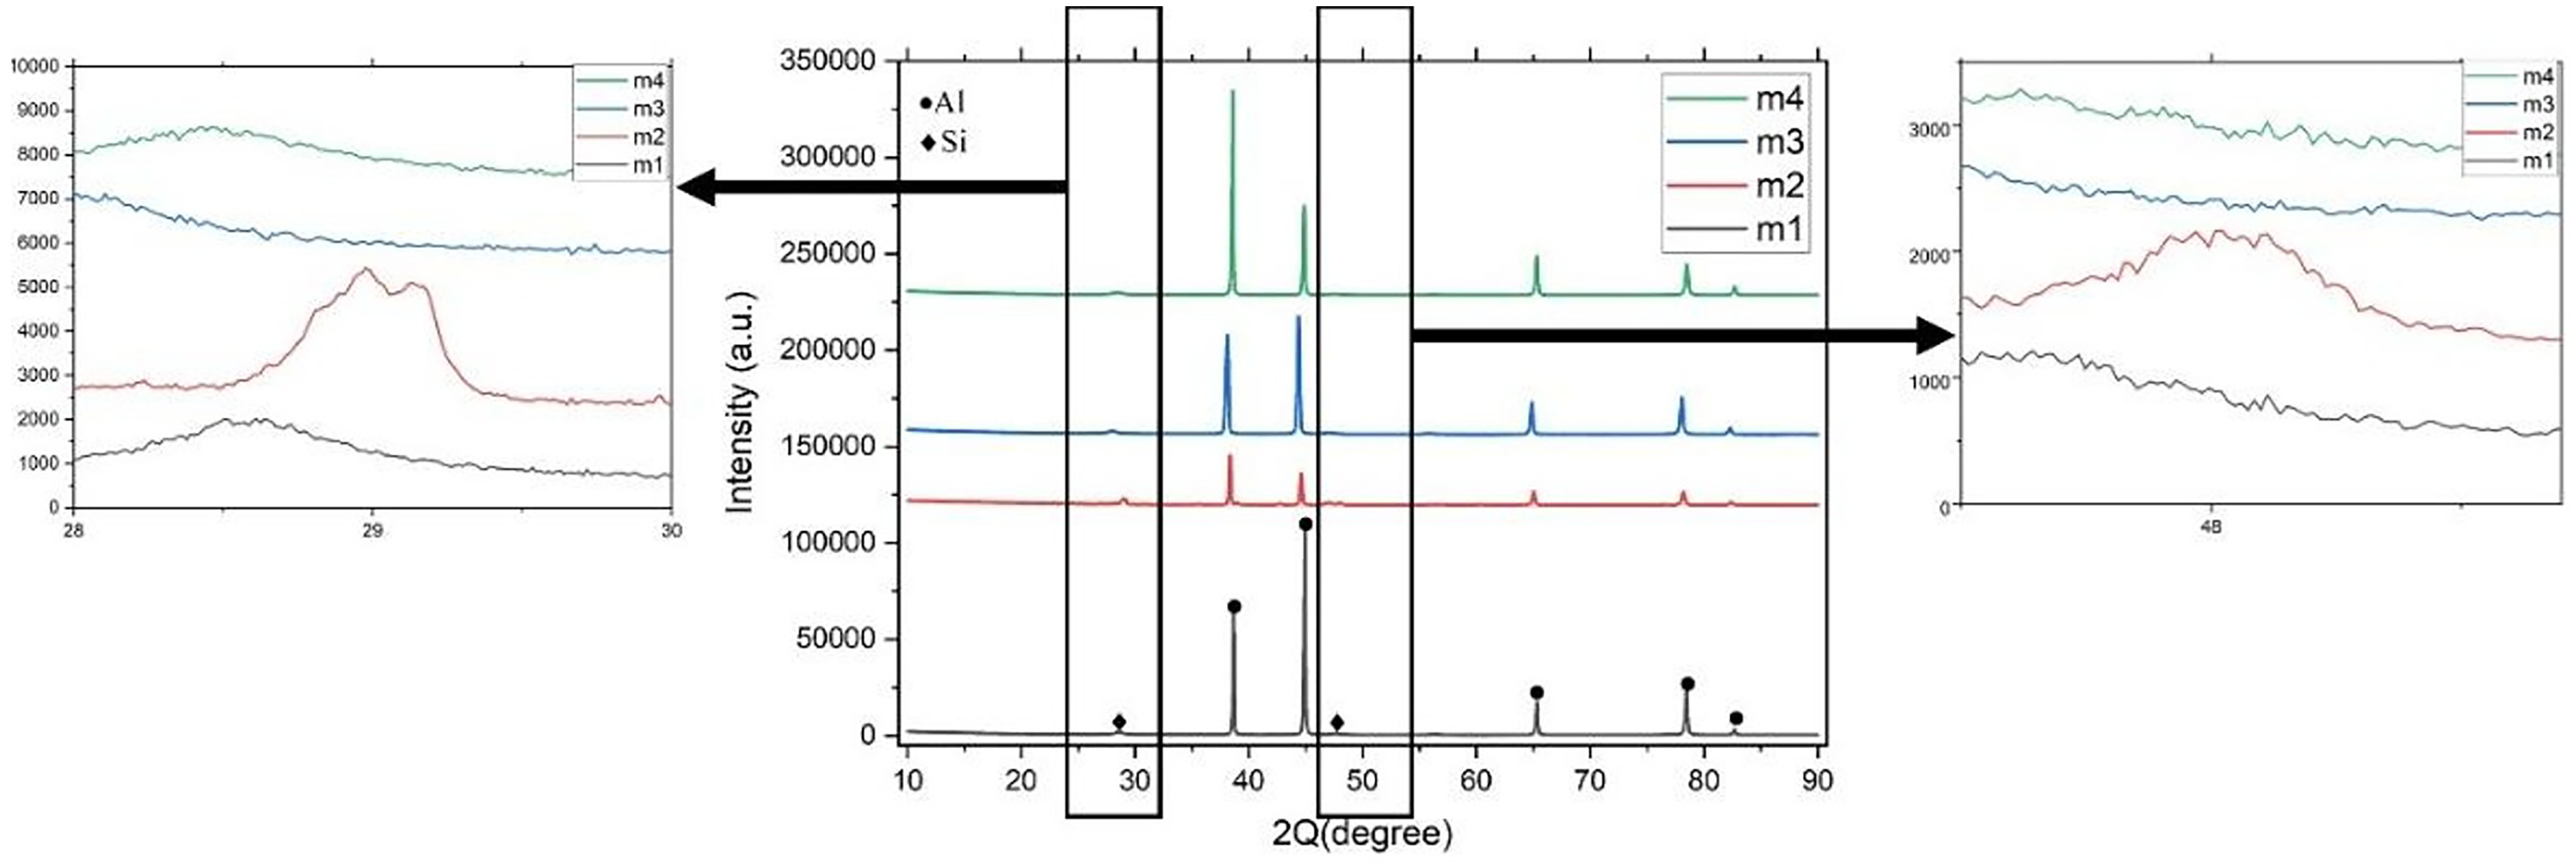
XRD results of all samples.
Hardness
Figure 8 shows the hardness results.
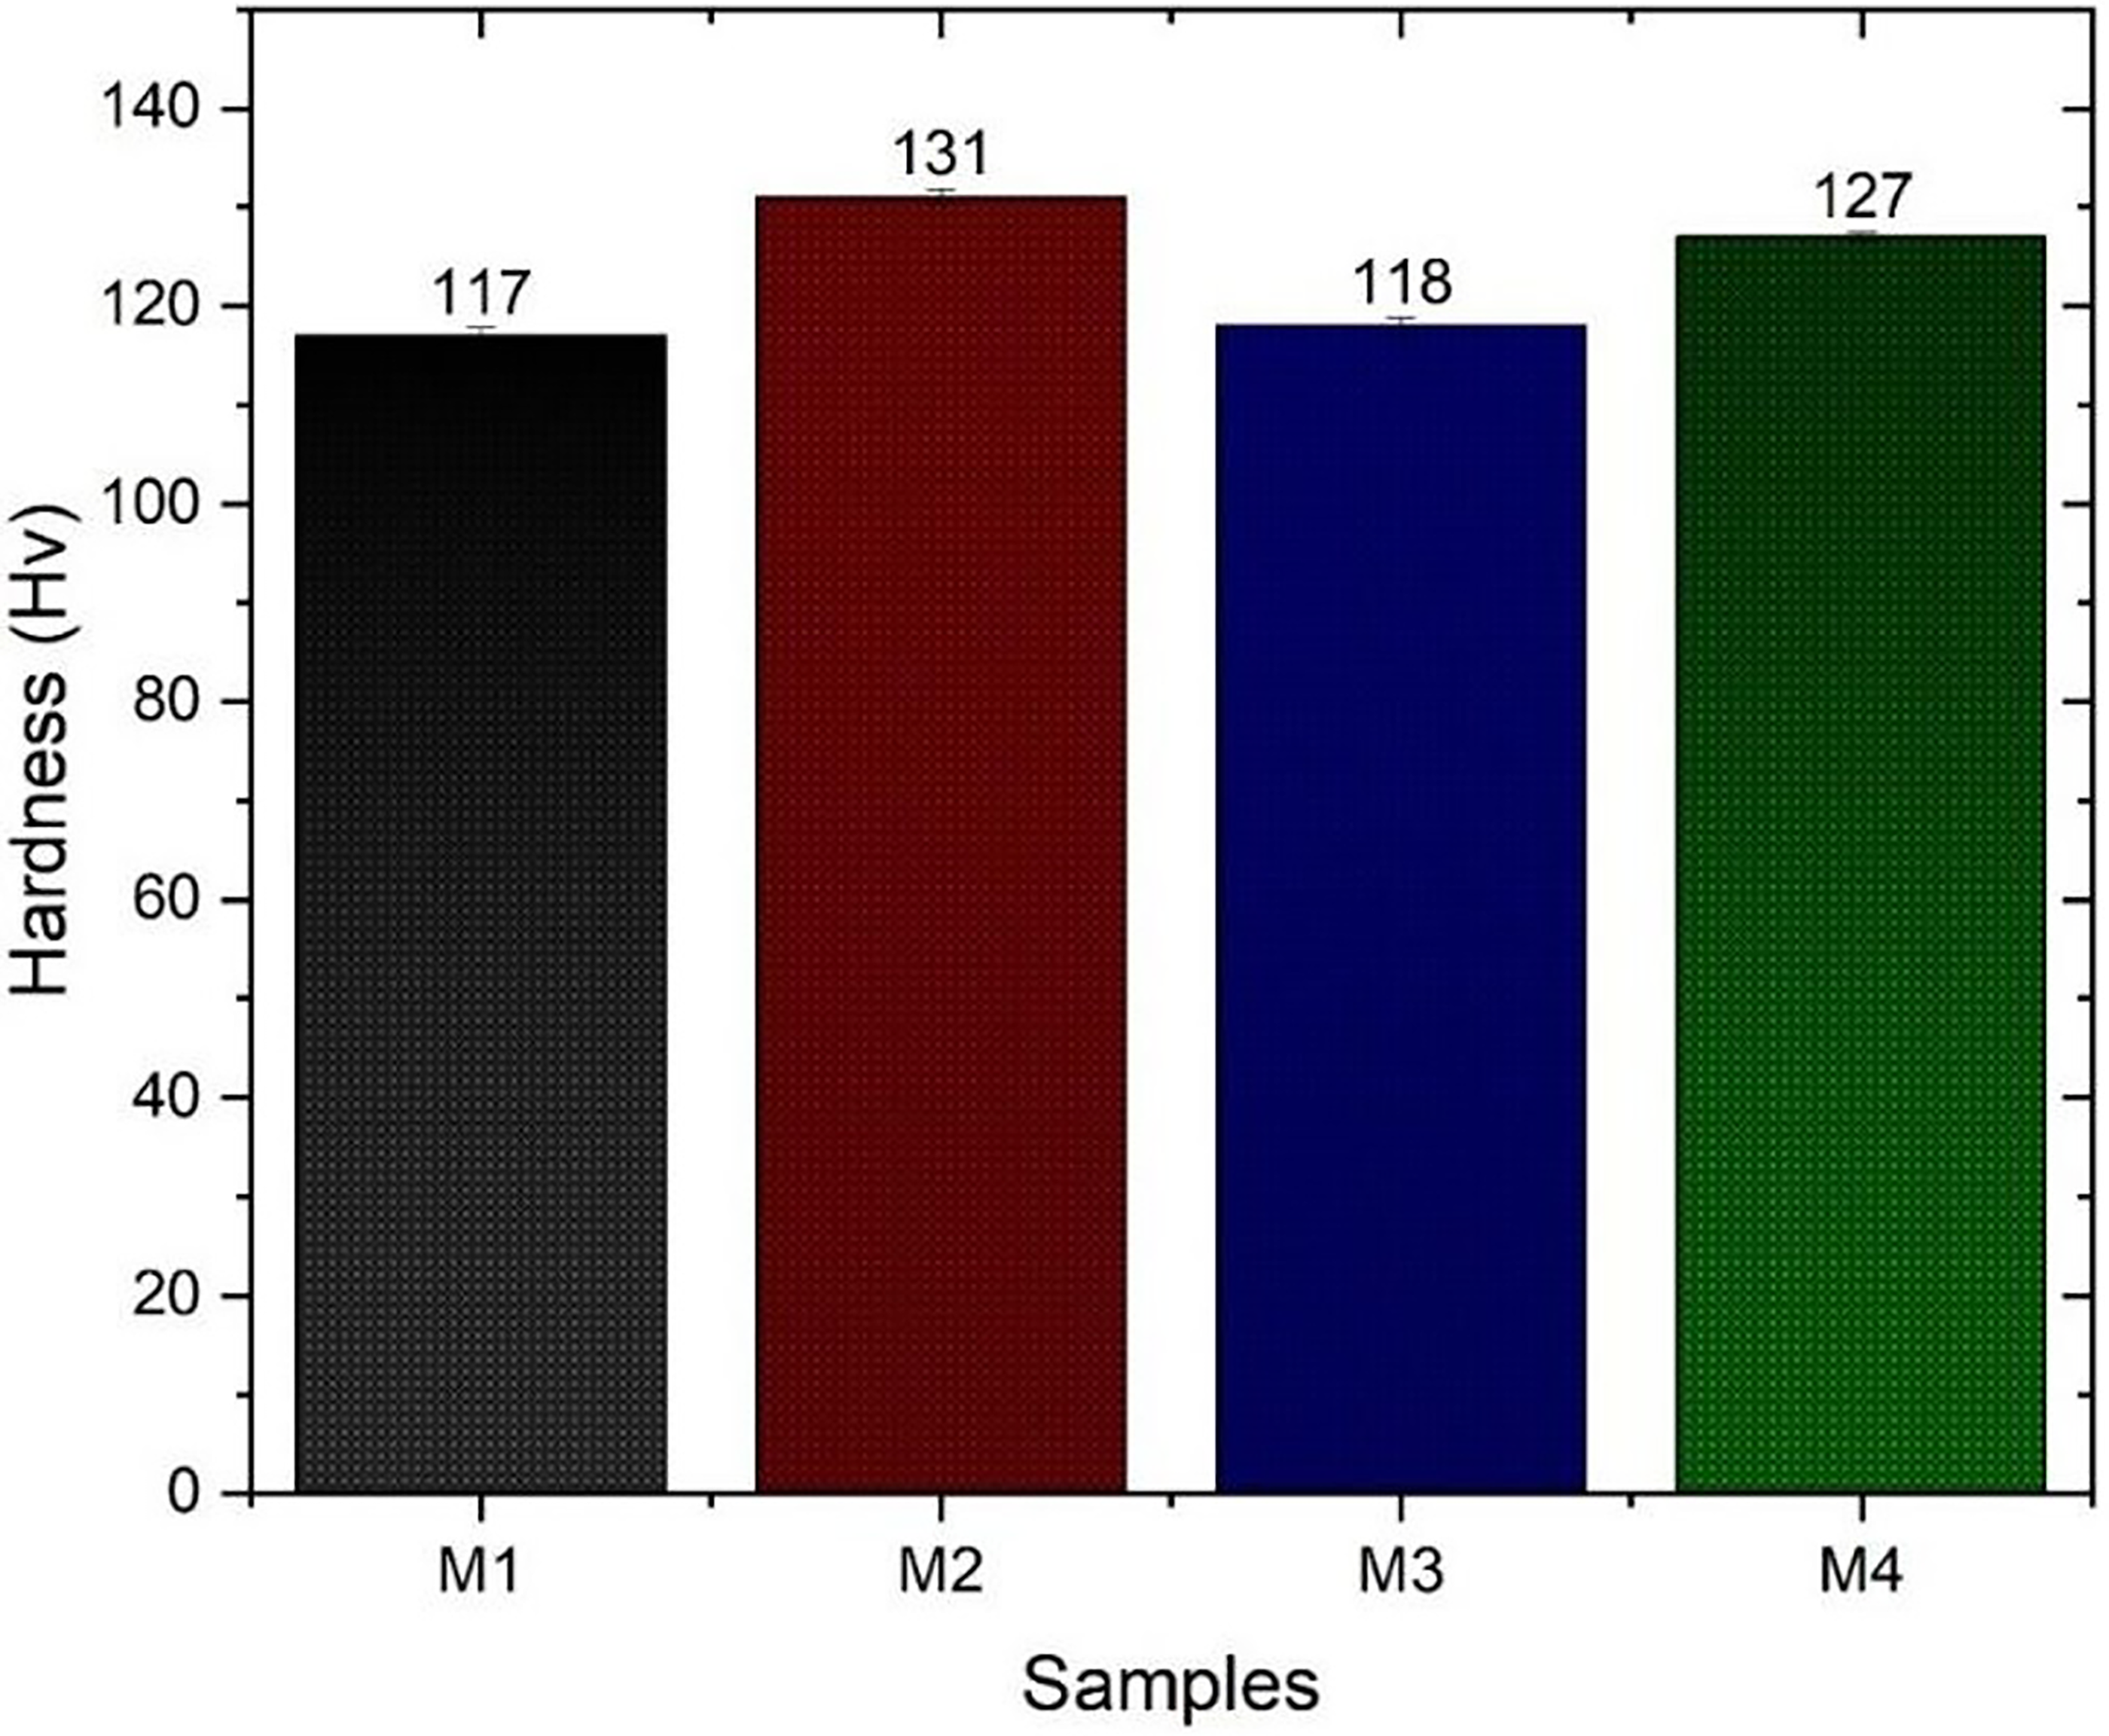
Hardness values.
Figure 8 presents the hardness measurements for both standard and bubble-structured samples. The data indicate that samples with bubble microstructures consistently exhibited higher hardness compared to standard ones, which is attributed to their denser and more refined microstructure. For instance, sample m1 showed a hardness of approximately 117 Hv, whereas sample m2 achieved a higher value of 131 Hv. An increase in layer thickness from 30 μm to 40 μm resulted in either similar or slightly reduced hardness values for both types. However, across all cases, the bubble-structured variants maintained superior hardness regardless of the layer thickness.
The enhanced hardness observed in samples M2 and M4, fabricated using SSS, can be linked to several microstructural improvements. The altered scan path in SSS provides a more uniform thermal environment and promotes faster solidification, resulting in a finer Al–Si eutectic structure. Such microstructures, with uniformly dispersed Si particles, hinder dislocation movement and thereby enhance hardness. Additionally, the distinctive bubble-like melt pool formed during SSS leads to better overlap between melt pool boundaries, minimizing porosity and further reinforcing mechanical strength . Consistent cooling rates also discourage the formation of coarse cellular or columnar grains, which are known to reduce hardness in LPBF-processed AlSi10Mg alloys.
These observations are consistent with previous studies, such as those by Li et al., 34 who demonstrated that optimized scan strategies can improve Si particle distribution and raise microhardness. Likewise, reported that finer eutectic spacing and reduced residual tensile stress–outcomes of modified scan strategies–contribute to improved mechanical properties in LPBF aluminum alloys.
Corrosion analysis
An electrochemical assessment was conducted over 60 min with a scanning rate of 0.5 mV/s in a saline solution containing 3.5 wt.% NaCl, involving all four specimens produced by Laser Powder Bed Fusion (LPBF). The resulting potentiodynamic polarization graphs for both the as-fabricated and the innovative samples at varying layer thicknesses are depicted in Figure 9. The Ecorr values indicate the onset of corrosion, which appeared to be nearly the same across all test specimens. Upon closer examination, it can be noted that the corrosion tends to initiate sooner in the conventional samples compared to the novel ones.
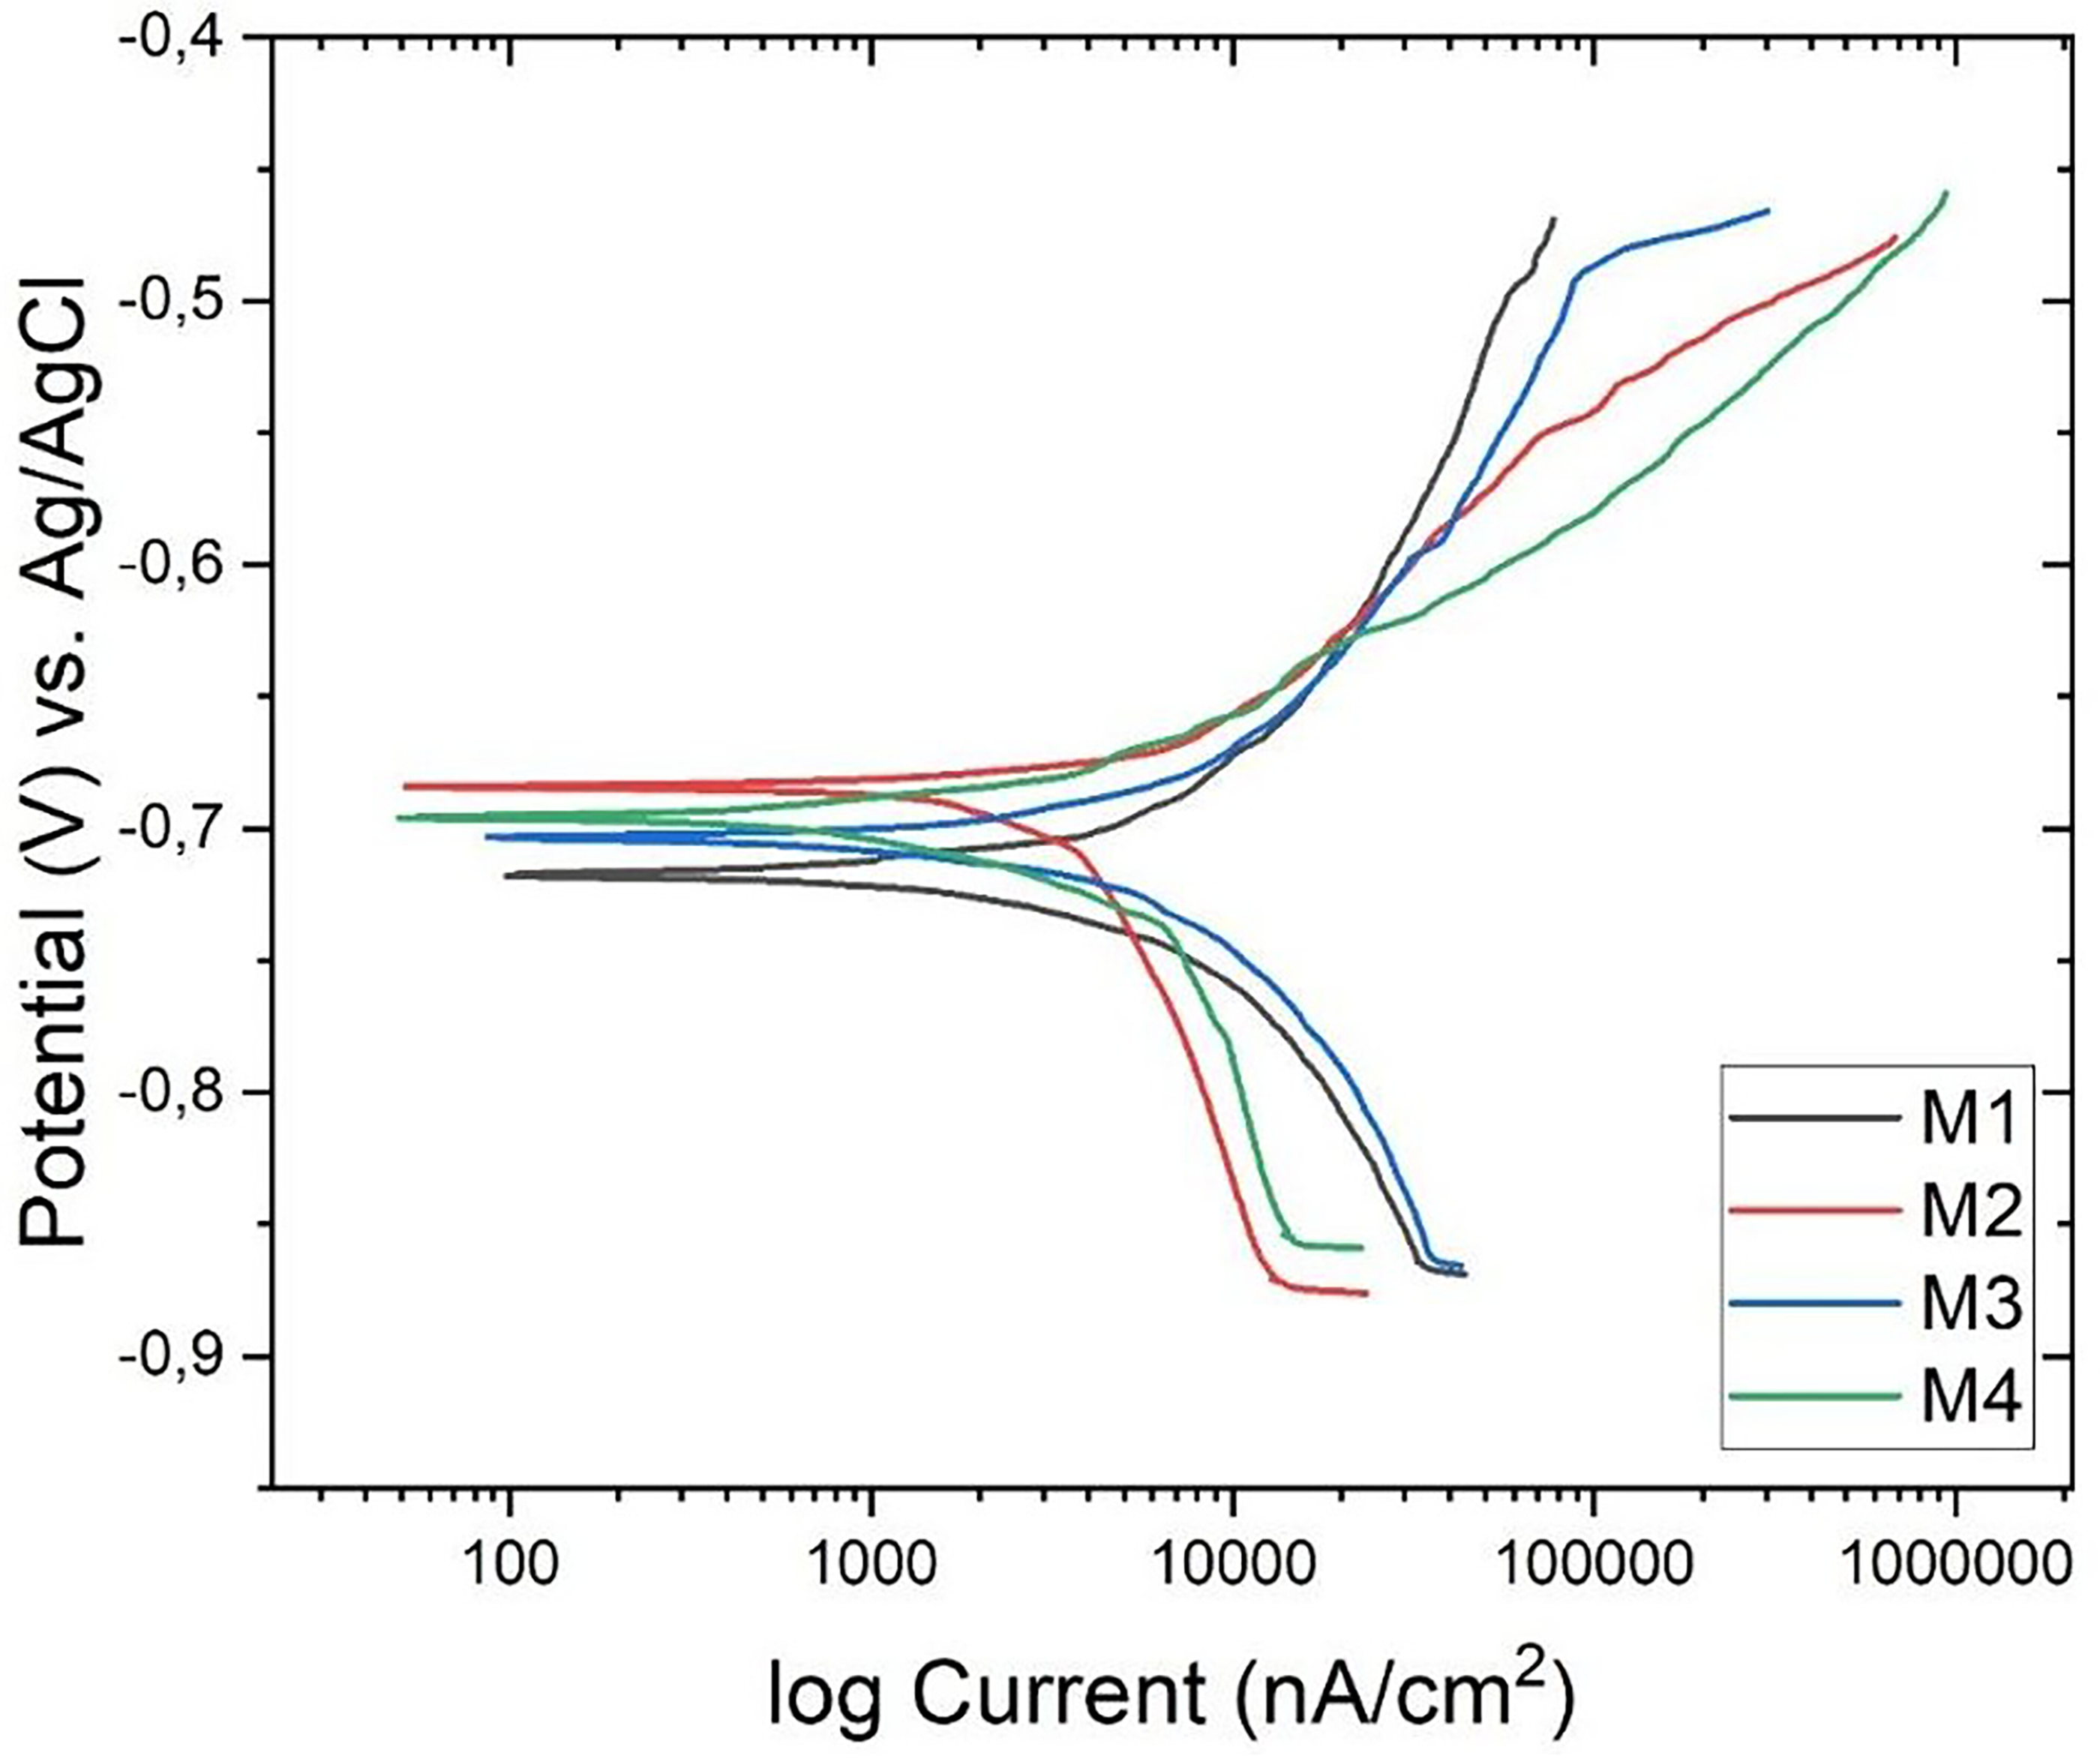
Tafel polarization curves of the samples.
The passivation current, Icorr, is indicative of the material's erosion tendency and the accumulation of corrosion byproducts. A lower passivation current density signifies a stronger passivation response and a reduced rate of corrosion. 36 Thus, surfaces with lower Icorr values exhibit enhanced corrosion resistance in a specific liquid medium. According to Table 4, samples exhibiting bubble morphology consistently showed lower Icorr values compared to conventional samples, regardless of layer thickness. The Icorr values for conventional samples were about double those of the bubble-structured samples. When comparing different layer thicknesses, the 30μm-built samples demonstrated less corrosion than those built at 40μm. This observation is further supported by the corrosion rate data, where bubble-structured samples consistently exhibited a lower rate of corrosion.
Polarization parameters of the samples.
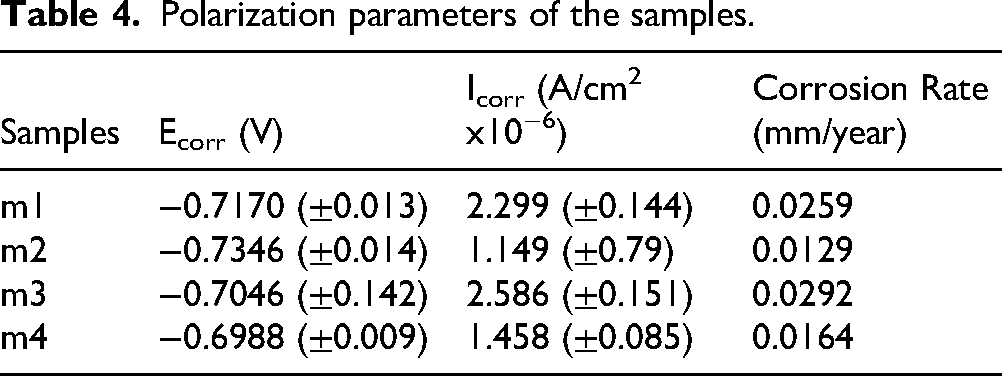
Figure 10 and Table 5 show the EIS results of the samples. In equivalent electrical circuits, R1 is indicative of the resistance of the solution. R2 represents the charge transfer resistance (Rct) associated with the corrosion process; Q denotes the constant phase element (CPE). A larger radius of the semicircle in the Nyquist plot signifies enhanced corrosion resistance and a reduced rate of corrosion (as seen in M2 and M4). Furthermore, there exists a direct correlation between Rct values and corrosion resistance. Typically, Rct is inversely related to the metal's corrosion rate. This suggests that a higher Rct leads to a slower rate of charge transfer and a diminished rate of metal dissolution in the solution 37 Electrochemical Impedance Spectroscopy (EIS) measurements corroborate the findings from Tafel experiments.
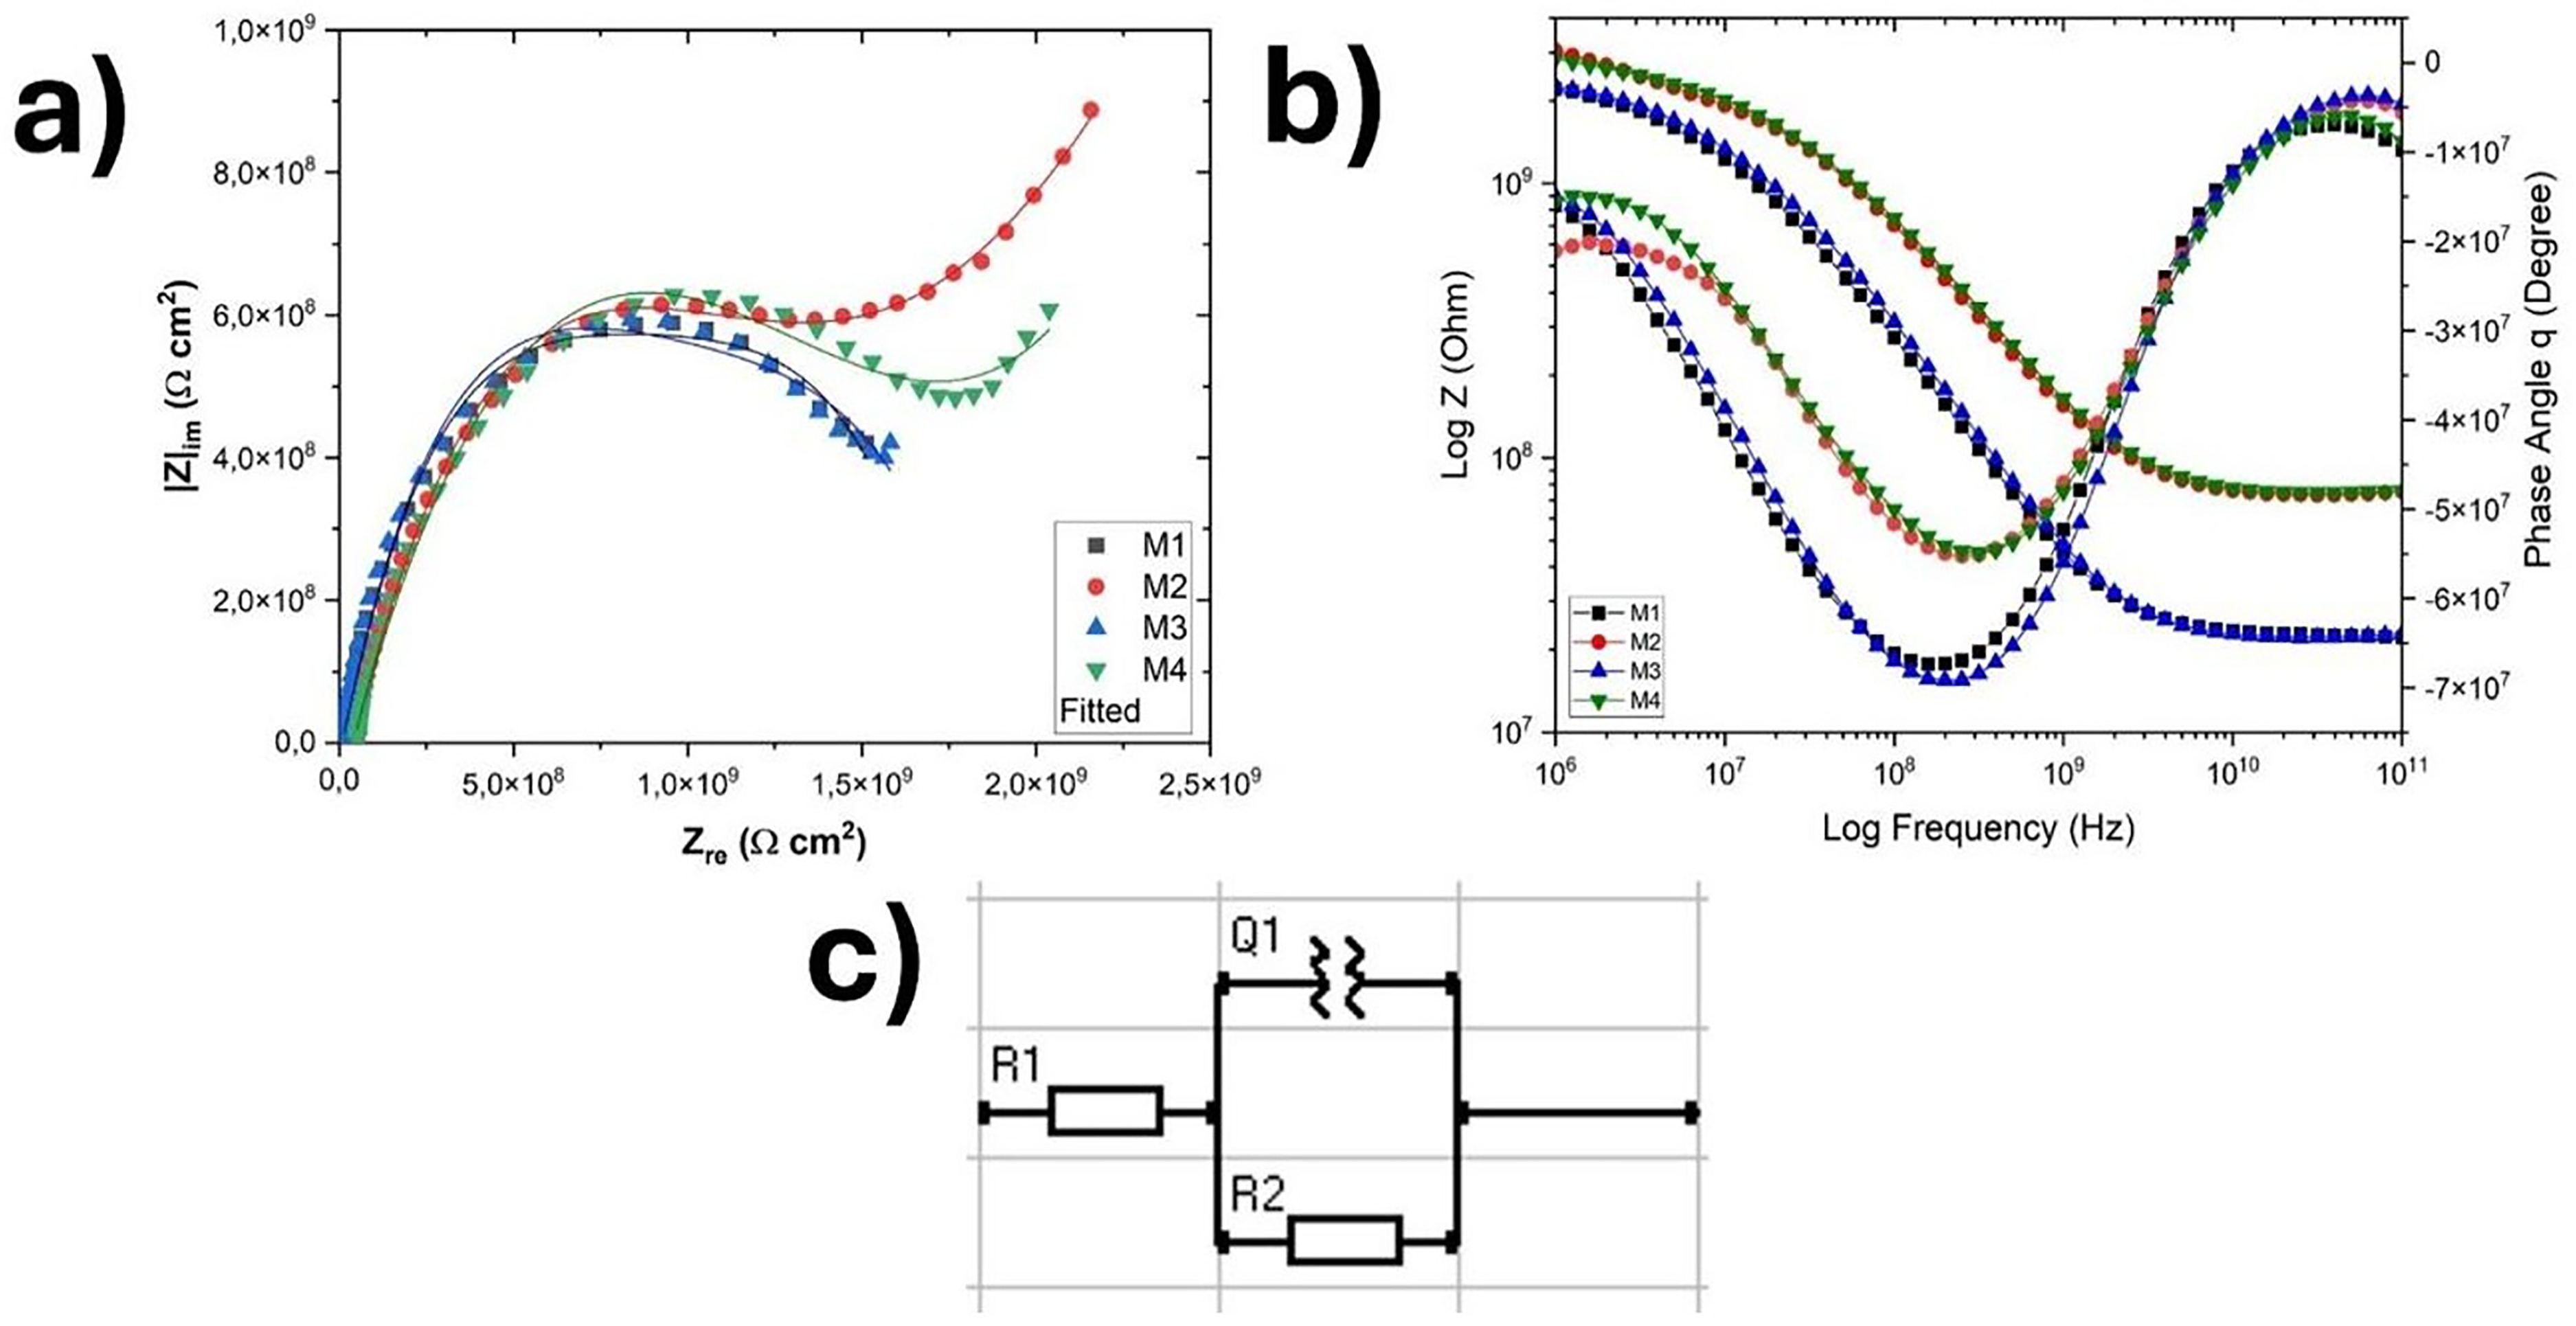
EIS results of the samples fabricated with different scanning speed parameters, a) Nyquist and b) Bode plots, and c) the equivalent circuit.
The fitting results obtained from the EIS results.
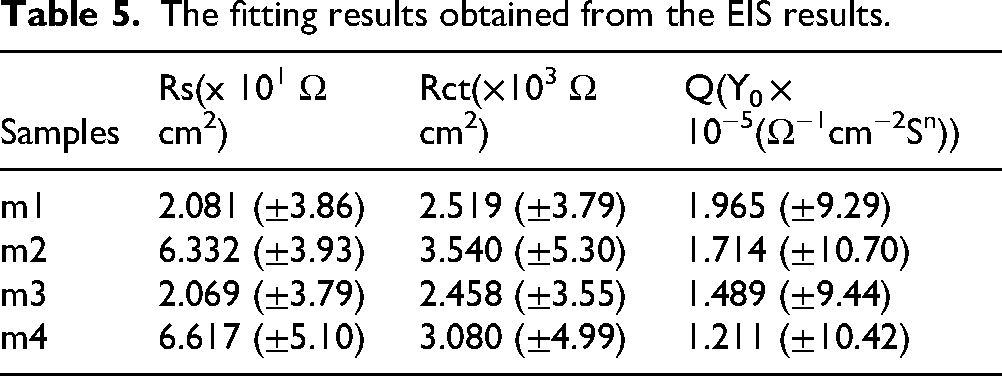
In Tafel results, Icor values describe the corrosion rate, i.e., high Icor means a high corrosion rate. According to the Tafel results, when we compare the samples among themselves in terms of Icor values (30 micron and 40 micron samples), it is seen that there is a 50.02% decrease in M1 and M2 samples and a 43.61% decrease in M3 and M4 samples in the samples produced with SSS compared to the samples produced with the standard production parameter. Again, in EIS results, Rct values are an indicator of the resistance of the samples against corrosion. The higher the Rct value, the higher the corrosion resistance of the sample. In terms of Rct values, a 40.53% increase between M1 and M2 samples and a 25.30% increase between M3 and M4 samples were determined. According to the results of this study, it was found that the corrosion susceptibility of the specimens made with the SSS strategy was reduced by about half. This is a significant improvement in terms of corrosion.
This corrosion study clearly illustrates that the newly developed microstructure exhibits greater resistance to corrosion than the samples fabricated using traditional methods. The distinct corrosion characteristics of the LPBF samples can be understood through their microstructural analysis. Prior research indicates that the inherent layer-by-layer fabrication and the rapid heating and cooling rates characteristic of the LPBF process significantly influence the solidification dynamics of the melt pool. This leads to a varied grain structure throughout the build and scanning planes of the SLM component. The energy imparted in each layer accelerates the remelting of the layers that have previously solidified.
The remelting of underlying layers ensures a strong consolidation between the individual layers and a reduction of pore density.38–40 The high pore volume is quite regular in the LPBF structure, and it is quite evident in the topmost layer. The presence of pores in the sub-surface region undermines the layer passivity by forming a galvanic cell between the pore openings and the flat regions of the surface.41,42 The tendency of pore formation is quite high near the melt pool border or at the overlap of the adjacent tracks, particularly in the top layer. Additionally, the inherently high surface roughness in the SLM structure due to track-wise scanning and formation of balling further wane the flatness of the top surface. 43 The high surface roughness and high sub-surface porosity are attributes of poor corrosion resistance. In this paper, the corrosion resistance in the LPBF traditional samples was found inferior to the samples with bubble morphology. 44
The remelting process of the underlying layers promotes robust interlayer bonding and diminishes pore frequency.38–40 A high volume of pores is a common feature in LPBF structures, particularly noticeable in the uppermost layer. Pores beneath the surface compromise the passivity of the layer by creating a galvanic cell between the pore openings and the flat surface areas.41,42 The likelihood of pore formation is especially high near the melt pool's edge or where adjacent tracks overlap, mainly in the top layer. Moreover, the intrinsic surface roughness in SLM structures, resulting from track-by-track scanning and balling phenomena, reduces the smoothness of the top surface. 43 Elevated surface roughness and significant sub-surface porosity are indicative of reduced corrosion resistance. In this study, traditional LPBF samples exhibited less corrosion resistance compared to those with bubble morphology. 44
As indicated by the microstructural and hardness analyses, it is evident that samples fabricated with the new scanning technique exhibit a denser structure with smaller grains and enhanced Si solubility. Consequently, the typical melt-pools found in conventional structures are replaced by smaller melt-pool boundaries in the new structure. These boundaries, with their increased Si solubility, are likely to exhibit fewer anomalies related to boundaries than traditional structures. Therefore, it is plausible that the samples developed fewer galvanic cells between the flat and exposed areas, leading to better corrosion resistance compared to conventional samples.
The effects of scanning strategies on AM/AlSi10Mg have been studied in recent years. Charan et al. did not observe any noticeable change in hardness, yield, and tensile strength according to different screening strategies. 45 Dejene et al. studied a spiral scanning pattern and reported that this strategy reduced the porosity of the material and increased the hardness, but did not investigate the corrosion resistance. 46 Rui et al. studied a screening strategy with a boundary layer and reported problems such as pores and grain coarsening, corrosion properties were not studied. 47 Zhou et al. studied the effects of laser scanning rotation angle between successive layers on AlSi10Mg. The results revealed that LPBF affects the ductility and strength of the AlSi10Mg alloy. The highest ductility was obtained3 when the melt pools were oriented parallel to the tensile direction, while the lowest ductility values were found when the melt pools were perpendicular to the tensile direction. Corrosion properties were not investigated. 48 Yang et al. investigated the effect of building orientation (horizontal, vertical, 45° diagonally built), thickness, and contouring on the microstructure and mechanical properties of AlSi10Mg material produced with LPBF. In this study, the effects of building orientation on the mechanical properties of the material were examined, but corrosion properties were not mentioned. 49 Jatti et al. studied the effect of volumetric energy density and processing parameters on the microstructural properties and tensile properties of LPBFed AlSi10Mg specimens. 50 In another study, SLM simulation models of thin-walled structures were created to investigate the effect of scanning strategy and thickness on the temperature field. In this study, dimensional accuracy, fused morphology, and microstructure were characterized, and hardness and mechanical values were investigated. 51 In another study, only the effects of scanning strategy on impact toughness were investigated. 52 The results of electrochemical measurements of AM-produced parts show that there is a potential relationship between grain size and corrosion resistance in the microstructure produced by the LPBF technique. It is a fact that changes in process parameters, especially in the scanning strategy, grain, and cellular dimensions, are important in improving corrosion resistance. 53
However, a screening strategy in this paper has not been applied in a previous study. In addition, the number of papers investigating the effect of screening strategy on the mechanical and corrosion properties of the material is limited. The data in this study, for the first time, demonstrated the effects of this strategy on the mechanical and corrosion properties of the material.
Conclusions
In this work, a novel SSS technique was applied in the LPBF process to address the limitations of conventional laser scanning methods in the fabrication of AlSi10Mg alloy components.
The proposed strategy successfully transformed the melt pool geometry into a bubble-like form, leading to improved overlap and more homogeneous thermal dispersion. As a result, significant mechanical and microstructural improvements were observed. Compared to the standard screening strategy, the SSS approach led to a significant reduction in porosity and refinement of the eutectic Si phase, contributing to superior hardness in M2 and M4 samples. Thermal simulations confirmed that SSS facilitated faster and more uniform cooling rates, which played a critical role in tailoring the microstructure and minimizing residual stresses. In terms of corrosion, the new strategy has been shown to reduce the corrosion susceptibility of the material by approximately half. This has a particularly positive impact on aerospace applications. Furthermore, the SSS methodology demonstrated the potential to reduce local overheating and directional heat accumulation, which are common challenges in conventional LPBF processes. These findings highlight the effectiveness of strategic scan path changes to improve part quality without changing laser power or scan speed. The results presented in this study provide a foundation for future process optimization in LPBF manufacturing, especially for high-performance applications in the aerospace and defense sectors where precision and reliability are paramount.
Footnotes
Acknowledgments
SSS concept proposal of the research were carried out within the scope of ITU Scientific Research Project ID: 45766. The corrosion tests of this study were financially supported within the scope of the “Aluteam: Joint Research Center Project for the Digital Transformation of the Aluminum Industry”, which is a European Union Project (IPA) supported by the Ministry of Industry and Technology, Directorate General for EU Affairs and the European Union Financial Programs Department of Foreign Affairs.
Ethical approval
The article follows the guidelines of the Committee on Publication Ethics (COPE) and involves no studies on human or animal subjects.
Consent to participate
Not applicable. The article involves no studies on humans.
Consent to publish
Not applicable. The article involves no studies on humans.
Author contribution(s)
Authors’ contributions:
Gökhan Özer, material field studies and chapter writing; Cemal İrfan Çalışkan, SSS concept proposal, chapter authorship; Hamaid Mahmood Khan, chapter, conclusion authorship, and editorship; İbrahim Tütük, lab. Studies.
Funding
The authors received no financial support for the research, authorship, and/or publication of this article.
Declaration of conflicting interests
The authors declared no potential conflicts of interest with respect to the research, authorship, and/or publication of this article.