
Abstract
To investigate the mechanism of extrusion machining with chamfered tool (CT-EM) and establish the prediction models, experiments and numerical simulations were performed. By varying the chamfer angles (γ2) and widths (wc), the mechanical properties and microstructure of prepared strips were thoroughly studied. The results revealed that γ2 affected the gravity center of dead metal zone (DMZ) and the relative position of stagnation points, while wc mainly affected the DMZ area. Lower γ2 and higher wc increased effective strain and cutting temperature in DMZ, improving strip hardness and tensile strength. Furthermore, the predictive models of cutting force and deformed layer thickness matched experimental results. This study enriches the theory and modeling of CT-EM, further expanding the application of chamfered tools.
Introduction
As an efficient approach of enhancing the mechanical properties of metals by altering grain size, grain refinement enables the convenient fabrication of materials with superior structures.1–3 Ultrafine-grained (UFG) materials tend to exhibit improved strength,4,5 wear resistance,6,7 and higher hardness,8,9 showing great application prospects.
Extrusion machining (EM) enables one-step fabrication of UFG strips by the extrusion channel formed by the constraint and sharp tools.10–12 Issahaq et al. 13 prepared pure aluminum strips with lower surface roughness and higher strength by EM process. Through cutting experiments and numerical simulation, Deng et al.14,15 clarified that reducing the tool rake angle and chip compression ratio increased the effective strain. Based on Taguchi method, signal-to-noise ratio, and variance analysis, Pi et al. 16 investigated the effects of process parameters on response variables. Shu et al. 17 systematically revealed the evolution of microstructure and mechanical properties in the cryogenic EM process.
Sharp tools are commonly used in current EM studies18,19 and theoretical models of EM are mainly based on sharp tools.20–22 Hu et al. 23 improved the slip-line field model and further derived the analytical thermal model. Liu et al. 24 established an analytical model of mechanical properties and successfully validated it with pure copper. A strain estimation model was proposed by Cai et al. 25 according to the deformation field measured by high-speed imaging and digital image correlation.
To reduce tool wear and improve cutting performance, cutting with chamfered tools have attracted extensive exploration by researchers. Wu et al. 26 found that a dead metal zone (DMZ) was developed below the chamfer and served as an effective cutting edge. By comparing the cutting with different geometric tools, Asad et al. 27 demonstrated that chamfered tools produced chips with higher curl, while honed tools caused crack propagation and longer end-burrs. Gao et al. 28 found that the size of formed chips tended to decrease with increasing cutting-edge chamfer lengths through cutting experiments. Barelli et al. 29 revealed that higher cutting speed increased the shear angle, resulting in greater chip curvature. However, there are gaps in the theoretical modeling of extrusion machining with chamfered tools (CT-EM), and mechanical properties and microstructures of strips prepared by CT-EM process remain unclear.
In this paper, T2 pure copper was selected to establish the CT-EM theoretical models and explore the positional variation of stagnation point in DMZ ahead of the chamfered tool. Through experiments and simulation, mechanical properties and microstructures of strips machined using CT-EM under different chamfer angles (γ2) and chamfer widths (wc) were investigated. To explore the CT-EM process in depth, cutting temperature, effective strain, and contact length were further studied by finite element analysis. Additionally, the cutting force model and deformed layer thickness model of CT-EM matched the actual results, offering a reference for the engineering application of chamfered tools.
Stagnation point formation and theoretical modeling of CT-EM
Formation of the stagnation point in DMZ ahead of the chamfered tool
As presented in Figure 1(a), the chamfered tool creates a smaller shear angle φ compared to the sharp tool, and there is a DMZ formation ahead of the chamfered tool in CT-EM. Because the DMZ ahead of the chamfered tool is theoretically regarded as a fixed metal block, it can replace the tool tip to some extent. Additionally, the DMZ boundary AG is co-linear with the tool rake face, resulting in equal rake angles for both the chamfered tool and the sharpened tool. Figure 1(b) shows the machining schematic of CT-EM, where the UFG strip is formed in the extrusion channel between the constraint and chamfering tool. The surface metal of thickness t0 is removed and a strip of thickness tch is formed along the flow direction (FD in Figure 1b). Accordingly, there must exist a stagnation point (red point S) near the chamfer, leading to material flow in two directions. As can be seen in Fig. 1(c), the prepared strip can theoretically be any length as long as the tubular workpiece is long enough.
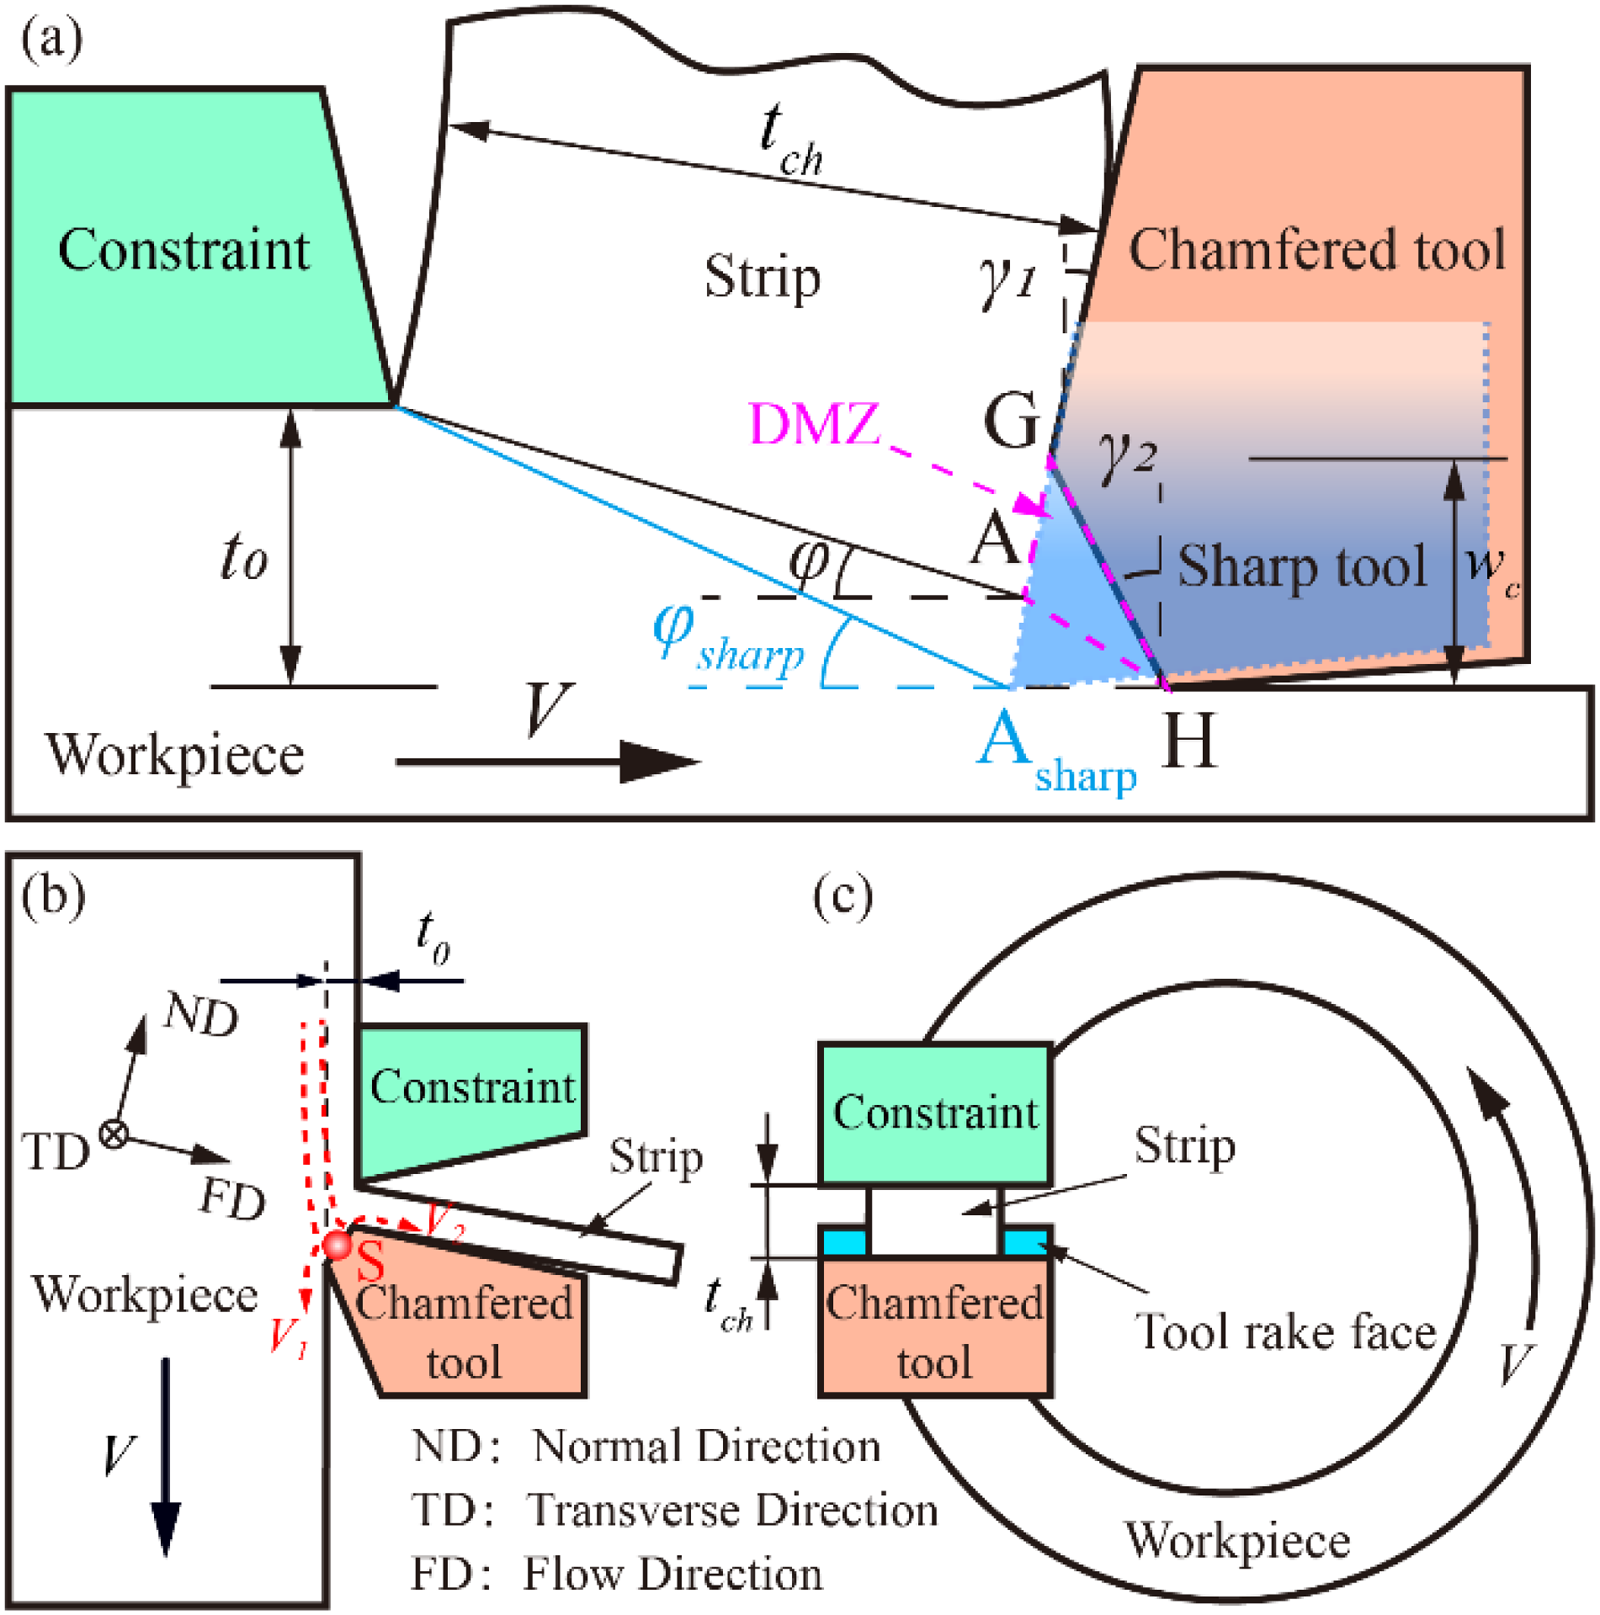
Schematic diagram of CT-EM process: (a) comparison of cutting with sharp and chamfered tools, (b) side view of CT-EM process, (c) front view of CT-EM process.
Assumptions for theoretical model establishment
The assumptions of the theoretical models are the basis for analysis and research, and influence the accuracy and reliability of the models profoundly. Too many factors may result in higher complexity and more unknowns in the model, while too few factors may reduce the accuracy and applicability. Therefore, the CT-EM models proposed in this paper need to make the following assumptions about the material deformation and contact conditions: (1) The metal workpiece is isotropic; (2) Material deformation coincides with the plane strain condition; (3) No material side flow occurs during CT-EM process; (4) The variables in the model are all in the steady state; (5) The workpiece never contacts the rear face of the chamfered tool; (6) Constraint never contact with the extruded strip.
Predictive model of cutting force predictive model
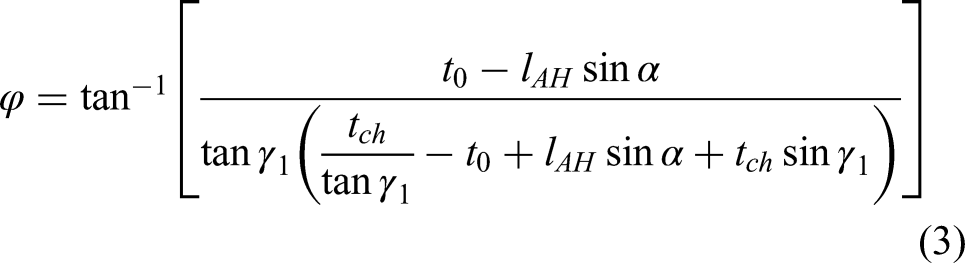
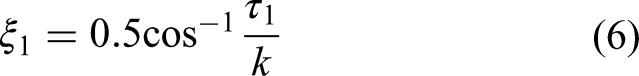
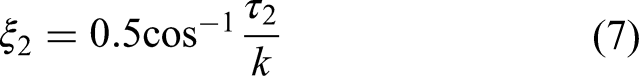
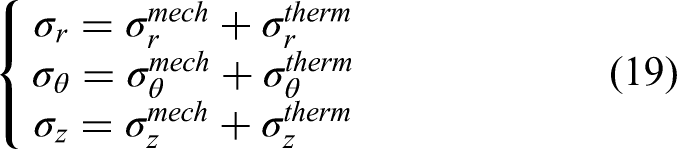
According to the slip-line models proposed by previous researchers,30,31 the improved cutting force model for CT-EM is shown in Figure 2. During CT-EM, some material accumulates and forms the DMZ (region AGH) due to the obstruction of chamfer GH. The slip-line field can be divided into the following parts: (1) The region BCJ represents the flow direction deflection of material before it enters the shear plane AB. This is due to the constraint effect in EM, where the material flow is deflected by an angle of β 25 to obtain a new velocity V’, which is then deflected to V'’ by region BCJ; (2) The region ABCJIF represents the first deformation zone and φ is the shear angle. After passing through the shear plane AB, the material flow direction is deflected by θ in the region ABE and flows towards the extruded strip; (3) The triangular region AGH is the DMZ, α is the included angle between line AH and the horizontal direction, and ζ2 is the friction angle between material and DMZ boundary. The formation of region AHF is extruded by DMZ, through which the material flows to the machined surface; (4) The plane ED is a stress-free surface and thus at an angle of 45° to the shear planes EK and DK. The triangle AKD is a friction region between the extruded strip and rake face, while ξ1 is the friction angle of GD.
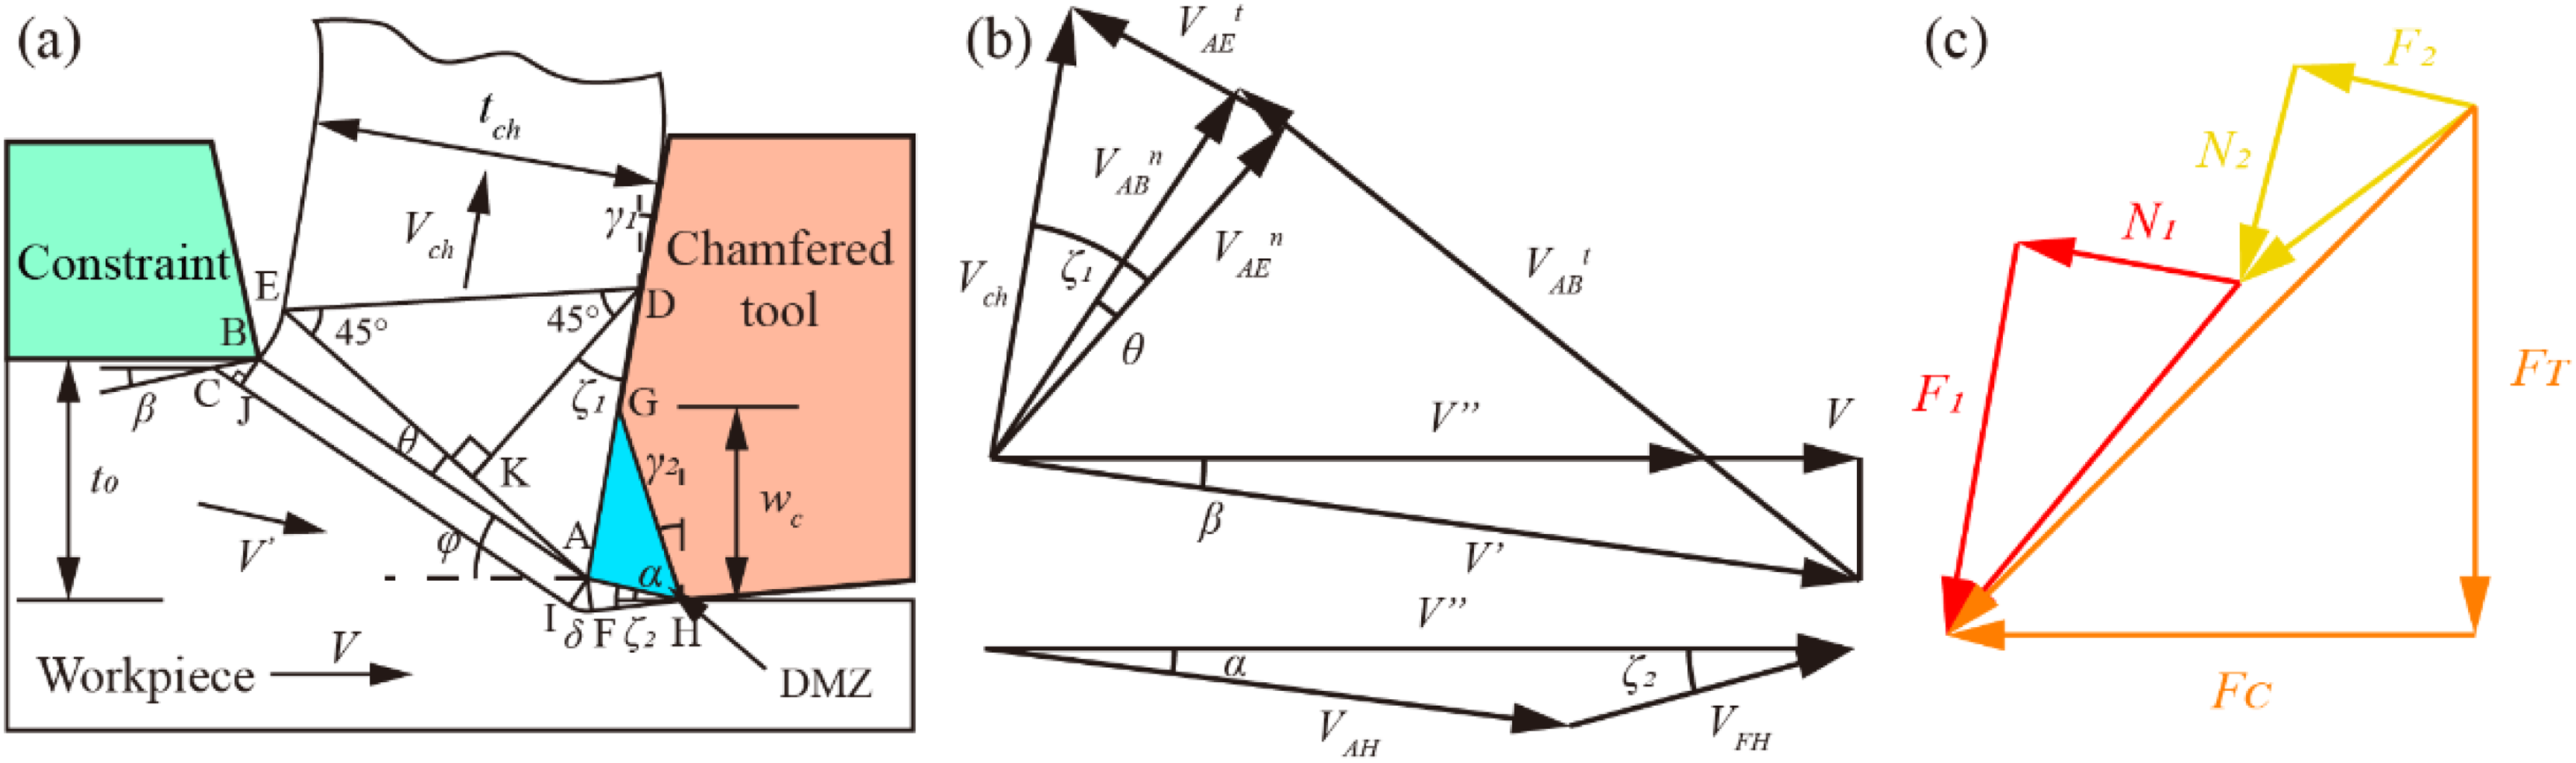
Cutting force model for CT-EM: (a) new slip-line model, (b) velocity vector diagram, (c) diagram of the cutting force and thrust force.
Based on the geometric relationship in Figure 2(a), the chamfer GH length lGH is calculated as:
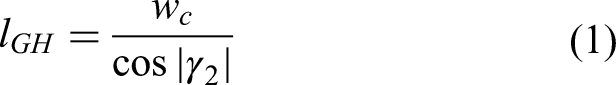
By the triangle sine theorem, the length of the DMZ boundary AH is given by the following equation:
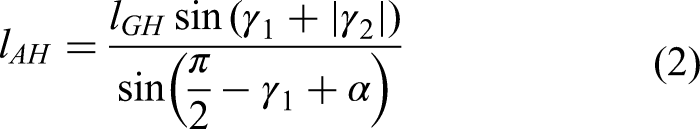
Additionally, θ and δ in the slip-line field are calculated as follows, respectively:


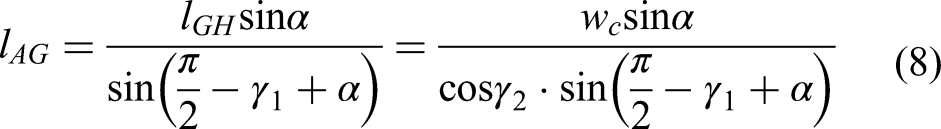
Based on the triangle sine theorem, the contact length lAG of the chamfered tool (containing DMZ) with the extruded strip is obtained:
Consequently, positive pressure N1 and friction F1 on AD and positive pressure N2 and friction F2 on AH (see Figure 2(c)) are:


Predictive model of deformed layer thickness on machined surface
During the CT-EM process, in addition to the shear strain flowing towards the strip, the material under the tool is also strained. Accordingly, a deformed layer exists under the machined surface, whose thickness relates to chamfered tool edge parameters. Concerning the work done by Yang et al., 33 the modeling schematics of the machined surface in CT-EM are shown in Figure 3.
Modelling of the machined surface: (a) stress distribution under the concentrated force, (b) composition of the deformed layer, and strain distribution.
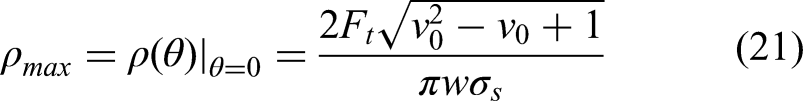
The stress distribution under concentrated force is illustrated in Figure 3(a), where the mechanical stresses on the machined surface are
34
:

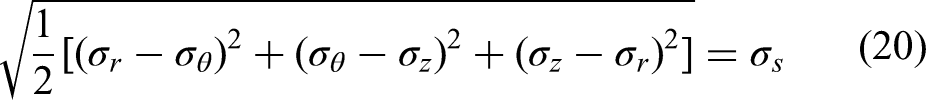
When the material surface is subjected to force, elastic and plastic deformation occurs in sequence. According to the fourth yield strength theory, the relationship between total stress and yield strength is governed by the von Mises yield criterion
37
:

Simulation and experimental method
Simulation modeling
Finite element analysis of CT-EM process was performed by Deform software, providing a reference for actual experimental results. To increase the computational rate, a simplified 2D finite element model was created, as shown in Figure 4, where only the workpiece, constraint, and chamfered tool were retained. The workpiece material utilized in this study was pure copper that has undergone annealing treatment (600°C), aligning perfectly with the material used in the study. The workpiece was plastic pure copper with a constitutive model of
39
:
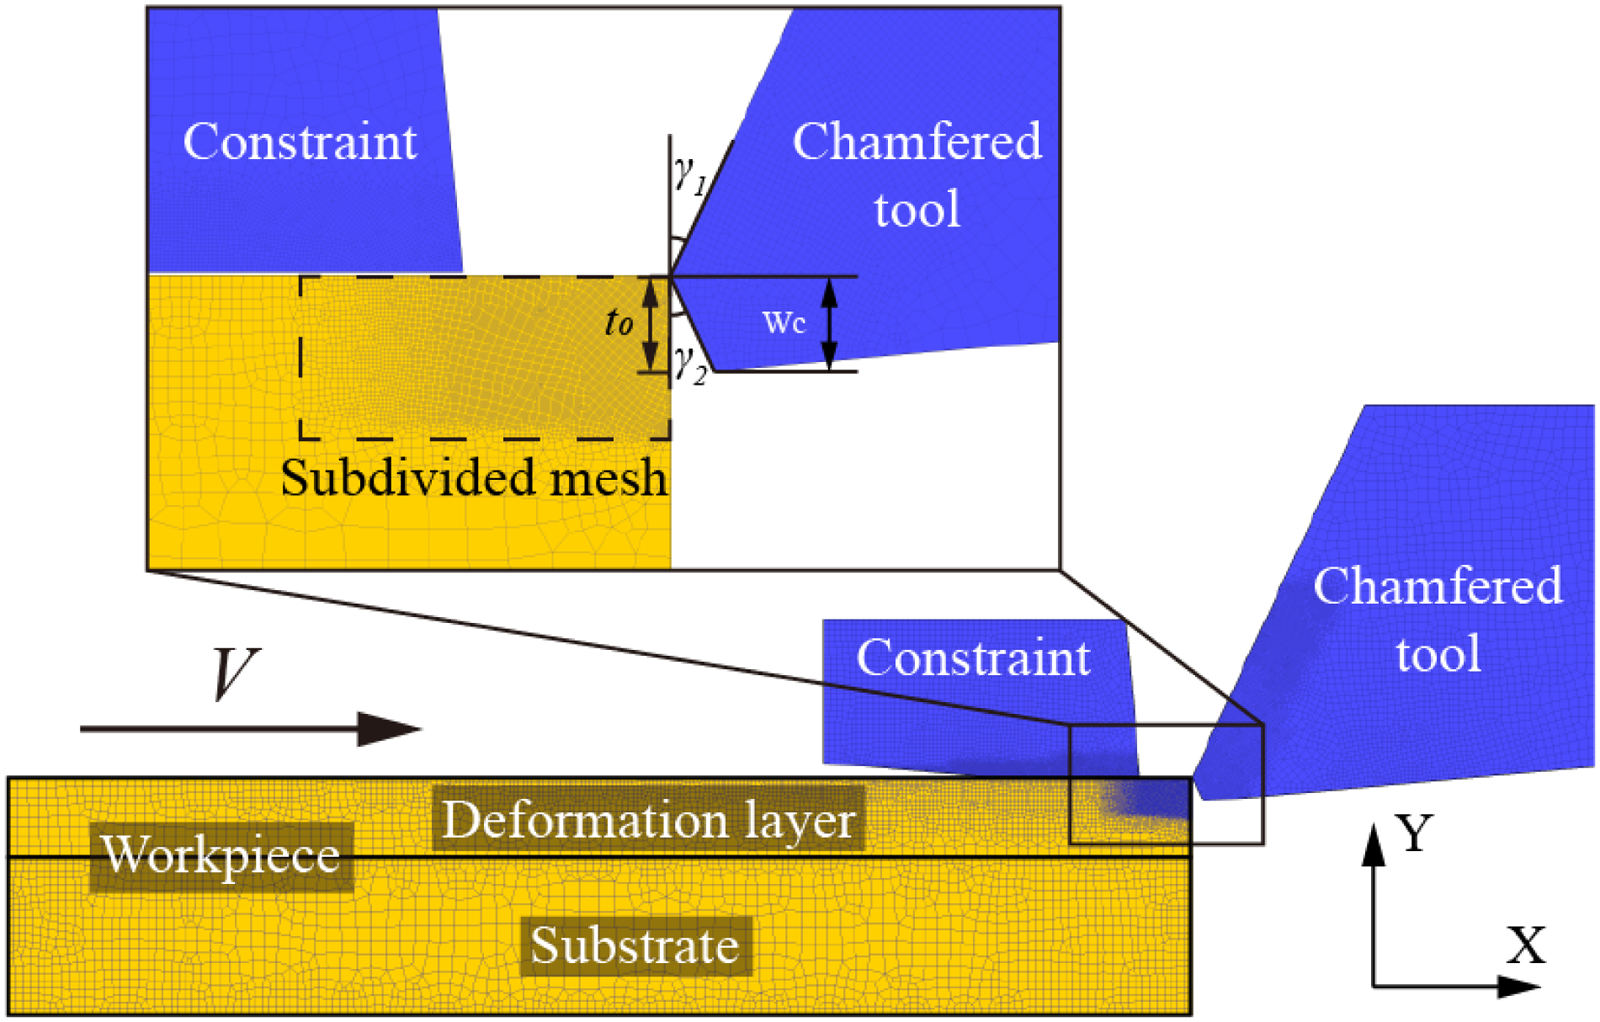
Simplified simulation model and refinement region.
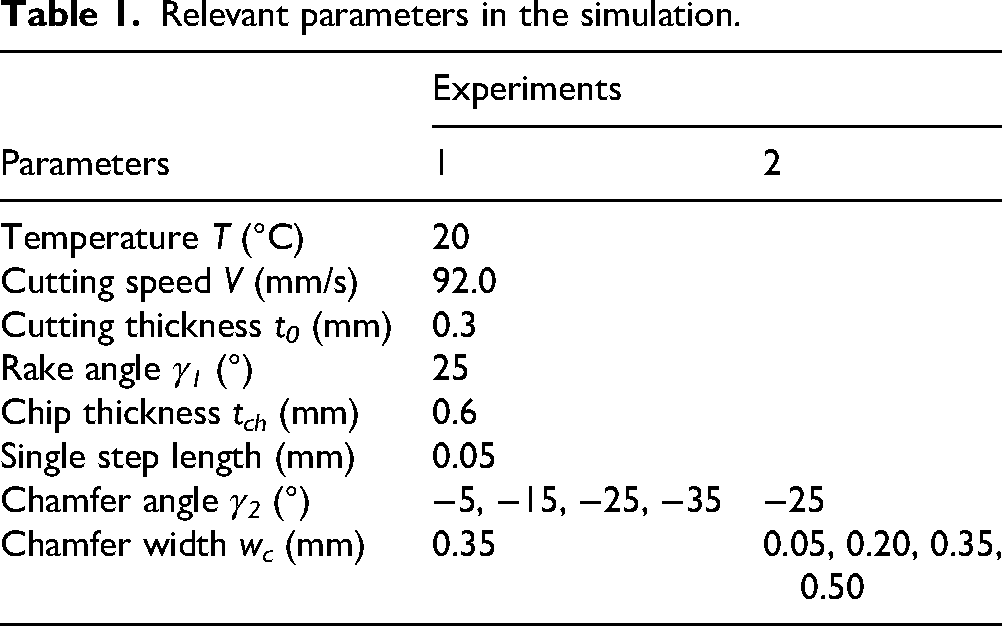
Additionally, the workpiece was divided into a substrate and a deformation layer, where the substrate had fewer meshes (about 2000) due to smaller deformation, while the deformation layer was divided into 10000 meshes. To increase the simulation precision, the meshes of deformation layer were further refined. The relevant parameters in cutting simulation were displayed in Table 1. Furthermore, the results after stable forming were used for analysis.
Relevant parameters in the simulation.
The experimental workpiece was a T2 pure copper round tube with an outside diameter of 70 mm, a length of 150 mm, and a wall thickness (equal to the extruded strip width) of 10 mm. The chemical composition of the workpiece was presented in Table 2. To improve the forming performance and eliminate the internal stress, the workpiece was completely annealed before experiments. The workpiece was heated to 600°C with a heating rate of 20 °C/min, holding time of 1 h, and then removed from the furnace after cooling to room temperature to obtain a uniformly organized copper tube. The microstructure of annealed pure copper was shown in Figure 5, and the original average grain size was about 60 μm.
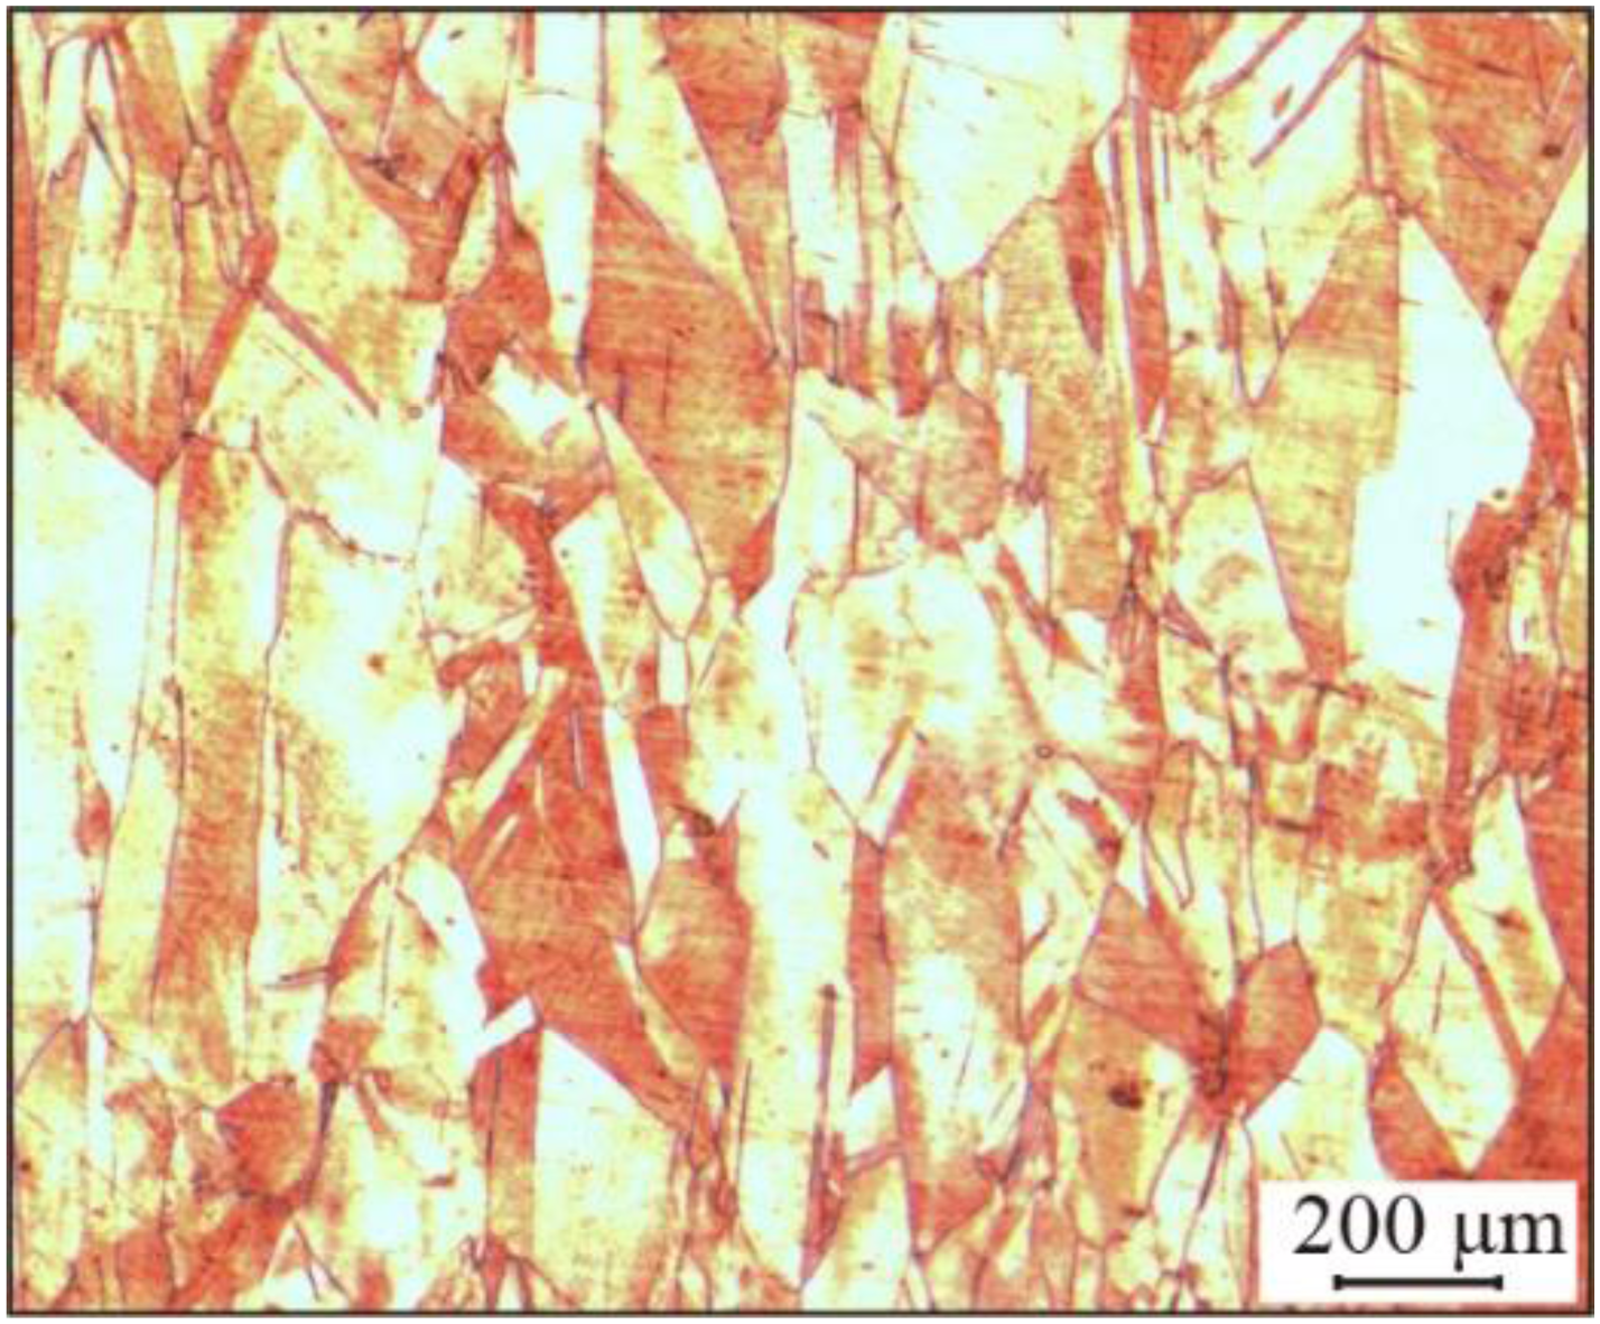
The initial microstructure of annealed pure copper.
The detailed components of T2 pure copper (wt.%).

This study focused on influences of different chamfer angles (γ2) and chamfer widths (wc) upon the strips fabricated by CT-EM, including the microstructures, hardness, and tensile properties. Additionally, γ2 of −5°, −25° and wc of 0.05 mm, and 0.35 mm were selected as the experimental variables, and other parameters were kept consistent with the simulations (see Table 1). Based on the principle of CT-EM, a combined tool was designed consisting of a chamfered tool, a constraint, shims, nuts, and bolts. The values of t0 and tch were controlled by shims of different thicknesses, and chamfered tool geometry parameters could be adjusted by different chamfered tools. As illustrated in Figure 6(a), the workpiece was extruded as a long strip by the combined effects of the constraint and chamfered tool. To further demonstrate the structure of the chamfered tool, Figure 6(b) showed the tip profile of the chamfered tool with γ2 = –25° and wc = 0.35 mm.
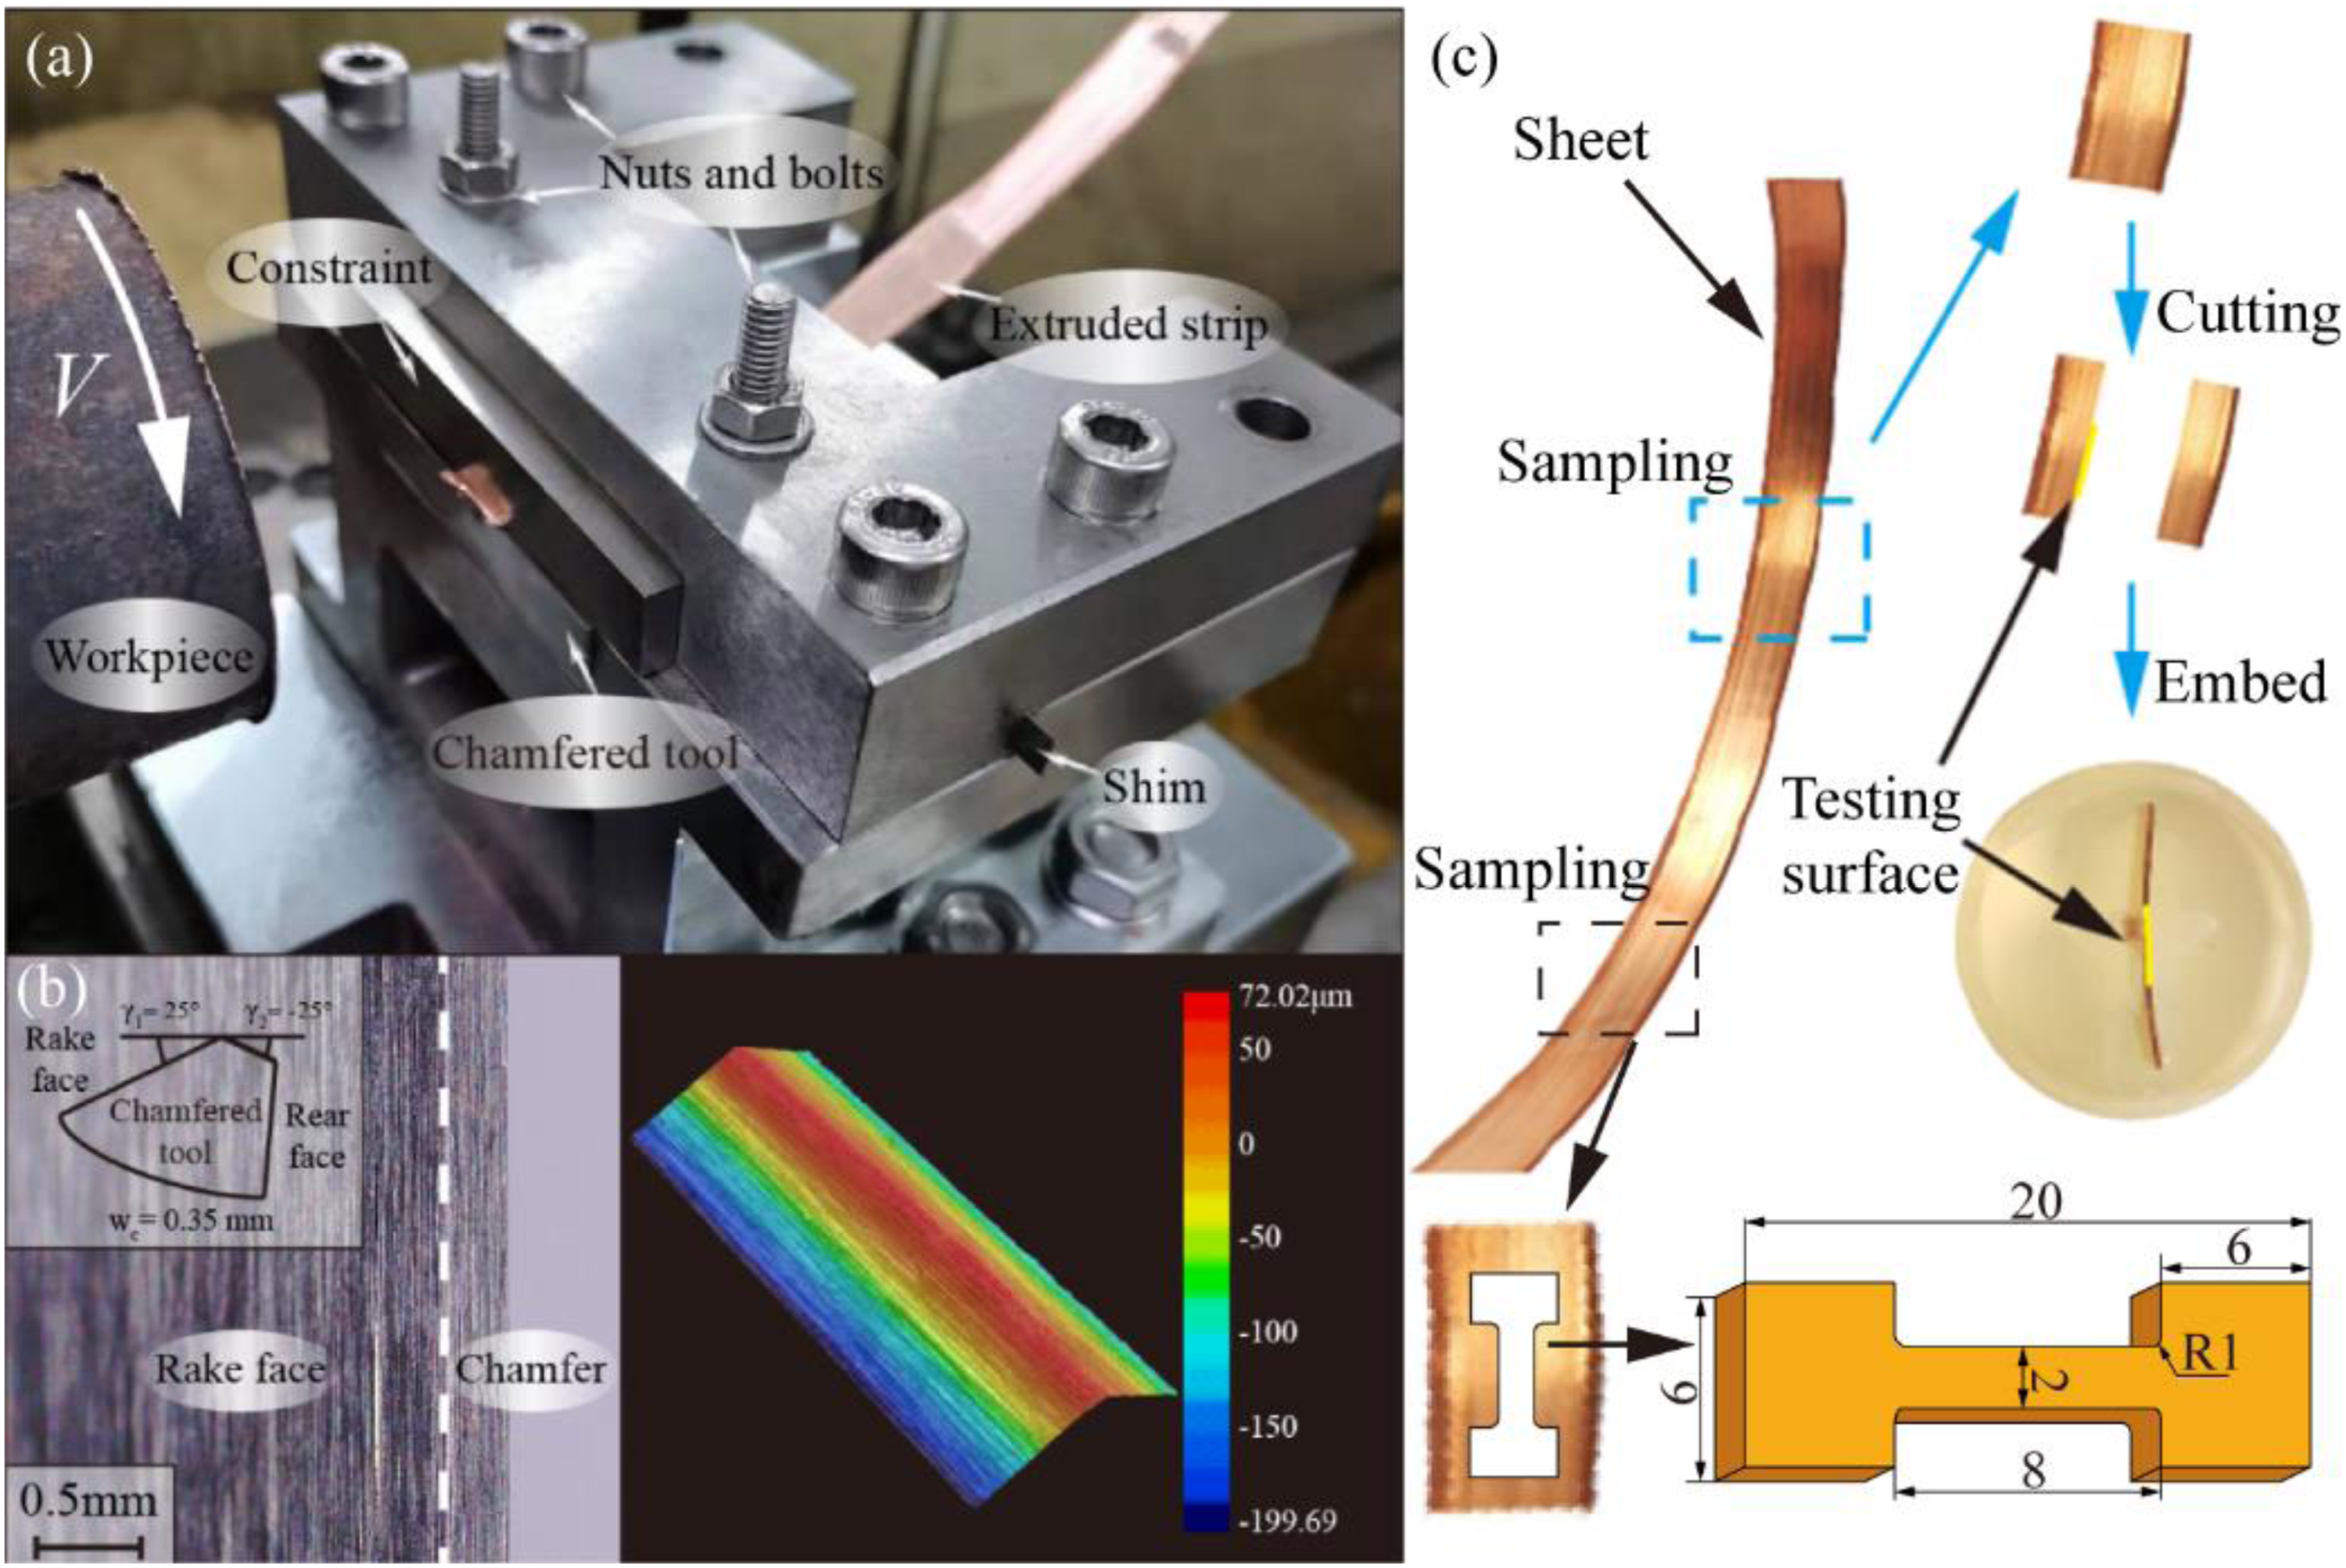
(a) Experimental setup of CT-EM process, (b) tip profile of the chamfered tool, and (c) inlay process and tensile sample dimensions.
A stably formed section of each prepared strip was selected for wire cutting and then inlaid into the resin for better observation. Surfaces of prepared samples were ground with sandpaper from 600# to 4000# and eventually polished using diamond polish. The Vickers hardness tester (MVS-1000D) was applied to measure the microhardness of ND-FD surface using a load of 200 g and a dwell time of 15 s. A universal testing machine (AG-IC 300 KN) was used to conduct tensile tests on pure copper strips prepared by CT-EM and annealed original samples. To avoid dynamic effect interference, a strain rate of 1.0 mm/min was selected to ensure uniform material deformation. Additionally, dog-bone-shaped tensile samples (see Figure 6(c) for detailed dimensions) were cut along the material flow direction prior to the tests.
Before observation by metallographic microscope (DMI 5000 M), the corrosion solution (5 g FeCl3, 16 ml HCl, and 60 ml C2H5OH) was employed to corrode the observation surface for 2 s. The samples were then immediately washed with anhydrous ethanol and dried, and finally observed the extruded strip, the deformation zone and DMZ, and machined surfaces for microstructure, respectively. Additionally, the microstructure of ND-FD surface was deeply characterized by the electron backscatter diffraction system (EBSD).
Results and discussion
Numerical simulation results
Through the mesh deformation in simulation, the CT-EM process could be divided into different stages. The workpiece was divided into 200 uniformly sized meshes, as shown in Figure 7(a), which could reveal the grain variation characteristics. Figure 7(b) showed the material diversion stage, in which some material flowed into the extrusion channel to form the extruded strip, while the other part flowed toward the rear face. Due to the different directions of material flow, there existed a stagnation point S on the chamfer, which was the greatest significance of the chamfered tool in CT-EM. As demonstrated in Figure 7(c), the DMZ was formed at the chamfer, affecting the material deformation of the extruded strip bottom and machined surface. Figure 7(d) showed the stable stage of strip formation, in which the mesh deformation of the strip bottom was severe and dense, indicating that the strain near the tool was larger than in the strip middle and top. Meanwhile, the meshes near the tool rear face were elongated, revealing that the chamfered tool had a plowing and extrusion effect on the material at a certain depth below the machined surface.
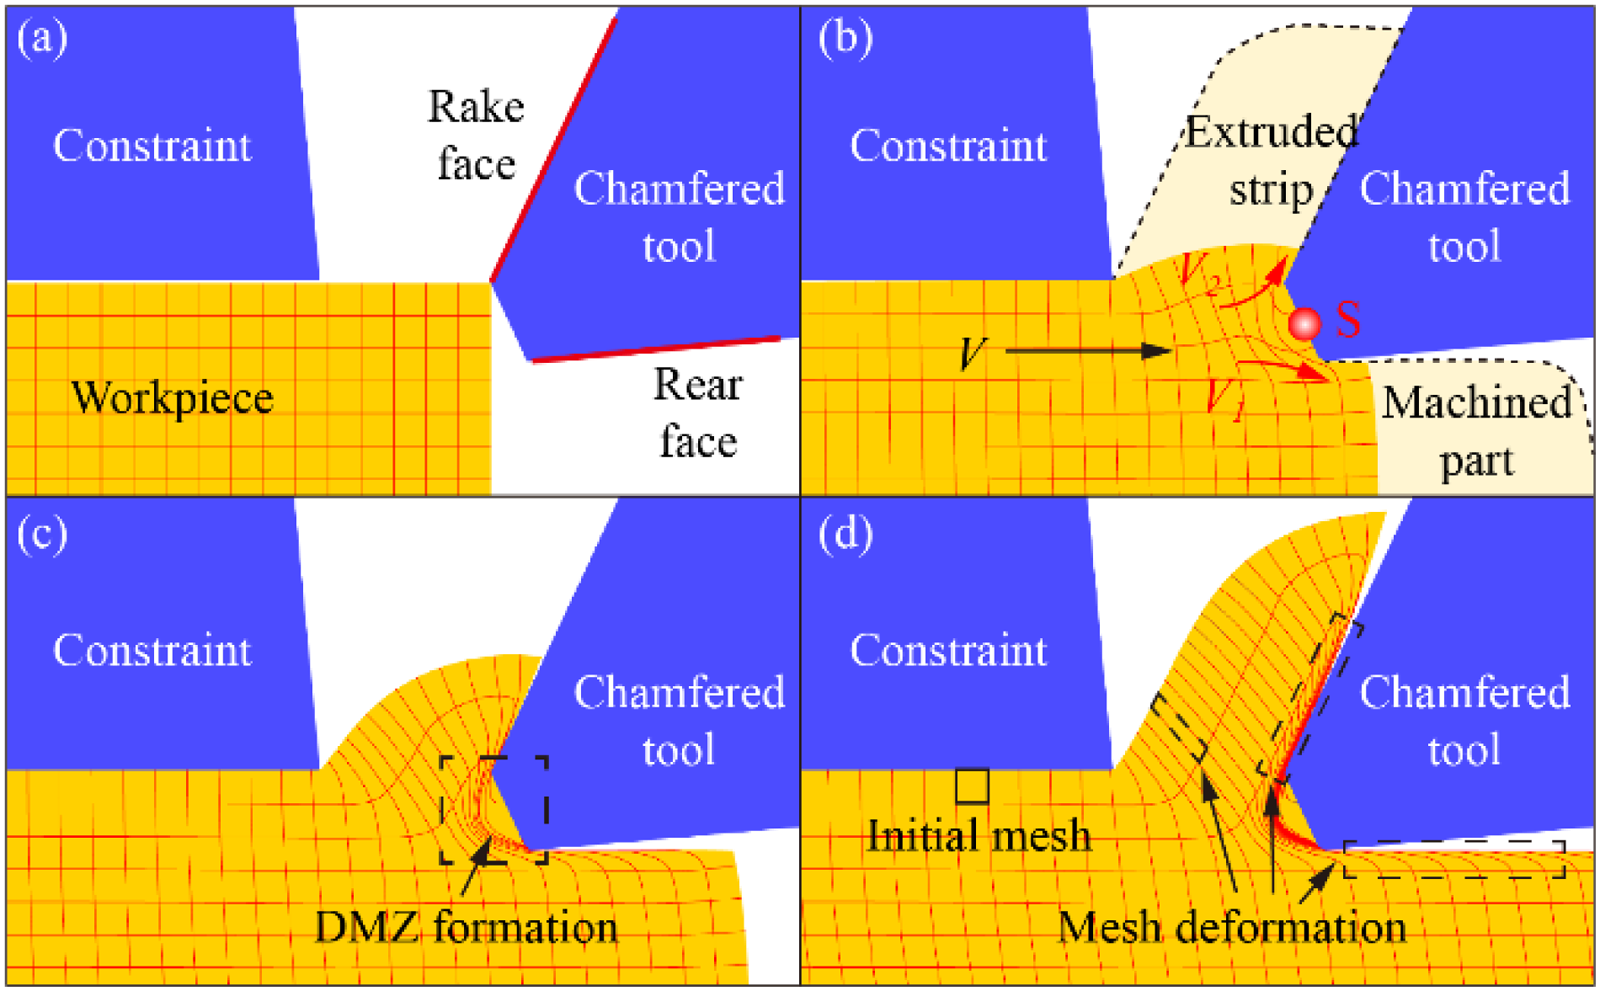
Different stages of strip formation in CT-EM.
As shown in Figure 8, the tool-strip contact length could be divided into strip contact length with tool rake face and with chamfer edge (line GH). Figure 8(a) displayed the contact length at different γ2 and the total contact lengths were 0.91 mm,0.84 mm,0.82 mm, and 0.66 mm when γ2=–5°, −15°, −25°, and −35°, respectively. Additionally, the tool rake face contact length reduced from 0.61 mm to 0.29 mm and the GH length increased from 0.30 mm to 0.37 mm. As γ2 decreased, the chamfer GH length increased, the contact length between the strip and tool rake face decreased. Meanwhile, the total contact length decreased, indicating that the contact length of tool rake face was the main factor affecting the total contact length. As depicted in Figure 8(b), the contact length at different wc and the total contact lengths were 0.45 mm,0.57 mm,0.82 mm, and 1.17 mm when wc = 0.05 mm, 0.2 mm, 0.35 mm, and 0.5 mm, respectively. With increasing wc, both tool rake face contact length and GH length increased, revealing that proper chamfer width could reduce the contact area and decrease tool wear.
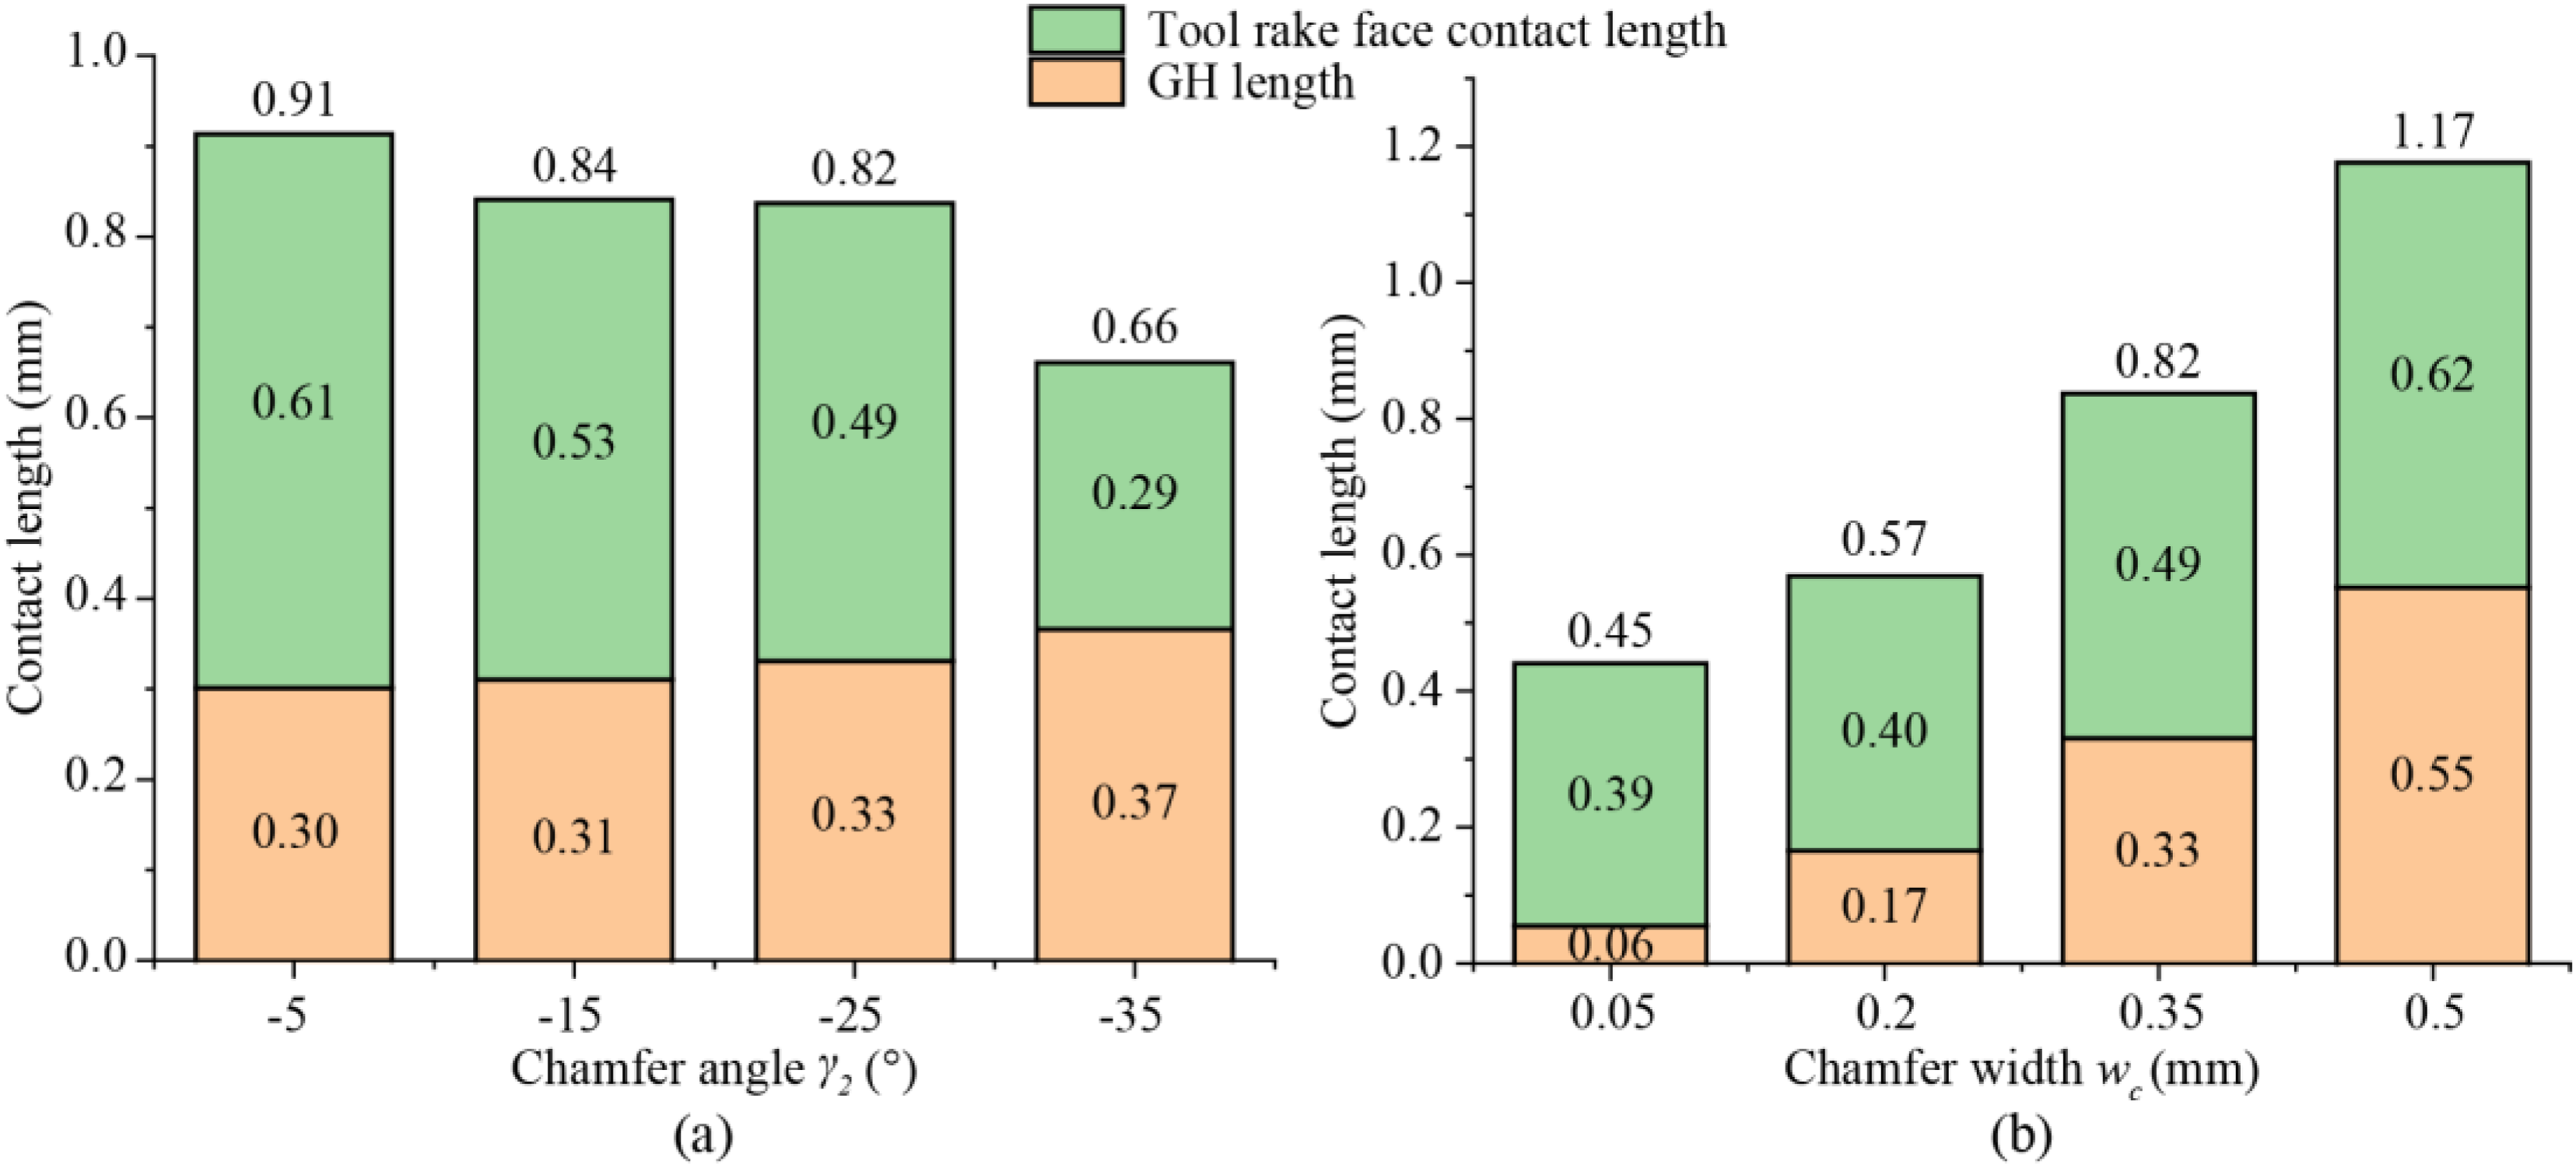
The tool-strip contact length in CT-EM under (a) different γ2 and (b) different wc.
Figure 9(a) to (d) illustrated the temperature distribution at different γ2. As γ2 decreased, the material plastic deformation increased, and the cutting heat increased, leading to rising cutting temperatures. When γ2 = –5°, −15°, −25°, and −35°, the average temperatures of the strip were 49.3°C, 53.8°C, 54.6°C, and 57.8°C, respectively. Frictional heat generation was significant in DMZ due to the most intense material deformation, leading to the highest temperatures distributed around the DMZ. The temperature distribution at different wc was shown in Figure 9(e)-(h), and the cutting temperature dramatically increased as wc increased. The average temperatures of the strip were 43.2°C, 47.5°C, 54.6°C和 63.9°C when wc = 0.05 mm, 0.2 mm, 0.35 mm, and 0.5 mm, respectively. Changing wc showed a greater increase in cutting temperature compared to γ2, indicating that wc has a more significant effect on cutting heat.
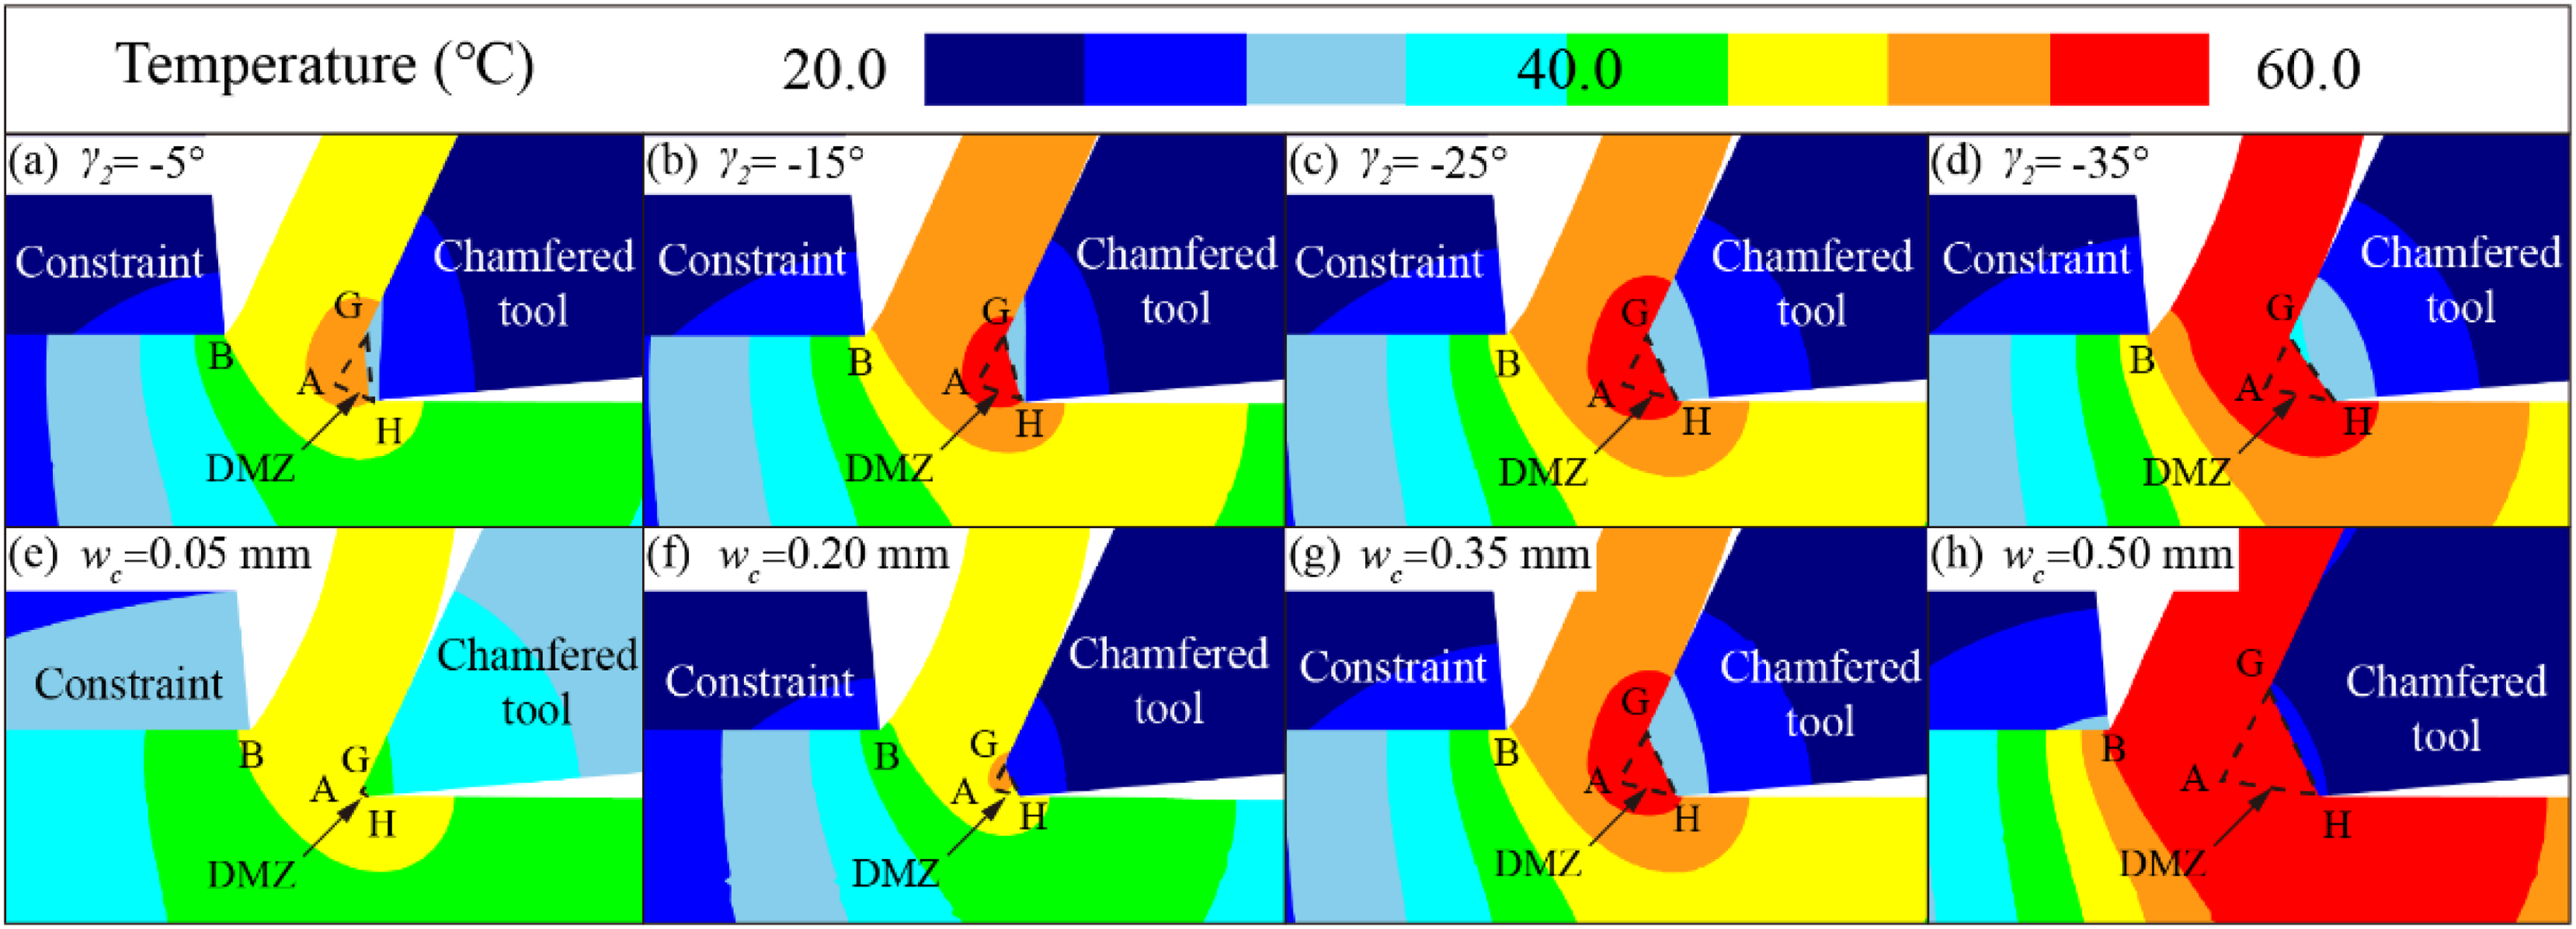
Cutting temperature distribution at different chamfered tool parameters.
The effective strain reflected the degree of material plastic deformation in CT-EM, which elongated or even shattered the grains, thus high strain led to grain refinement. As depicted in Figure 10(a) to (d), the largest effective strain occurred ahead of the chamfer GH, the values were 5.28, 6.9, 7.84, 8.1 when γ2=–5°, −15°, −25°, and −35°, respectively. The large strain in DMZ was attributed to heavy material accumulation and severe extrusion and friction in this region. With decreasing γ2, the stagnation point (S1) tended to move towards point G, resulting in less material flowing to the extruded strip and more material flowing to the machined surface. Consequently, the zone II thickness decreased, and the zone III thickness increased, while the effective strains were smaller in zones I and IV because they were far from the DMZ.
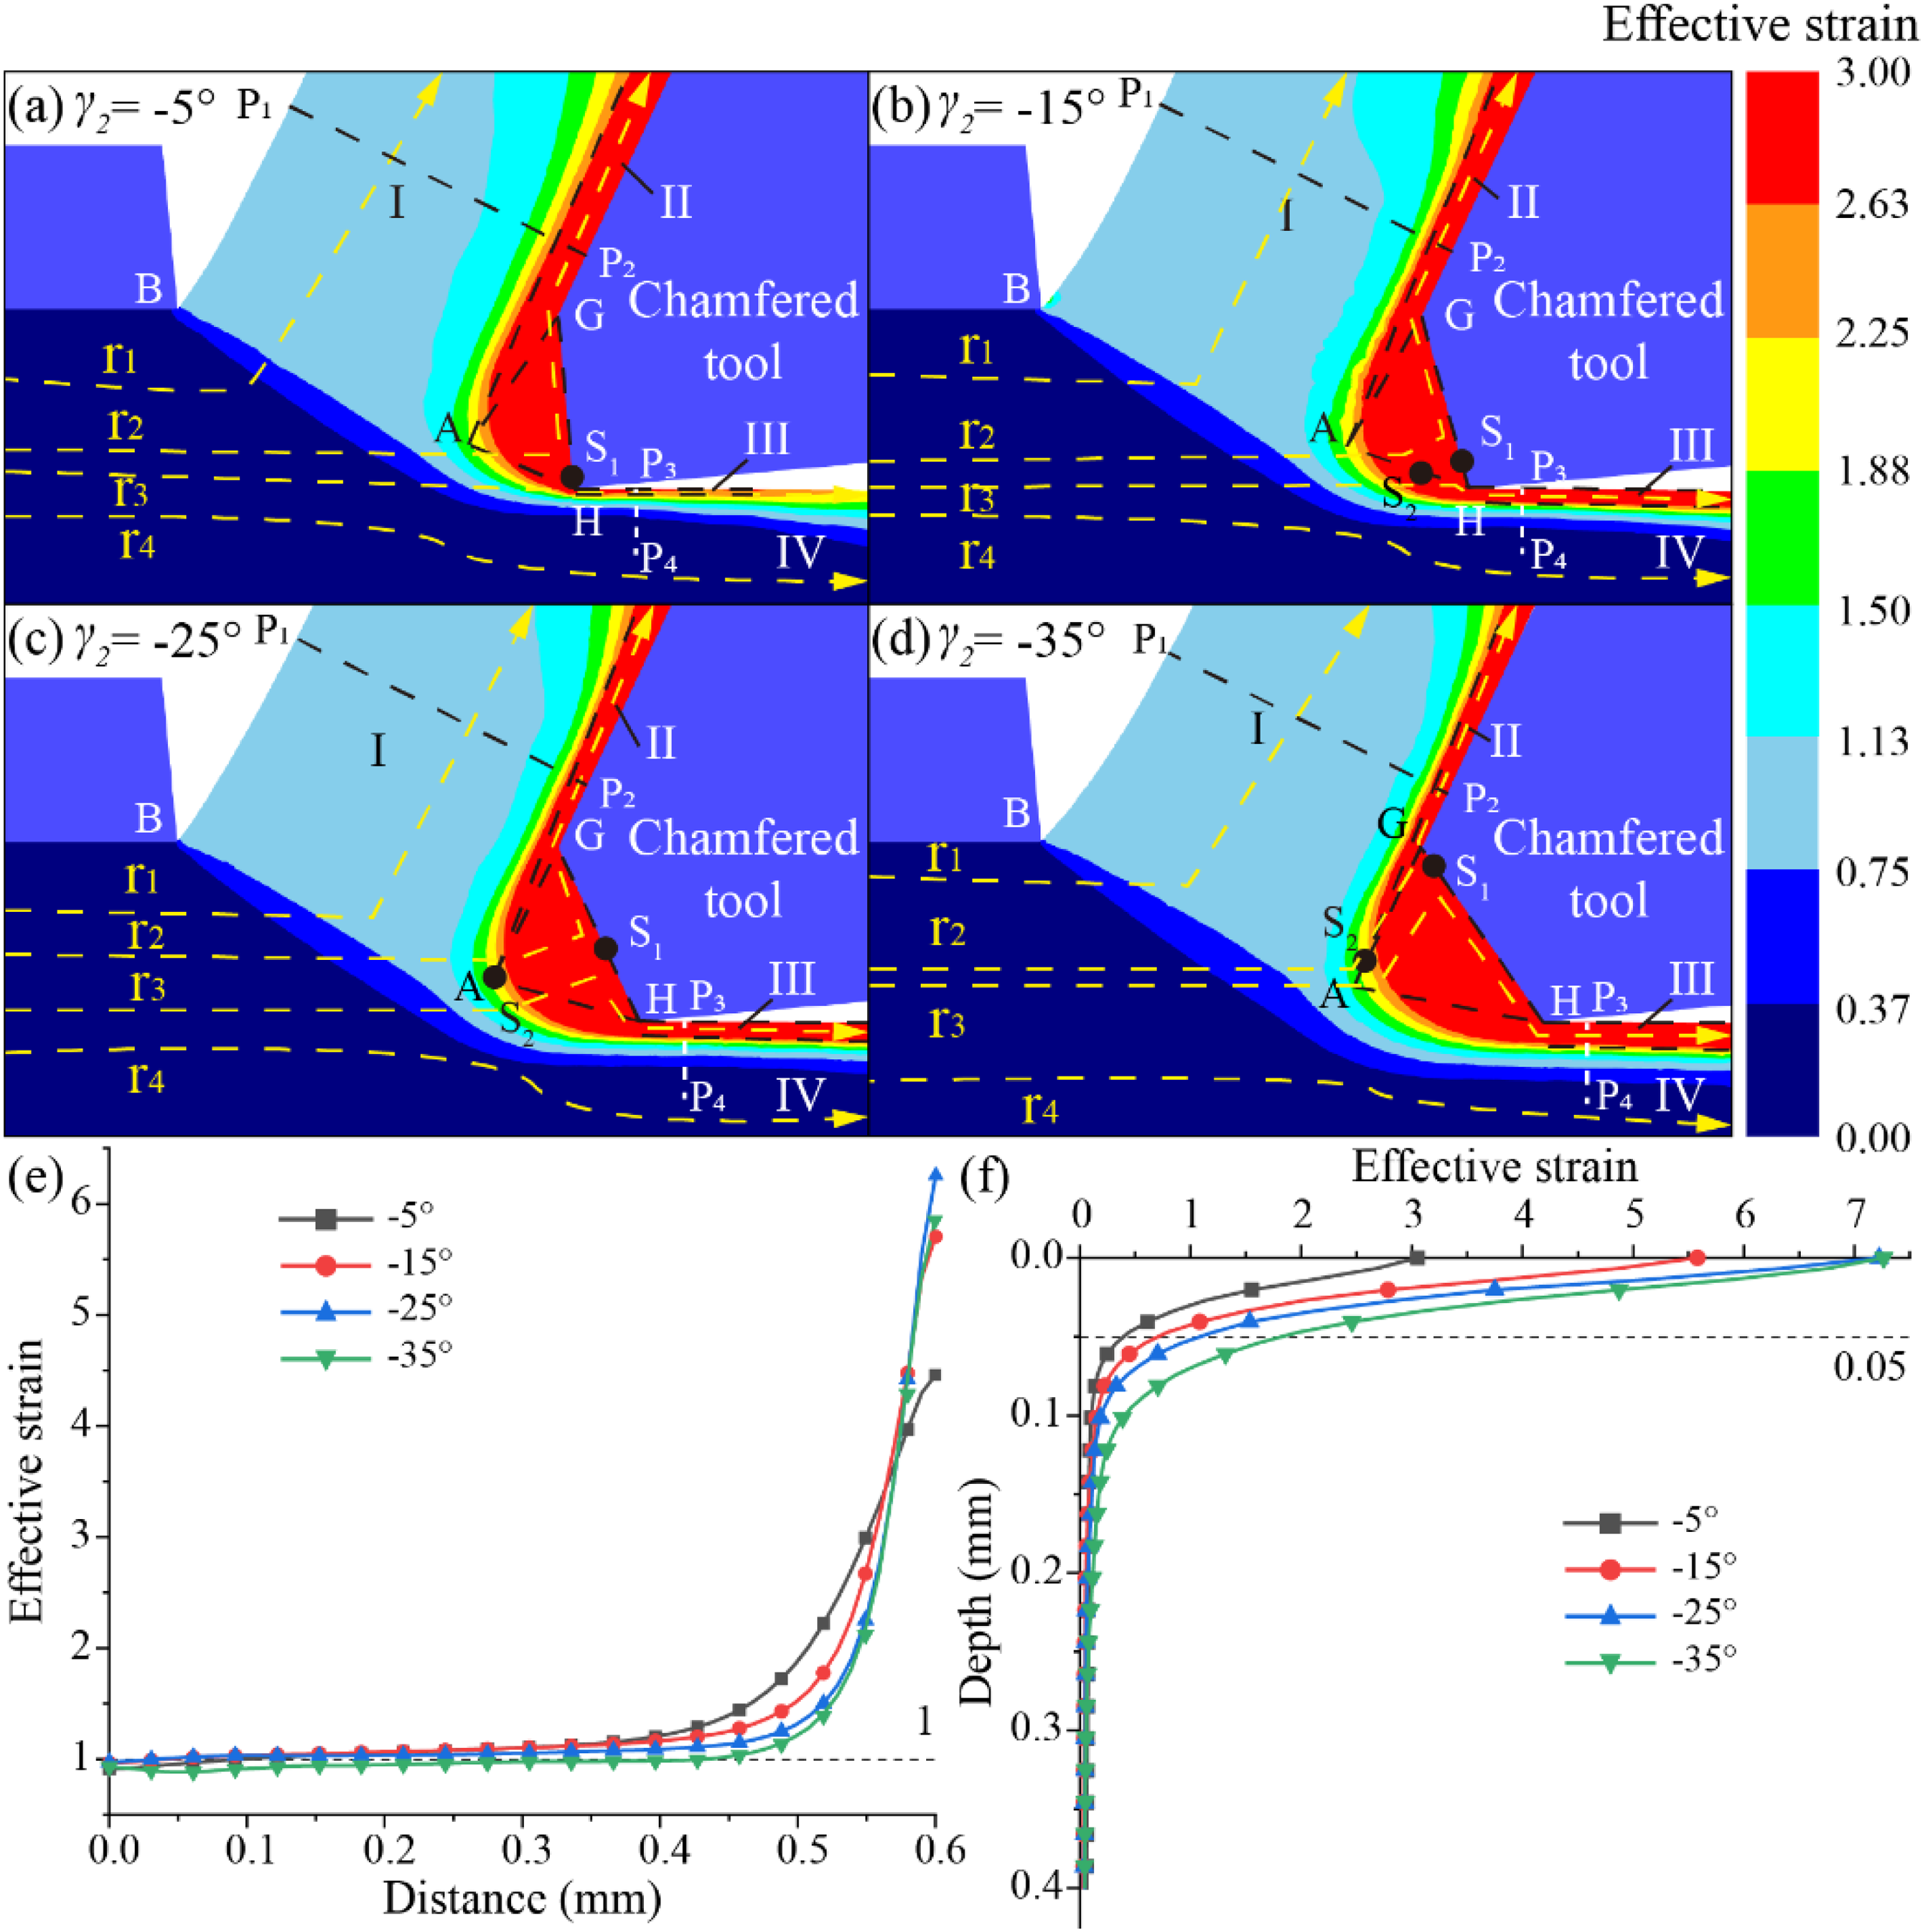
Simulation results of effective strain at different γ2: (a)-(d) distribution diagrams, (e) variation curves along trajectory P1P2, and (f) trajectory P3P4.
Figure 10(e) displayed strain variation along track P1P2, which rose slowly before the distance of 0.5 mm, and then rose sharply. As γ2 decreased from −5° to −25°, the maximum effective strain tended to increase, while it dropped when γ2 was −35°. This was because when γ2 = –35°, the stagnation point S1 was close to point G, resulting in little influence of DMZ on the material before flowing into zone II, and thus the maximum effective strain decreased instead of increasing. Along track P3P4 in the machined surface, the effective strain tended to decrease with depth, as shown in Figure 10(f). With decreasing γ2, the effective strain on the machined surface (point P3) increased, while the effective strain at point P4 all converged to 0.
Figure 11(a) to (d) exhibited the effective strain distribution at different wc, the maximum effective strains were 5.31, 7.35, 7.84, and 8.06 when wc =0.05 mm, 0.2 mm, 0.35 mm, and 0.5 mm, respectively. Due to the special structure of the chamfered tool, DMZ formed, and in which the effective strain was the largest. As wc increased, the DMZ area increased, representing a wider effect range of DMZ and more drastic material deformation. Similarly, point S1 divided the material flow into two directions, flowing to zone II and zone III, respectively. As shown in Figure 11(e), along the track P1P2, the effective strain variation increased slowly before the distance of 0.5 mm and then grew sharply. The maximum effective strain of the strip was at point P2, and its value increased with increasing wc. Along track P3P4 in the machined surface, the effective strain tended to decrease with depth, as shown in Figure 11(f). As wc increased, the effective strain at point P3 increased, while it tended to 0 at point P4.
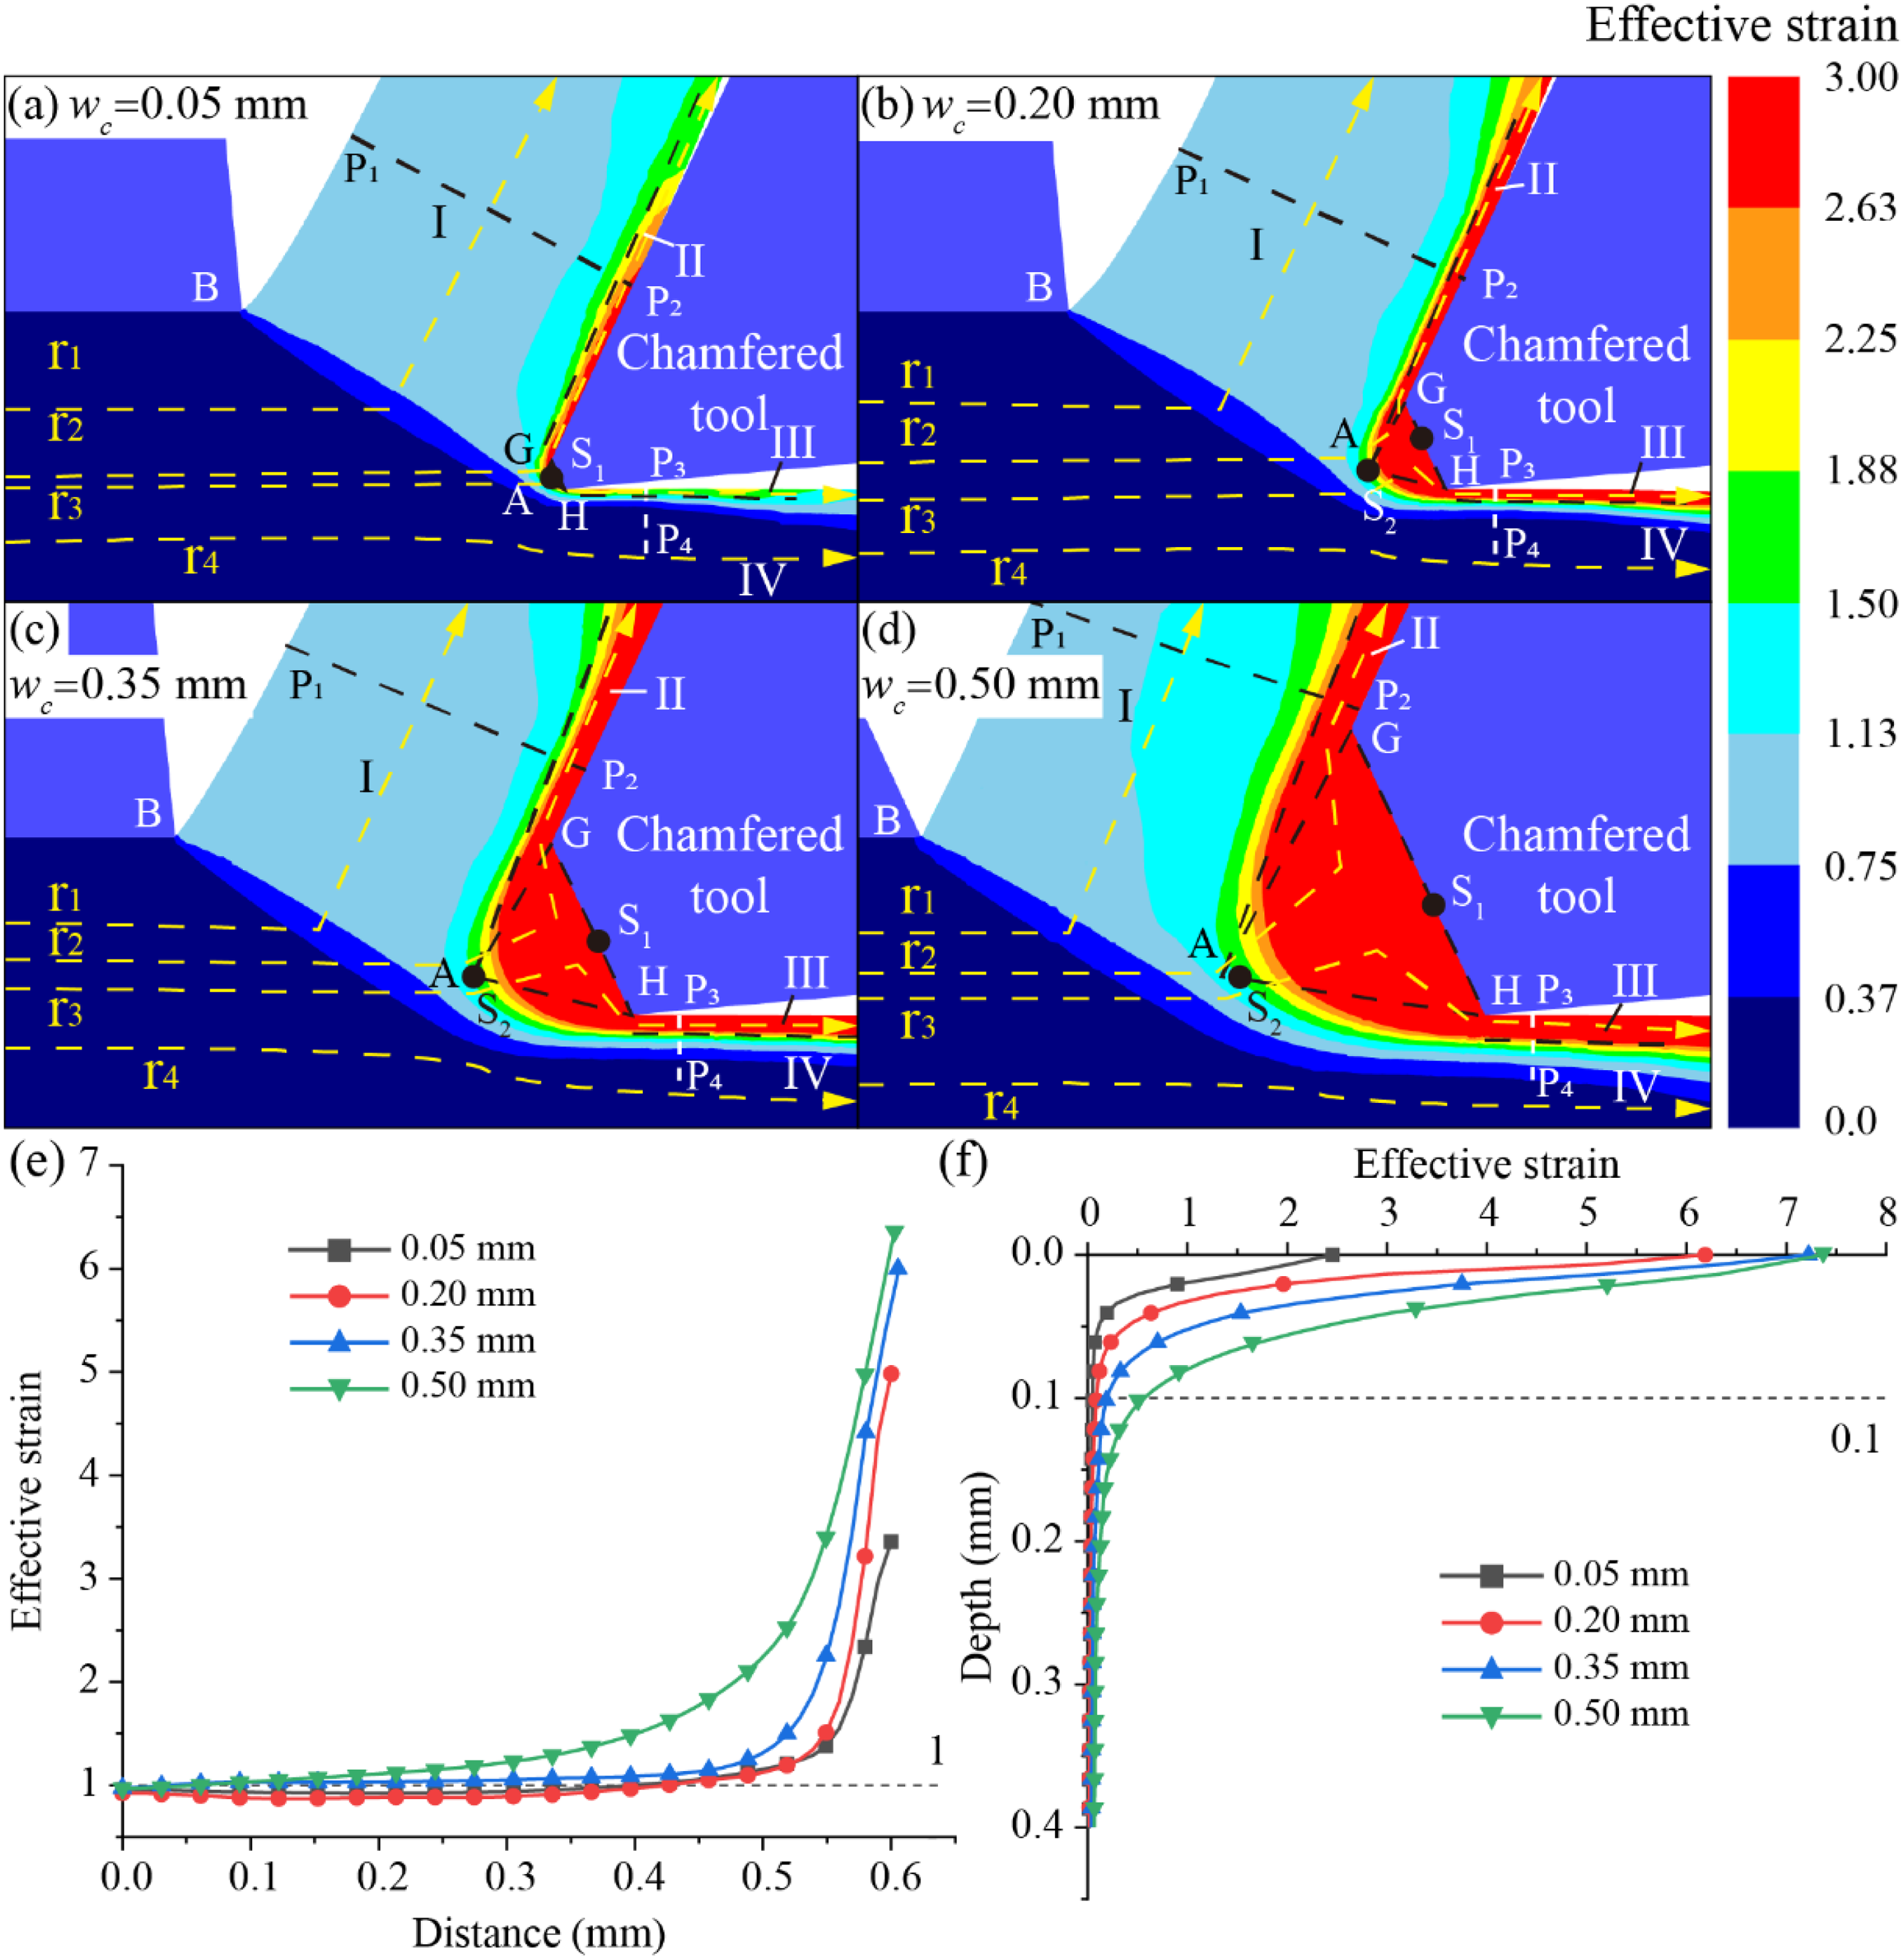
Simulation results of effective strain at different wc: (a)-(d) distribution diagrams, (e) variation curves along trajectory P1P2, and (f) trajectory P3P4.
Microstructures and mechanical properties
Figure 12 showed the metallographic diagrams of strips fabricated by CT-EM under different chamfered tool parameters, where each strip was divided into strip top (constraint side), strip middle, and strip bottom (tool side). There are several defects at the strip top, and the strip bottom could be subdivided into a low strain region (I) and a high strain region (II) based on effective strain level. Because of the intense extrusion and cutting by the chamfered tool and the significant influence of DMZ, the grains in Zone II were further fragmented and refined, while those in Zone I were simply elongated.

Metallographic diagrams of the fabricated strips under different parameters.
As exhibited in Figure 12, there were varying degrees of defects at the chip top, such as cracks and burrs. When wc = 0.35 mm, as depicted in Figure 12(a) and (b), the maximum crack depth at strip top increased from 64.10 μm to 144.22 μm, and the zone II thickness at strip bottom reduced from 62.63 μm to 42.03 μm when γ2 decreased from −5° to −25°. It matched the effective strain simulations in Figure 10(a) and (c), where the reduced γ2 decreased high strain region (II) thickness, but increased shear strain (according to white flow line deflection). As γ2 decreased, the constraint effect on the strip shape regularization weakened and was accompanied by tearing, leading to the formation of deeper cracks. When γ2 = –25°, as presented in Figure 12(b) and (c), the maximum crack depth at strip top increased from 28.37 μm to 144.22 μm, and the zone II thickness at strip bottom increased from 35.33 μm to 42.03 μm when wc grew from 0.05 mm to 0.35 mm. The effect of chamfer tool was more pronounced with increasing wc, resulting in multiple and deep top cracks, while the enlarged DMZ area increased effective strain and zone II thickness. Additionally, as γ2 decreased and wc increased, the length of burrs on the chip surface tended to increase.
To deeply explore the microstructure of the strip prepared by CT-EM, the observation regions in Figure 12(b) were selected for EBSD. Figure 13 showed EBSD results of the CT-EM sample, where the inverse pole figures (IPFs) and grain size distribution of Zone I and II reflected different strain levels. Due to the intense friction and extrusion in DMZ, the material close to the extrusion channel was violently deformed and then flowed into Zone II, resulting in larger strain and finer grains. As depicted in Figure 13(a) and (b), the grain orientation in Zone I was largely focused on <101 > and <001 > directions, while that in Zone II focused mainly in the <111 > direction. Figure 13(c) and (d) showed that the average grain size of Zone I was 2.601 μm, which was 44.2% higher than that of Zone II (1.452 μm). Compared with the initial annealed pure copper (approximately 60 μm), the grains in Zones I and II were effectively refined. Additionally, the proportions of high-angle grain boundaries (HAGBs, 2°-15°) in the two regions were 86.3% and 96.9%, respectively, as shown in Figure 13(e) and (f).
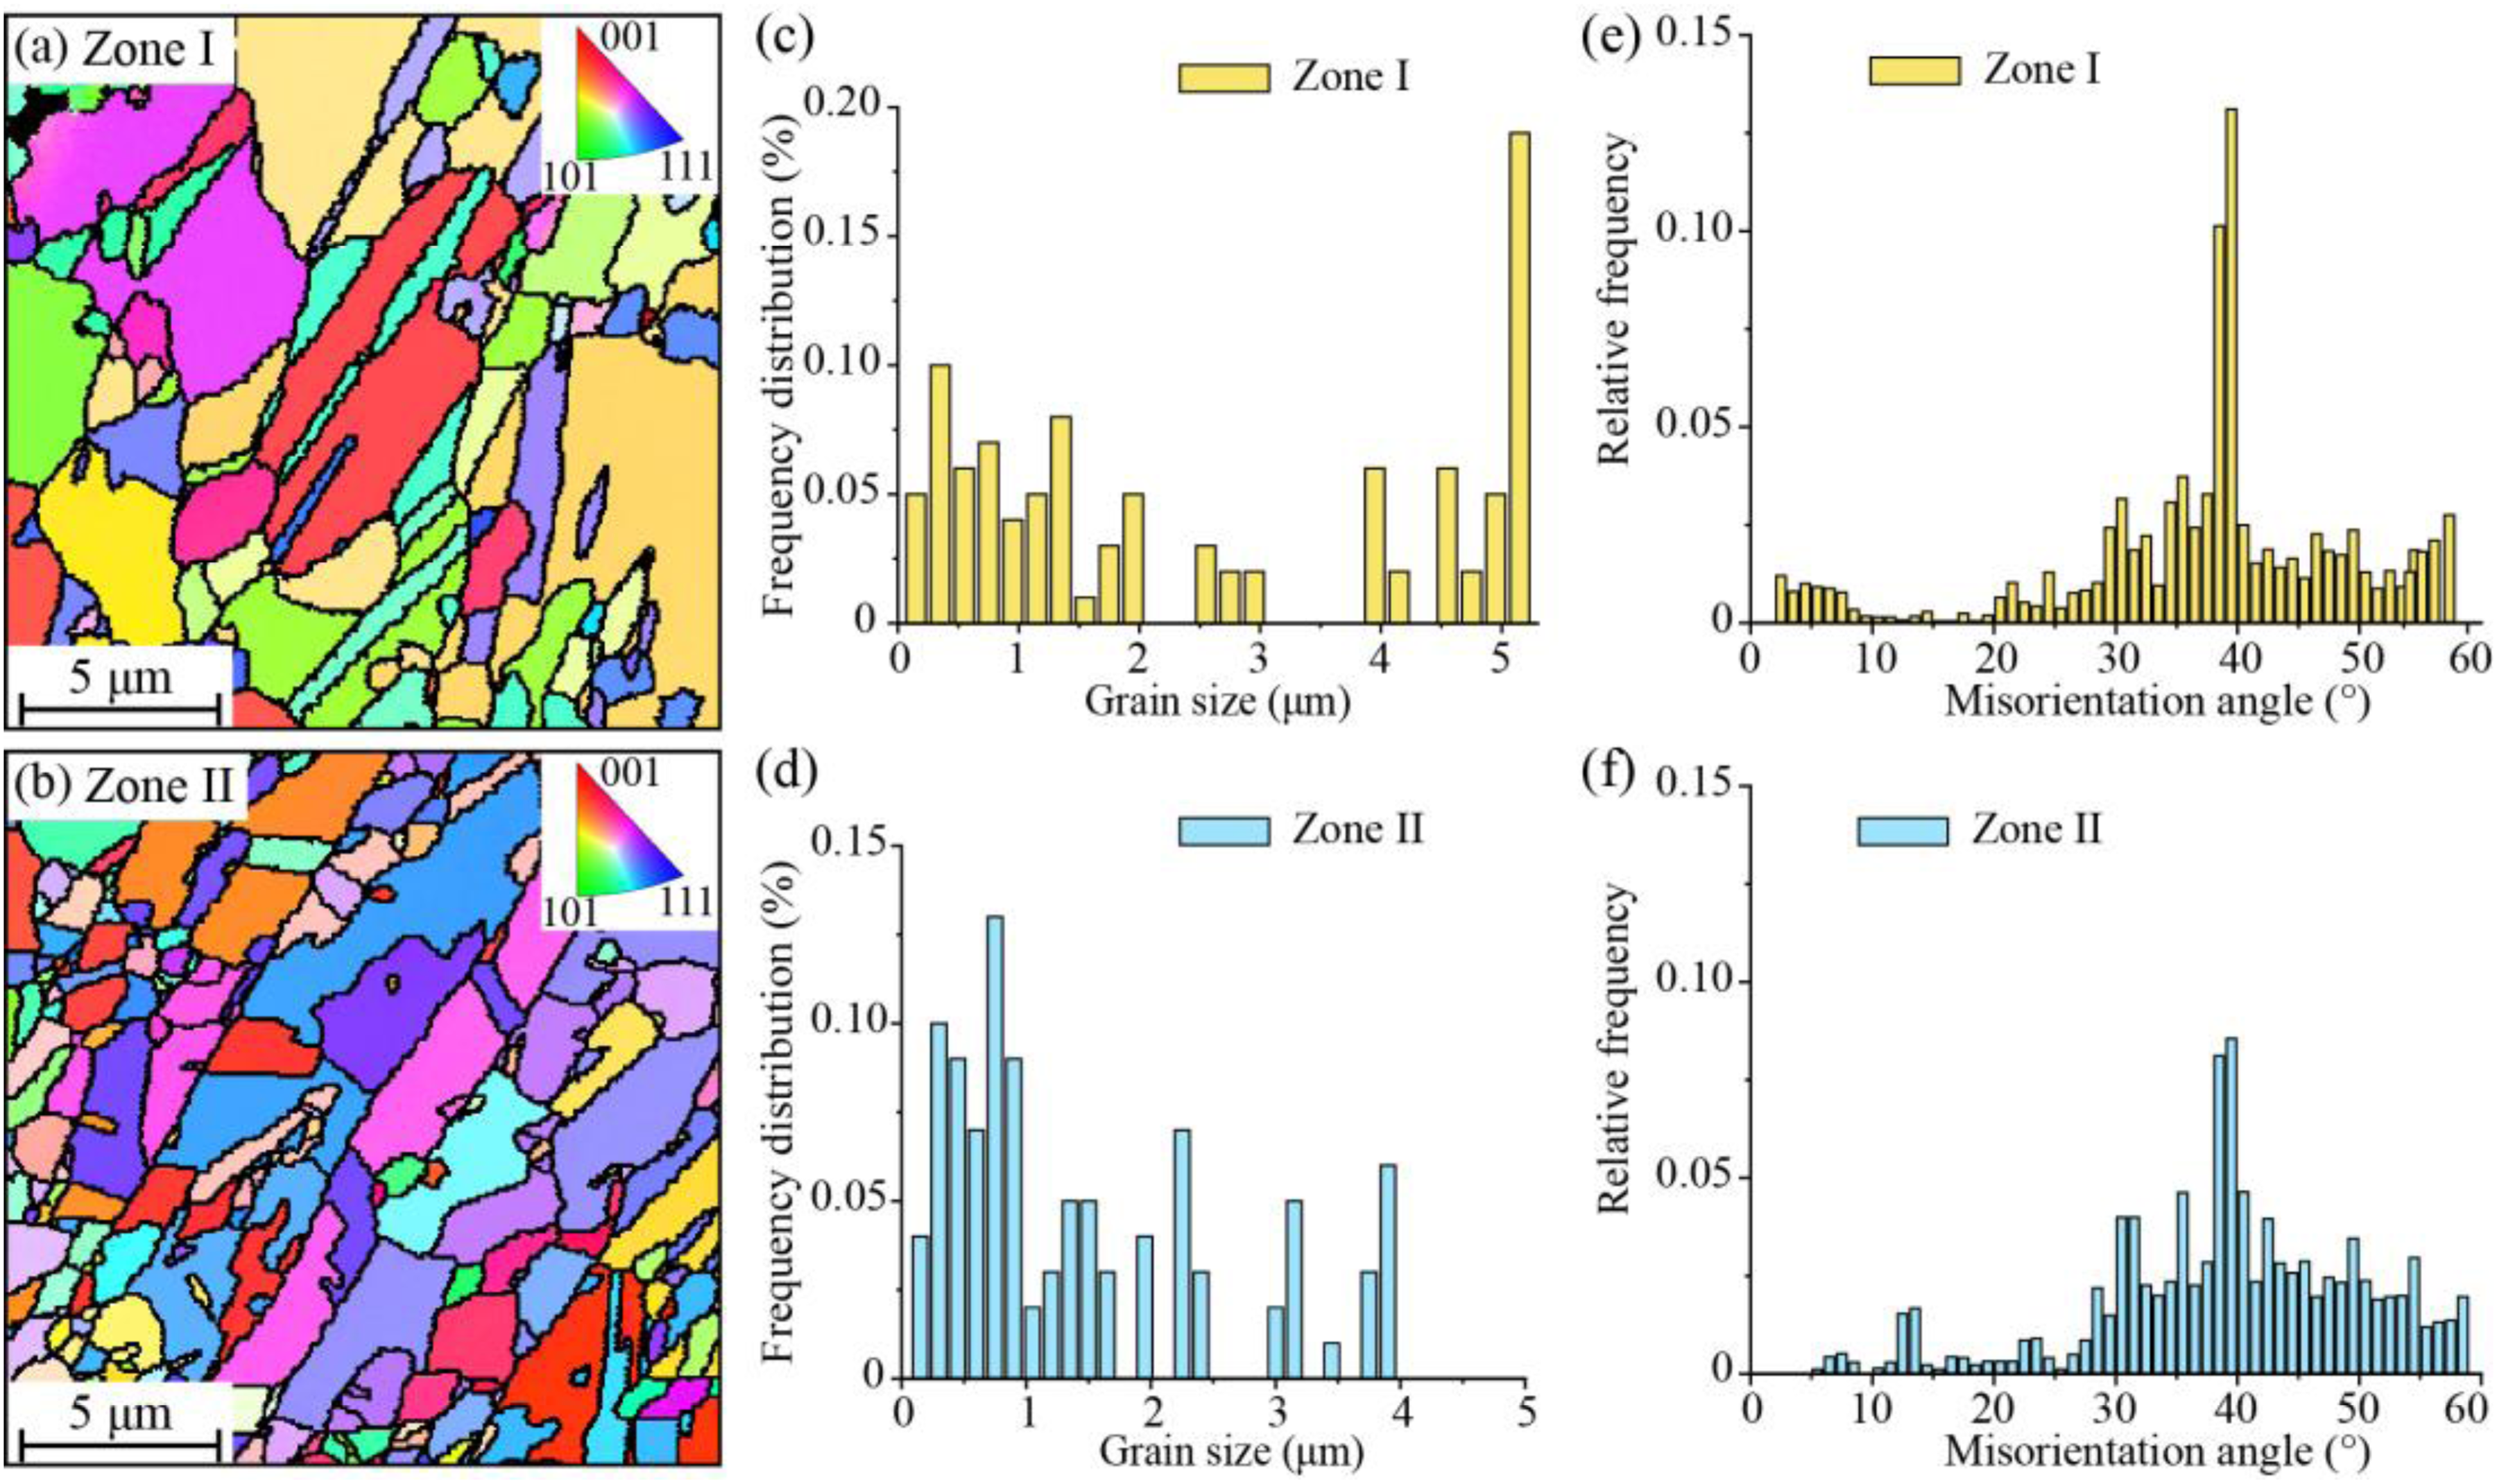
EBSD results of the strip at wc = 0.35 mm and γ2 = - 25°: (a)-(b) IPFs, (c)-(d) grain size distribution, (e)-(f) misorientation angle distribution.
During the CT-EM process, the initial coarse grains were continuously elongated and deformed under the imposed strain. As the strain increased, the dislocation sub-boundaries formed at low strain gradually transformed into finer grains with high-angle boundaries, which was known as continuous dynamic recrystallization (CDRX). The fine grains with HAGBs observed in Zones 1 and 2 were transformed from subgrains through dislocation accumulation. Therefore, CDRX was identified as the primary grain refinement mechanism, driven by high shear strain imposed by the DMZ. Since the materials all underwent severe deformation, this coincided with the grain refinement mechanism involved in most SPD processes reported previously.40–42
Figure 14 demonstrated the distribution of Vickers hardness with length from the constraint side for different parameters. The hardness of the initial sample was 68.1 HV, and CT-EM effectively improved the hardness. The average hardnesses of fabricated strips were 132.71 HV when γ2 = −5° and wc = 0.35 mm, 141.05 HV when γ2 = –25° and wc = 0.35 mm, and 130.68 HV when γ2 = –25° and wc = 0.05 mm. With decreasing γ2 and increasing wc, the average hardness of the strip improved and the hardness near tool side was higher than that near the constraint side. This is due to the material near tool side being strongly affected by DMZ, with stronger friction and extrusion effects, leading to larger strain and finer grains. Accordingly, the hardness distribution agreed with the results of effective strain and microstructures.
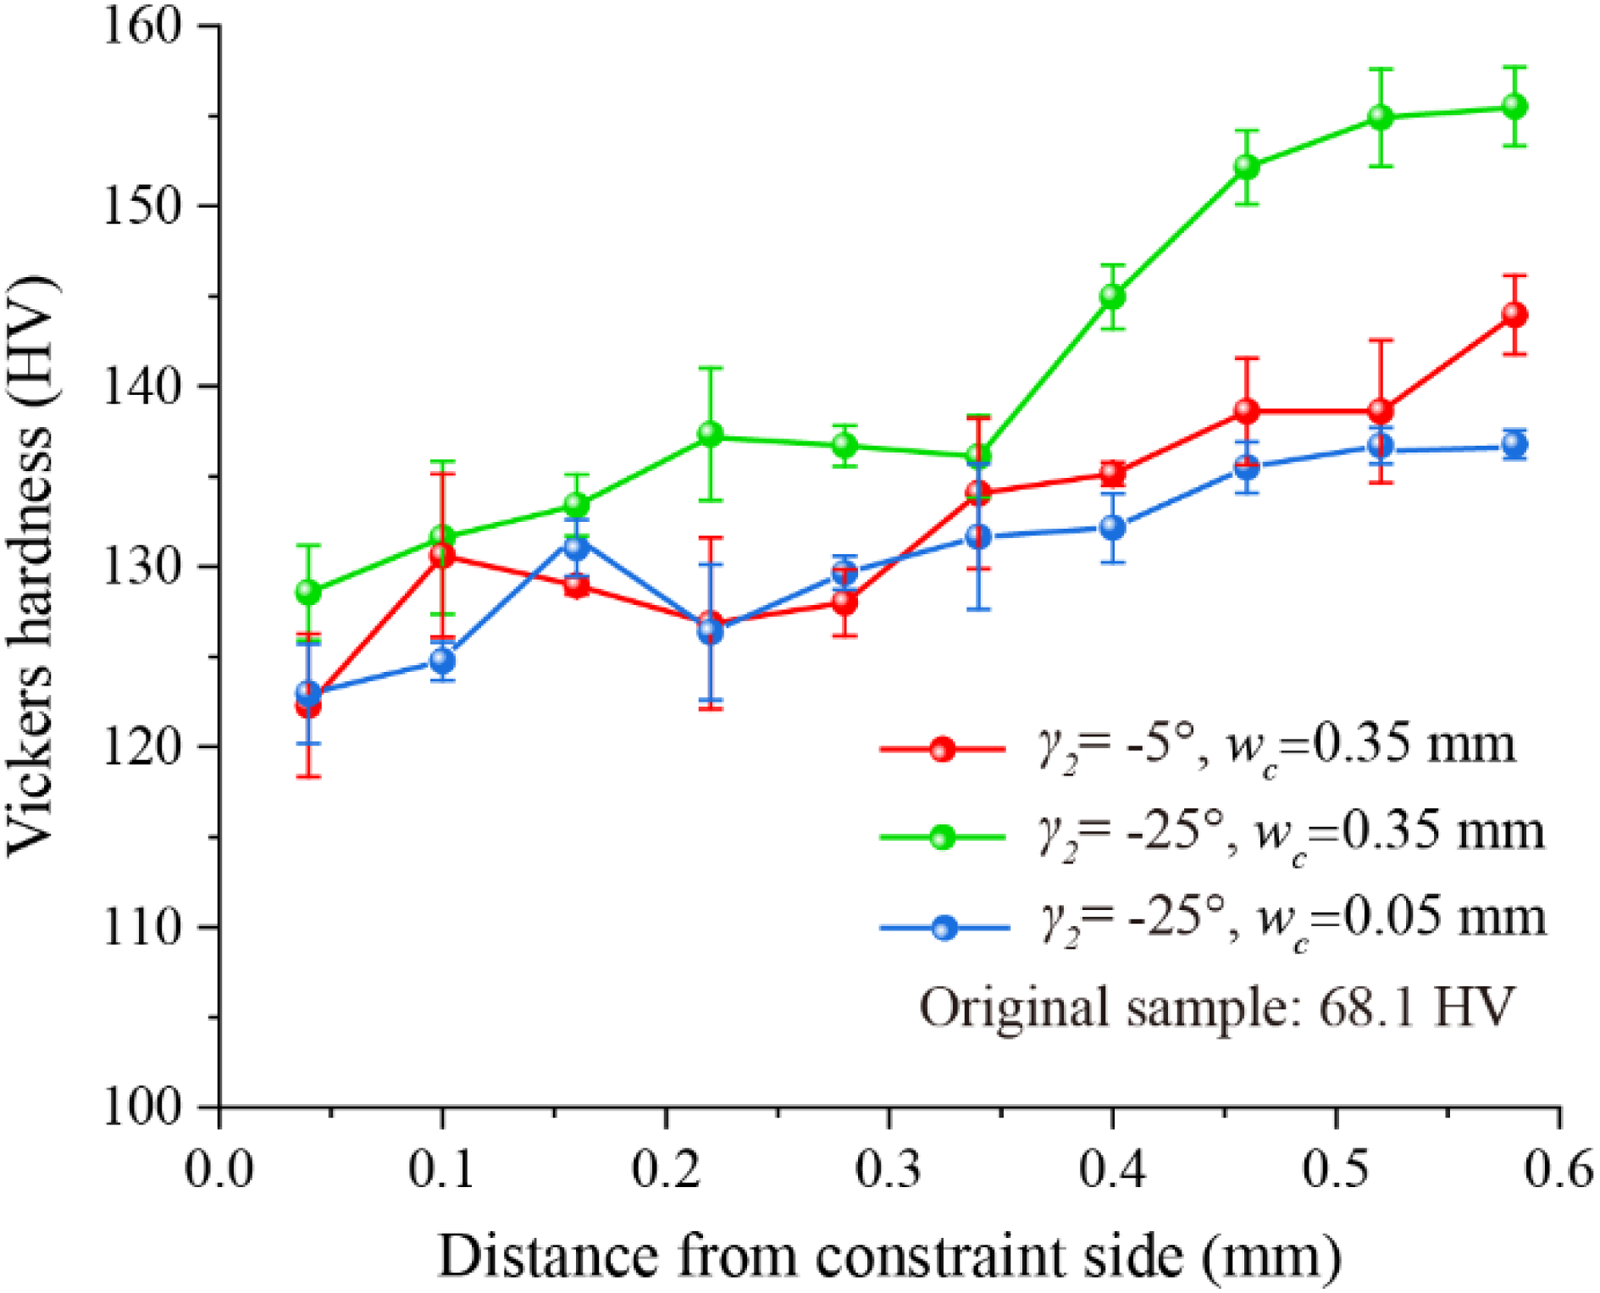
The hardness distribution with length from the constraint side for different parameters.
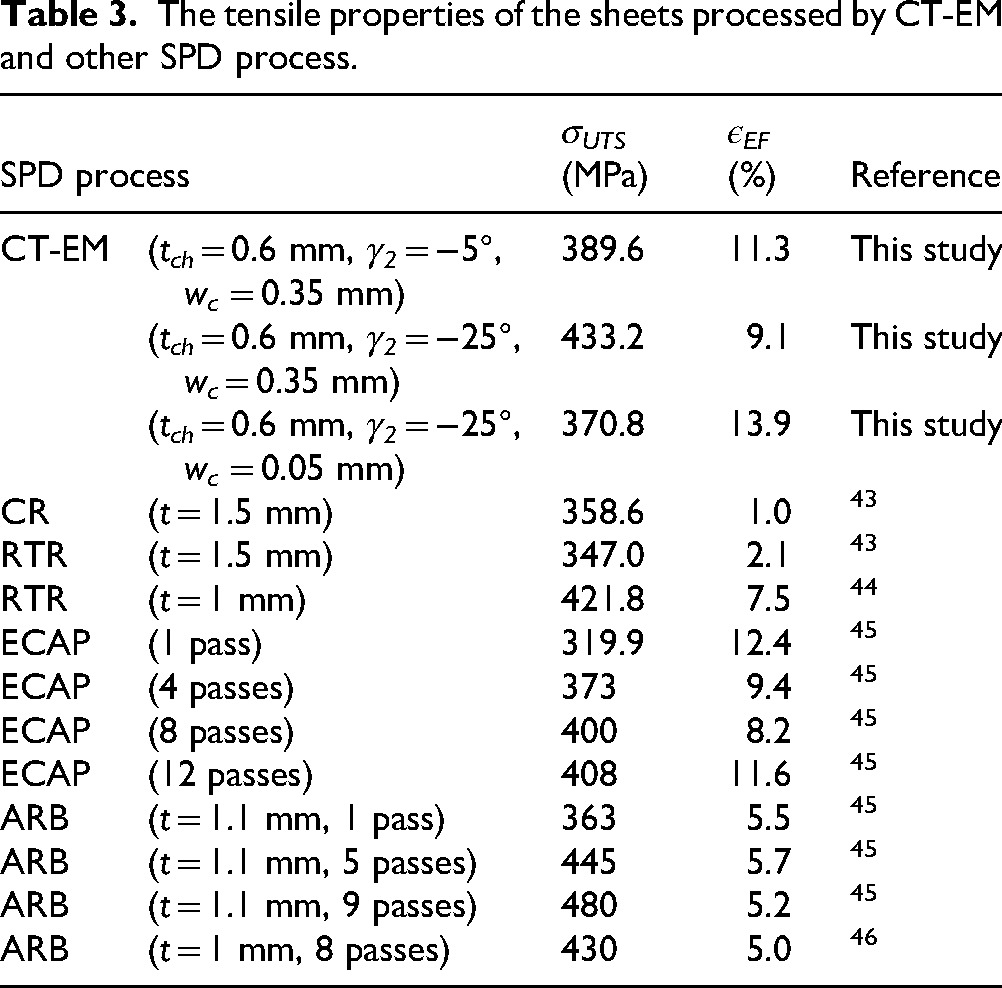
To further investigate the tensile properties of prepared strips for different parameters, Figure 15(a) illustrated the stress-strain curves and Figure 15(b) exhibited the corresponding tensile properties. Compared to the tensile properties of prepared strips, the ultimate tensile strength (σUTS) of original samples was the minimum (204.4 MPa) and the elongation at fracture (εEF) was the maximum (66.9%). As γ2 decreased from −5° to −25°, σUTS increased from 389.6 MPa to 433.2 MPa and εEF dropped from 11.3% to 9.1%. As wc grew from 0.05 mm to 0.35 mm, σUTS increased from 370.8 MPa to 433.2 MPa and εEF reduced from 13.9% to 9.1%. With decreasing γ2 and increasing wc, the grain refinement and dislocation density grew, and microhardness enhanced, resulting in improved σUTS and reduced εEF.
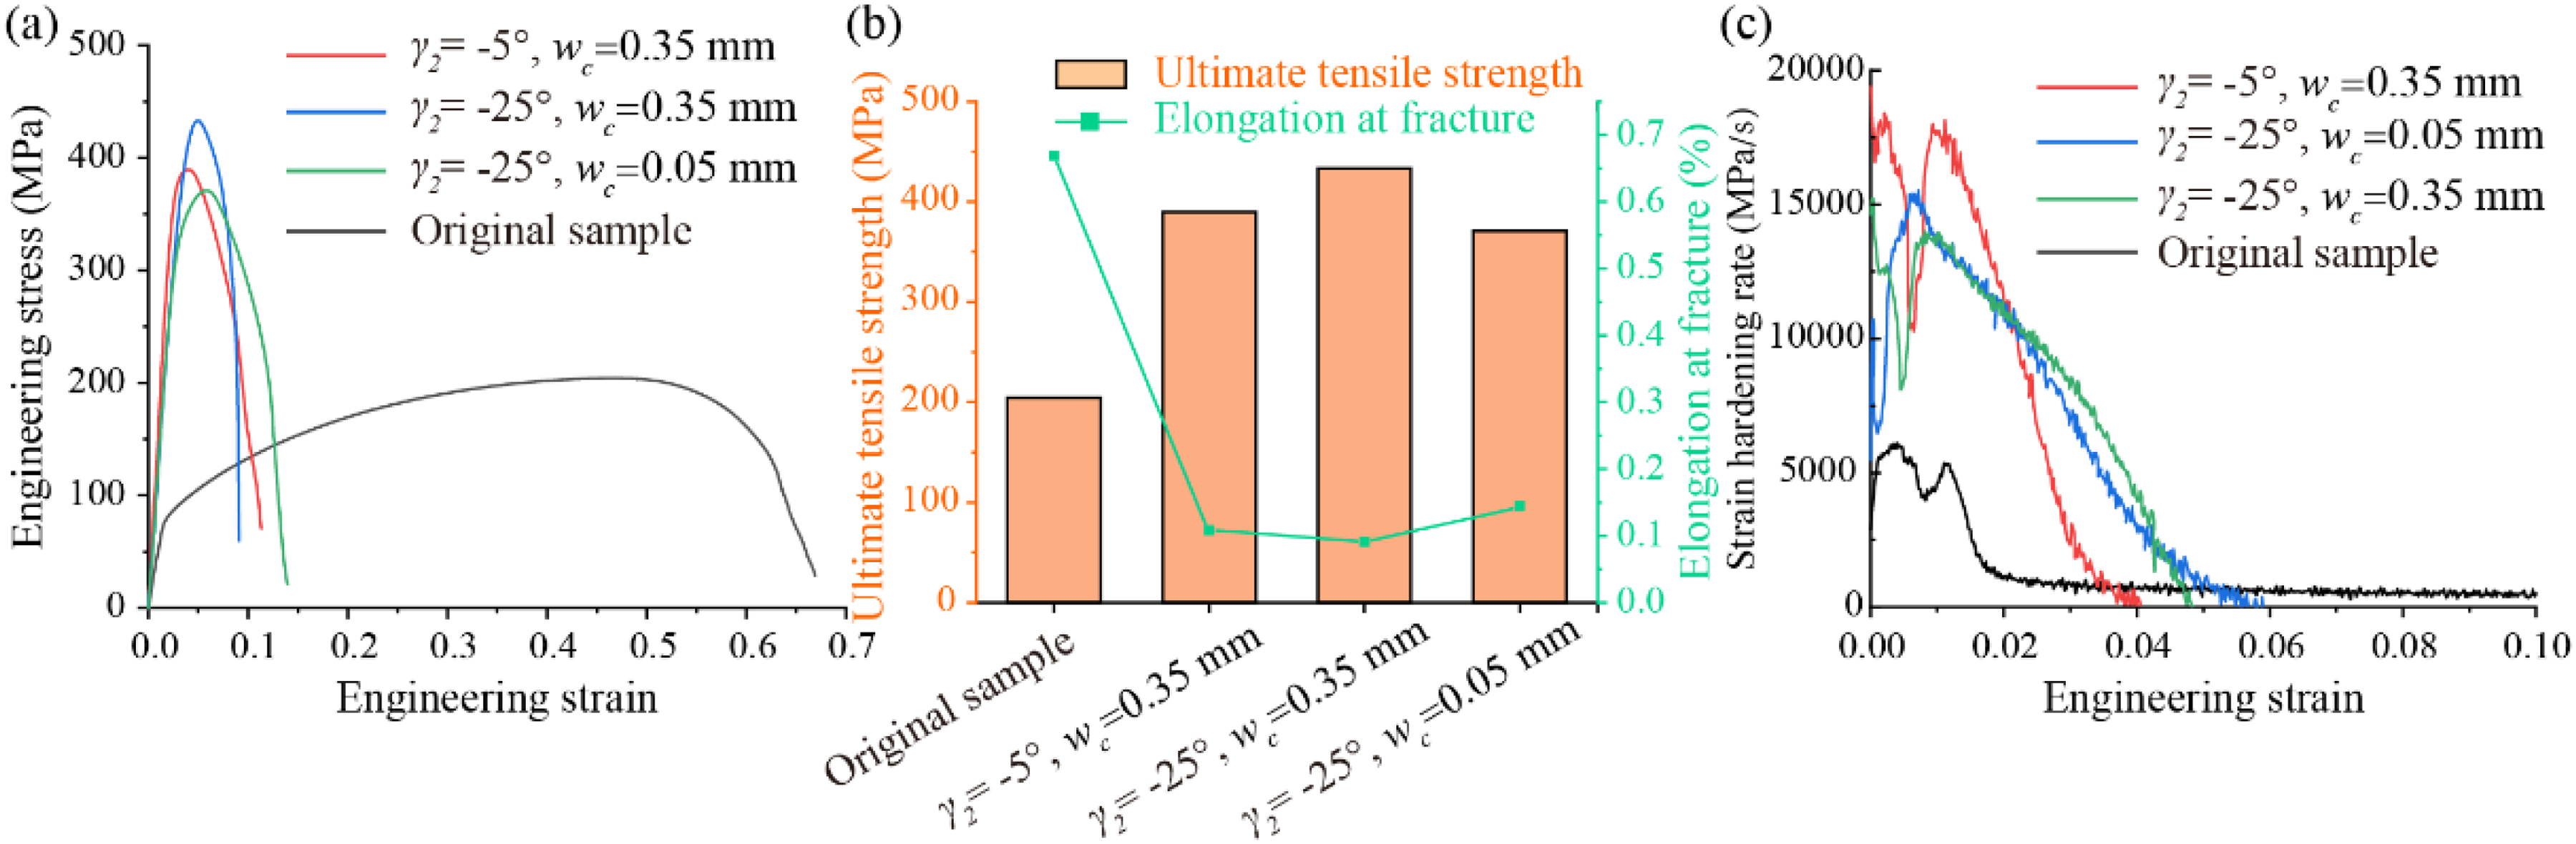
Tensile results for different parameters: (a) stress-strain curves, (b) detailed properties, and (c) strain-hardening rate-engineering strain curves.
As shown in Figure 15(c), the strain hardening rates (n) of the strips prepared by CT-EM were greater compared to original samples when the engineering strain was 0.15, and they all decreased rapidly thereafter. Since the higher n value was favorable for suppressing local deformation and delaying necking, it indicated the best plasticity of the original sample, whereas n values of strips prepared by CT-EM under different parameters all dropped to 0 before the engineering strain of 0.06. To obtain strips with better performances, smaller γ2, and larger wc are preferred in the design of chamfer tool parameters, sacrificing only a little plasticity with higher strength.
The decrease in grain refinement led to lower ultimate tensile strength, while ductility and strength were inversely related. That was, the increase in strength was necessarily at the expense of ductility. Tensile properties of copper sheet processed by some other techniques were shown in Table 3. These samples showed limited ductility, this was because ultrafine-grained structures exhibited high strength characteristics. The strips prepared by CT-EM sample showed higher ductility than ultrafine-grained counterpart. In addition to fine grain in the strips prepared by CT-EM process, the presence of coarse grains allowed the sample to retain a certain degree of ductility. Thus, the strips prepared by CT-EM exhibited higher ductility than others.
The tensile properties of the sheets processed by CT-EM and other SPD process.
Investigation of stagnation points in DMZ
There existed some correlation between the stagnation point, DMZ, and the material velocity, as shown in Figure 16, so DMZ could be investigated by the flow velocity distribution ahead of the chamfer. Since the DMZ shape in the simulation was approximate to a triangle, the region AGH was used to represent the DMZ in Figure 16(a) to (d). To better analyze the diversion effect of the chamfer tool, the inflow point (S1) and stagnation point (S2) were marked on the AGH boundary. The white line between S1 and S2 divided the DMZ into two parts, in which the material flowed to the formed strip and machined surface, respectively. As γ2 decreased from −5°to −35°, the DMZ area grew from 0.027 mm2 to 0.049 mm2, and point S1 tended to approach point G, leading to larger amount of material entering the machined surface. Figure 16(e) and (f) exhibited changes of DMZ shape and point S1 location under different γ2. Lengths of dS1 and dA reduced with decreasing γ2, indicating a gradual shift of the gravity center to side G. Additionally, as γ2 reduced from −5° to −35°, the relative position dS1/dH of stagnation point on chamfer GH decreased from 0.95 to 0.15, showing that more material flowed to the machined surface.
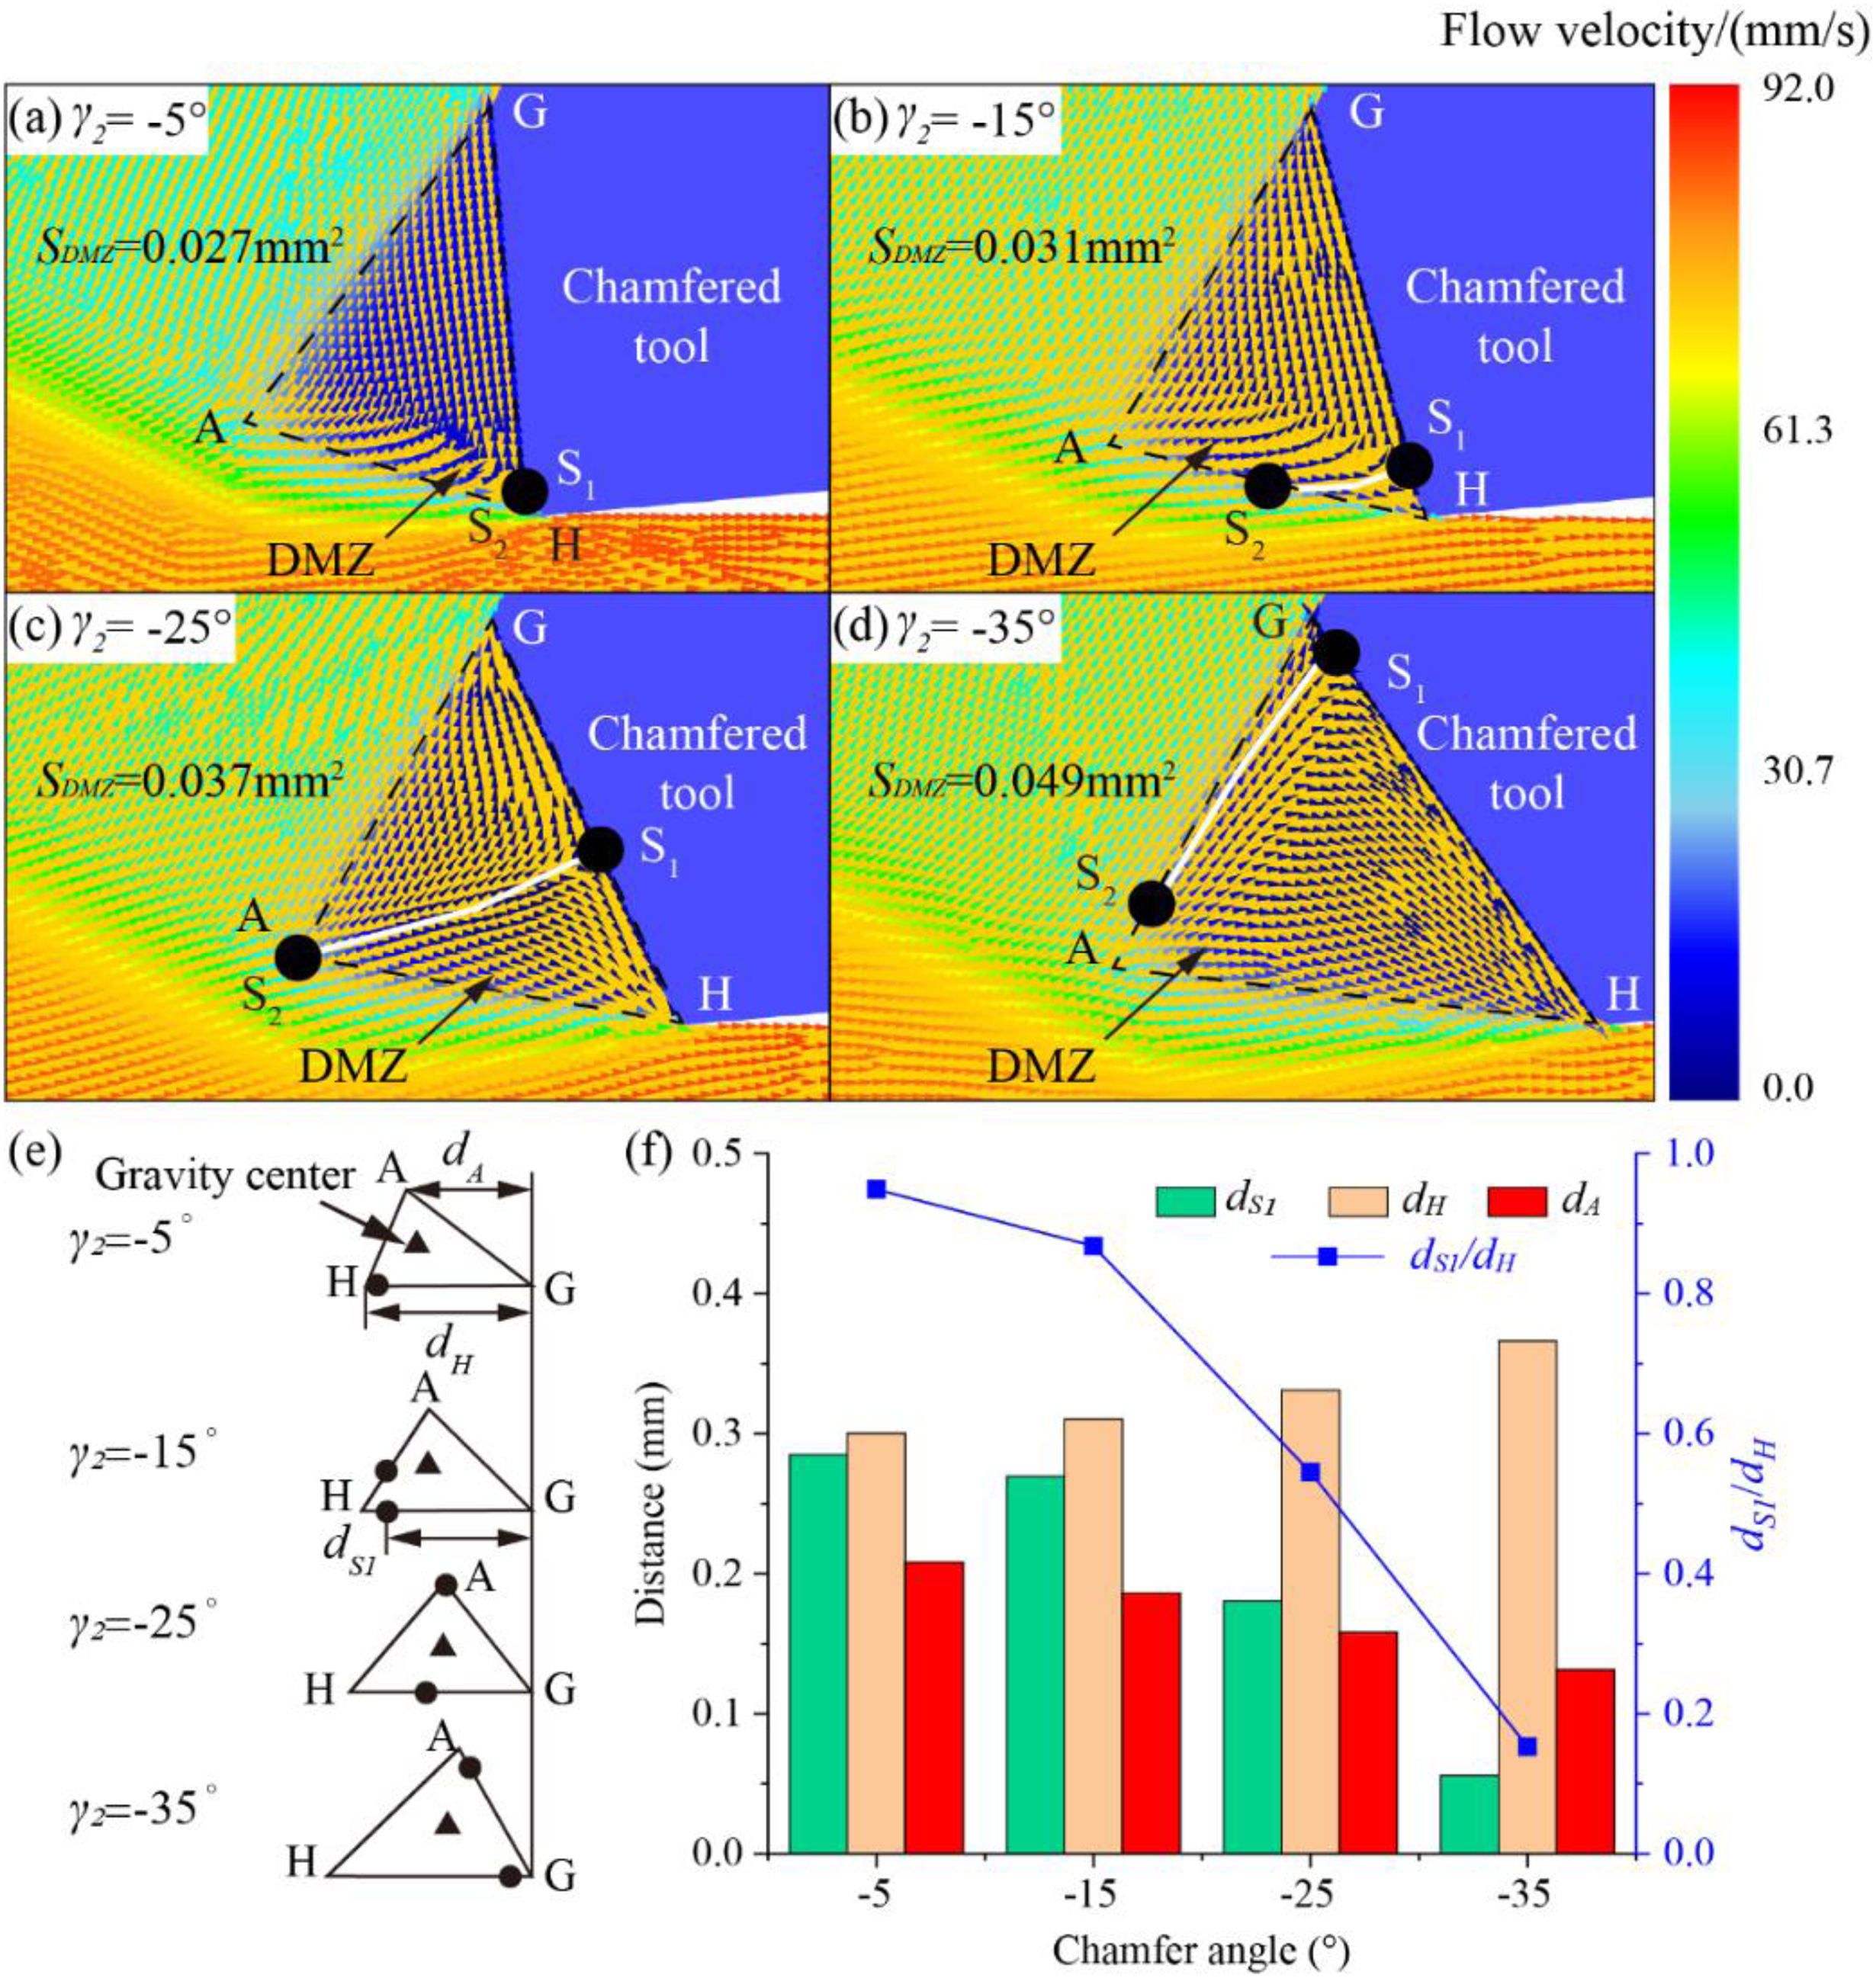
Flow velocity distribution in simulation and point S1 location under different γ2.
As depicted in Figure 17(a) to (d), the DMZ areas were 0.001 mm2, 0.011 mm2, 0.037 mm2, and 0.108 mm2 when wc = 0.05 mm, 0.2 mm, 0.35 mm, and 0.5 mm, respectively. Therefore, the increased wc significantly enlarged the DMZ area, leading to a larger effective strain in the prepared strip. Figure 17(e) and (f) showed the DMZ changes and point S1 location under different wc. As wc grew, the lengths of dS1, dH, dA, and dS1/dH all increased, suggesting little variation in the shape and gravity center of DMZ. Furthermore, compared to γ2, wc had less influence on point S1 affecting the material flow ratio.
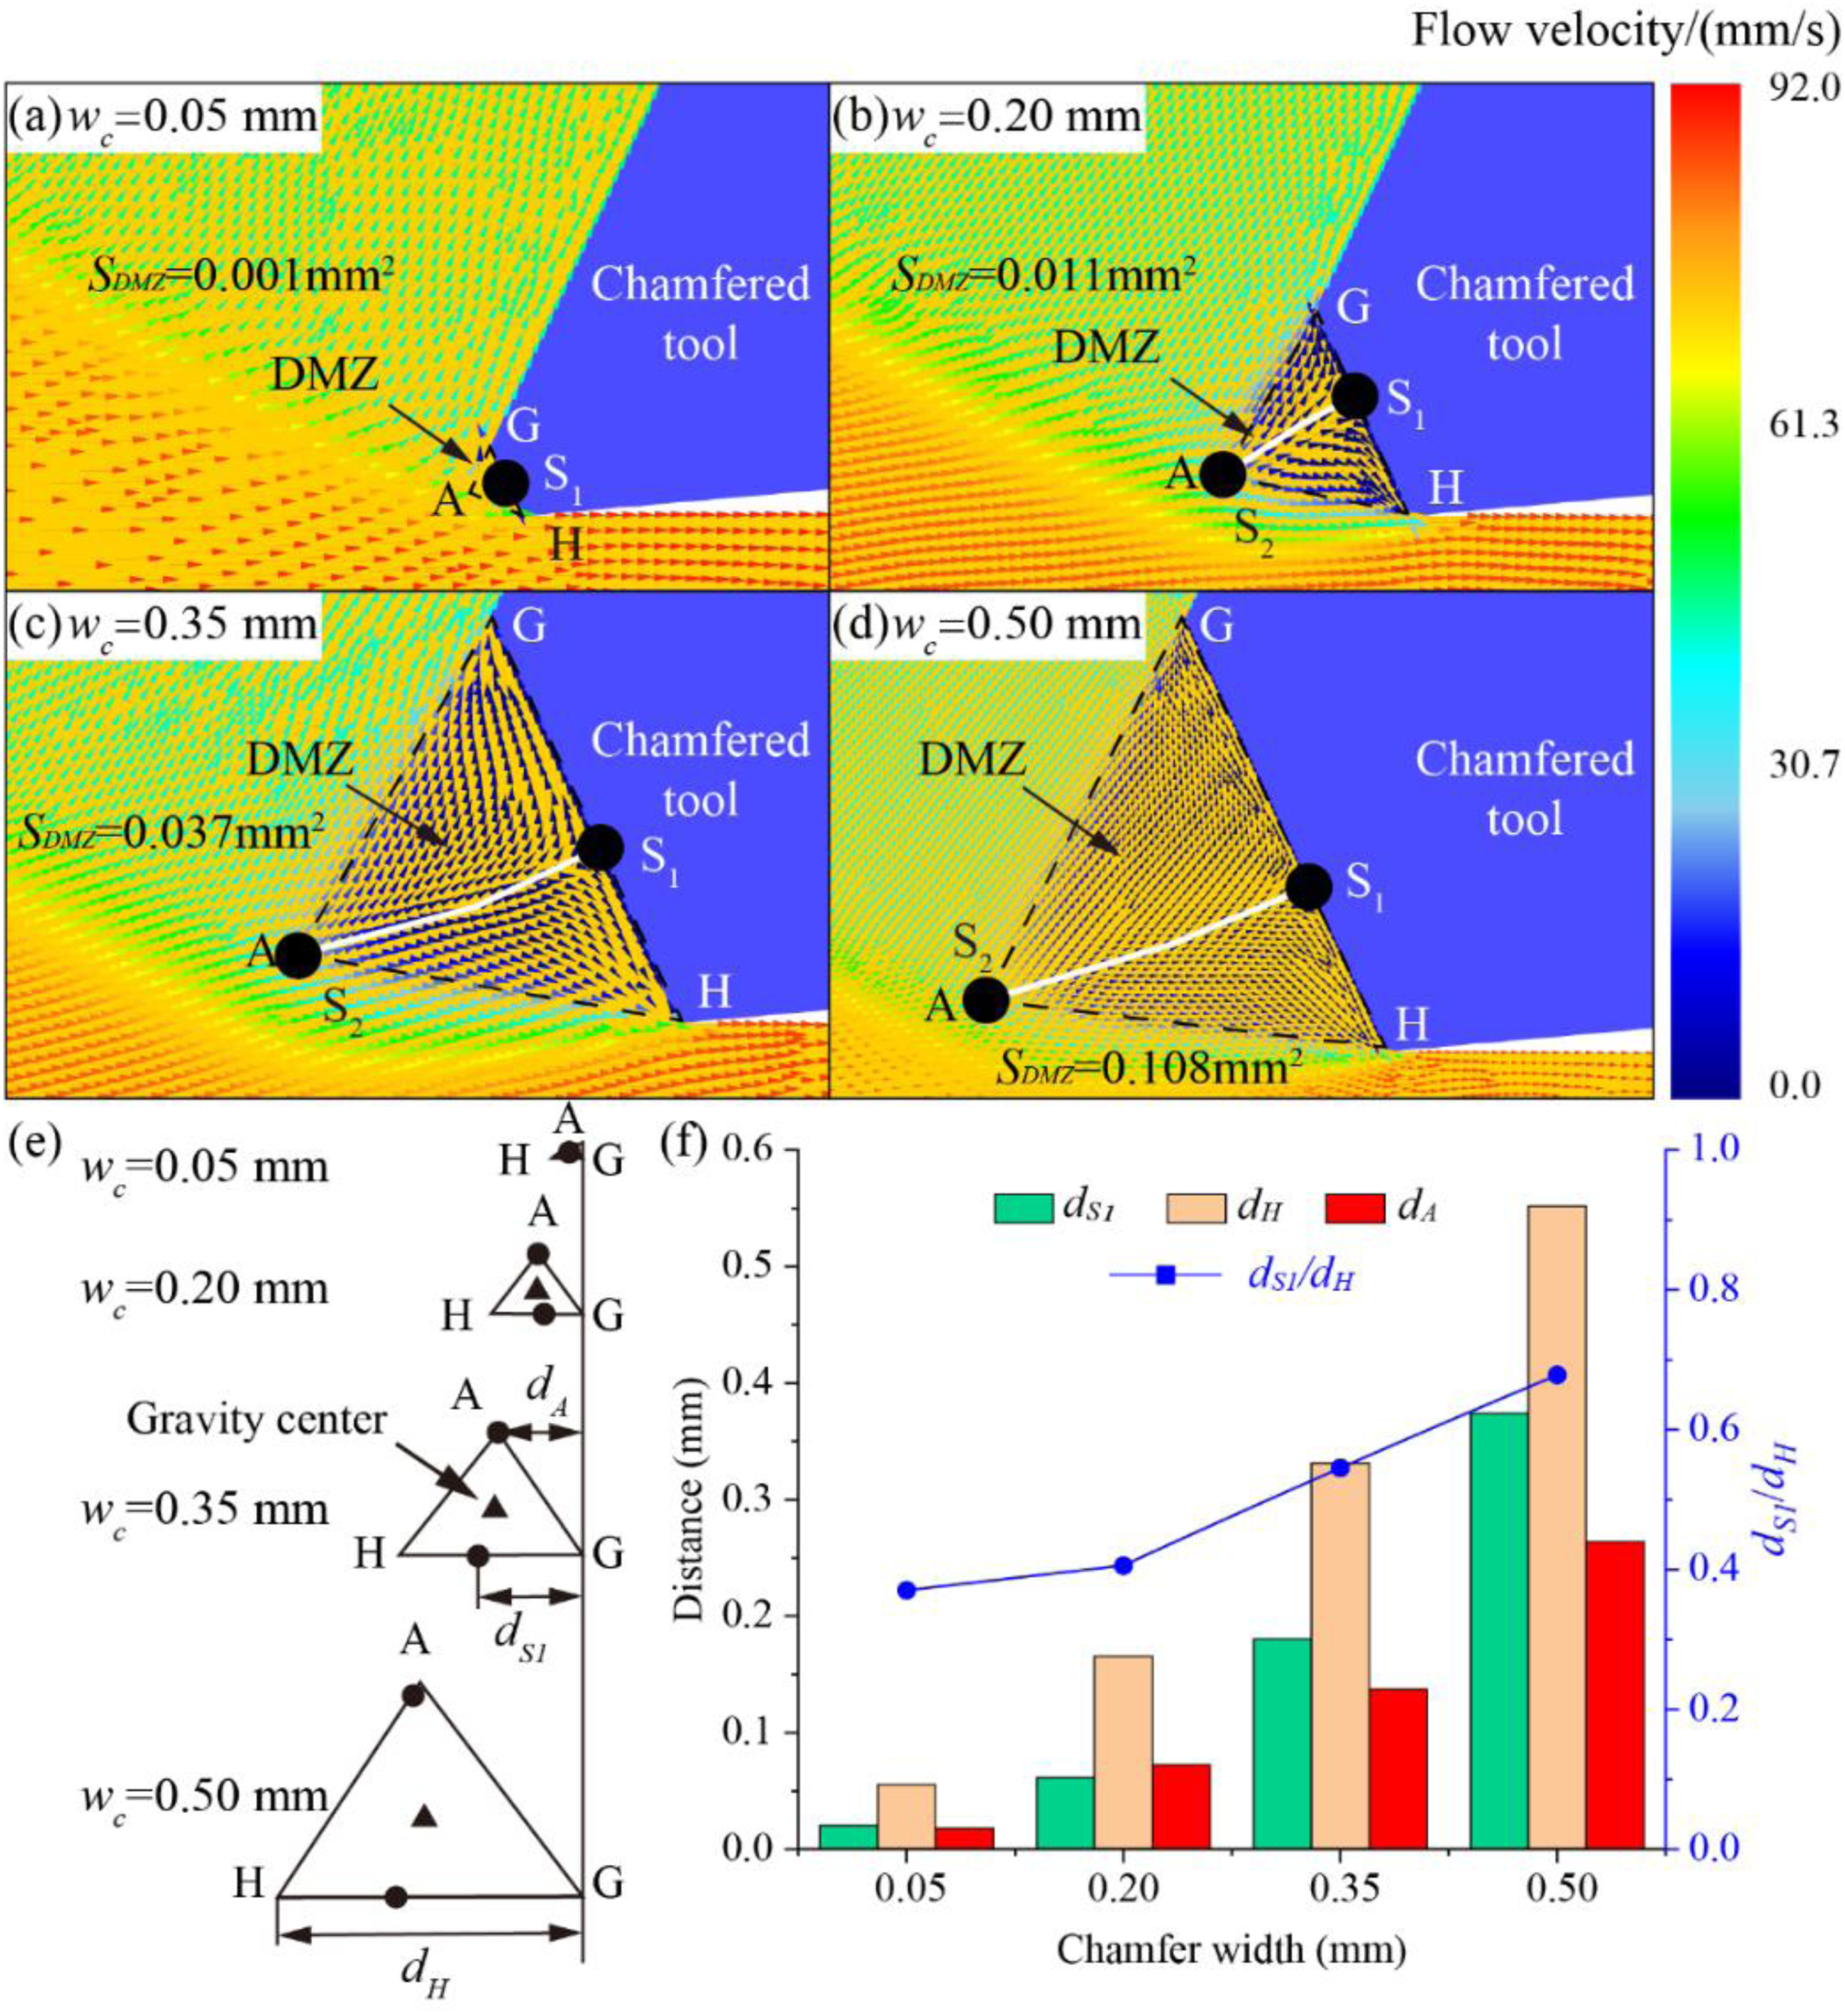
Flow velocity distribution in simulation and point S1 location under different wc.
To verify the regularity of the DMZ and stagnation points for different parameters in the simulation, Figure 18 showed microstructures of the deformation zone and the DMZ in CT-EM. Based on the white auxiliary quadrangles in Figure 18(a), (c), and (e), the material was deformed before reaching the first deformation zone and subsequently experienced elongation and refinement. With decreasing γ2 and increasing wc, the shear angle φ in CT-EM decreased, resulting in more drastic material deformation and larger shear strain. Notably, the absence of obvious crack defects on the workpiece surface proved the constraint's effect on workpiece morphology, whereas the crack defects in Figure 12 were generated after extruded strip formation.
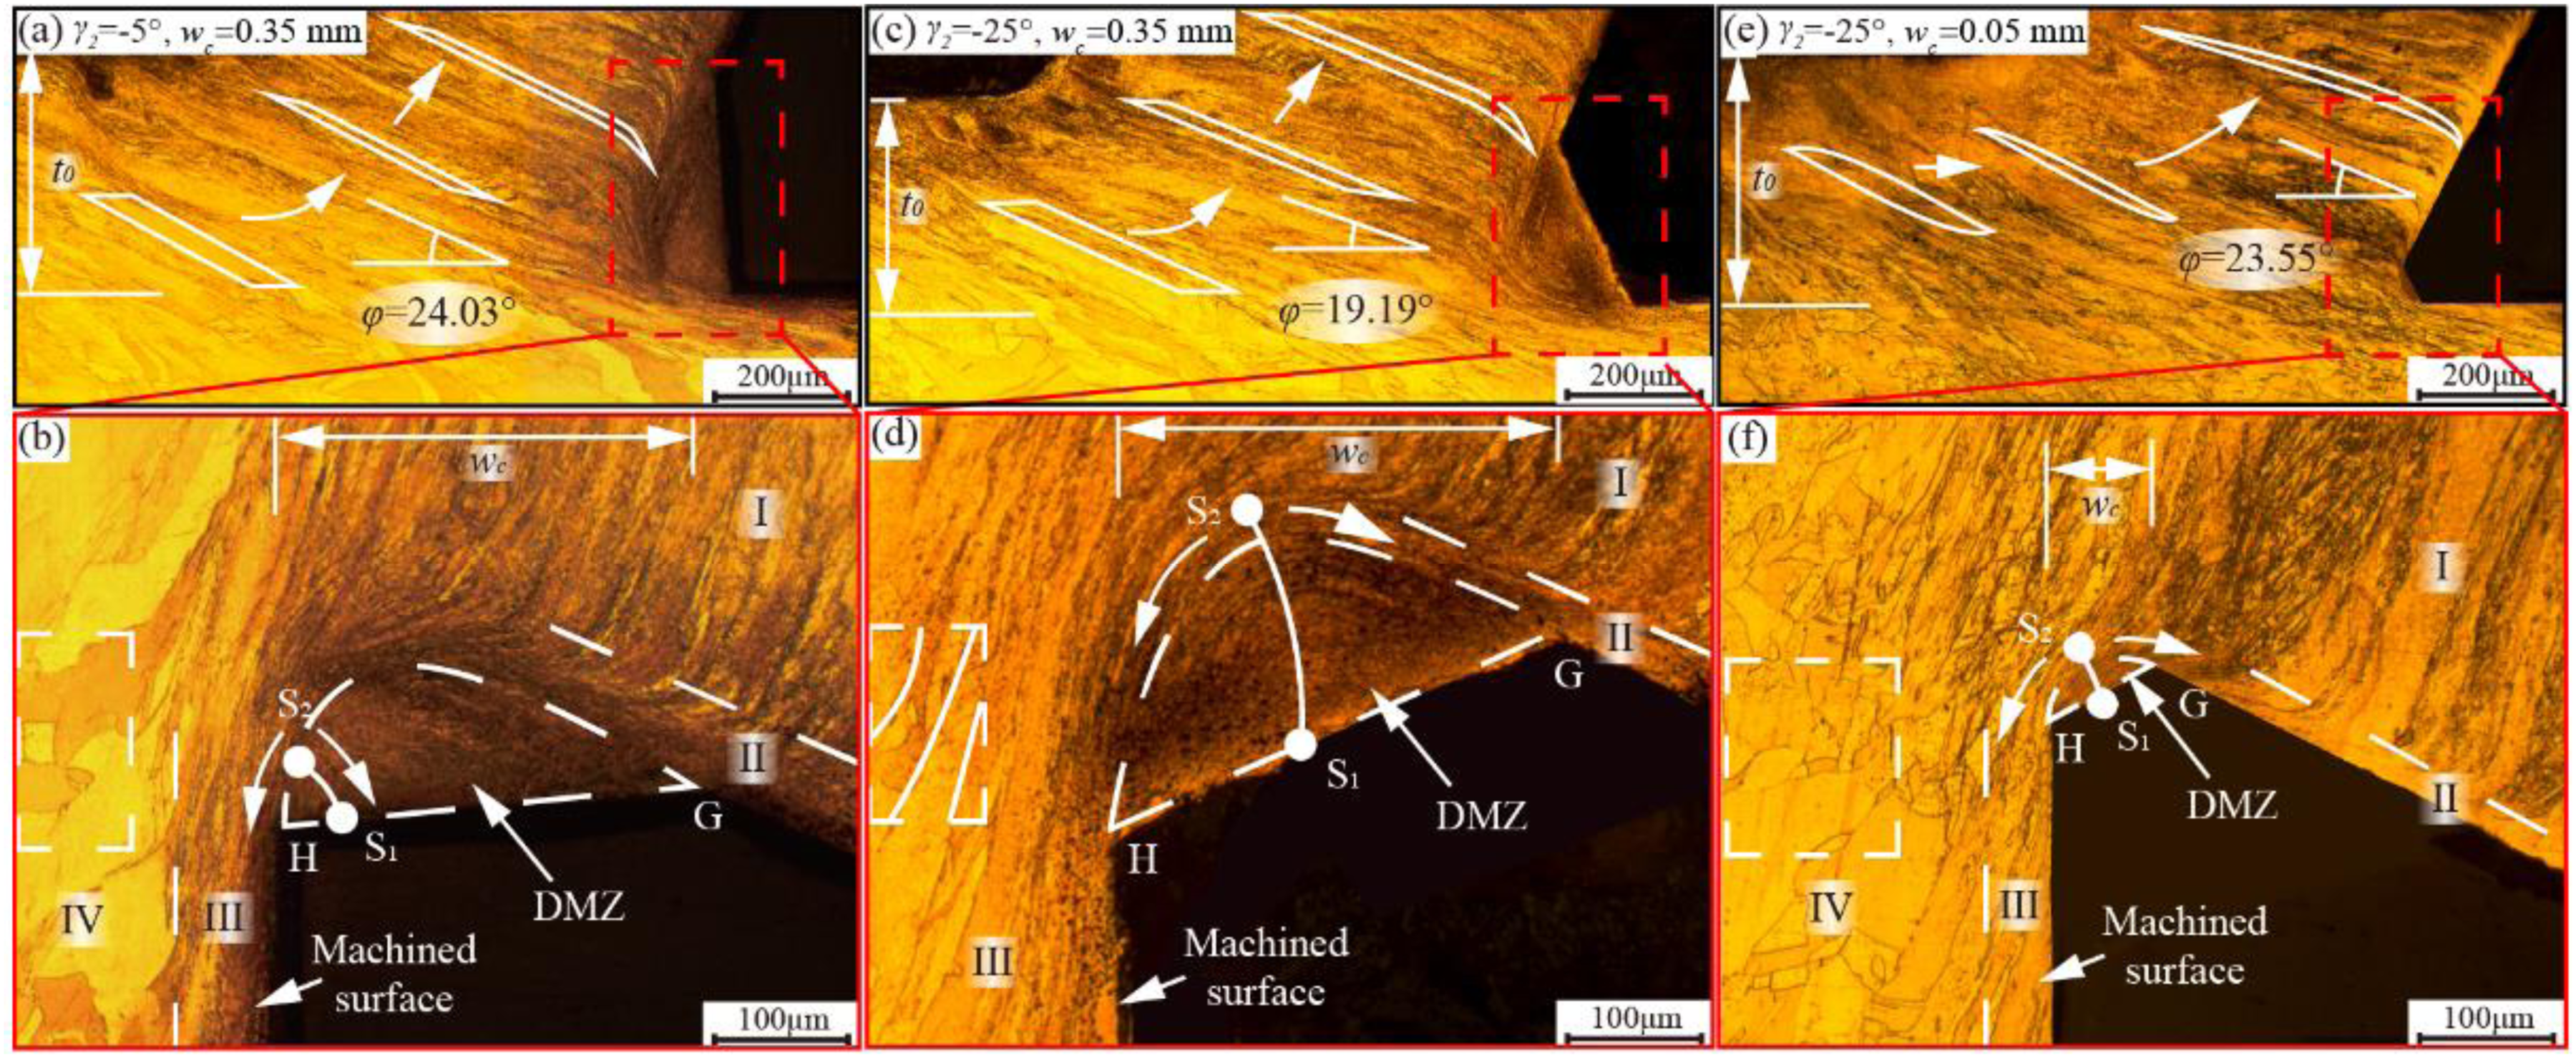
Microstructures of the deformation zone in CT-EM and the DMZ ahead of tool under different parameters.
As presented in Figure 18(b), (d), and (f), the real shape of DMZ was arched and the grains in it were severely refined. Based on the microstructure within DMZ, the approximate locations of points S1 and S2 were marked and the line between them demarcated the two material flow directions. By comparative analysis, the reduced γ2 mainly affected the stagnation point location and thus reduced the material proportion flowing to the strip, while the increased wc raised effective strain by enlarging the DMZ area. Additionally, the thickness of zone II decreased with reducing γ2 and wc, which was consistent with the simulation results. Similarly, the machined surface could be divided into a high strain zone (III) and a low strain zone (IV), where zone III underwent a large plastic deformation under DMZ influence and was also called the deformed layer. The thickness of Zone III was also attributed to the stagnation point location in DMZ and had the opposite trend to Zone II.
The quantitative analysis of the “DMZ - stagnation point - material flow” through finite element simulation (see Figures 16 and 17), alongside qualitative observations of microstructure (including the area of DMZs and the location of point S) via CT-EM experiments (see Figure 18), established a comprehensive verification closed loop. The DMZ defined by simulations exhibited high consistency with the microscopic characteristics from experimental results, mainly reflected in the variation patterns of the DMZ area and stagnation points.
Furthermore, the effects of key parameters (γ2 and wc) on DMZ behaviors, stagnation points, and material flow demonstrated alignment between the quantitative trends derived from the simulation and qualitative characteristics identified in experiments. The experimental findings further validated critical conclusions drawn from simulations–specifically that “the constraint ensured surface quality of the workpiece” and “the impact of wc on material flow ratio was less significant than that of γ2.” This provided robust experimental support at a micro level for affirming the reliability of simulation results.
Validation of prediction models
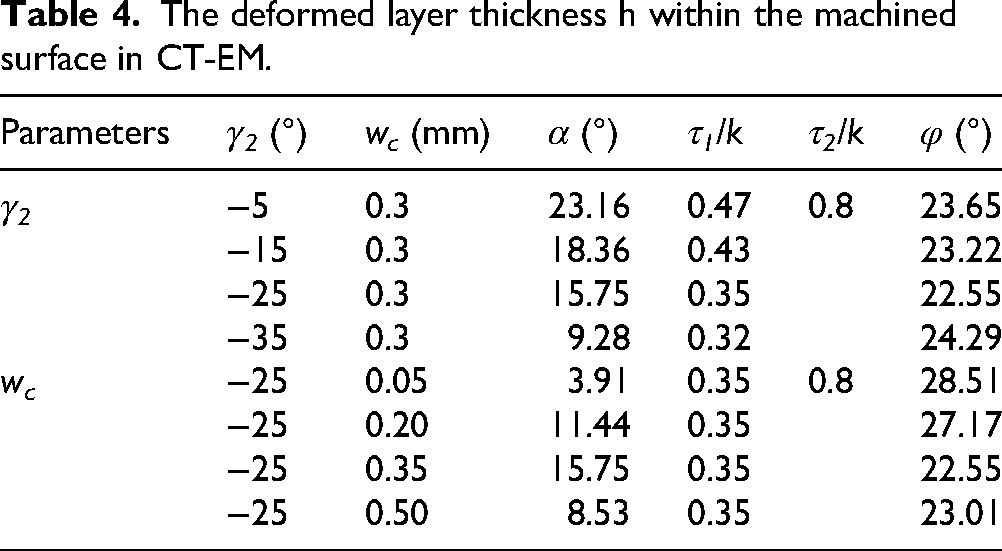
Table 4 showed the relevant parameters required for cutting force modeling, where the angle α between the DMZ boundary AH and the horizontal direction, and the friction coefficient τ1/k on the contact length lGD between strip and tool rake face were obtained from the simulation results. Additionally, the friction coefficient τ2/k of AH was 0.8
30
and the flow shear stress k could be calculated from the yield strength σs
47
:
The deformed layer thickness h within the machined surface in CT-EM.
To verify the cutting force model, Figure 19 presented relevant results under different parameters. With decreasing γ2 and increasing wc, the main cutting force Ft thrust Fc, and Ft/Fc in CT-EM tended to increase, which coincided with the variations in DMZ and stagnation point location analyzed above. The expanded DMZ area resulted in higher cutting forces, and the shifting of stagnation points to the strip led to more material flow into the machined surface, increasing Ft/Fc. Through comparative analysis, varying wc had a greater effect on cutting force, while the model accuracy was higher under different γ2. Furthermore, the cutting force model under different parameters was consistent with the actual results, offering a guideline for the practical application of CT-EM.
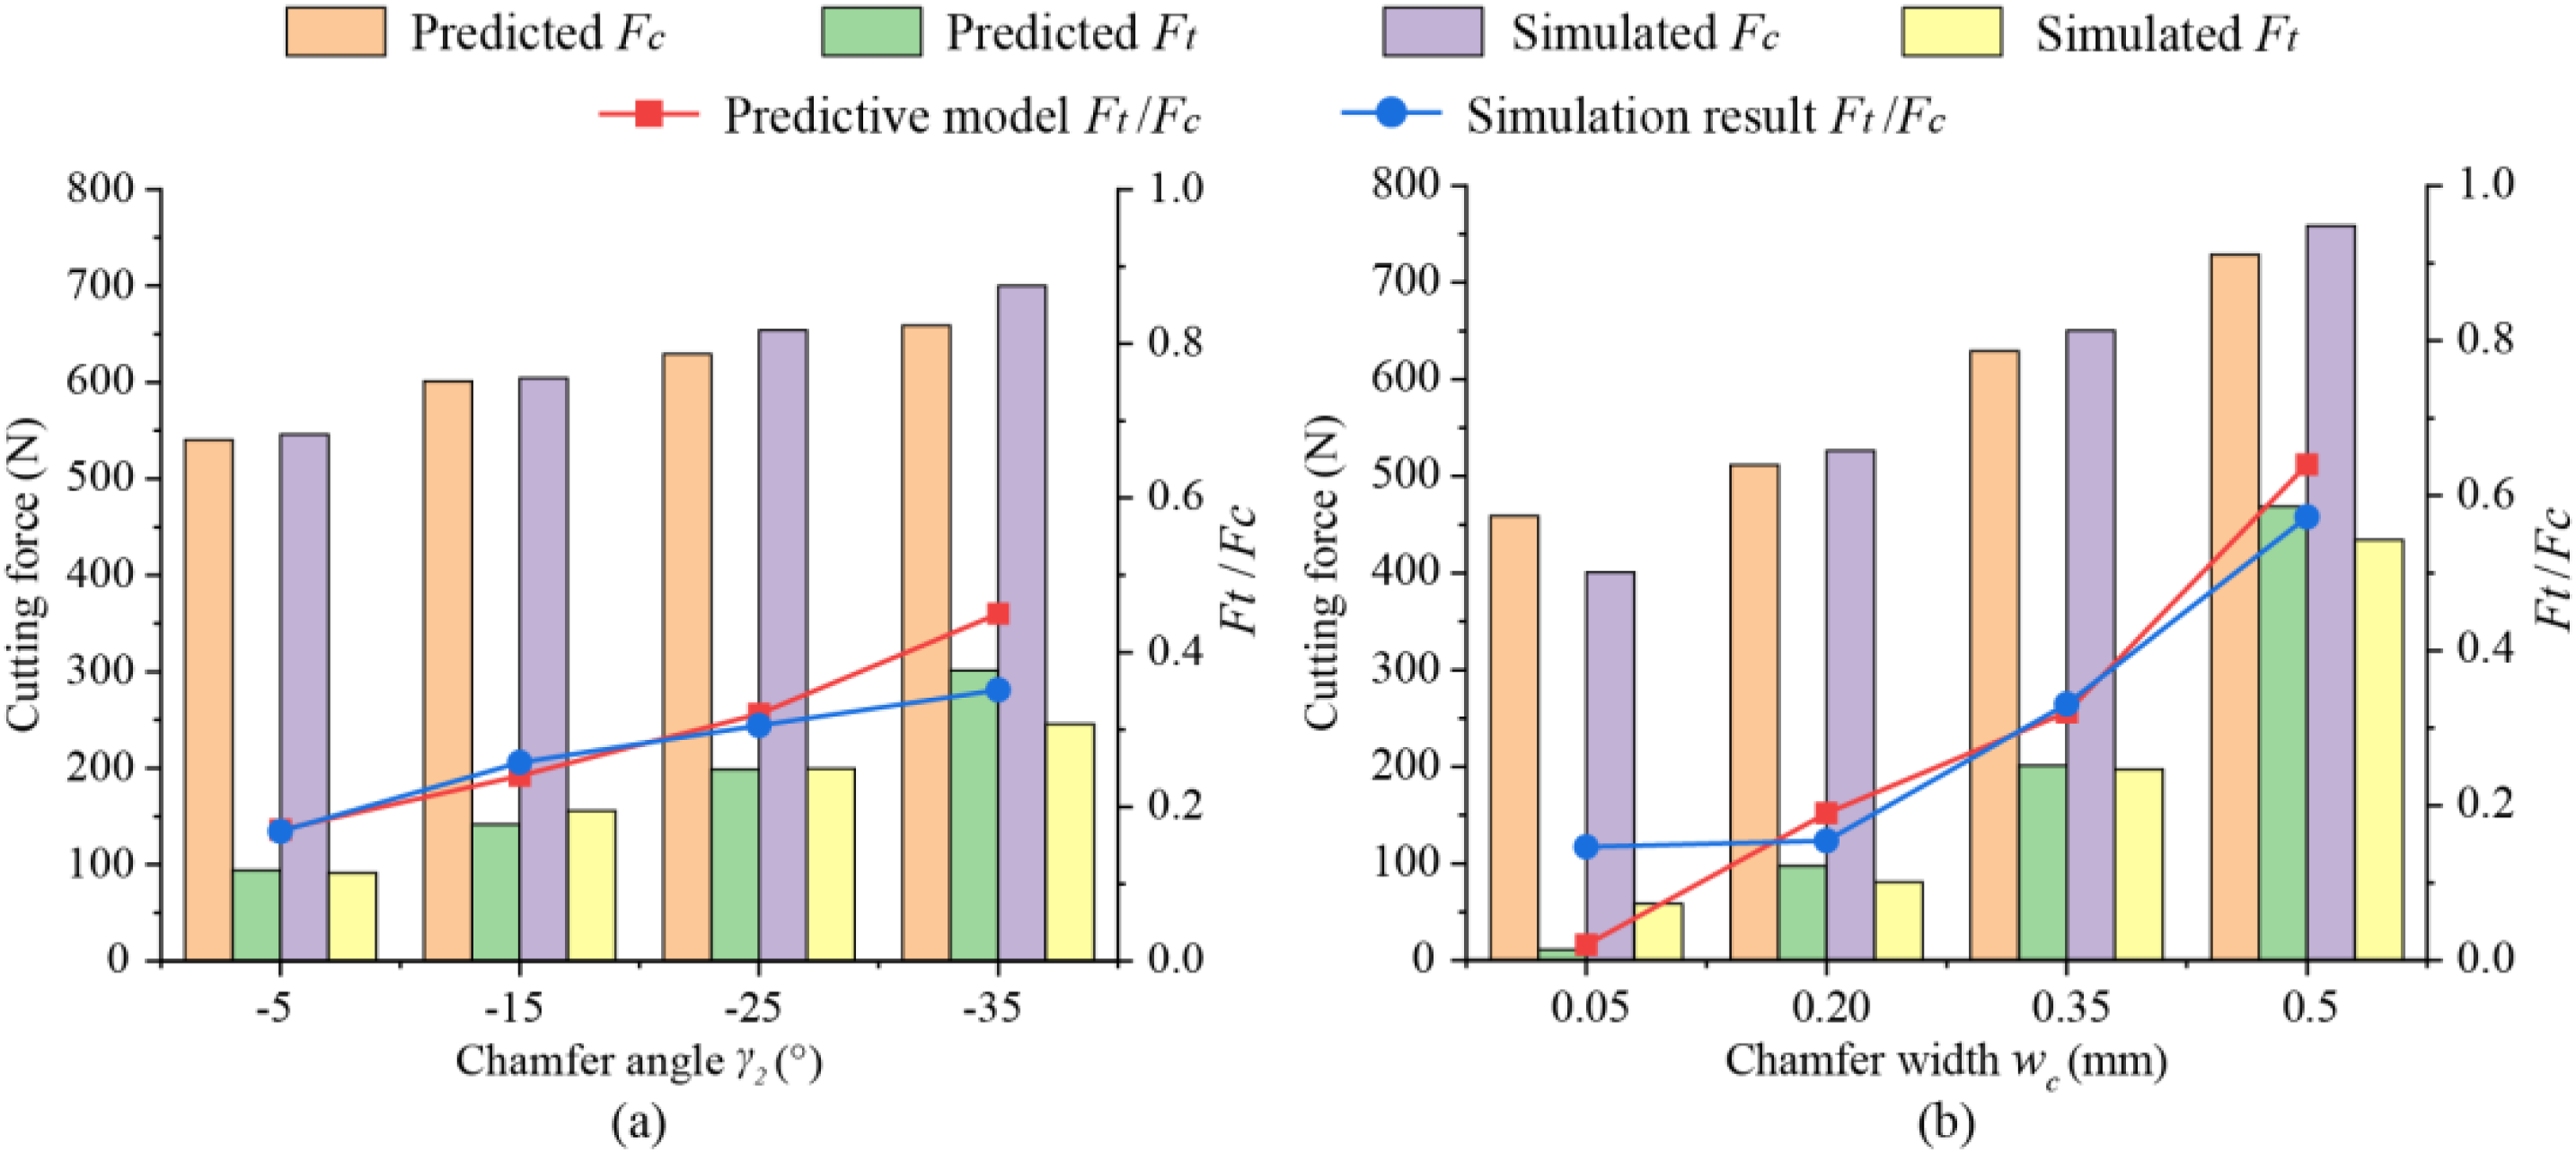
Predicted and simulated results of cutting force under (a) different γ2 and (b) different wc.
Figure 20 displayed microstructures and finite element results of the machined surface in CT-EM under different parameters, where zone III thickness was equal to the deformed layer thickness (Bh), while zone IV was a low strain zone with no significant grain refinement. As shown in Figure 20(a) to (c), the deformed layer thickness was 71.04 μm when γ2 = –5° and wc = 0.35 mm, 154.95 μm when γ2 = –25° and wc = 0.35 mm, and 44.21 μm when γ2 = –25° and wc = 0.05 mm. As γ2 decreased and wc increased, the stagnation point moved to the strip, resulting in more material flowing to the machined surface and an increase in deformed layer thickness. As illustrated in Figure 20(d) to (f), the simulation results of effective strain could reflect the deformation of the machined surface. Notably, the trend in deformation layer thickness was consistent with the microstructure observed in the experiments.
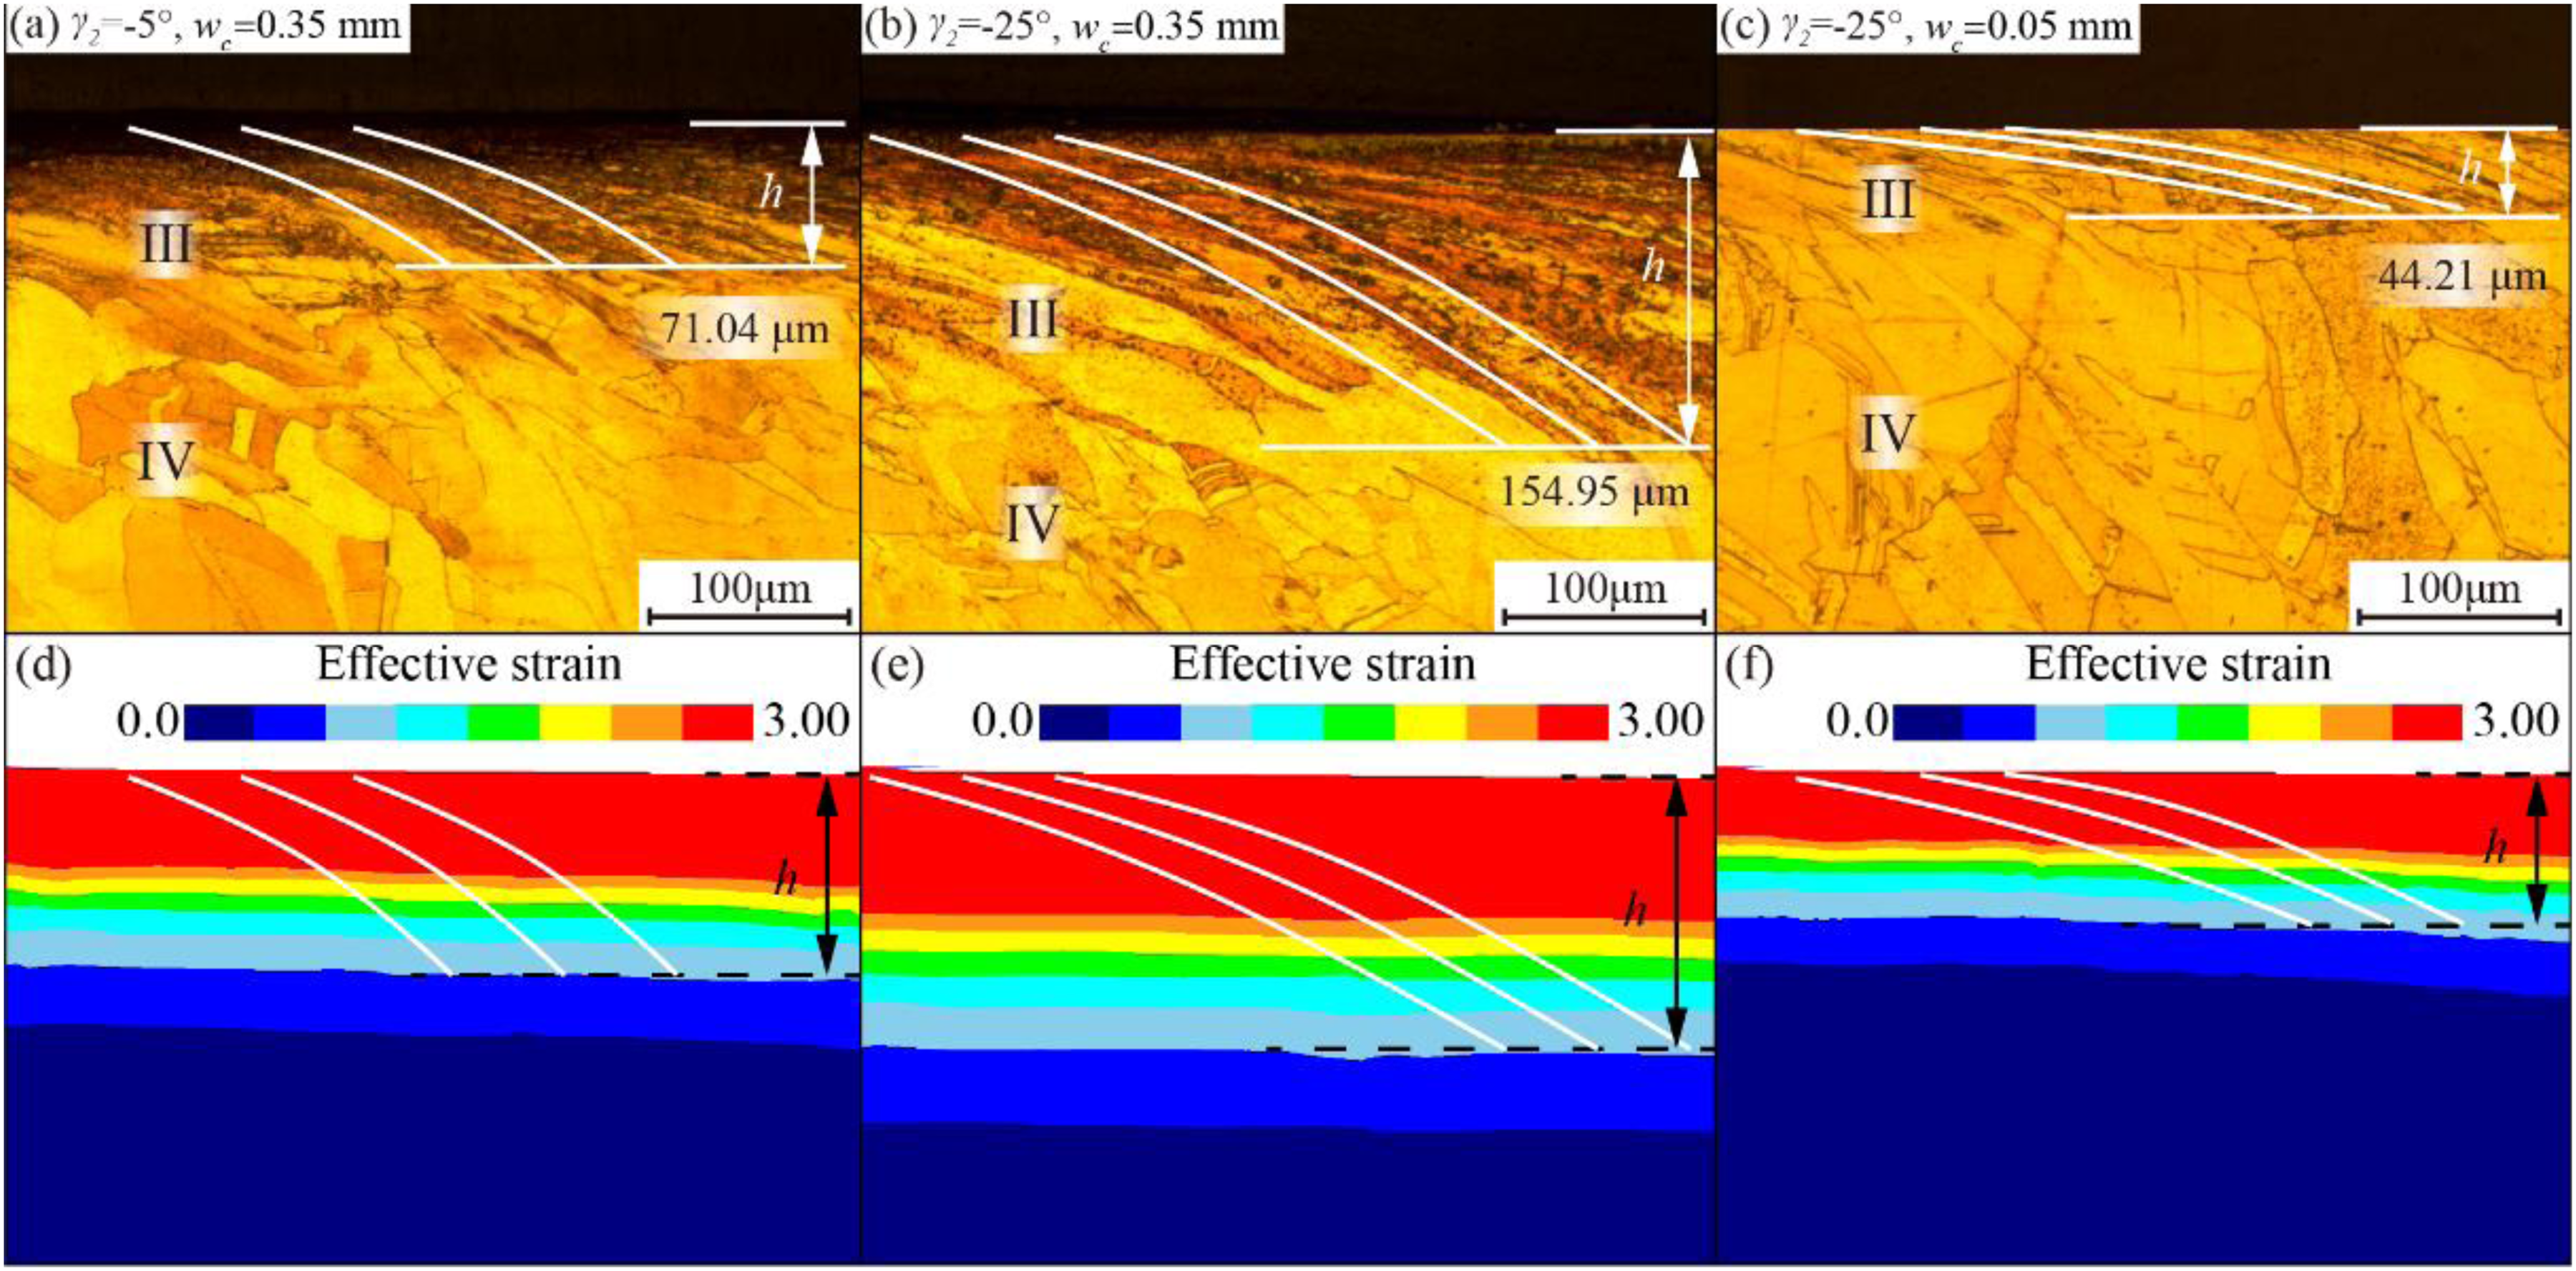
Deformed layer thickness of machined surface in CT-EM under different parameters: (a) microstructure and (b) simulation results.
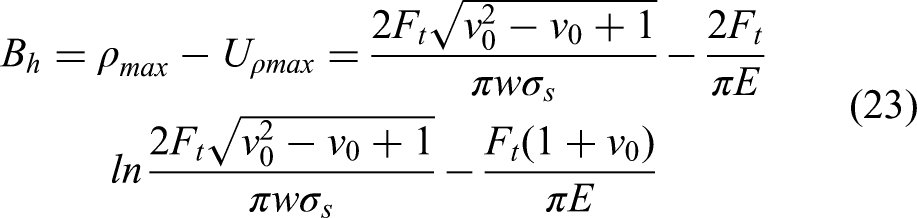
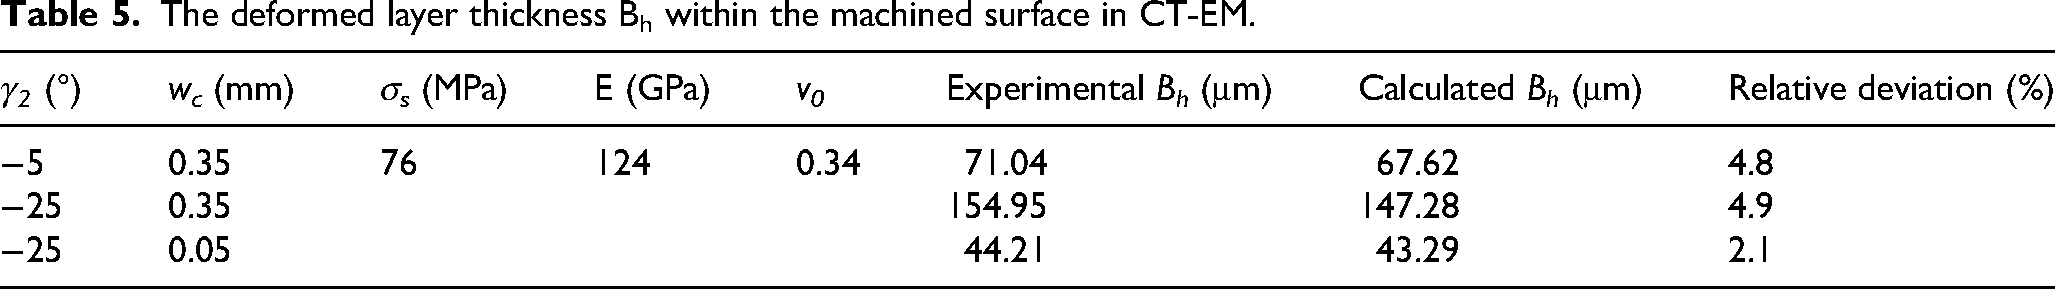
Combining Equation (23) and cutting force results, the deformed layer thickness Bh was obtained as shown in Table 5, where the elasticity model E and Poisson's ratio v0 were from the research of Johnson et al. 48 With decreasing γ2 and increasing wc, both experimental and calculated Bh tended to increase, and the relative deviations were all less than 5%, indicating that the predictive model was highly accurate. The analysis above revealed that finite element stimulation, experimental results, and predictive models shared the similar trends, demonstrating a high degree of consistency.
The deformed layer thickness Bh within the machined surface in CT-EM.
Conclusions
This paper proposed a new process of CT-EM and successfully prepared UFG strips with DMZ using chamfered tools. The strip forming mechanism, effective strain distribution, microstructure, and mechanical properties for varying chamfered tool parameters γ2 and wc were analyzed in detail. Additionally, the stagnation point ahead of the chamfered tool was deeply explored, and the models of cutting force and deformed layer thickness were developed and validated. The main conclusions were summarized below:
The CT-EM process was divided into three stages: material divergence, DMZ formation, and strip stable formation. The reduced γ2 and increased wc tended to enlarge the DMZ area, and γ2 mainly contributed to DMZ shape and stagnation point location, while wc primarily affected the DMZ area. Notably, the movement of the stagnation point toward the strip would increase the material ratio flowing to the machined surface. According to the effective strain distribution, the extruded strips could be categorized into high and low strain zones (II and I), and the machined surfaces were categorized into zones III and IV. As γ2 decreased from −5° to −25°, the strip effective strain tended to increase, while it dropped when γ2 was −35°, indicating that the stagnation point moved close to point G and little material in DMZ flowed to Zone II. With increasing wc, the effective strain on both the strip and the machined surface increased. Compared to the annealed pure copper (68.1 HV, 204.4 MPa), CT-EM effectively improved the hardness and strength of prepared strips. With decreasing γ2 and increasing wc, the grain refinement and dislocation density grew, and microhardness enhanced, resulting in improved σUTS and reduced εEF. Smaller γ2 and larger wc were preferred in chamfer tool design to obtain higher strength while sacrificing only a little plasticity. Based on the chamfered tool shape and slip line field theory, the predictive models of cutting force and deformed layer thickness for CT-EM were established. By comparing the actual and predicted values under different parameters, both predictive models proved to be highly accurate. Furthermore, the tool-strip contact length reduced with decreasing γ2 and wc, while the decreased γ2 and increased wc significantly increased the cutting temperature.
Footnotes
Ethical standards
This research did not involve any human participants or animals.
Author contribution(s)
Funding
The authors disclosed receipt of the following financial support for the research, authorship, and/or publication of this article: This work was supported by the National Natural Science Foundation of China [grant number 52075187, 52505487]; the Yunnan Fundamental Research Projects [grant numbers 202301BE070001-021, 202401CF070145]; and the Analysis and Testing Foundation of Kunming University of Science and Technology [grant numbers 2023T20230023].
Declaration of conflicting interests
The authors declared no potential conflicts of interest with respect to the research, authorship, and/or publication of this article.
Data availability
The authors do not have permission to share data.