
Abstract
Sodium-ion batteries are promising for large-scale storage due to low cost and good low-temperature performance. The development of P2-type Na0.67MnO2 cathode materials, known for high capacity and stability, is challenged by their structural instability and performance decay upon cycling. The work investigated the structure and electrochemical properties of P2-type Na0.67MnO2 cathode materials through Fe doping and calcination temperature regulation. Fe doping could suppress phase transformation, increase interlayer spacing, and promote Na+ diffusion, which enhanced the specific capacity and cycling stability of the materials. Experiments showed that Na0.7Fe0.2Mn0.8O2 material with a Fe to Mn molar ratio of 0.2 : 0.8 calcined at 900 °C exhibited optimal performance, with an initial charge-discharge specific capacity of 132.2 mAh/g and excellent rate capability.
Introduction
The rapid consumption of fossil fuels has not only exacerbated environmental pollution but also made it increasingly difficult to meet the demand for “green and low-carbon” energy sources. 1 This has spurred active exploration of renewable and new energy sources as alternatives to traditional fossil fuels, with significant progress being made in this field. 2 Electrochemical energy storage systems, with their high performance and low-cost energy storage capabilities, have effectively addressed the challenges of integrating intermittent and stochastic clean energy sources into power grids, enabling the better utilization of electricity generated from clean and renewable energy. 3 Among various energy storage technologies, secondary batteries have emerged as a prominent option due to their high flexibility, low maintenance costs, high energy density, and high energy conversion efficiency. Lithium-ion batteries have been widely used in large and small-scale energy storage devices. However, due to the scarcity of lithium resources, which leads to high costs, as well as their significant temperature sensitivity and insufficient safety and reliability, lithium-ion batteries are gradually failing to meet the demands of social development.4–6 In recent years, sodium-ion batteries have made important breakthroughs in energy density. With advantages such as lower cost, superior fast-charging performance, better low-temperature performance, and enhanced safety, they have become a key technology for achieving carbon neutrality and are thus suitable for large-scale power storage applications.7–10 However, sodium-ion batteries also have certain drawbacks. For example, the ionic radius of sodium ions (Na+, 0.102 nm) is significantly larger than that of lithium ions (Li+, 0.076 nm), making it easier for them to disrupt the structural stability of materials during the deintercalation and intercalation processes. Additionally, the standard electrode potential of sodium (Na+/Na, −2.71 V vs S.H.E) is higher than that of lithium (Li+/Li, −3.04 V vs S.H.E), resulting in less-than-ideal energy density performance. 11 Therefore, numerous researchers have conducted a series of modification studies to address the issues associated with sodium-ion batteries.
Currently, the cathode materials for sodium-ion batteries mainly include layered oxides, poly-anion compounds, and Prussian blue analogues. Among them, layered oxides have attracted significant attention owing to their well-balanced overall performance and high energy density. 12 Manganese-based layered oxide cathode materials have drawn considerable research interest due to the natural abundance of manganese resources, as well as their advantages such as low reduction potential, high specific capacity, good cycling stability, and environmental friendliness. 13 However, manganese-based layered oxides still face some problems, such as structural instability caused by the Jahn-Teller distortion of Mn3+ and complex phase transformation processes. Exploring how to suppress the Jahn-Teller effect in NaMnO2 cathodes is of significant importance for promoting the practical application of manganese-based cathode materials. Currently, doping with various metal elements (such as Co, Fe, Mg etc) has been proven to enhance the structural stability of NaMnO2 during cycling.14–15 Surface coating strategy is one of the simplest and most effective methods for improvement of electrochemical performance of materials. Zhang et al. synthesized P2-type Na0.7MnO2.05 via a wet-chemistry method and applied an AlPO4 coating for the first time. The 5 wt% AlPO4-coated cathode exhibited enhanced rate capability and cycling stability, delivering 103.9 mAh/g at 1 A/g with 92.4% capacity retention after 100 cycles, compared to 62.4% for the uncoated material, due to suppressed phase transitions and side reactions. 16 Ye et al. applied a novel Mg–B–O coating to P2-type Na0.5Mn0.95Ni0.05O2 cathode. This coating enhanced air stability, suppressed the Jahn-Teller effect, and improved Na+ diffusion. The modified cathode delivered a high capacity of 93.2 mAh/g at 500 mA/g and retained 80.0% capacity after 500 cycles, demonstrating superior cycling stability. 17 Delmas classified manganese-based layered oxides into P2 and O3 structures based on the stacking modes of alkali metal ions and coordination configurations in the MeO6 polyhedra. 18 Compared with the O3 structure, the P2 structure has wider ion diffusion channels and exhibits a more stable crystal structure. However, the P2 structure has a lower sodium content and is prone to P2-O2 phase transformation under high pressure, leading to significant volume changes and rapid capacity fading. In contrast, the O3 structure has a higher initial sodium content and greater energy density but also suffers from irreversible phase transformations under high pressure. 19
The limitations of manganese-based layered oxides have drawn significant research attention, leading to extensive research efforts aimed at their modification. For example, Zhang et al. synthesized the cathode material NaNi0.35Fe0.2Mg0.05Mn0.4O2 via a high-temperature solid-state method. 20 This material achieved a reversible capacity of 129.4 mAh/g at 0.1 C and maintained 86% of its capacity after 150 cycles at 1 C. Wang et al. prepared Na0.67(Ni0.17Co0.17Mn0.66)0.9Mg0.05Ti0.05O2 using co-precipitation and surface coating methods. The coated material exhibited a discharge specific capacity of 111.6 mAh/g and retained 90.6% of its capacity after 100 cycles. 21 These modification strategies have accumulated valuable experience for improving the energy density of sodium-ion manganese-based cathode materials. Cai et al. explored the effect of incorporating CoO6 octahedra exhibiting π-interaction into P2-type sodium oxide cathodes, demonstrating that this approach effectively suppresses phase transitions, minimizes voltage hysteresis, and stabilizes the local structure, thereby improving oxygen redox kinetics and rate capability. 22 In a separate study, Cai et al. also investigated Sb substitution in P2-type layered oxides. It was shown that Sb substitution replaces the detrimental OP4 phase-induced by lattice oxygen redox with a Z-phase, which enhances structural stability and promotes Na+ diffusion kinetics. This strategy enabled the attainment of a high energy density of 487 Wh kg−1 in full-cell configurations. 23 Moreover, the synthesis process plays a critical role in determining the electrochemical performance of sodium-ion battery cathodes, with the calcination temperature being a key factor. 24
This work focuses on enhancing the P2-type cathode material NaxMnO2 via Fe doping and precise calcination temperature control. The Fe-doped cathode material, Na0.7FexMn1−xO2, was synthesized using the high-temperature solid-state method. Through systematic variation of Fe doping concentrations and optimization of calcination temperatures, the optimal material performance was identified. A comprehensive analysis was performed to establish the structure–performance relationship and elucidate the underlying mechanism in the modified materials.
Experimental methods
Preparation of Na0.67FexMn1−xO2 (NFMO)
The specific synthesis steps for Na0.7FexMn1−xO2(NFMO) are as follows. Manganese carbonate (MnCO3) was used as the manganese source, with iron carbonate (FeCO3) as the iron source, and anhydrous sodium carbonate (Na2CO3) as the sodium source. Raw materials were precisely weighed according to the Fe to Mn molar ratios of 0:1, 0.2:0.8, 0.35: 0.65, and 0.5: 0.5. The starting carbonates of iron, manganese, and sodium were precisely weighed according to the stoichiometric ratios and placed in an agate mortar. The raw materials were then subjected to thorough mixing and ground for approximately one hour to ensure complete homogenization and uniform distribution of the components. The well-ground mixture was transferred to a crucible and then placed in a tube furnace. The temperature was raised to 1000 °C at a heating rate of 5 °C/min and maintained for 10 h of calcination.
The furnace was allowed to cool naturally to room temperature after calcination. Prepared Na-Fe-Mn oxide cathode materials were stored under conditions isolated from air and oxygen. For ease of distinction, the four materials with Fe-to-Mn molar ratios of 0 :1.0, 0.2: 0.8, 0.35: 0.65, and 0.5:0.5 were labeled as A, B, C, and D, respectively, based on their preparation methods, Fe doping amounts, and calcination temperatures. This labeling facilitated subsequent comparative analysis of materials prepared under different conditions, metal doping amounts, and calcination temperatures. Prepared materials were further processed into battery electrodes and assembled into coin-type half-cells for electrochemical performance testing.
Preparation of NFMO at different calcination temperatures
Iron source (FeCO3), manganese source (MnCO3), and sodium source (anhydrous Na2CO3) were precisely weighed according to a Fe-to-Mn molar ratio of 0.2:0.8. Carbonates were placed in an agate mortar, mixed, and ground for approximately 1 h until a homogeneous mixture was obtained. The well-ground mixture was then transferred to a crucible and placed in a tube furnace. The temperature was raised to 450 °C at a heating rate of 5 °C/min and maintained for 3 h of calcination. The furnace was allowed to cool naturally to room temperature after calcination, and the material was ground again to ensure uniformity.
Prepared Na-Fe-Mn oxide cathode materials were stored under conditions isolated from air and oxygen to prevent oxidation or deterioration. For ease of subsequent description and differentiation, the materials calcined at 800, 900, and 1000 °C were labeled as E, F, and B, respectively. Prepared materials E, F, and B were further processed into battery electrodes and assembled into coin-type half-cells for electrochemical performance testing.
Material characterization
The crystal structure of the samples was characterized by X-ray diffraction (XRD) using a D8 Advance diffractometer. Unit cell parameters were derived from the diffraction data with the aid of Jade6 software. Quantitative elemental analysis was performed using an XRF-1800 X-ray fluorescence spectrometer (XRF) combined with inductively coupled plasma (ICP) techniques. Microstructural and morphological observations were carried out with a SEM-5000 scanning electron microscope (SEM). Surface chemical composition and valence states were examined by X-ray photoelectron spectroscopy (XPS) using an ESCALAB 250 Xi system.
Electrochemical performance test
The cathode was fabricated by blending NFMO powders with carbon black and polyvinylidene fluoride (PVDF) in a mass ratio of 7.5:1.5:1. The mixture was then homogenized with a suitable amount of N-methyl-2-pyrrolidone (NMP) to form a slurry, which was uniformly coated onto aluminum foil. The coated foil was subsequently dried at 80 °C for 12 h in a vacuum oven. Button cells were assembled in the following order: negative electrode case, sodium metal sheet, electrolyte, separator, gasket, spring sheet, and positive electrode case. The electrolyte consisted of 1.0 mol/L NaClO4 containing 5.0 wt% fluoroethylene carbonate (FEC) in a mixed solvent of ethyl cellulose, dimethyl carbonate (DMC), and ethyl methyl carbonate (EMC) (volume ratio1:1:1). The electrochemical performance of coin cells was measured in Neware Battery Testing System(CT-40008T-5 V-10 mA). The cycling performance of as-prepared materials was testing in the range of 2.0 to 4.0 V (vs. Na/Na+) and 1 C rate (130 mA g−1) for 100 cycles. The cyclic voltammetry (CV, 0.1 mV s−1 between 2.0 and 4.0 V) and electrochemical impedance spectroscopy (EIS,10−2 ∼ 105Hz, 5 mV amplitude) were carried out on electrochemical workstation (CHI660E).
Results and discussion
Effect of n(Fe)/n(Mn) on the crystal structure and morphology of NFMO
Na0.7FexMn1−xO2 (x = 0, 0.2, 0.35, 0.5) were prepared by the sol-gel method calcined at 1000 °C followed Figure 1, which are designated as samples A, B, C, and D, respectively. From the XRD results, it can be seen that the materials A match the standard card (PDF#27-0751) and standard card (PDF#25-0844) of the P2-type structure. Material A is identified as a mixed phase of Na0.7MnO2 and NaMnO2. In contrast, the XRD patterns of Materials B, C, and D display well-defined diffraction peaks at 2θ values of 15.841°, 32.136°, 36.025°, 36.962°, 39.672°, 43.804°, 49.070°, 62.398°, 64.777°, and 67.251°. Based on these peak assignments, which are highly consistent with the reference pattern of hexagonal Na0.7MnO2 (PDF#27-0751), Materials B, C, and D are identified as P2-type layered oxides with a hexagonal crystal structure (space group P63/mmc).
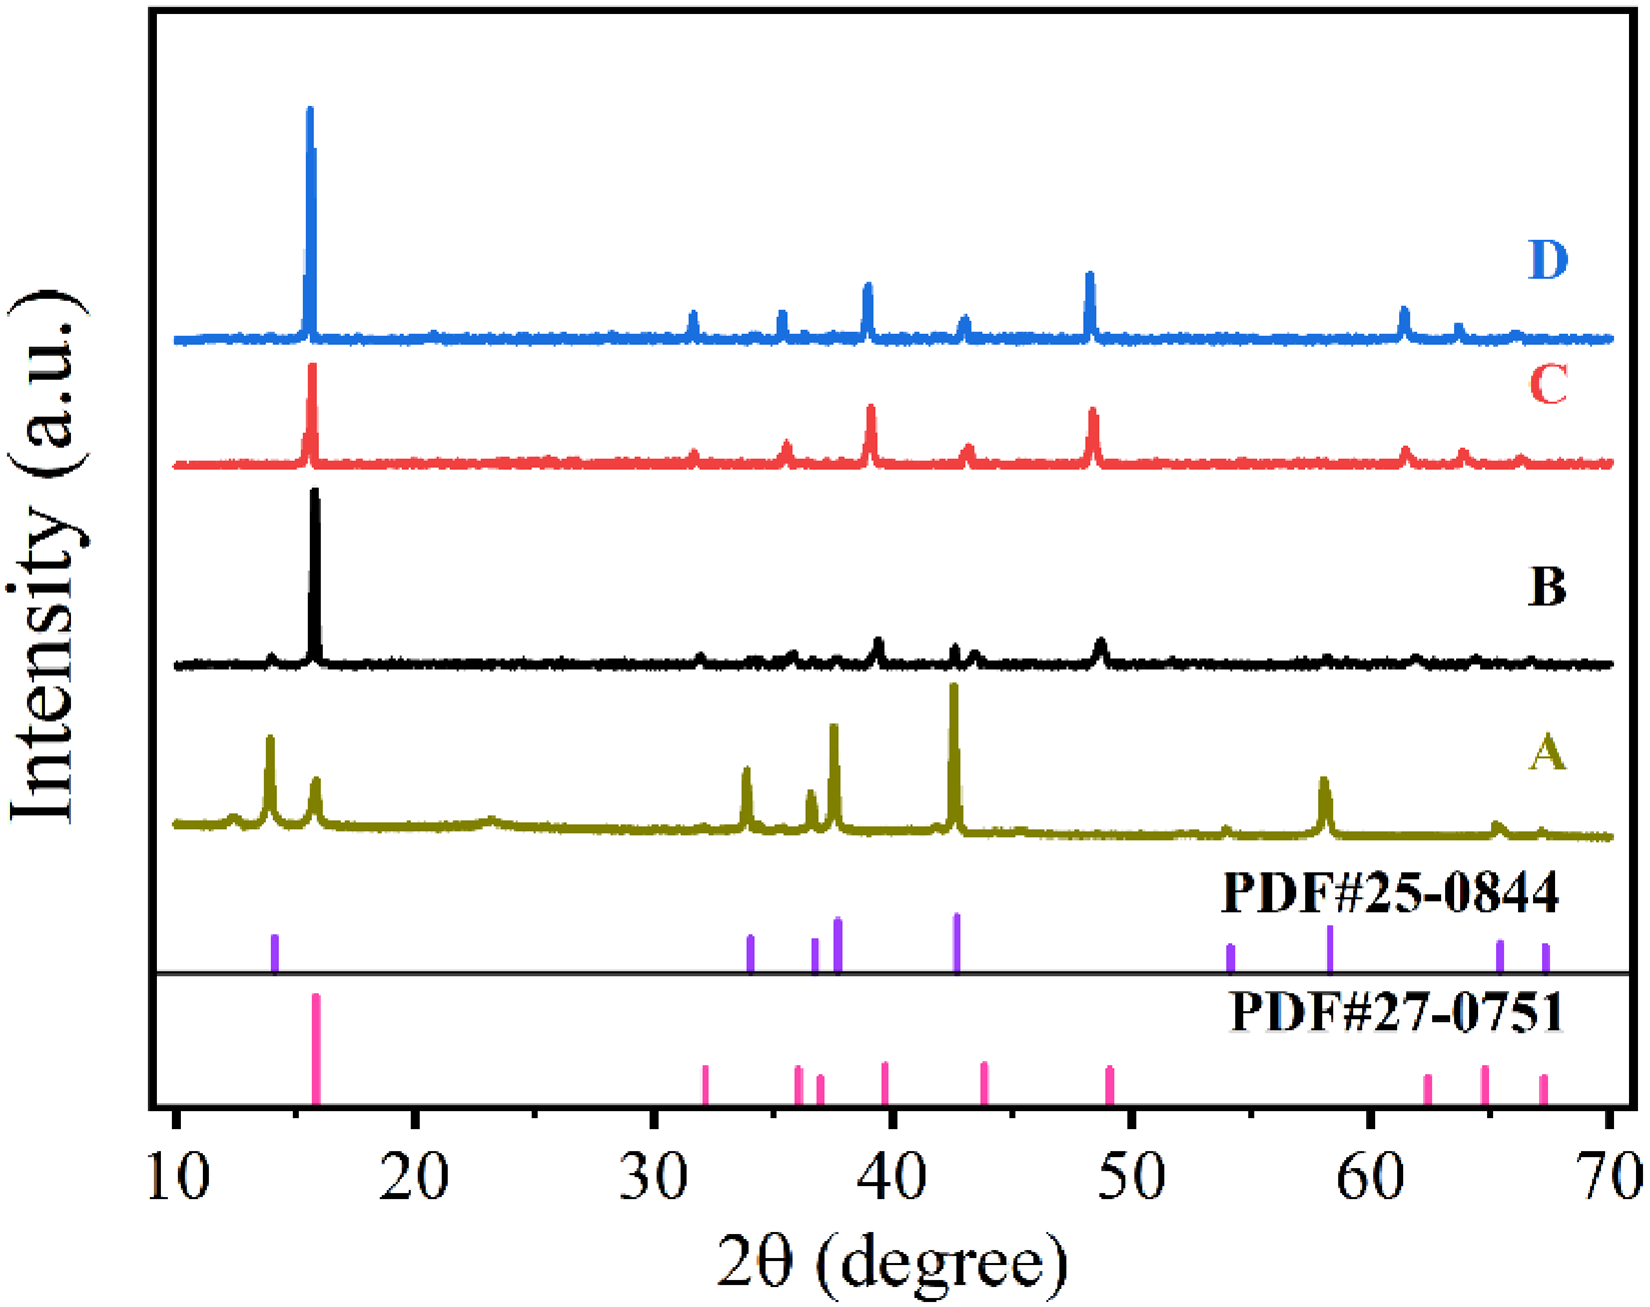
XRD spectrum of the samples with different n(Fe)/n(Mn) ratios (A: 0 : 1; B : 0.2 : 0.8; C : 0.35 : 0.65; D : 0.5 : 0.5).
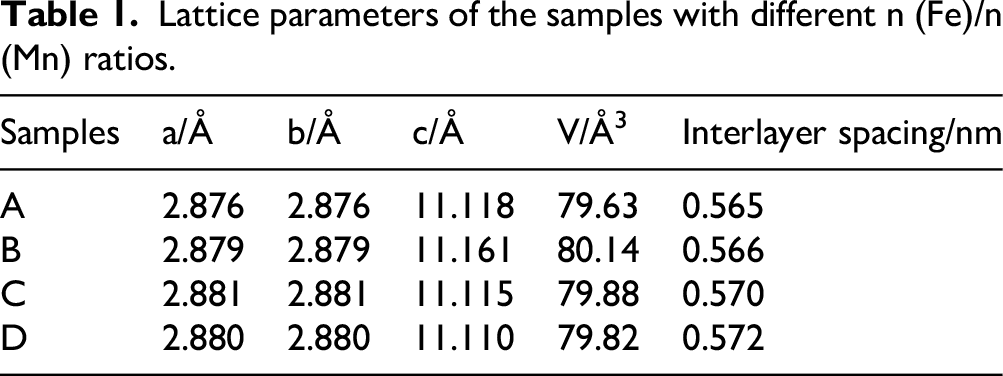
Table 1 lists the lattice parameters of the four materials calculated using software Jade 6. As the Fe doping mount increases, lattice parameter c and volume V of cathode materials initially increase and then decrease. Material B exhibits the maximum c and V. Fe doping reduces the repulsion between transition metals, which increases the interlayer spacing of the material. This structural change lowers the resistance to Na+ transport and enhances the Na+ transport rate during charge and discharge processes. Furthermore, with further increases in iron doping, the expansion of the Na+ interlayer spacing facilitates the insertion and extraction of Na+.
Lattice parameters of the samples with different n (Fe)/n (Mn) ratios.
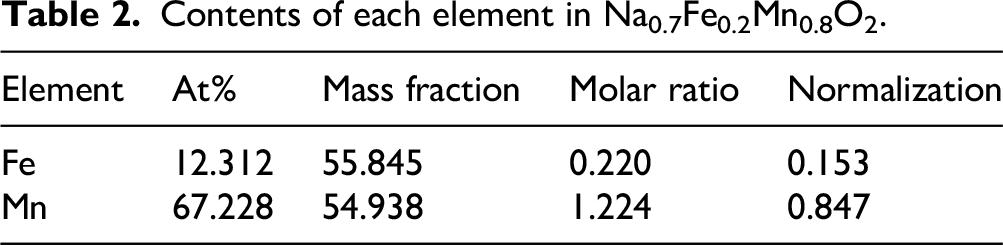
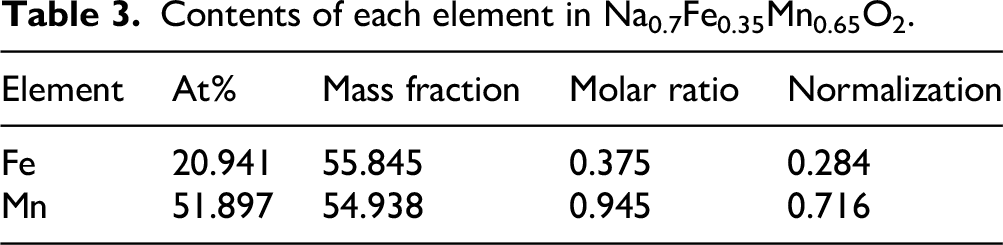
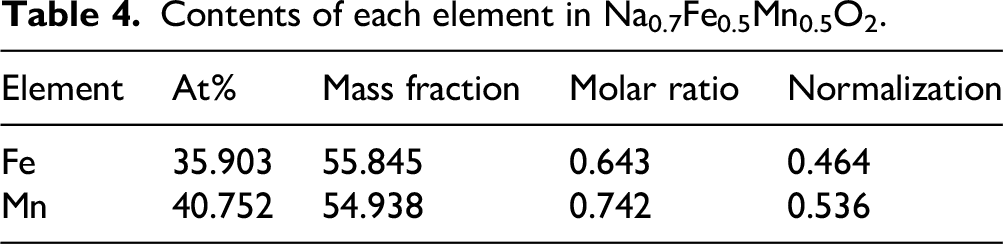
X-ray fluorescence (XRF) spectroscopy tests were performed on samples Na0.7Fe0.2Mn0.8O2, Na0.7Fe0.35Mn0.65O2, and Na0.7Fe0.5Mn0.5O2 calcined at 1000 °C to verify whether the doping amounts align with the design targets. Table 2 list the contents of Fe and Mn in the samples. Test results are consistent with the design targets after normalization, indicating that the doping ratios meet the expected specifications (Tables 3 and 4).
Contents of each element in Na0.7Fe0.2Mn0.8O2.
Contents of each element in Na0.7Fe0.35Mn0.65O2.
Contents of each element in Na0.7Fe0.5Mn0.5O2.
Scanning electron microscopy (SEM) tests were conducted to determine the morphology of samples A, B, C, and D (Figure 2).
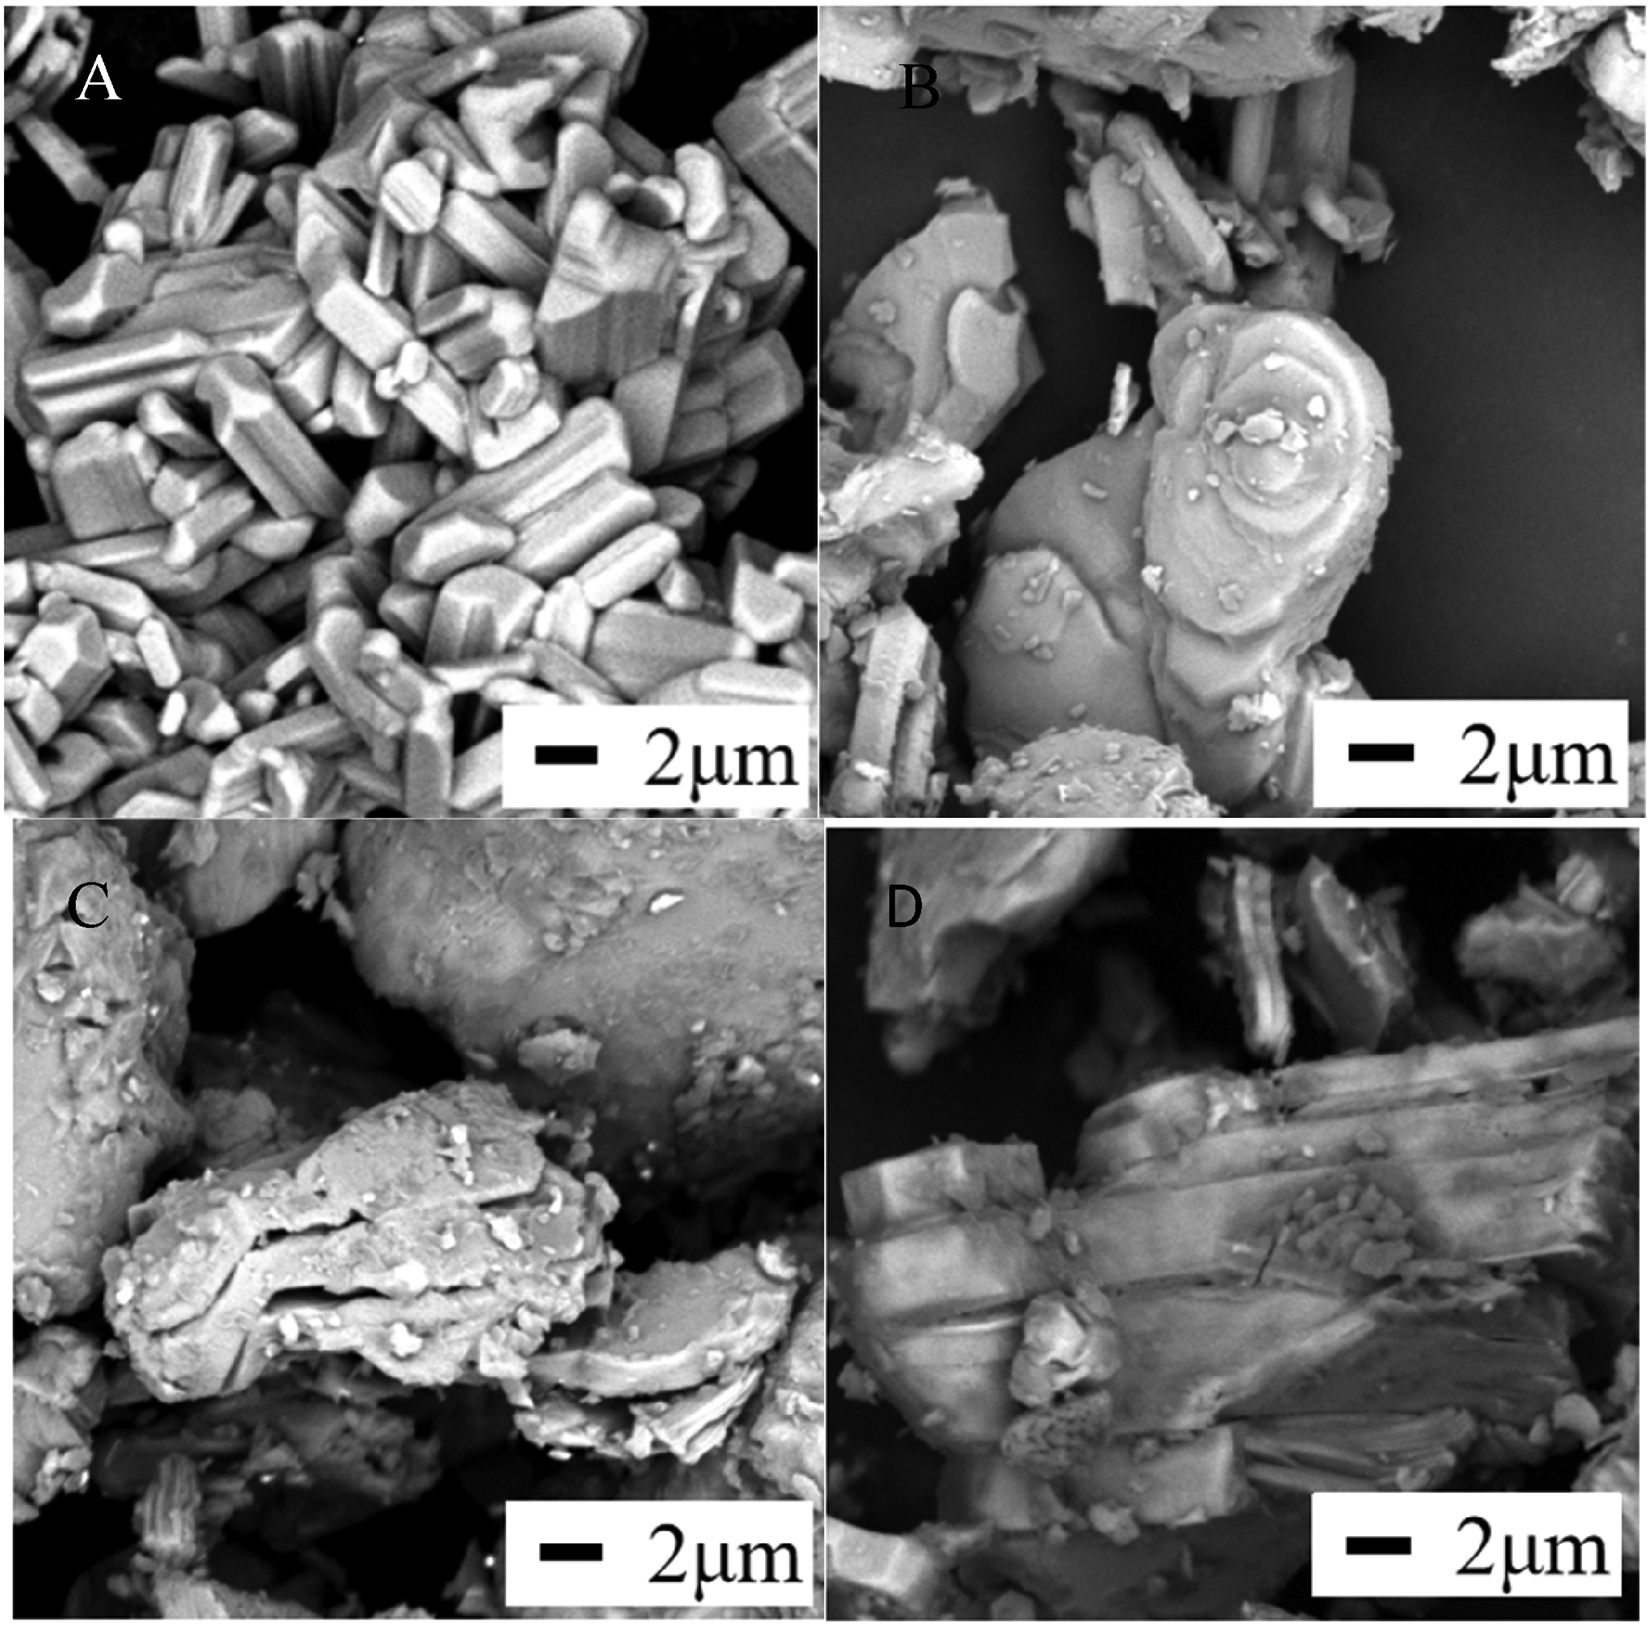
SEM of samples with different n (Fe) / n (Mn) ratios (A: 0 : 1; B: 0.2 : 0.8; C : 0.35 : 0.65; D: 0.5 : 0.5).
SEM images of samples A,B,C and D show mere difference of the prepared materials(Figure 2), the particle size of the prepared samples is around 3–6 μm with typical layered structure, and it demonstrates that a small amount of Fe doping has no significant effect on the morphology of the material. But the particle size of the materials gradually increases. The observed particle coarsening can be explained by the dual role of Fe doping. It not only stabilizes the P2-phase layered structure and expands the c-axis parameter—thus providing a thermodynamic driving force for particle growth—but also, through the substitution of Fe3+ (t₂g3 eg2) for Jahn-Teller active Mn3+ (t₂g3 eg1), mitigates lattice distortion, which favors the formation of more regular and larger particles during synthesis. 25
Effect of n(Fe)/n(Mn) on the electrochemical performance of NFMO
Comprehensive electrochemical performance tests were performed on half-cells assembled from materials A, B, C, and D to investigate the influence of the doping ratio of metal ions on the material properties. The tests included cycle performance, rate performance, charge-discharge curves, and cyclic voltammetry.
Figure 3 displays the electrochemical test results of materials A, B, C, and D at 1.8–4.3 V with a current density of 1 C. Figure 3(a) illustrates the charge-discharge curves of these materials during the first cycle, reflecting their electrochemical behavior during the initial charge-discharge process. Figure 3(b) presents the long-term cycling performance of these materials after 100 cycles, revealing their stability during repeated charge-discharge processes.
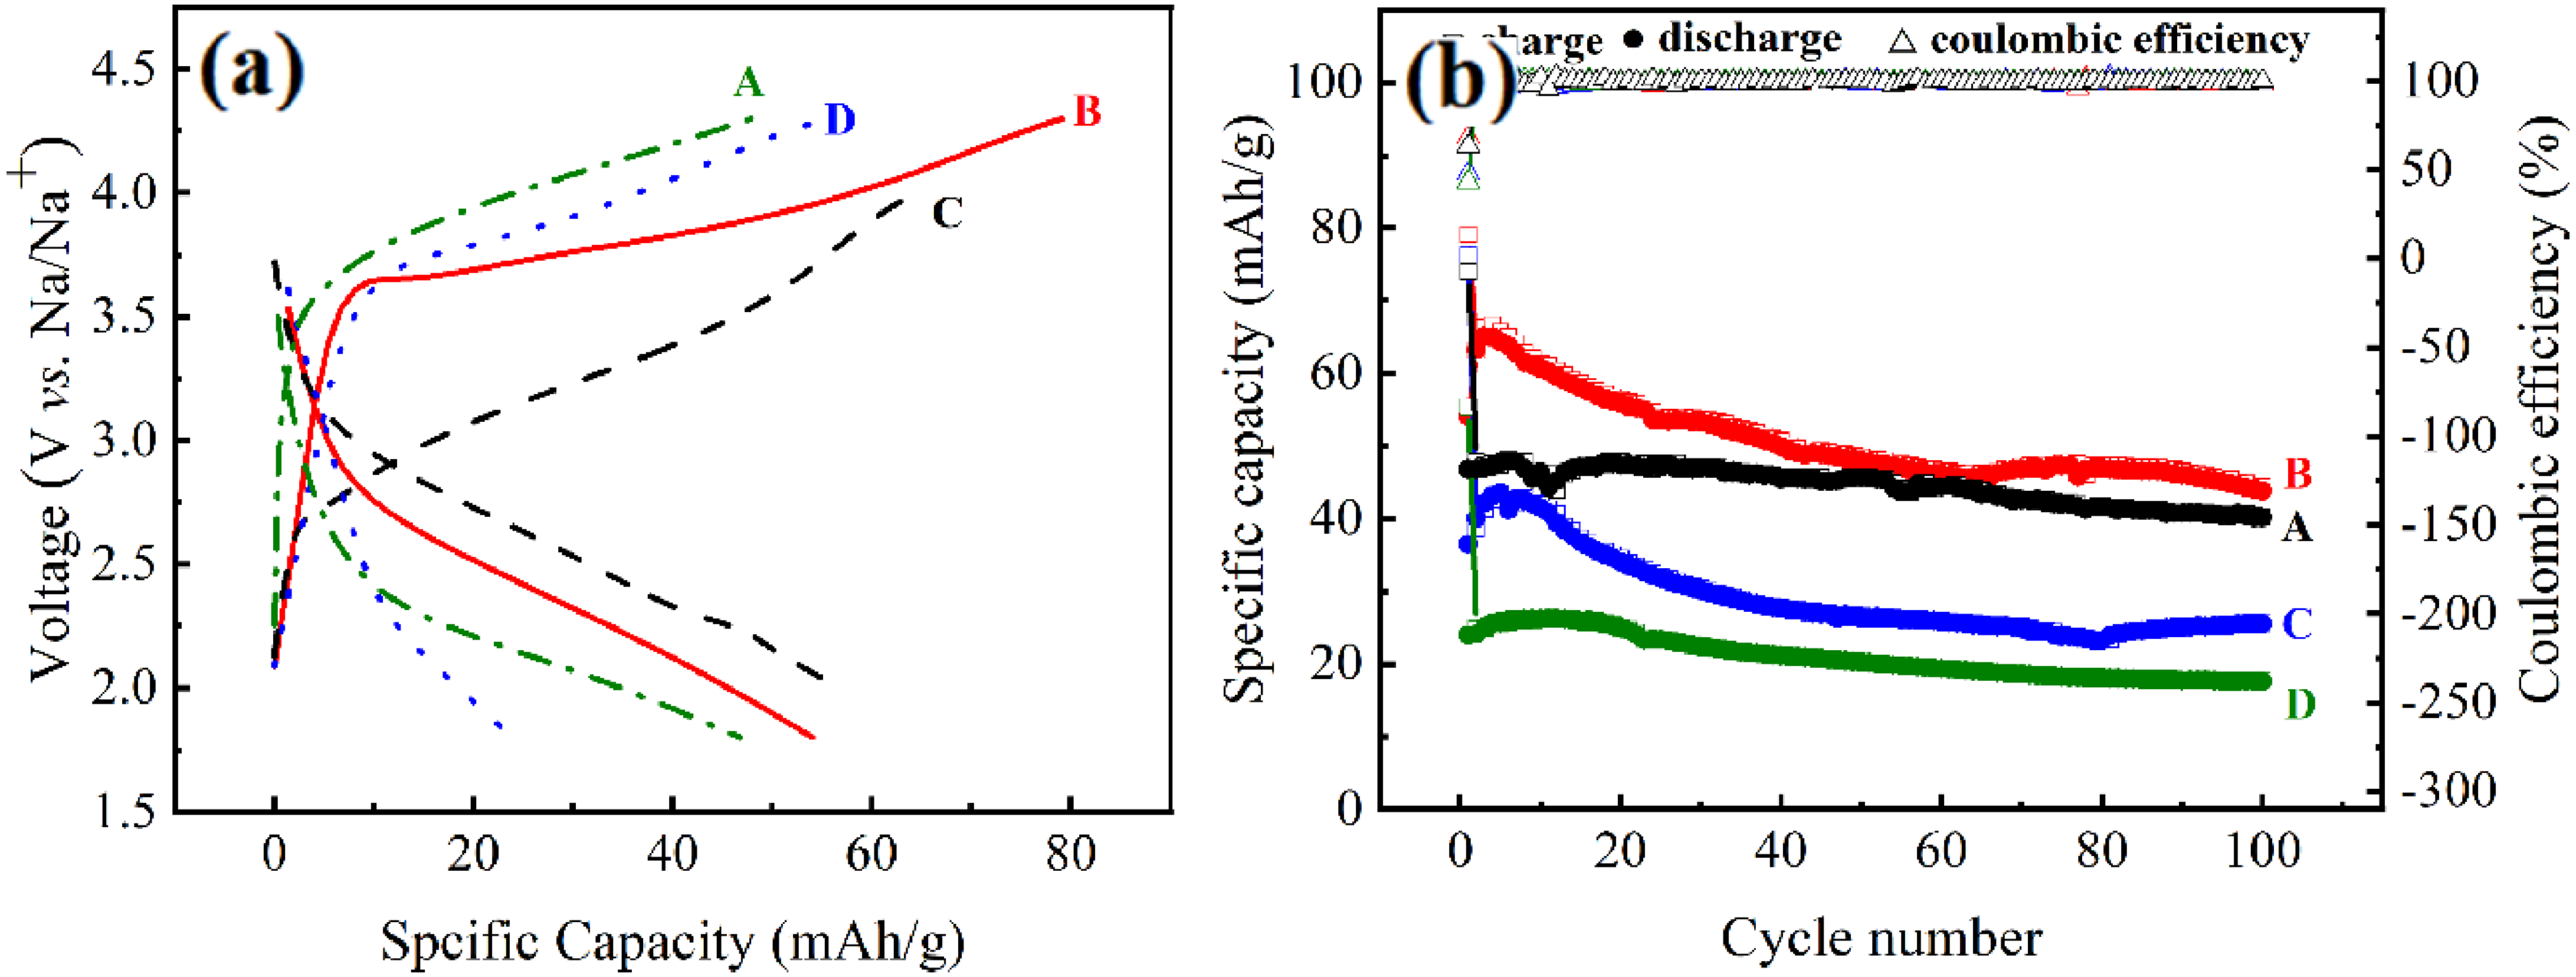
(a) charge and discharge curves and (b) long cycles of samples with different n (Fe) / n (Mn) ratios (A : 0 : 1; B : 0.2 : 0.8; C : 0.35 : 0.65; D : 0.5 : 0.5).
Charge-discharge curves of the four samples exhibit an inclined voltage platform (Figure 3 (a)). The specific capacity of the materials exhibits a non-monotonic dependence on the Fe doping content, initially increasing and then decreasing. This indicates that an optimal doping level enhances the capacity, whereas excessive doping leads to performance degradation.
As shown in Figure 3(b), Materials A-D delivered initial charge/discharge specific capacities of 47.86/46.78, 79.10/54.06, 76.26/34.49, and 55.34/24.02 mAh/g, respectively. After 100 cycles, their respective capacities were 40.51/40.36, 44.39/43.80, 25.57/24.48, and 17.63/17.62 mAh/g, corresponding to capacity retention rates of 86.28%, 81.02%, 70.98%, and 73.36%. Notably, the charge-discharge curves of all four materials nearly overlapped from the second cycle onward, with Coulombic efficiency approaching 100%, indicating excellent cycling stability.In summary, as the Fe doping amount increases, the charge-discharge specific capacities and capacity retention rates of the materials initially rise and then decline. Material B exhibits the most outstanding specific capacity. An appropriate amount of metal ion doping can significantly enhance the material's capacity. However, excessive doping may lead to insufficient structural stability due to the Jahn-Teller effect, which affects the cycling performance.
Figure 4 compares the impacts of different metal ion doping ratios on the rate capabilities of the materials. The rate capabilities of materials A, B, C, and D are tested under a voltage range of 1.8-4.3 V and current densities of 0.2, 0.5, 1, and 2 C, with each material cycled for 5 cycles at each rate.
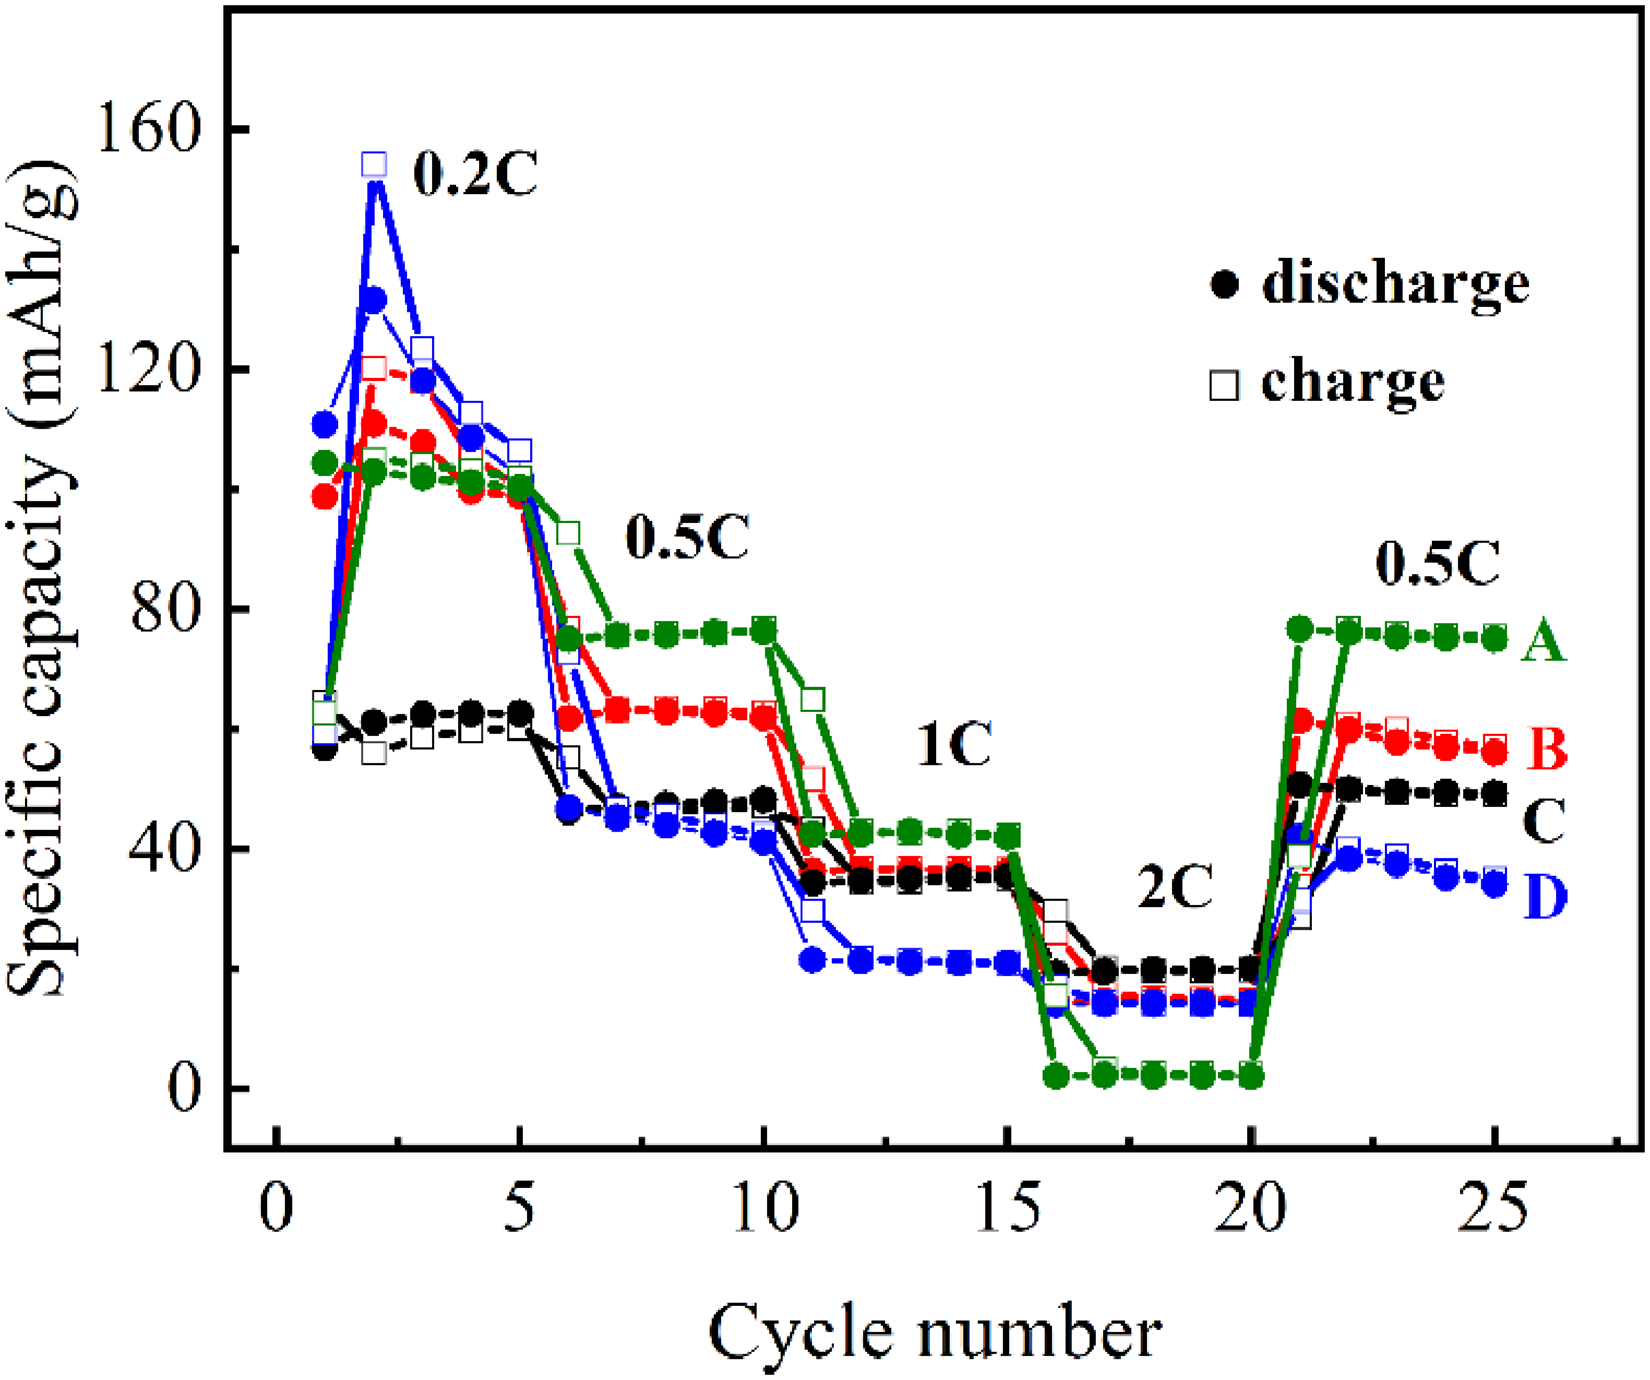
Fold performance of samples with different n (Fe) / n (Mn) ratios (A : 0 : 1; B : 0.2 : 0.8; C : 0.35 : 0.65; D : 0.5 : 0.5).
At a current density of 0.2 C, the capacities of materials A, B, C, and D are approximately 103, 120, 63, and 130 mAh/g, respectively. At 0.5 C, the capacities are about 75, 63, 49, and 45 mAh/g, respectively. The capacities of the materials at 0.5 C can still be maintained at approximately 75, 60, 50, and 39 mAh/g after undergoing high-rate charging at 1 C and 2 C, respectively. The increase in Na+ diffusion resistance at high-rate currents reduces material capacity. However, the impact of current rate changes on material performance is relatively minor at high current densities. The materials retain good stability and reversibility even after being subjected to high currents. Compared to material A, material B exhibits superior charge-discharge capacity at 0.2 and 2 C. In comparison to material C, material B demonstrates more outstanding performance across various current rates. Relative to material D, material B shows better charge-discharge capacity at high rates.
Cyclic voltammetry (CV) measurements were performed on the four samples over a voltage range of 1.5-4.3 V at a scan rate of 2 mV/s (Figure 5). All samples exhibited two redox peaks located at 2.2-2.7 V and 3.5-4.0 V, corresponding to the Mn3+/Mn4+ and Fe2+/Fe3+ redox couples, respectively. Overall, the redox peaks were broad and poorly defined, indicating significant polarization, which is consistent with previous reports in the literature.
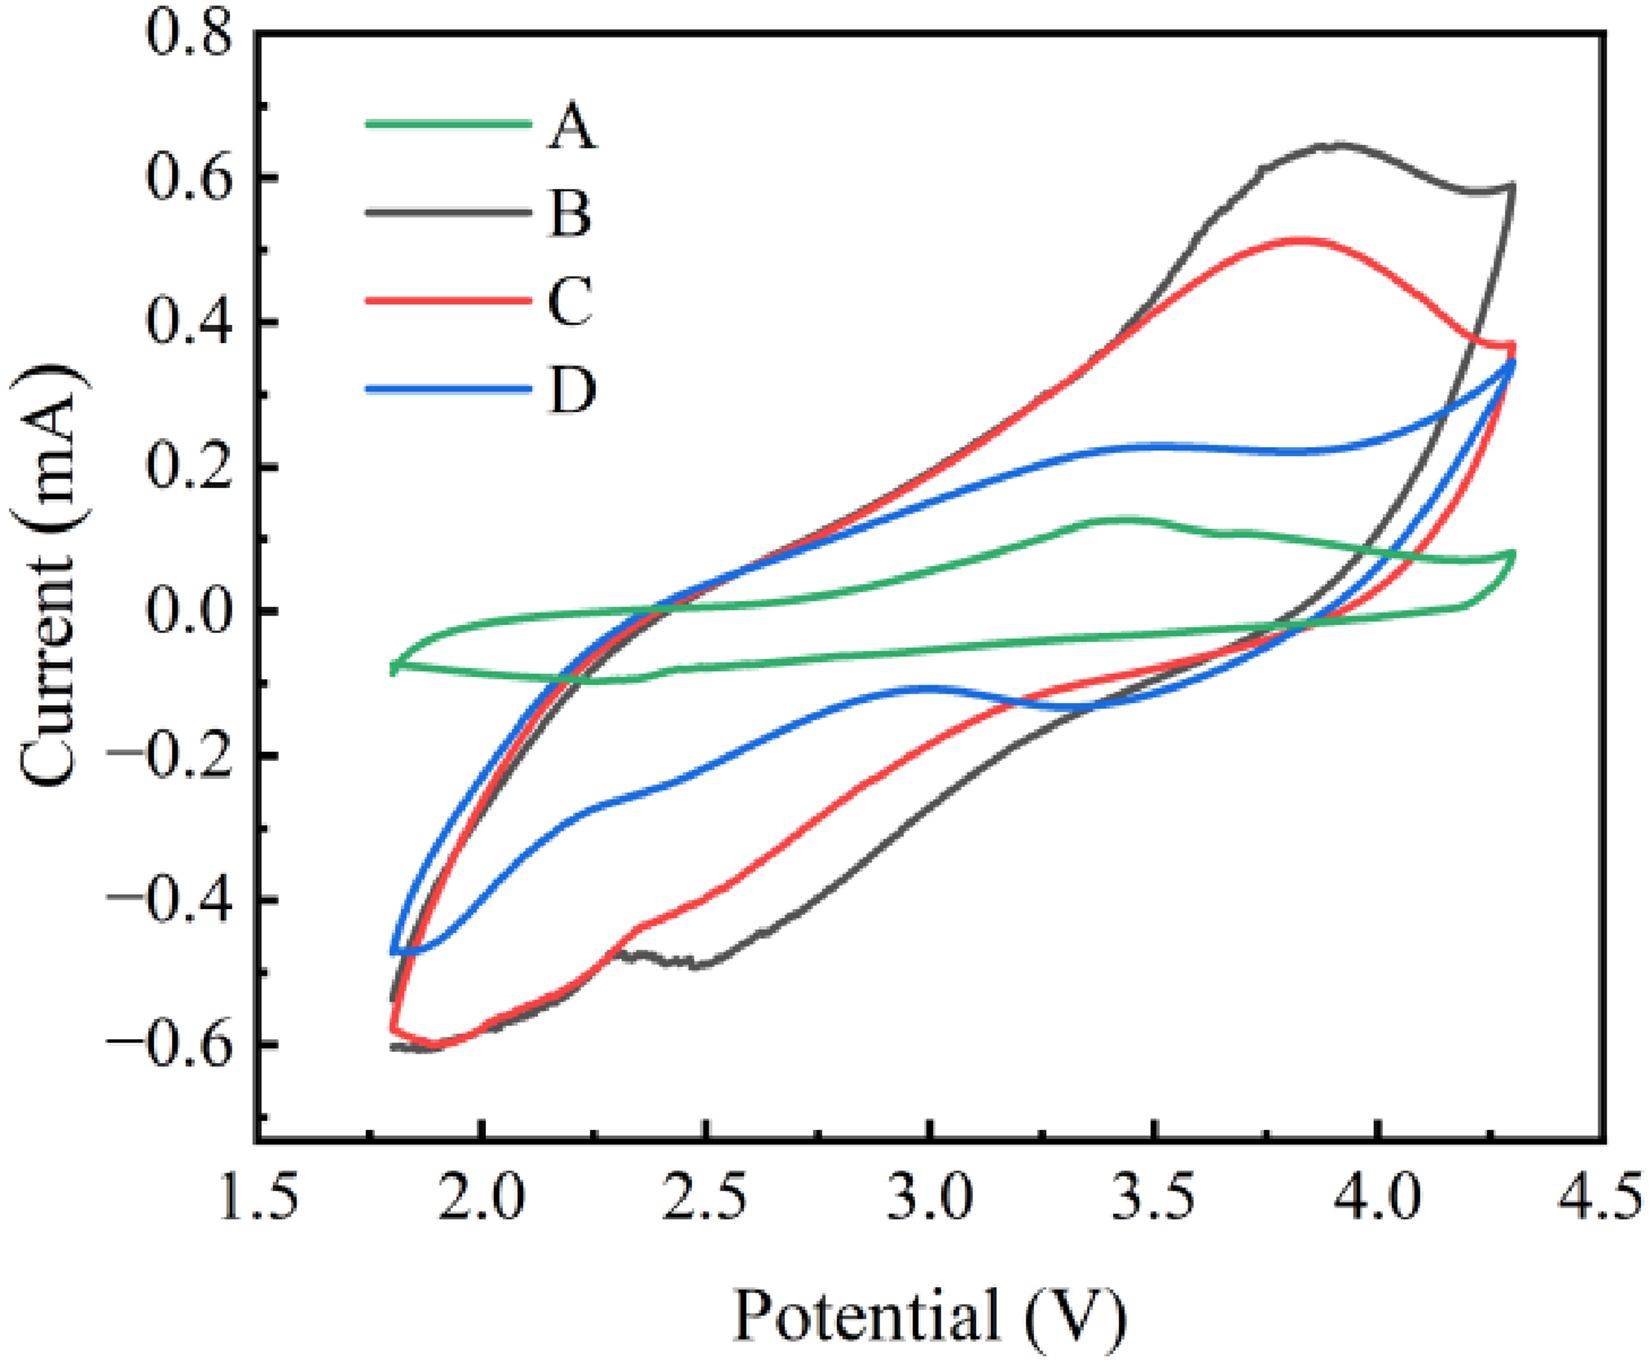
Cyclic voltammetry curves for samples with different n (Fe) / n (Mn) ratios (A : 0 : 1; B : 0.2 : 0.8; C : 0.35 : 0.65; D : 0.5 : 0.5).
Effect of calcination temperature on the crystal structure and morphology of NFMO
X-ray diffraction (XRD) analysis was performed on Na0.7Fe0.2Mn0.8O2 cathode materials with the optimal Fe doping ratio(0.2:0.8) for electrochemical performance, which determined the influence of calcination temperature on the crystal structure and morphology of the materials. These materials were calcined at 800, 900, and 1000 °C for 10 h.
XRD of the samples with varying calcination temperatures are shown in Figure 6. From the XRD results, it can be seen that all the materials match the standard card (PDF#27-0751) of the P2-type structure,space group P63/mmc well. Additionally, there are some minor diffraction peaks, indicating the presence of NaMnO2.
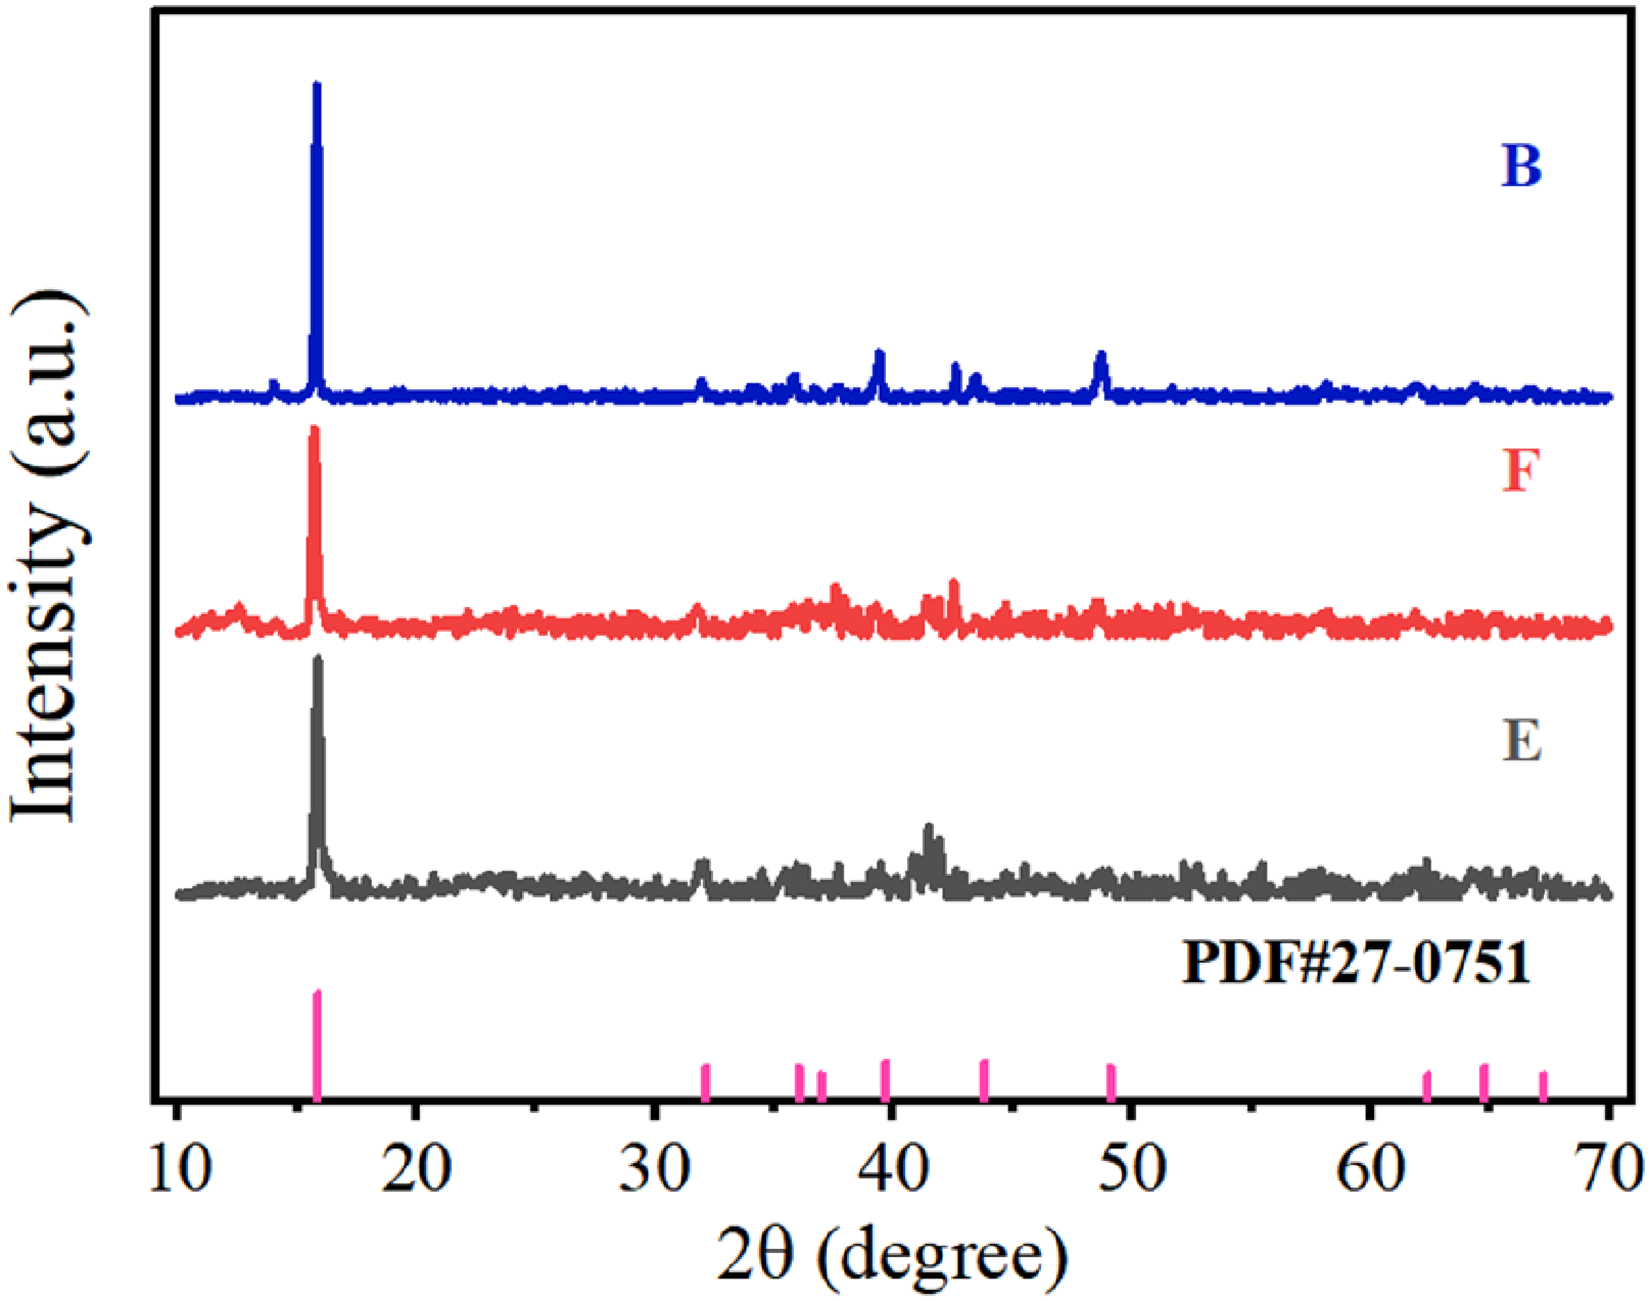
XRD spectra of the samples at different calcination temperatures (E: 800 °C; F: 900 °C; B: 1000 °C).
From the lattice parameters calculated using software Jade 6 (Table 5), lattice parameters a and b of the materials initially increase and then decrease as the calcination temperature rises. Concurrently, the material volume and Na+ interlayer spacing follow a similar trend, increasing and then decreasing with the elevation of calcination temperature. When the calcination temperature reaches 900 °C, the material volume and Na+ interlayer spacing attain their maximum values. This phenomenon may contribute to the structural stability. More favorable conditions are provided for the insertion and extraction of Na+, which enhances the charge-discharge specific capacities of the materials.
Lattice parameters of the samples at different calcination temperatures.
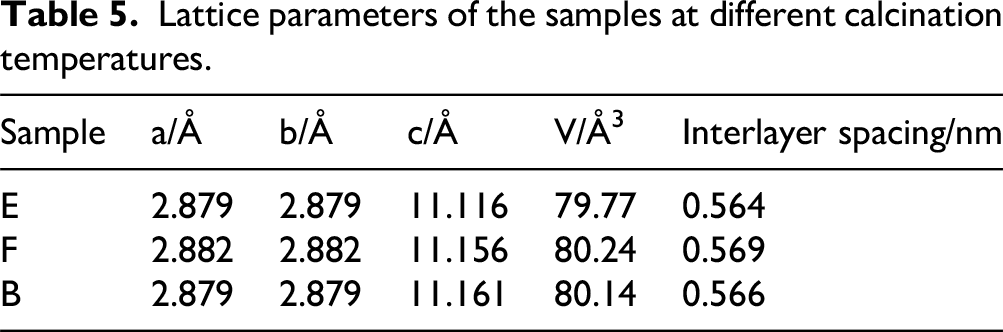
Figure 7 displays the SEM images of Na0.7Fe0.2Mn0.8O2 cathode materials prepared under calcination temperatures of 800, 900, and 1000 °C for 10 h. SEM observations reveal that the particle size of the prepared samples is around 4–6 μm with typical layered structure, and it demonstrates that different calcination temperatures has no significant effect on the morphology of the material.
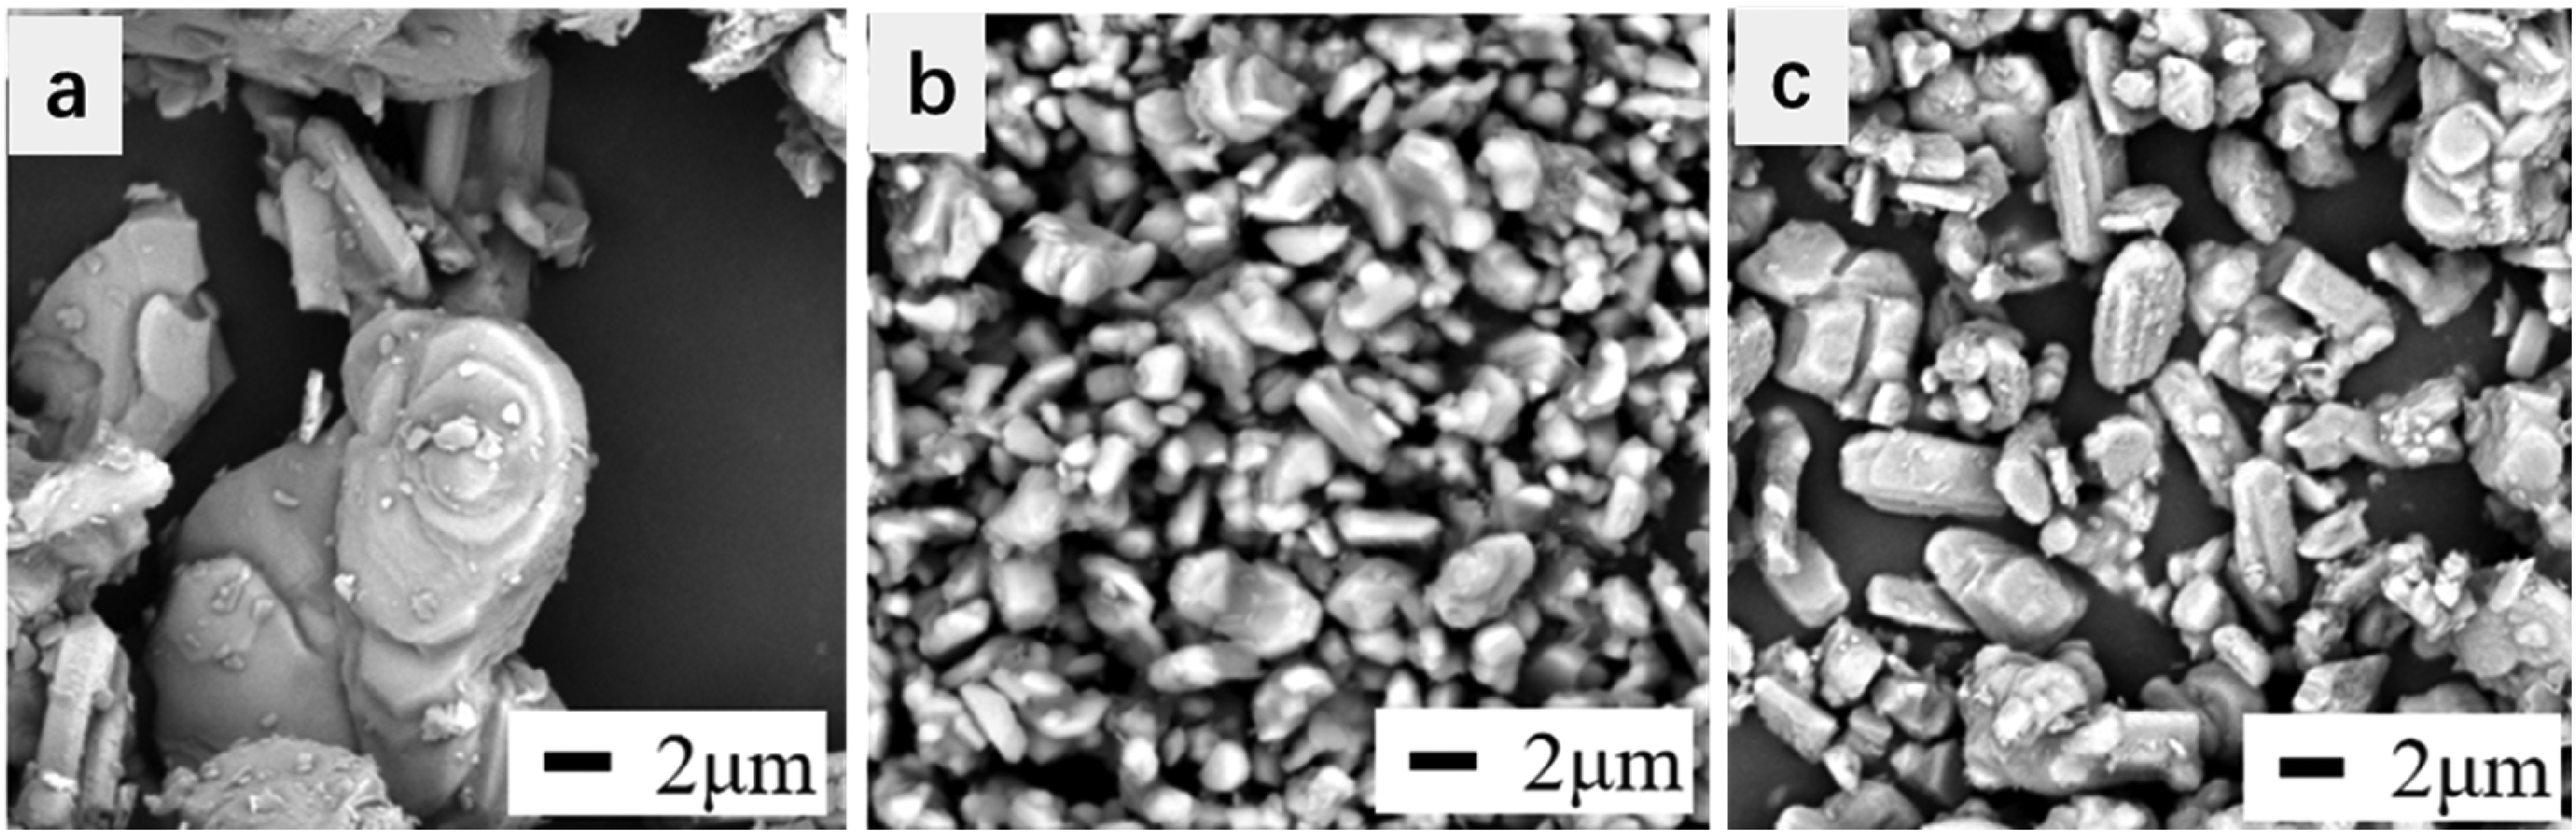
SEM of samples at different calcination temperatures (a: 800 °C; b: 900 °C; c: 1000 °C).
The microstructure and morphology of the materials are thoroughly examined through XRD and SEM analyses, confirming the successful distribution of Fe within the NaMnO2 lattice. X-ray photoelectron spectroscopy (XPS) analysis was conducted on the Fe-doped materials to further investigate the existence forms and chemical bonding states of the elements in the material. The XPS spectra of Mn and Fe are fitted to determine the valence states of each element.
Analysis of the XPS spectra (as shown in Figure 8) identifies Mn characteristic peaks near 643.6 eV and 654.8 eV, corresponding to Mn 2p₃/₂ and Mn 2p₁/₂, respectively. Spectral fitting further resolves these peaks into two components, corresponding to Mn4+ and Mn3+ with a relative distribution of 70.86% and 29.14%, confirming that Mn is primarily in the +4 valence state. The substitution by Fe2+ for part of Mn4+ effectively suppresses the Jahn-Teller distortion, which contributes to the improved specific capacity observed during cycling.
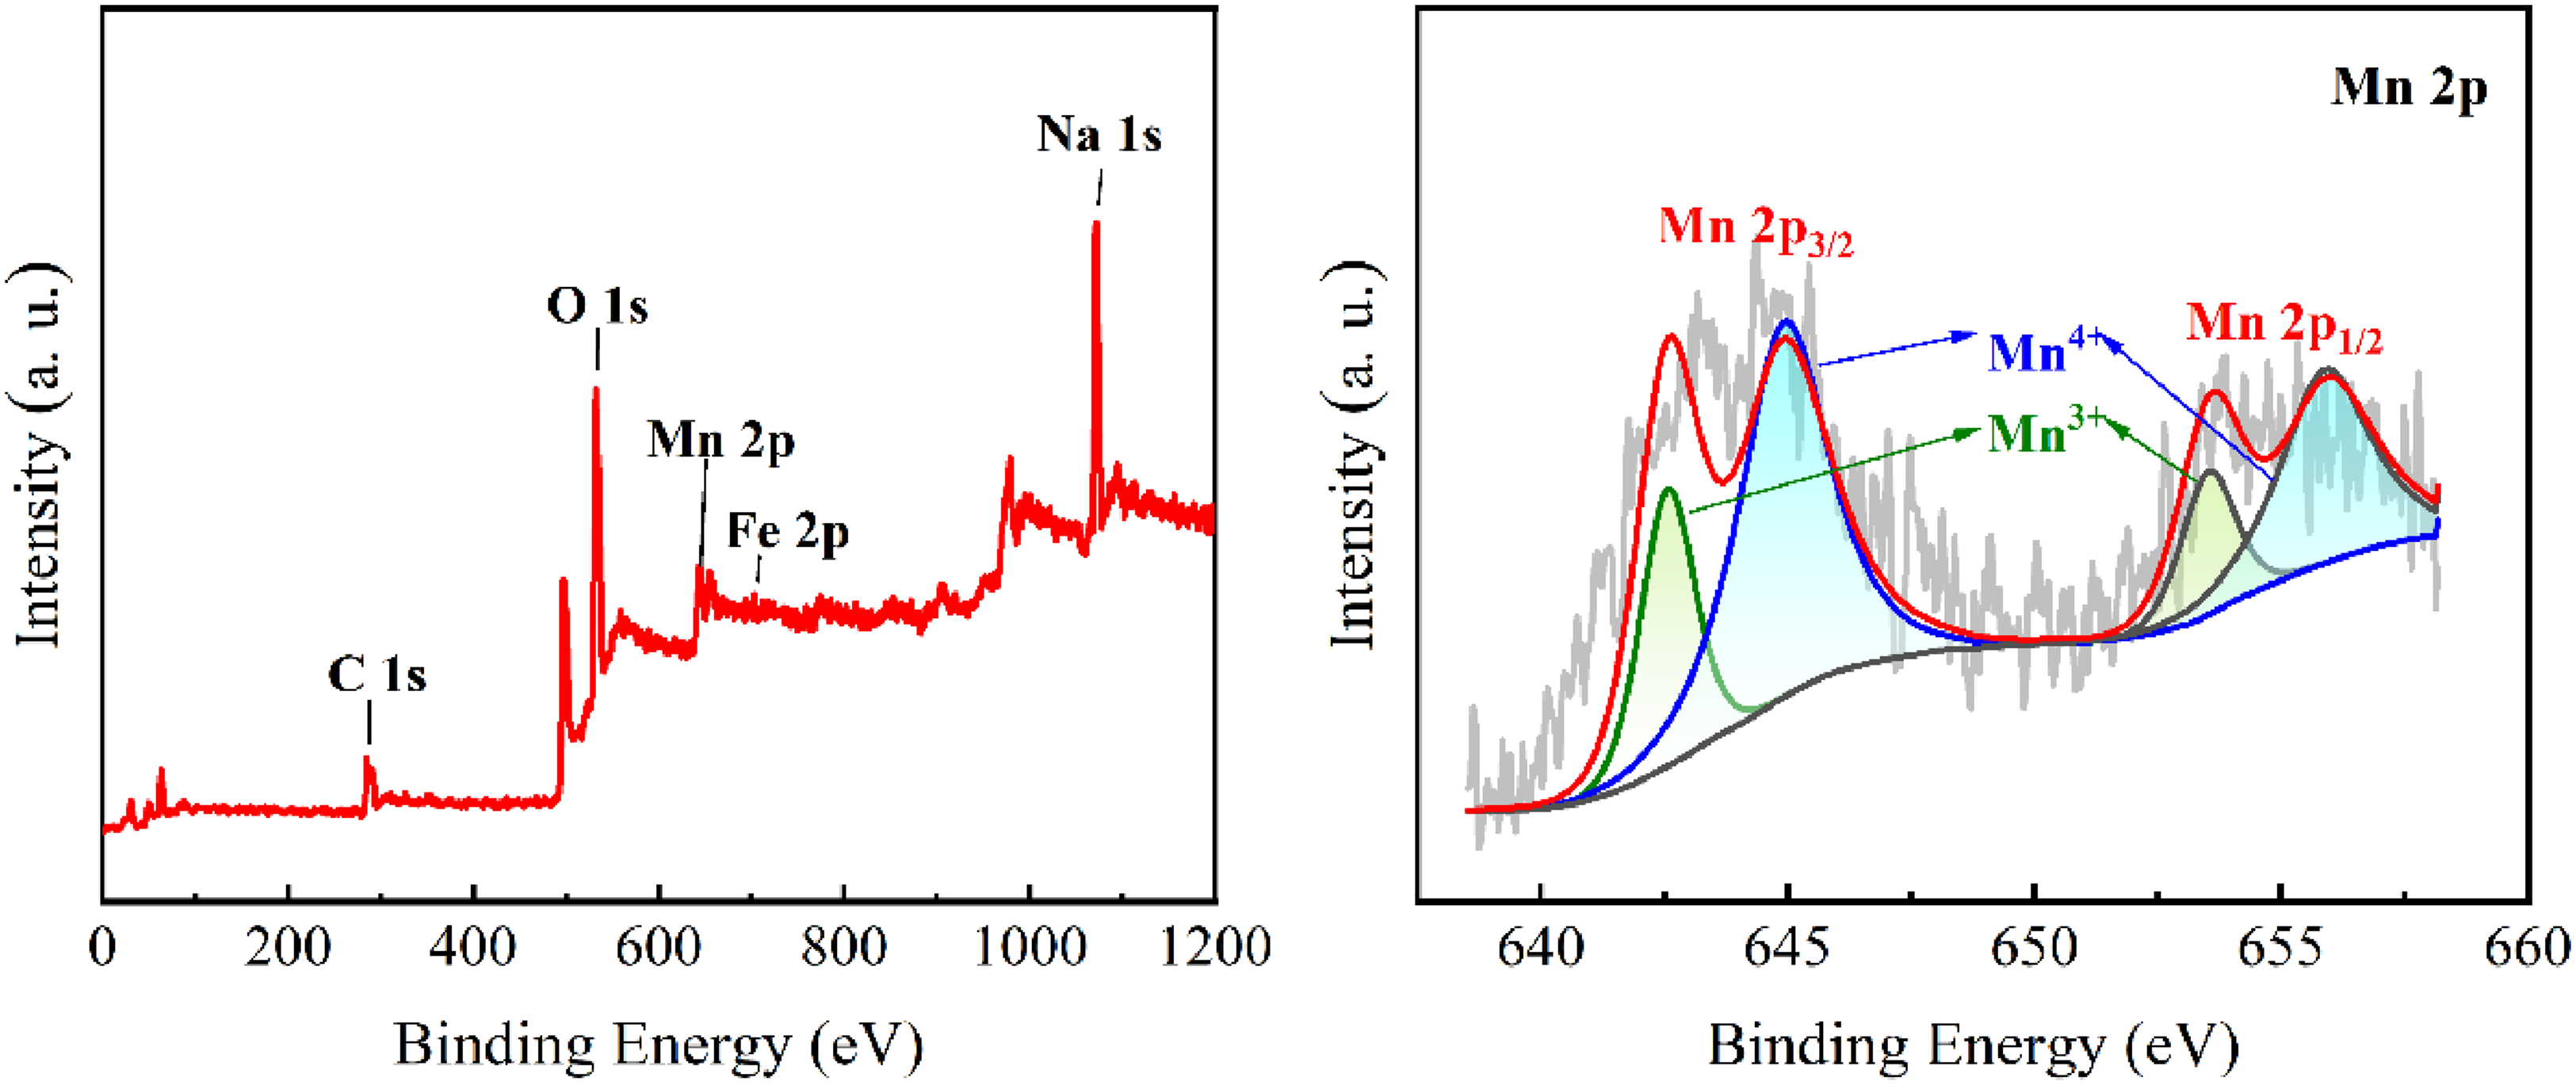
XPS spectra of sample F.
Effect of calcination temperature on the electrochemical performance of NFMO
The cyclic performance, rate capability, charge-discharge, and cyclic voltammetry of three materials were tested to determine the impact of calcination temperature on the electrochemical performance of the materials (Figure 9).
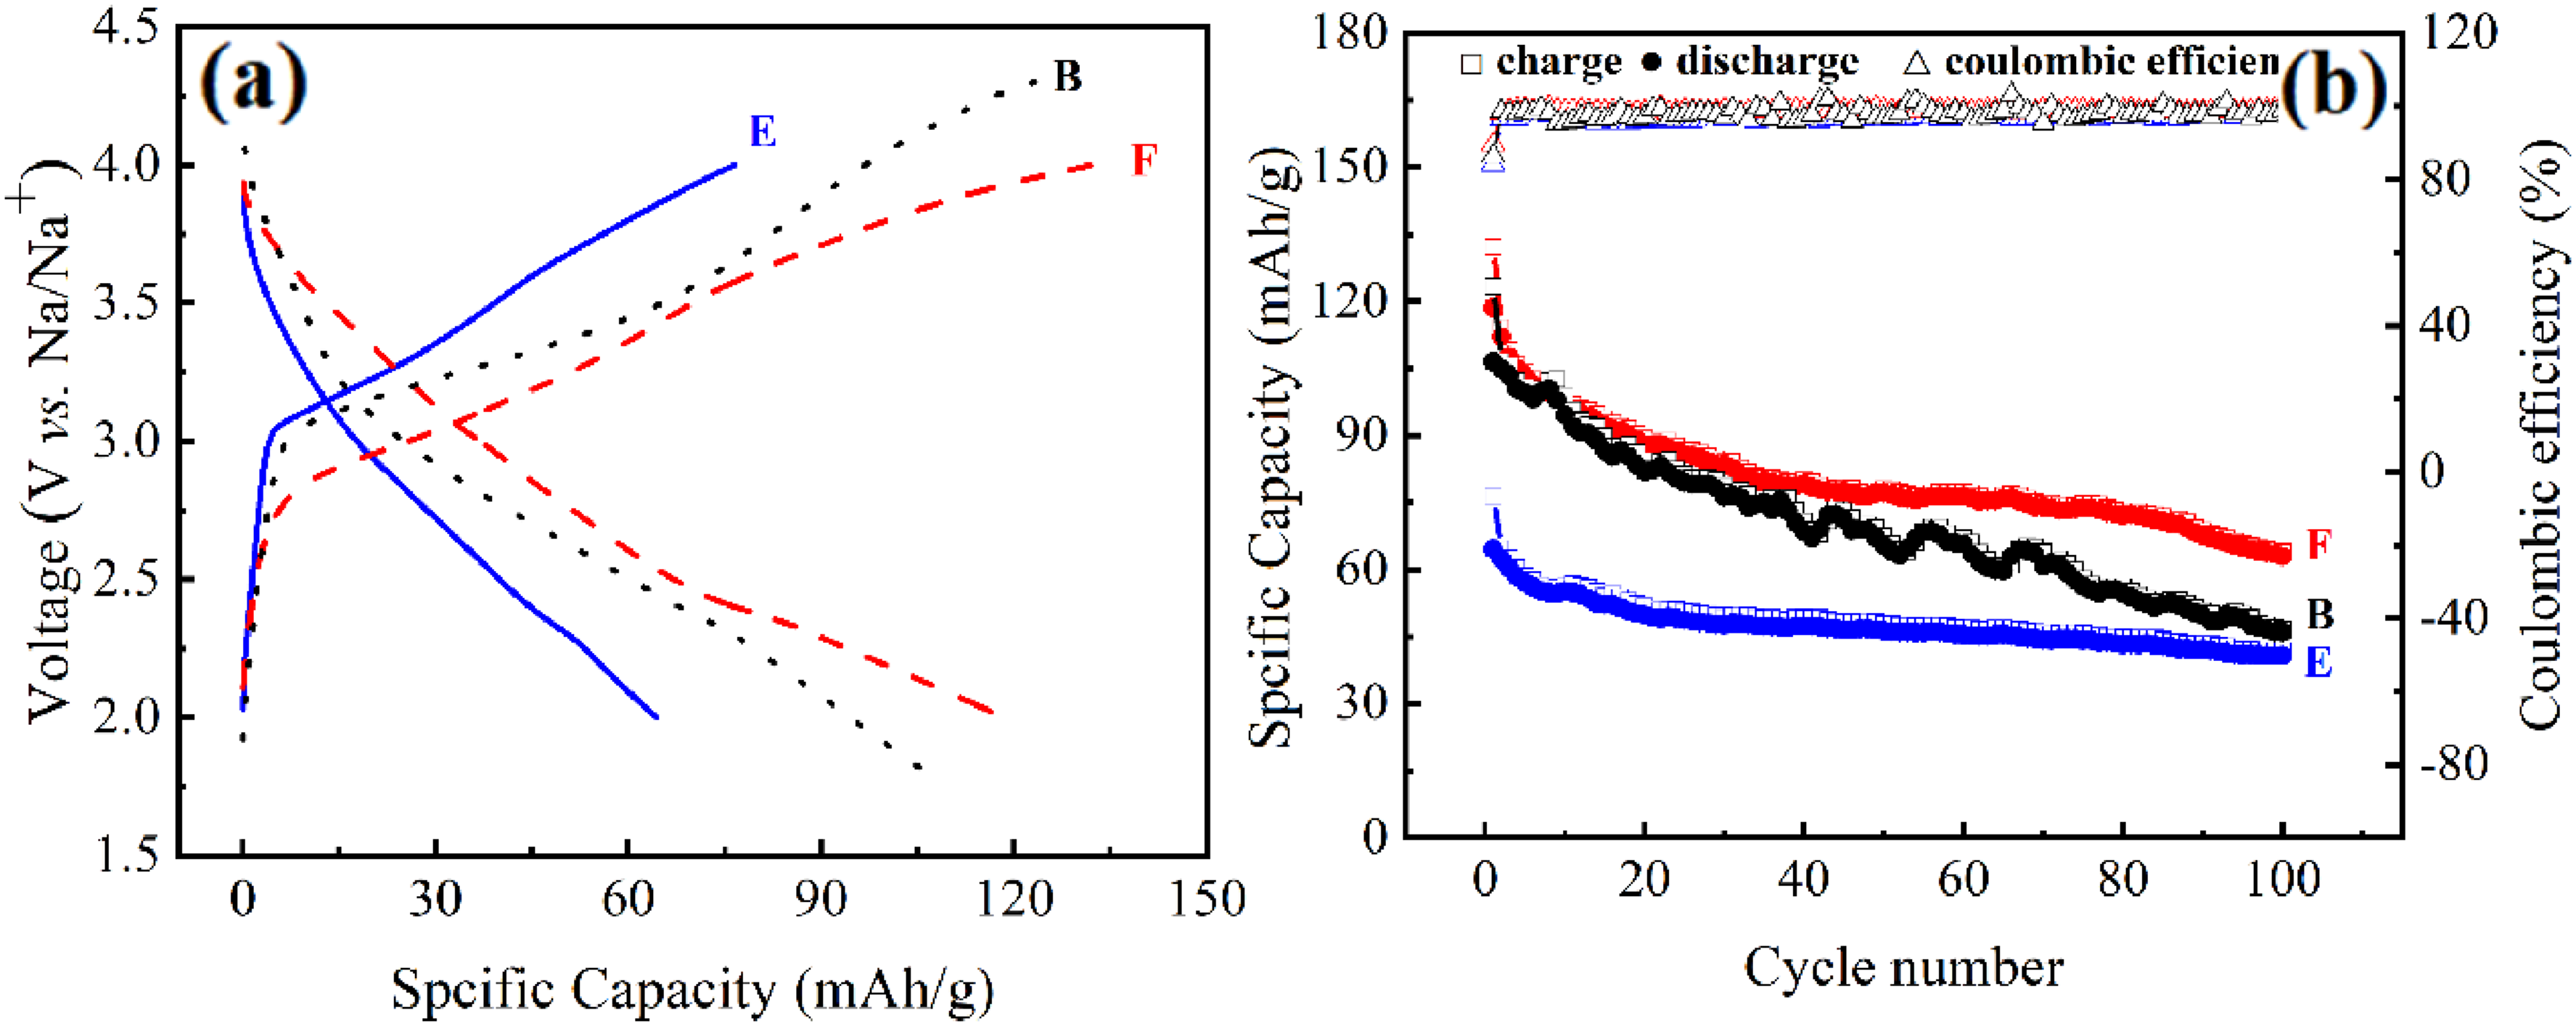
(a) Charge and discharge curves and (b) long cycles of samples at different calcination temperatures (E: 800 °C; F: 900 °C; B: 1000 °C).
Figure 9 compares the effects of different calcination temperatures on the charge-discharge performance and cycling performance of the materials. Figure 9 (a) displays the charge-discharge curves of materials E and F (at 2-4 V) and material B (at 1.8-4.3 V) during the first cycle at a current density of 0.2 C. The long-term cycling performance over 100 cycles is shown in Figure 9(b). As depicted in Figure 9(a), the charge-discharge curves of materials E, F, and B feature inclined voltage platforms, the slope of which decreases with increasing calcination temperature. Correspondingly, the specific capacity exhibits a non-monotonic dependence on temperature, initially decreasing and then increasing, with the optimal performance achieved at 900 °C. Figure 9 (b) shows that the initial charge-discharge specific capacities of material E are 76.56 and 64.41 mAh/g, respectively. They are 41.75 and 40.74 mAh/g after 100 cycles, with a capacity retention rate of 63.25%. The initial specific capacities of material F are 132.20 and 118.57 mAh/g, respectively. They are 63.77 and 62.94 mAh/g after 100 cycles, with a capacity retention rate of 53.08%. Material B shows initial specific capacities of 123.23 and 106.45 mAh/g, respectively. They are 46.41 and 45.89 mAh/g after 100 cycles, with a capacity retention rate of 43.11%. Additionally, the charge-discharge curves of the three materials almost overlap from the second cycle onward, with Coulombic efficiency close to 100%, indicating excellent stability.
Material B exhibits lower capacity retention compared to materials E and F under a larger voltage range. The initial charge-discharge specific capacity initially increases and then decreases with rising calcination temperature. Material F shows the most outstanding long-term cycling performance. The capacity of the materials decays rapidly during the first 20 cycles due to poor structural stability caused by the Jahn-Teller effect.
Figure 10 compares the rate capabilities of the materials sintered at different temperatures. Materials E and F (tested at 2-4 V) and Material B (1.8-4.3 V) were evaluated at current densities of 0.2, 0.5, 1, and 2 C for 5 cycles each. The specific capacities of Materials E, F, and B were 103, 133, and 120 mAh/g at 0.2 C; 77, 82, and 63 mAh/g at 0.5 C; and approximately 66.5, 82, and 61 mAh/g at the higher rates of 1 and 2 C, respectively. Notably, Material F maintained a capacity of 61 mAh/g even at 1 C. Increased Na+ diffusion resistance reduces capacity at higher current rates. The change in current rate has a relatively small impact on the performance of the materials; therefore, all three materials demonstrate good stability and reversibility even after high-current cycling. Compared to material E, material F exhibits superior performance at various current rates, particularly at lower currents. Besides, it shows better charge-discharge capacity than material B at higher rates.
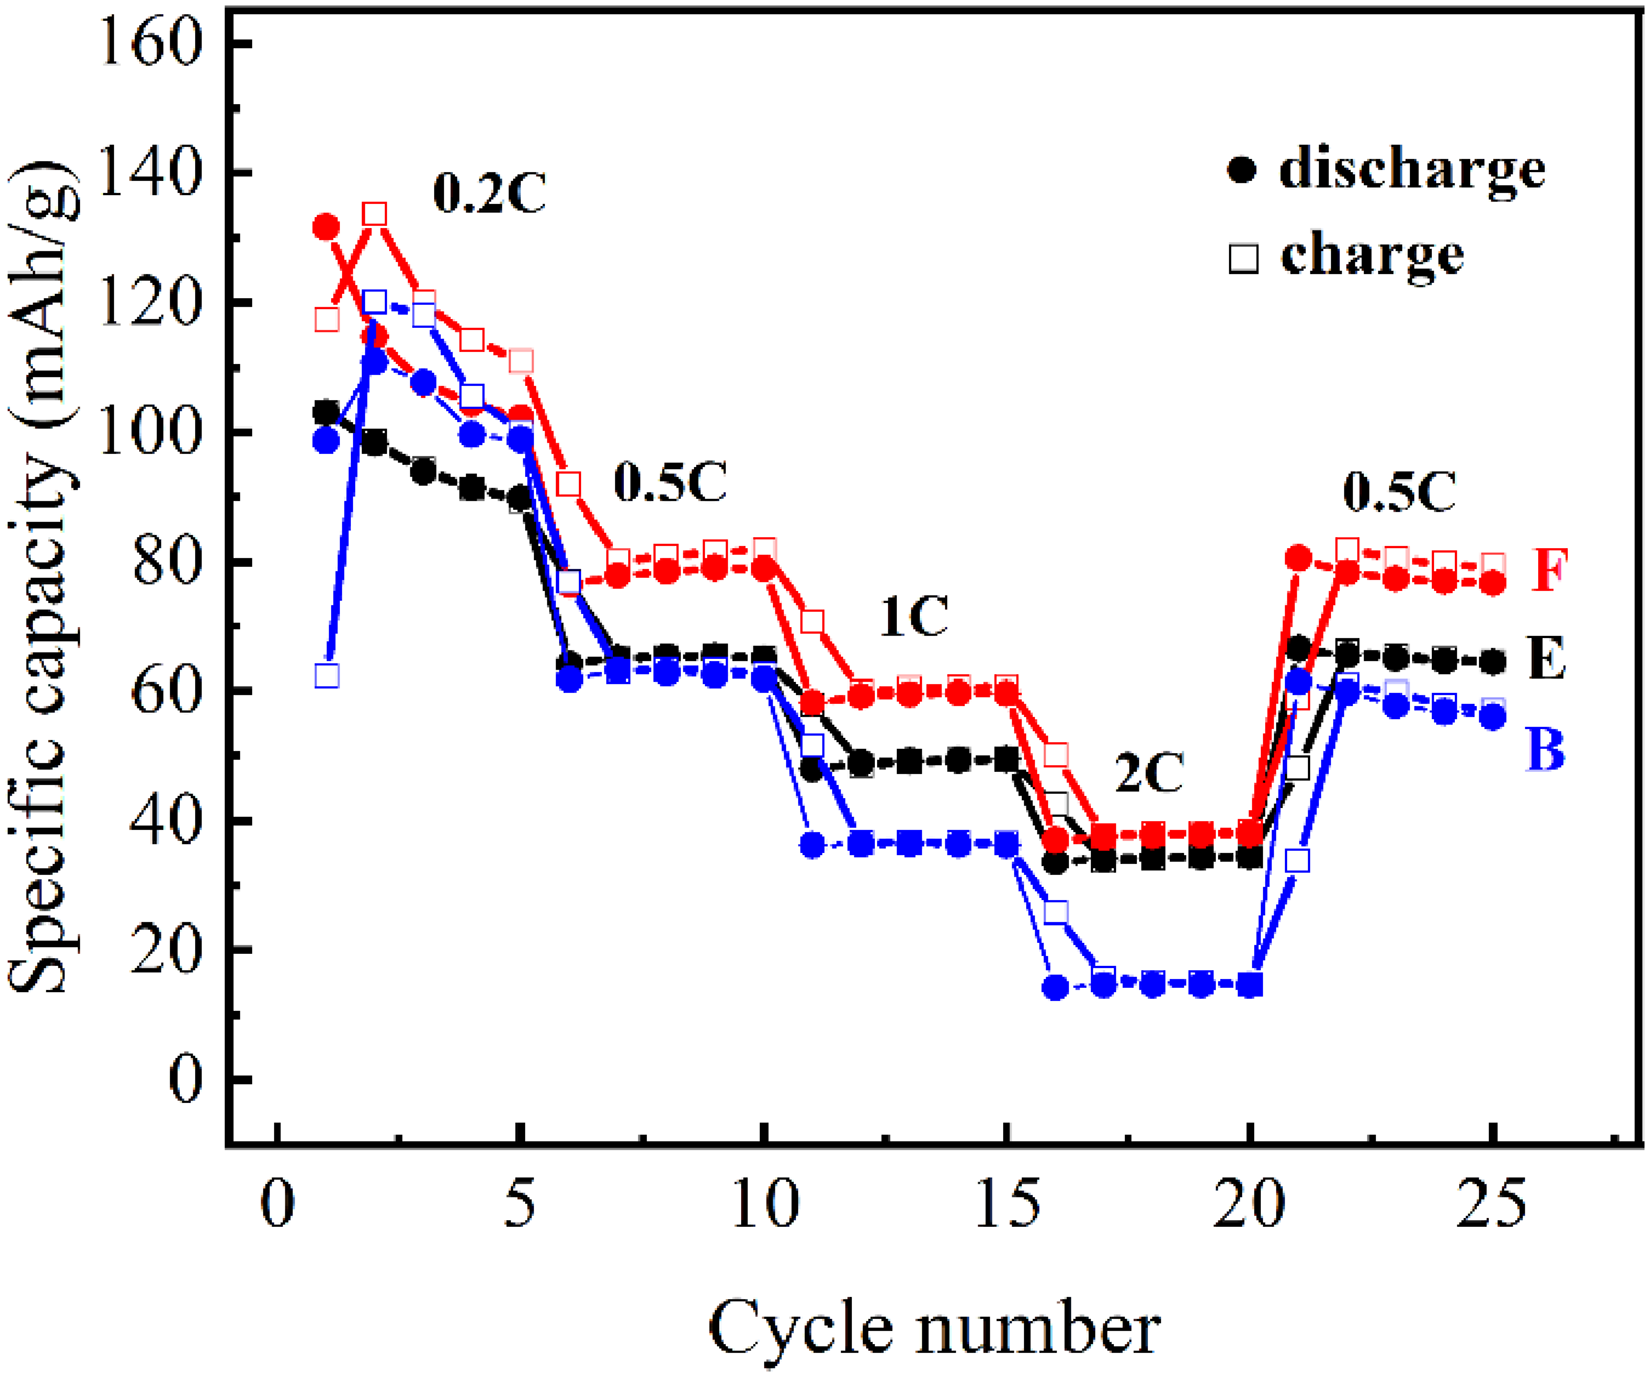
Multiplier performance of the samples at different calcination temperatures (E: 800 °C; F: 900 °C; B: 1000 °C).
Figure 11 displays the cyclic voltammetry (CV) curves of cathode materials E, F, and B at a scan rate of 2 mV/s. All samples show two distinct redox couples located at 2.2-2.7 V and 3.5-4.0 V, corresponding to the Mn3+/Mn4+ and Fe2+/Fe3+ redox reactions, respectively. This assignment is consistent with the observations from the galvanostatic charge-discharge profiles. Furthermore, the broad and poorly resolved nature of these peaks indicates considerable electrochemical polarization, which aligns with the trends discussed previously.
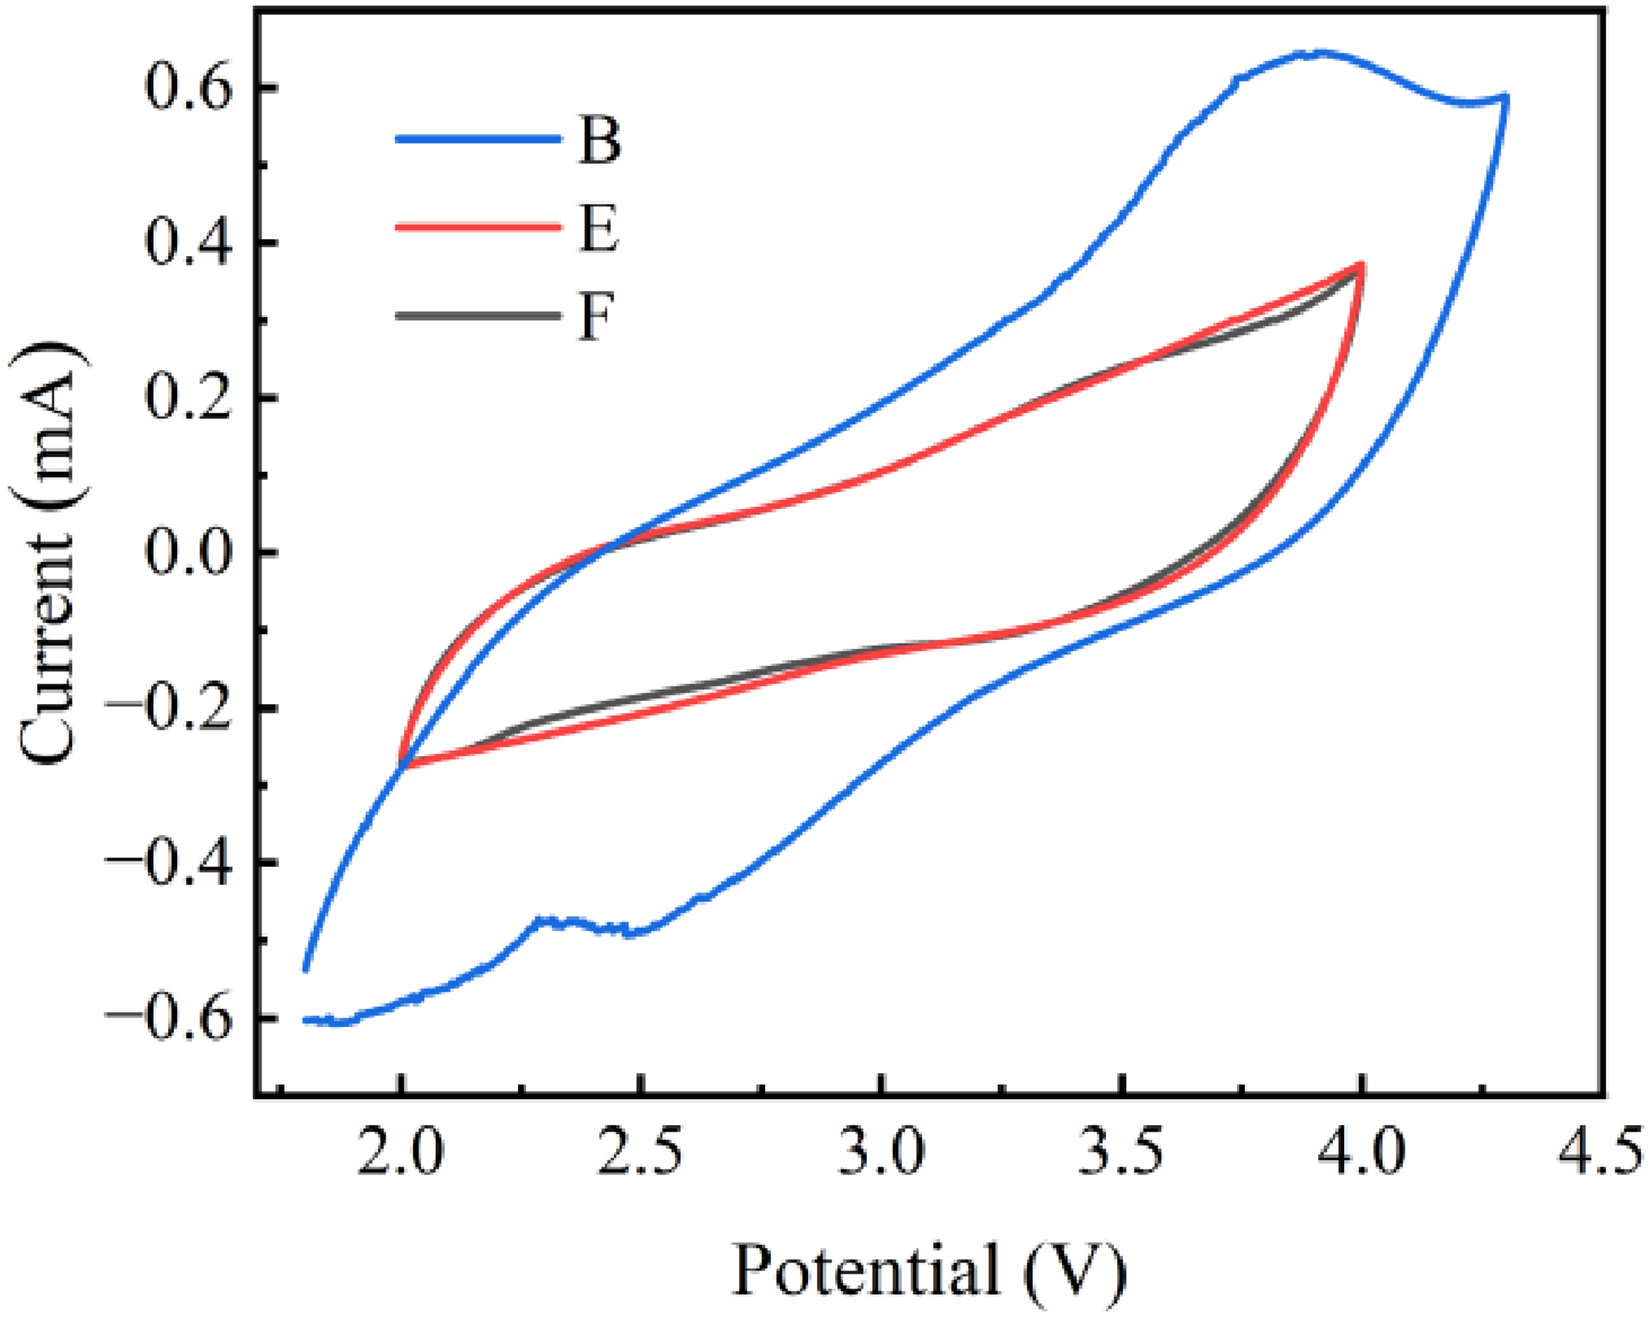
Cyclic voltammetry curves for samples with different calcination temperatures (E: 800 °C; F: 900 °C; B: 1000 °C).
Conclusion
A series of Fe-doped Mn-based sodium-ion cathode materials with Fe/Mn molar ratios of 0:1, 0.2:0.8, 0.35:0.65, and 0.5:0.5 were synthesized via high-temperature solid-state method. The composition with the optimal ratio (0.2:0.8) was subsequently calcined at temperatures ranging from 800 to 1000 °C to further investigate the effect of calcination temperature. Comprehensive characterization confirmed that both Fe doping and calcination temperature considerably boosted the electrochemical performance. Specifically, Fe doping inhibited phase transitions, expanded interlayer spacing, and stabilized the crystal structure, thereby facilitating Na + insertion/extraction and improving cycling stability. The optimal material, Na0.67Fe0.2Mn0.8O2 calcined at 900 °C, demonstrated superior performance with initial charge/discharge capacities of 132.20/118.57 mAh/g at 0.2 C and excellent rate capability.
Footnotes
Acknowledgment
This work was supported by Inner Mongolia University of Technology Undergraduate Innovation Project (Grant No. 202410128003), Inner Mongolia Natural Science Foundation (Grant No. 2023LHMS02002), The Fundamental Research Funds Project for Universities Directly Affiliated to the Autonomous Region (Grant No. ZTY2024031), The Inner Mongolia Autonomous Region Graduate Research Innovation Project (Grant No. S20231132Z), and the Fundamental Research Funds for the Directly Affiliated Universities of Inner Mongolia Autonomous Region (Grant No. JY20240031).
Author contribution(s)
Funding
The authors received no financial support for the research, authorship, and/or publication of this article.
Declaration of conflicting interests
The authors declared no potential conflicts of interest with respect to the research, authorship, and/ or publication of this article.